2. Results and Discussion
Continuing our investigations on the interactions of biologically-important azahetarenes with the environment, we focused our attention on losartan potassium salt. The present study deals,
inter alia, with simulation of the
1H-NMR spectrum of losartan in its anion form (
1 given in
Figure 1).
Figure 1.
Structure of possible isomers of the losartan anion (1): antiperiplanar conformation (anti) and synperiplanar conformation (syn).
Figure 1.
Structure of possible isomers of the losartan anion (1): antiperiplanar conformation (anti) and synperiplanar conformation (syn).
Basing on the already published reports [
7,
8,
12], we decided to carry out a simulation of the
1H-NMR spectrum of anion
1. We took into consideration the position of the tetrazole ring and the butyl chain connected with the imidazole ring with respect to the biphenyl moiety of
1,
i.e., its synperiplanar (
syn) and antiperiplanar (
anti) isomers. Previously reported studies concerning the spectroscopic analysis of losartan require a brief commentary. Generally, the results are difficult to emulate due to the lack of supplementary materials [
7,
8]; they were just a repetition of previous findings [
8]; or only one functional was used for calculations [
7,
12]. In our paper, we generated the theoretical
1H-NMR spectrum for all of the most stable
syn rotamers of
1 using the gauge-including atomic orbital (GIAO) method [
13] implemented in Gaussian G09 D.01 (Gaussian, Inc.: Wallingford, CT, USA, 2009). Therefore, we carried out the optimization of particular rotamers and NMR spectrum generation at the same level of theory. To show the results more clearly, only one most stable rotamer was considered with the lowest energy, optimized at the (1) B3LYP/6-31G(d,p), (2) B3LYP/6-311+G(d,p), (3) CAM-B3LYP/6-31G(d,p), (4) PBE1PBE/6-31G(d,p) and (5) MP2/6-31G(d,p) level of theory, both in the gaseous phase, using the conductor-like polarizable continuum model (CPCM) solvation model and water as a solvent (
Scheme 1).
The calculated values showed a strong correlation with the NMR experimental data for Compound
1. The highest relative percentage error was observed for the protons of the hydroxyl and methyl functionality (A) as a part of the
n-butyl chain. This is due to the lability of the hydroxyl proton, the shielding of the methyl protons and the proximity of the tetrazole ring. The distance between the methyl protons of the butyl chain and the N2 nitrogen of the tetrazole ring for Rotamers
II,
IV,
VI,
VIII (
Figure 2) equaled after optimization approximately 3 Å (CPCM model,
Figure 2).
Moreover, the application of the CPCM solvation model for
syn isomers
1 (Rotamers
II,
IV,
VI,
VIII;
Table 1 and
Table 2) resulted in a considerable improvement of the relative percentage errors of the chemical shifts of the methyl protons A (93%, 16%, 21% and 14%;
Table 1,
Table 2,
Tables S3 and S5, respectively) when compared to the rotamers optimized in the gaseous phase (Rotamers
I,
III,
V,
VII, respectively). The relative percentage error of the chemical shift of these protons equaled: 93%, 86%, 100% and 94% (gaseous phase;
Tables S1, S2, S4 and S6, respectively). Such improvement was particularly noticeable for rotamers calculated using the hybrid functional PBE1PBE (PBE0 functional).
Scheme 1.
The approaches used for the optimization together with the numbers of syn-rotamers. CPCM, the conductor-like polarizable continuum model.
Scheme 1.
The approaches used for the optimization together with the numbers of syn-rotamers. CPCM, the conductor-like polarizable continuum model.
Figure 2.
Optimized structure of the syn-losartan anion 1 (PBE1PBE/6-31G(d,p) level of theory, Rotamer VIII, CPCM solvation model).
Figure 2.
Optimized structure of the syn-losartan anion 1 (PBE1PBE/6-31G(d,p) level of theory, Rotamer VIII, CPCM solvation model).
Table 1.
Calculated and experimental data recorded at 293 K for losartan anion (1) Rotamer II (isomer syn); the following parameters were determined for their proton groups: experimental (Exp.) and calculated values of the chemical shifts (II), absolute errors (δ2) and values of the relative percentage errors (E); calculated NMR shielding for proton Href = 31.740 ppm for TMS (tetramethylsilane) (B3LYP/6-31G(d,p)/gauge-including atomic orbital (GIAO)/CPCM; R2 = 0.73, mean absolute deviation (MAD) = 0.58.
| Proton Signals | Exp. | Water |
|---|
| II | δ2 | E |
|---|
| A | 0.826 | 1.592 | 0.766 | 93 |
| B | 1.270 | 1.278 | 0.008 | 1 |
| C | 1.497 | 1.718 | 0.221 | 15 |
| D | 2.515 | 2.407 | 0.108 | 4 |
| E | 4.328 | 4.386 | 0.058 | 1 |
| OH | 5.304 | 0.263 | 5.041 | 95 |
| F | 5.228 | 5.010 | 0.217 | 4 |
| G | 6.917 | 6.881 | 0.035 | 1 |
| H | 7.108 | 7.473 | 0.364 | 5 |
| I | 7.553 | 8.966 | 1.413 | 19 |
| J | 7.370 | 6.883 | 0.487 | 7 |
| K | 7.293 | 6.836 | 0.458 | 6 |
Table 2.
Calculated and experimental data recorded at 293 K for losartan anion (1) Rotamer VIII (isomer syn); the following parameters were determined for their proton groups: experimental (Exp.) and calculated values of the chemical shifts (VIII), absolute errors (δ8) and values of the relative percentage errors (E); calculated NMR shielding for proton Href = 31.642 ppm for TMS (PBE1PBE/6-31G(d,p)/GIAO/CPCM; R2 = 0.75, MAD = 0.77.
| Proton Signals | Exp. | Water |
|---|
| VIII | δ8 | E |
|---|
| A | 0.826 | 0.940 | 0.114 | 14 |
| B | 1.270 | 1.367 | 0.097 | 8 |
| C | 1.497 | 1.311 | 0.186 | 12 |
| D | 2.515 | 2.599 | 0.083 | 3 |
| E | 4.328 | 4.418 | 0.089 | 2 |
| OH | 5.304 | 0.214 | 5.090 | 96 |
| F | 5.228 | 5.239 | 0.011 | 0 |
| G | 6.917 | 7.269 | 0.352 | 5 |
| H | 7.108 | 7.439 | 0.331 | 5 |
| I | 7.553 | 8.154 | 0.601 | 8 |
| J | 7.370 | 7.712 | 0.342 | 5 |
| K | 7.293 | 7.617 | 0.323 | 4 |
Herein, we focused our attention only on the electrostatic interactions between the solute and water as the solvent (in order to simulate the cellular environment). These are in fact the interactions that generally dominate solvent effects, especially in polar solvents (
i.e., water). As a matter of fact, continuum models were originally developed to describe this type of interaction [
14].
The optimization of clusters of the
syn isomers
1 with water molecules resulted in a considerable decrease of the relative percentage error of the chemical shifts of A protons and the hydroxyl moiety in the
in silico 1H-NMR spectrum. During the optimization of the
IX cluster (B3LYP/6-31G(d,p)/gas level of theory;
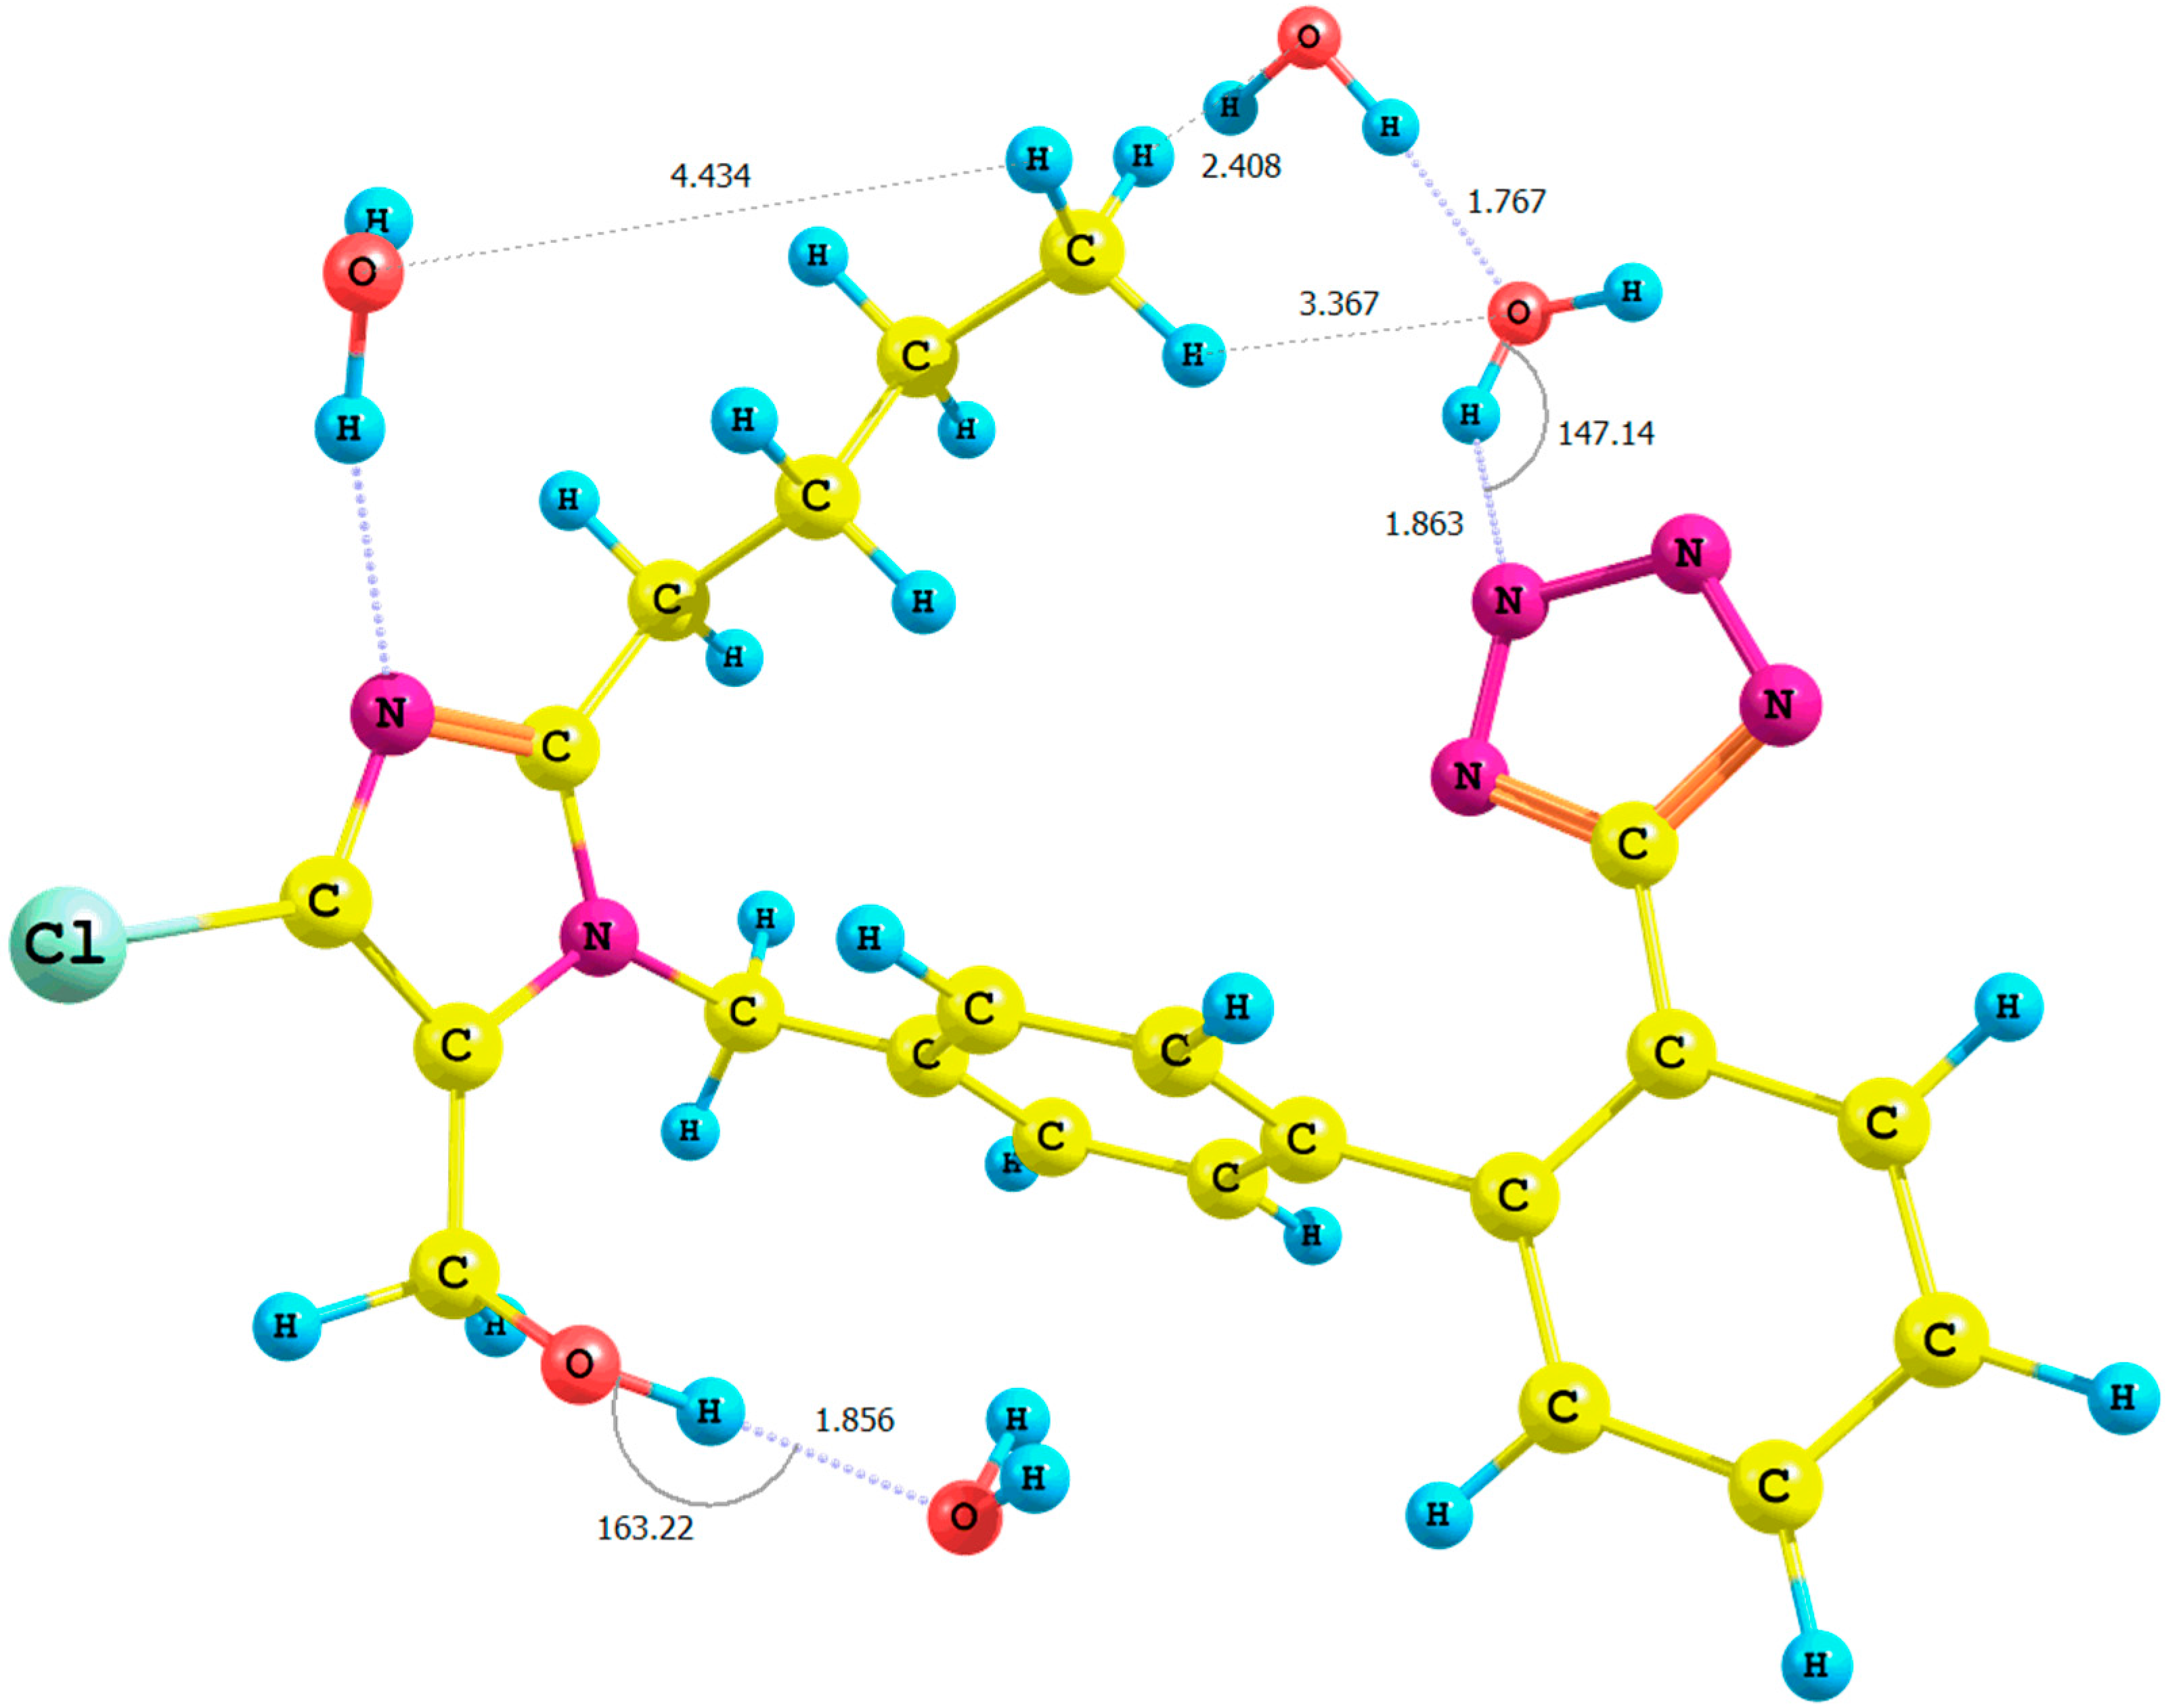
Table S7, Supplementary Materials), we observed a migration of three water molecules surrounding the methyl group A to the tetrazole ring. Concurrently, the distance
n-butyl–N5
terazole within the
X cluster (
Figure 3, PBE1PBE/6-31G(d,p)/gas level of theory) decreased from 2.9 to 2.5 Å in comparison with the corresponding
VII rotamer (PBE1PBE/6-31G(d,p)/gas level of theory; the numeration of nitrogen atoms is taken from the output files, and the visualization of all rotamers is given in the
Supplementary Materials).
Figure 3.
Optimized structure of the syn-losartan anion cluster 1 with water molecules (Rotamer X); interaction of 1 with three water molecules (PBE1PBE/6-31G(d,p) level of theory, gas).
Figure 3.
Optimized structure of the syn-losartan anion cluster 1 with water molecules (Rotamer X); interaction of 1 with three water molecules (PBE1PBE/6-31G(d,p) level of theory, gas).
This caused a decrease in relative percentage errors of the methyl group from 93% (Rotamer I) to 43% (Cluster IX) calculated using the B3LYP functional in the gaseous phase and from 94% (Rotamer VII) to 50% (Rotamer X) estimated applying the PBE0 functional in the gaseous phase. A similar trend was observed for the hydroxyl proton in terms of the values of its chemical shift. We noticed a decline in the relative percentage errors within the results of calculations using the PBE0 functional in the gaseous phase: from 95% (Rotamer I, B3LYP functional) to 27% (Cluster IX, B3LYP functional) in the gaseous phase and from 94% (Rotamer VII, PBE0 functional) to 30% (Cluster X, PBE0 functional).
Subsequently, we used an analogous methodology for the antiperiplanar (
anti) rotamers of
1 (
Figure 1). The
anti-rotamers were obtained by rotating the bonds C17–C16, C11–C8, C5–C4, C4–N2, C3–C22 and C2–C18 (
1 in
Figure 1) in torsion angle increments of 20°. Then, they were optimized at the DFT or MP2 level of theory using the Gaussian 09 D.01 program (
Scheme 2), namely: (1) B3LYP/6-31G(d,p) and (2) PBE1PBE/6-31G(d,p) basis set and the MP2 approach in the gaseous phase and applying the CPCM solvation model (water as a solvent).
Scheme 2.
The approaches used for the optimization together with the numbers of anti-rotamers.
Scheme 2.
The approaches used for the optimization together with the numbers of anti-rotamers.
Analogously, we calculated NMR shielding for TMS proton (H
ref) at the (1) B3LYP/6-31G(d,p), (2) PBE1PBE/6-31G(d,p) or (3) MP2/6-31G(d,p) level of theory (both gaseous phase and the CPCM solvation model with water as a solvent). The application of B3LYP/6-311+G(d,p) and CAM-B3LYP functionals for the
syn isomers
1 did not result in a significant improvement of the agreement between the calculated and the experimental values of chemical shifts in the
1H-NMR spectrum. Therefore, the calculations of the
anti-isomers
1 were limited to the two abovementioned functionals. In this case, the application of CPCM solvation model resulted in a decline in the relative percentage error of the hydroxyl proton from 27% (
anti-isomer, B3LYP/6-31G(d,p)/gas level of theory, Rotamer
XI;
Table S9) to 7% (
anti-isomer, B3LYP/6-31G(d,p)/CPCM level of theory, Rotamer
XII;
Table 3) or from 31% (
anti-isomer, PBE1PBE/6-31G(d,p)/gas level of theory, Rotamer
XIII;
Table S10) to 12% (
anti-isomer, PBE1PBE/6-31G(d,p)/CPCM level of theory, Rotamer
XIV;
Table 4;
Figure 4;
Figure S21 in the
Supplementary Materials).
Table 3.
Calculated and experimental data recorded at 293 K for losartan anion (1) Rotamer XII (isomer anti); the following parameters were determined for their proton groups: experimental (Exp.) and calculated values of the chemical shifts (XII), absolute errors (δ12) and values of the relative percentage errors (E); calculated NMR shielding for proton Href = 31.740 ppm for TMS (B3LYP/6-31G(d,p)/GIAO/CPCM; R2 = 0.99, MAD = 0.28.
| Proton Signals | Exp. | Water |
|---|
| XII | δ12 | E |
|---|
| A | 0.826 | 1.038 | 0.212 | 26 |
| B | 1.270 | 1.549 | 0.279 | 22 |
| C | 1.497 | 1.794 | 0.298 | 20 |
| D | 2.515 | 2.658 | 0.143 | 6 |
| E | 4.328 | 4.270 | 0.058 | 1 |
| OH | 5.304 | 5.699 | 0.395 | 7 |
| F | 5.228 | 4.986 | 0.242 | 5 |
| G | 6.917 | 7.482 | 0.566 | 8 |
| H | 7.108 | 7.261 | 0.153 | 2 |
| I | 7.553 | 8.145 | 0.592 | 8 |
| J | 7.370 | 7.566 | 0.197 | 3 |
| K | 7.293 | 7.519 | 0.226 | 3 |
Table 4.
Calculated and experimental data recorded at 293 K for losartan anion (1) Rotamer XIV (isomer anti); the following parameters were determined for their proton groups: experimental (Exp.) and calculated values of the chemical shifts (XIV), absolute errors (δ14) and values of the relative percentage errors (E); calculated NMR shielding for proton Href = 31.642 ppm for TMS (PBE1PBE/6-31G(d,p)/GIAO/CPCM; R2 = 0.99, MAD = 0.37.
| Proton Signals | Exp. | Water |
|---|
| XIV | δ14 | E |
|---|
| A | 0.826 | 1.030 | 0.204 | 25 |
| B | 1.270 | 1.509 | 0.239 | 19 |
| C | 1.497 | 1.805 | 0.309 | 21 |
| D | 2.515 | 2.676 | 0.161 | 6 |
| E | 4.328 | 4.270 | 0.058 | 1 |
| OH | 5.304 | 5.955 | 0.651 | 12 |
| F | 5.228 | 5.053 | 0.175 | 3 |
| G | 6.917 | 7.640 | 0.723 | 10 |
| H | 7.108 | 7.421 | 0.313 | 4 |
| I | 7.553 | 8.356 | 0.803 | 11 |
| J | 7.370 | 7.741 | 0.371 | 5 |
| K | 7.293 | 7.698 | 0.405 | 6 |
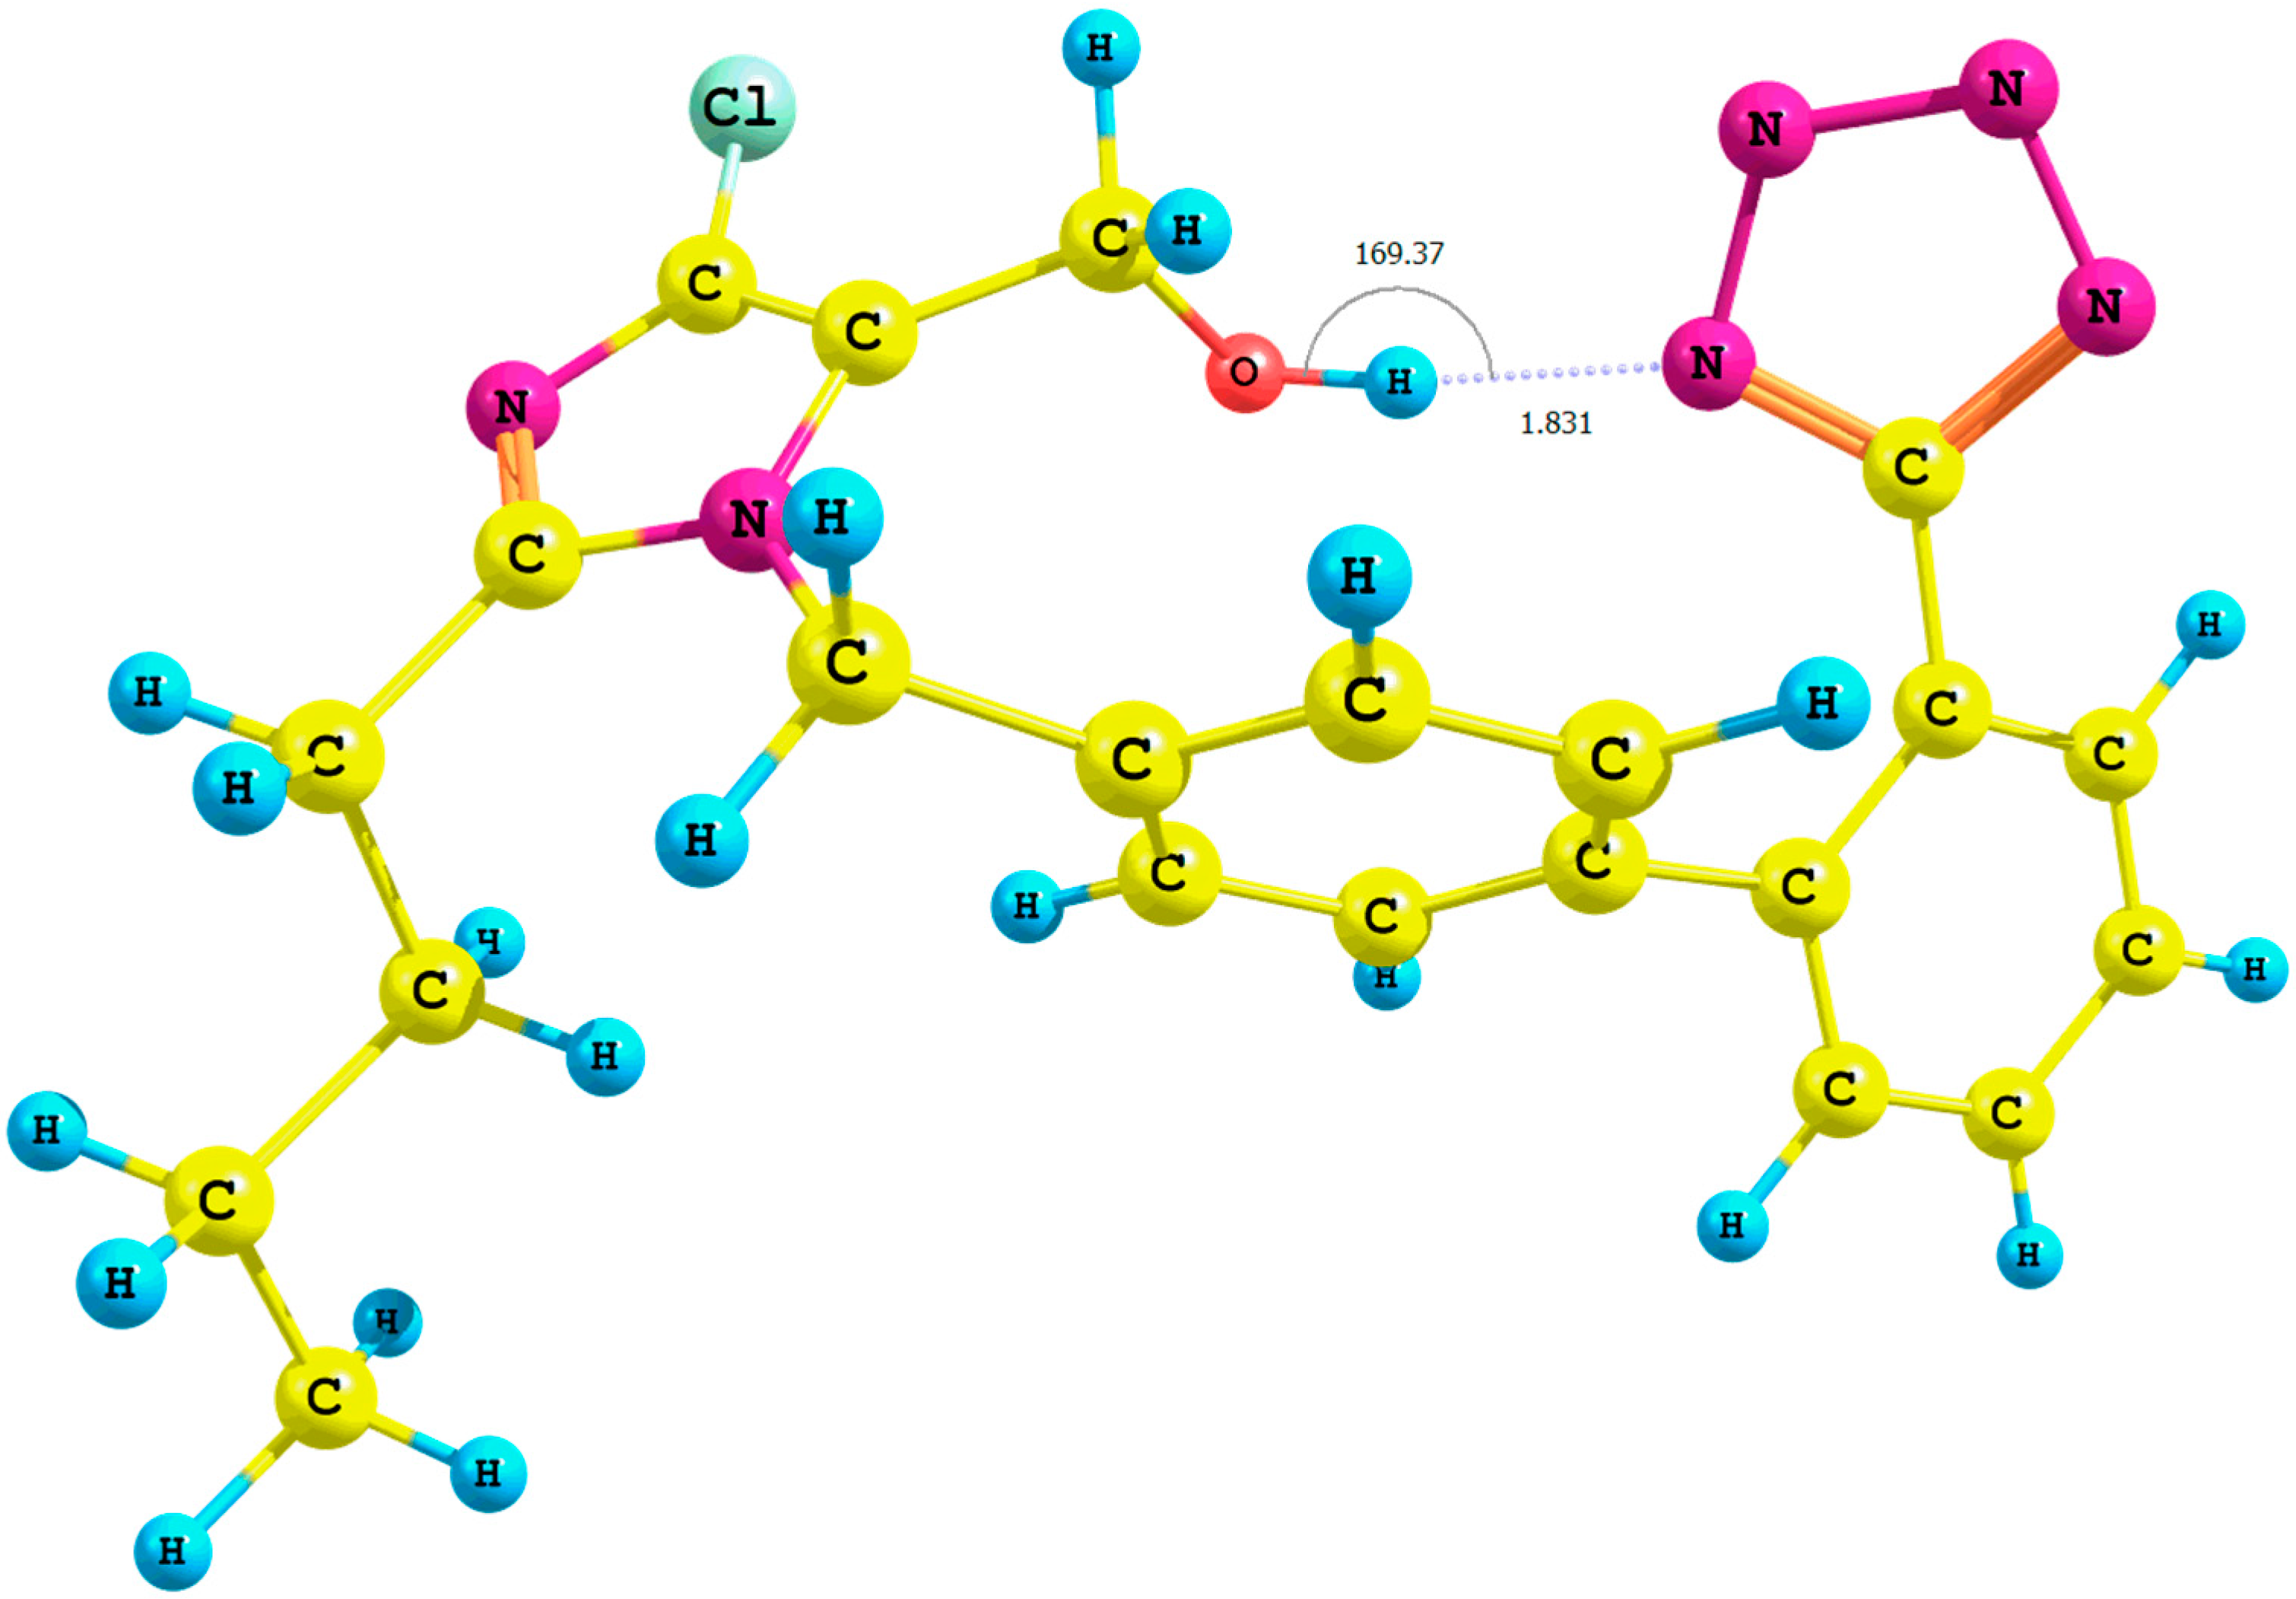
Figure 4.
Optimized structure of the anti-losartan anion 1 (PBE1PBE/6-31G(d,p) level of theory, Rotamer XIV, CPCM solvation model).
Figure 4.
Optimized structure of the anti-losartan anion 1 (PBE1PBE/6-31G(d,p) level of theory, Rotamer XIV, CPCM solvation model).
It is important to emphasize the influence of tetrazole nitrogen atoms and their distance to the hydroxyl group. The difference of the N6
tetrazole–HO distance after optimization of the
XI and
XII or
XIII and
XIV rotamers was equal to 0.04 Å (numeration of nitrogen atoms is taken from the output files, and the visualization of all rotamers is given in the
Supplementary Materials). A greater proximity of the tetrazole to the hydroxyl in the optimized
XI or
XIII rotamers (gaseous phase) intensified the polarization of the O-H bond and caused the deshielding of the proton. These changes were reflected by the higher relative percentage error of its chemical shift in the theoretical NMR spectrum. However, an analogous influence of the solvation model using B3LYP and PBE0 functionals for the
anti-isomers
1 was not observed for the methyl protons (A) (
Table 5). Instead, we noted an insignificant increase of the relative percentage error: from 20% (
anti-isomer, B3LYP/6-31G(d,p)/gas level of theory, Rotamer
XI;
Table S9) to 26% (
anti-isomer, B3LYP/6-31G(d,p)/CPCM level of theory, Rotamer
XII;
Table 3) or from 18% (
anti-isomer, PBE1PBE/6-31G(d,p)/gas level of theory, Rotamer
XIII;
Table S10) to 25% (
anti-isomer, PBE1PBE/6-31G(d,p)/CPCM Rotamer
XIV;
Table 4;
Figure 4). The changes of the relative percentage error of hydroxyl and methyl (A) protons are gathered in
Table 5.
Moreover, the interaction of N6
tetrazole and the hydroxyl moiety seems to be confirmed by the experimentally recorded NMR spectra of
1 at different temperatures (
Figure S23, Supplementary Materials) and concentrations (
Figure S25, Supplementary Materials). Based on the literature data, it is known that the shifts are mightily affected by hydrogen bonding, with large downfield shifts of H-bonded functionalities compared to the hydroxyl substituent [
15]. Moreover, intra- and inter-molecular types of hydrogen bonds can be easily discriminated by means of NMR spectroscopy, where only in the second case, the resonance frequencies of the OH group are concentration dependent [
16]. Our experiments clearly have shown that the triplet relating to the OH group moves upfield together with increasing temperature, while the changes in concentration of
1 do not affect the chemical shift of the hydroxyl moiety. Basing on these facts, we confirmed the results of
in silico calculations, where the OH group was engaged in the formation of the strong intramolecular hydrogen bond with the nitrogen atom in a tetrazole ring.
Table 5.
Calculated relative percentage errors (E) of protons A and OH of losartan anion (1) rotamers recorded at 293 K and values of coefficient of determination (R2) and mean absolute deviation (MAD) parameters as a factor describing the correlation of 1H-NMR with experimental data; the following approaches were considered: (a) B3LYP/6-31G(d,p); (b) PBE1PBE/6-31G(d,p); (c) MP2/6-31G(d,p).
| Protons | Relative Percentage Error (E) (%) |
|---|
| a | b | c |
|---|
| Vacuum | Water | Vacuum | Water | Vacuum | Water |
|---|
| I | XI | II | XII | VII | XIII | VIII | XIV | XVII | XIX | XVIII | XX |
|---|
| syn | anti | syn | anti | syn | anti | syn | anti | syn | anti | syn | anti |
|---|
| A | 93 | 20 | 93 | 26 | 94 | 18 | 14 | 25 | 94 | 18 | 28 | 28 |
| OH | 95 | 27 | 95 | 7 | 94 | 31 | 96 | 12 | 97 | 30 | 95 | 12 |
| Parameters |
| R2 | 0.71 | 0.96 | 0.73 | 0.99 | 0.72 | 0.95 | 0.75 | 0.99 | 0.72 | 0.97 | 0.75 | 0.99 |
| MAD | 0.76 | 0.40 | 0.58 | 0.28 | 0.77 | 0.43 | 0.63 | 0.37 | 0.67 | 0.34 | 0.65 | 0.36 |
The correlation analysis of the
1H-NMR spectra of the
anti-isomers with the experimental data showed a stronger correlation for the
anti-isomers optimized using the CPCM solvation model (proven by the higher values of the coefficient of determination
R2 and lower values of the mean absolute deviation MAD) in comparison with the
syn isomers (
Table 5).
The results of the QTAIM (quantum theory of atoms-in-molecules) analysis [
17,
18] carried out using the AIMAll 14.11.23 software [
19] (
Figure S21 and
Table S19 in the
Supplementary Materials) suggested the interactions between the tetrazole ring and the hydroxyl proton within the
XIV rotamer (isomer
anti, PBE1PBE/6-31G(d,p)/CPCM level of theory;
Figure 4), as well. The proposed model showed the existence of a bond critical point localized on the bond path between the interacting moieties N6
tetrazole···HO–CH
2–imidazole.
Therefore, it can be concluded that a lower value of the relative percentage error for hydroxyl and methyl (A) protons
1 were obtained for the
anti-isomers. The only exception was the relative percentage error of methyl protons of
syn/
anti isomers,
i.e.,
VIII and
XV rotamers, respectively, optimized using the PBE0 functional and the CPCM model. The reasons for this finding can be explained due to the considerable relaxation of the C-C bonds within the
anti-isomer
1 and a possible rotation of the methyl group of the butyl chain. Such a phenomenon in this case was not limited by the heterocyclic moiety and, thus, lack of the shielding effect of the analyzed protons, which was observed in the
syn isomers
1. Moreover, contrary to the
anti-isomers
1 (where the hydroxyl was stabilized by the nitrogen atom of the tetrazole ring by means of electrostatic interactions), for the
syn isomers
1, the hydroxyl moiety undergoes shielding due to the steric hindrance (phenyl moiety connected with the methylene bridge). We can conclude that from the stereochemical point of view, losartan preferentially adopts the
anti form. The results of the calculated energy indicated that the
anti-isomers of
1 were always characterized with lower energy (more negative) (
Table S17, Supplementary Materials). Furthermore, the correlation analysis of the theoretical and experimental
1H-NMR spectra of the rotamers
1 indicates unambiguously the tendency for a stronger correlation being obtained for the
anti-isomers (higher values of the coefficients of determination
R2 and lower values of the mean absolute deviation MAD parameters;
Table 1,
Table 2,
Table 3,
Table 4,
Table 5, and
Tables S1–S15, Supplementary Materials) in comparison with the
syn isomers.
The application of the B3LYP or PBE0 functional for the
anti-clusters of losartan surrounded by water molecules, optimized in the gaseous phase (Cluster
XV and Cluster
XVI;
Figure 5, respectively), when compared to the single
anti-isomers
1 (Rotamer
XI, B3LYP/6-31G(d,p)/gas level of theory; Rotamer
XIII, PBE1PBE/6-31G(d,p)/gas level of theory, respectively), did not result in an improvement of the relative percentage error of the chemical shift of the methyl (A) and hydroxyl protons.
Figure 5.
Optimized structure of the anti-losartan anion cluster 1 with water molecules (Cluster XVI); interaction of 1 with three water molecules (PBE1PBE/6-31G(d,p) level of theory, gas).
Figure 5.
Optimized structure of the anti-losartan anion cluster 1 with water molecules (Cluster XVI); interaction of 1 with three water molecules (PBE1PBE/6-31G(d,p) level of theory, gas).
Only when comparing the XI and XV clusters optimized in the gaseous phase at the B3LYP/6-31G(d,p) level of theory did we observe a small decline in the relative percentage error of the hydroxyl proton chemical shift: from 27% (Rotamer XI) to 25% (Rotamer XV).
In our study, we also compared the experimental values of chemical shifts with the calculated results obtained for the
syn- and
anti-romaters optimized using the MP2 method (MP2/6-31G(d,p) level of theory). For this purpose, we considered the gaseous phase (
syn- and
anti-isomers, Rotamers
XVII and
XIX, respectively) or the CPCM solvation model (water as a solvent,
syn- and
anti-isomers, Rotamers
XVIII and
XX, respectively). Calculated NMR chemical shifts for protons of these rotamers (MP2/6-31G(d,p)/GIAO approach) are gathered in
Table 5 and
Tables S15–S18 (Supplementary Materials). The obtained data showed a smaller value of the relative percentage error for the methyl (A) and hydroxyl protons of the
anti-isomer of losartan in comparison with
syn-isomers. Only for the methyl proton in the CPCM model did the relative percentage error for
syn- and
anti-isomers equal 28%. In contrast to our cost-effective DFT approach, the perturbation methods seem to be a too time consuming of an approach when used for calculating the
1H-NMR spectra of
1. Nevertheless, the lower energy of the
anti-isomers
1 (MP2 approach) also suggested their greater stability (
Table S17, Supplementary Materials). Moreover, the MP2 method gave a better correlation between the calculated and experimental NMR chemical shifts for the
anti-isomers (a higher value of the
R2 and a lower value of the MAD parameters;
Table 1,
Table 2,
Table 3,
Table 4,
Table 5, and
Tables S1–S16, Supplementary Materials).
Our hypothesis that losartan Anion
1 adopts preferentially the
anti form is in agreement with the literature data [
6,
12,
20,
21]. Molecular dynamics (MD) simulations in implicit solvation models supported the theoretical existence of the
anti and
syn conformations. On the other hand, an MD simulation run in the lipid bilayers revealed that losartan forms the hydrogen bonds with the lipid glycerol backbone and the phosphate groups [
12]. The authors concluded that the
anti conformation of losartan seems to be favored in the cellular environment, pointing to this isomer as the active one in a membrane environment. The results presented in our paper were also in accordance with the proposed two-step mechanism (involving lipid bilayers) or direct action of losartan in the AT1 receptor [
21]. The results of energy, NMR, as well as QTAIM calculations presented herein proved that the
anti conformation of
1 is most stable from the structural standpoint and allow us to assume that this orientation might be the most effective within the receptor cavity.
3. Experimental Section
The salt of losartan potassium
1 (1.2 mg, 0.26 µmol; Biofarm Sp. z o.o., Poznań, Poland) was added to 530 µL DMSO-
d6 (99.8 atom%D, ARMAR Chemicals, Döttingen, Switzerland) and mixed for one hour at 293 K until the content was completely dissolved. The solution was moved to a 5-nm thin-wall tube with a final sample volume of 530 μL, and the 1D
1H-NMR spectra, as well as 2D homonuclear spectra were directly recorded starting from 293 K on a 400-MHz spectrometer (Bruker Daltonics, Billerica, MA, USA) operating at the frequency of 400 MHz (
1H). Spectra were acquired within 4424.8-Hz spectral width and processed and prepared with TopSpin 3.0 Bruker software (Bruker BioSpin, Billerica, MA, USA). Density functional calculations were executed, and the geometries of losartan anion (
1) were optimized at the DFT [
22] level of theory (Becke three-term correlation functional; the Lee, Yang and Parr exchange functional B3LYP, or long range corrected version of the B3LYP functional, or the Perdew, Burke and Ernzerhof functional PBE1PBE) or applying the Mőller–Plesset second order perturbation theory MP2 using the Gaussian 09 D.01 program [
23], namely the (1) B3LYP/6-31G(d,p) [
24], (2) CAM-B3LYP/6-31G(d,p) [
25], (3) B3LYP/6-311+G(d,p) [
26,
27], (4) PBE1PBE/6-31G(d,p) [
28,
29] and (5) MP2/6-31G(d,p) [
30] approach in the gaseous phase and applying the conductor-like polarizable continuum model (CPCM, water as a solvent) [
27,
31,
32]. The vibrational frequencies and thermodynamic properties were calculated by applying the ideal gas, rigid rotor and harmonic oscillator approximations, and the energy minimum was confirmed by the frequency calculation for all rotamers; no negative frequencies were detected in the generated vibrational spectrum of the analyzed rotamers. All of the
syn-/
anti-rotamers were obtained by rotating the bonds C17–C16, C11–C8, C5–C4, C4–N2, C3–C22 and C2–C18 (
Figure 1) in torsion angle increments of 20° (changes in torsion angles are gathered in
Table S18 given in the
Supplementary Materials), and a total of 1080 rotamers were obtained. NMR shielding for proton (H
ref) was calculated for TMS (tetramethylsilane) at the (1) B3LYP/6-31G(d,p), (2) CAM-B3LYP/6-31G(d,p), (3) B3LYP/6-311+G(d,p), (4) PBE1PBE/6-31G(d,p) and (5) MP2/6-31G(d,p) level of theory (gaseous phase and CPCM solvation model and water as solvent) at 293 K. It is noteworthy that the difference between dielectric constant values of water and DMSO are not significant (ε = 78.3 and 46.8, respectively [
23]). Moreover, the results of the NMR calculations carried out using DMSO as a solvent in comparison with the corresponding data (water as a solvent) were very similar (
Tables S1b and S6b for
syn-isomers or
Tables S9b and S10b for
anti-isomers given in the
Supplementary Materials). Particular clusters with water molecules were constructed by adding water molecules to protons of hydroxyl and methyl groups and then optimized. In order to discriminate the protons in
1, they were marked according to
Figure 1 positions (experimental values of chemical shifts are given in ppm and are in good agreement with reference data [
10];
Figures S22–S24, Supplementary Materials):
1H-NMR (DMSO-
d6, 400 MHz, 293 K) ppm:
I 7.553 (H7; 1H; d;
3JHH = 9.2 Hz),
J 7.370 (H6, H8; 2H; m; overlapping signals),
K 7.293 (H5; 1H; d;
3JHH = 9.2 Hz),
H 7.108 (H2, H4; 2H; d;
3JHH = 8.0 Hz),
G 6.917 (H1, H3; 2H; d;
3JHH = 8.0 Hz),
F 5.228 (H9, H10; 2H; s),
OH 5.304 (H13, 1H, t,
3JHH = 5.2 Hz),
E 4.328 (H11, H12; 2H; d;
3JHH = 4.8 Hz),
D 2.51 (H14, H15; 2H, s),
C 1.497 (H16, H17; 2H; m),
B 1.270 (H19, H18; 2H; m),
A 0.826 (H22–H20; 3H; t;
3JHH = 7.6 Hz). The
1H-NMR spectra were recorded in DMSO-
d6. For Losartan, the
1H-NMR spectrum was acquired within the 4424.8 Hz spectral width. A total of 128 scans was collected.
The compound of interest (
1) and reference compound (TMS) were calculated using the same method, and the reference compound was used to obtain the chemical shifts of
1 according to the following equation: δ
i = σ
ref − σ
i, where δ
i was the chemical shift of i-nuclei of
1 and σ
ref and σ
i were the calculated isotropic magnetic shielding tensor for the TMS and
1, respectively [
9,
10,
33]. The calculated chemical shifts for the homotopic protons were averaged. The Chemcraft 1.7 software was utilized for visualization of all optimized rotamers [
34]. The calculations were carried out using resources provided by Poznan Supercomputing and Networking Center (Reef cluster), as well as the Wrocław Center for Networking and Supercomputing (Supernova and Bem clusters).


 ,
, 


