
Anemarrhena asphodeloides Non-Steroidal Saponin Components Alter the Pharmacokinetic Profile of Its Steroidal Saponins in Rat

Abstract
:1. Introduction

2. Results and Discussion
2.1. Method Development
2.1.1. Optimization of Mass Spectrometry Conditions
2.1.2. Optimization of Chromatography Conditions
2.1.3. Optimization of Extraction Conditions
2.2. Method Validation
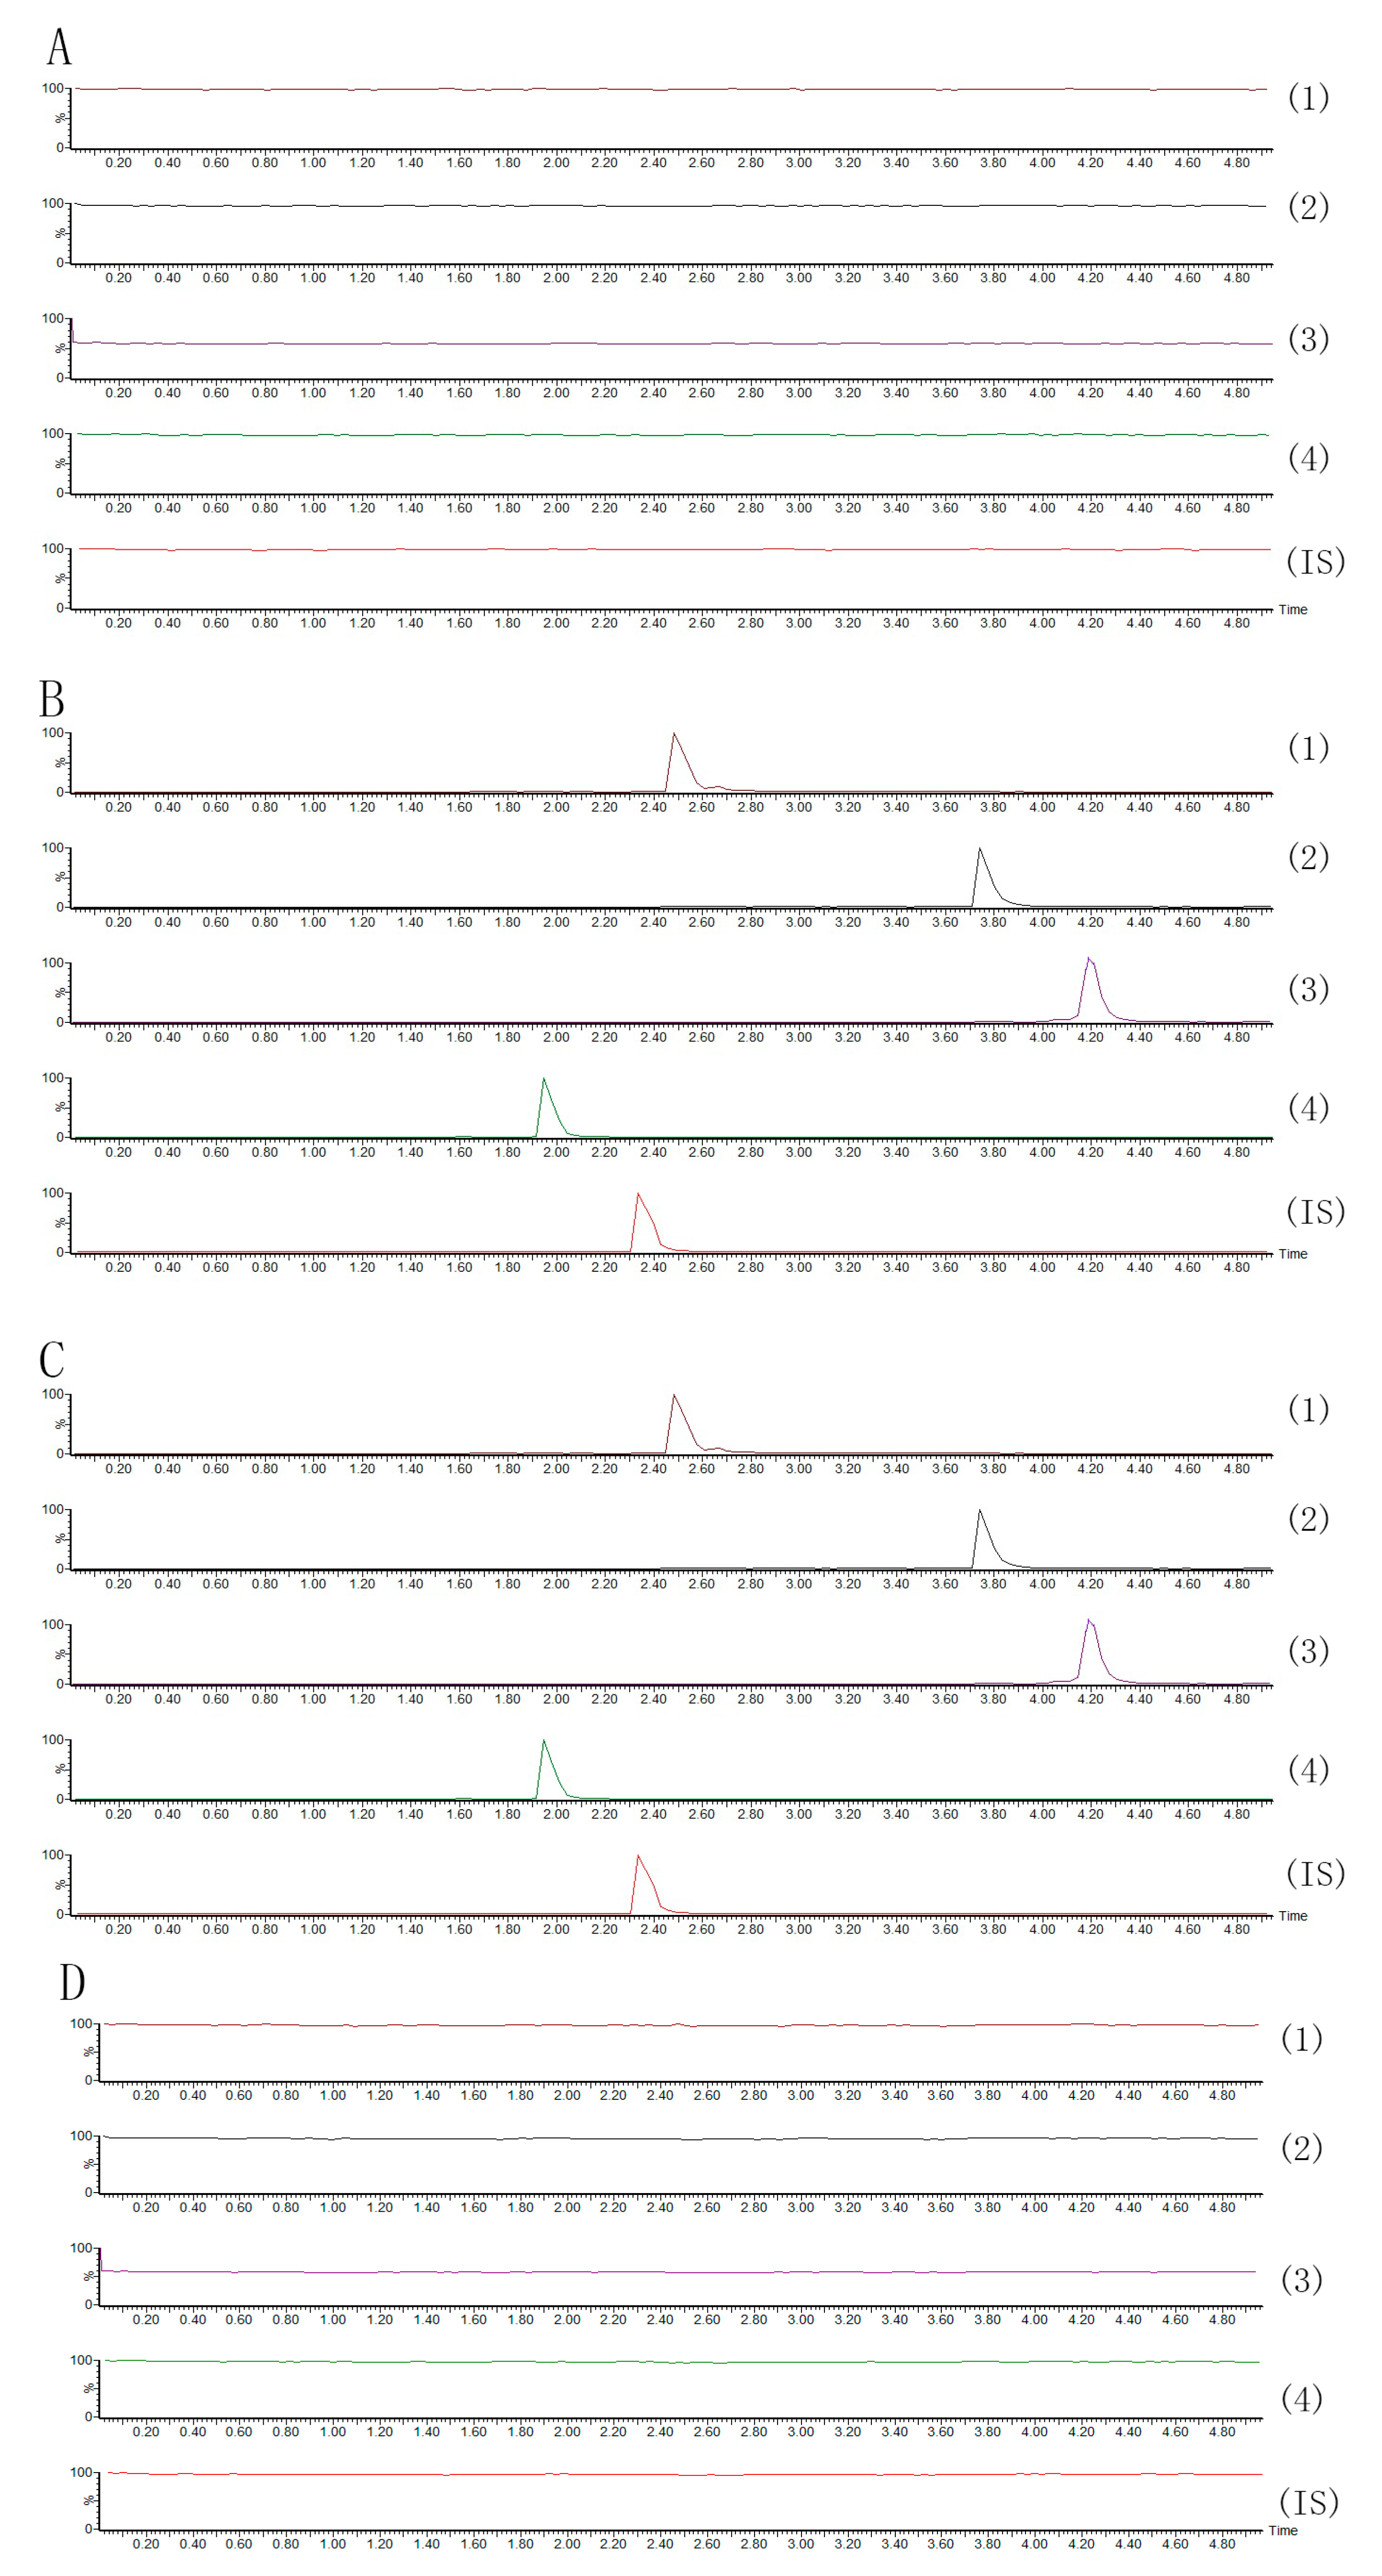
2.2.1. Specificity
2.2.2. Linearity and Lower Limits of Quantification (LLOQ)

| Analytes | Liner Regression Equations | R2 | Range (ng/mL) | LOQ (ng/mL) | LOD (ng/mL) |
|---|---|---|---|---|---|
| Timosaponin BII | Y = 0.0027x + 0.1944 | 0.9971 | 5.08–650.00 | 5.08 | 1.89 |
| Anemarsaponin BIII | Y = 0.0012x + 0.0632 | 0.9919 | 4.84–620.00 | 4.84 | 1.68 |
| Timosaponin AIII | Y = 0.0017x + 0.1218 | 0.9983 | 3.79–485.00 | 3.79 | 1.42 |
| Timosaponin E1 | Y = 0.0018x + 0.0983 | 0.9941 | 4.14–530.00 | 4.14 | 1.29 |
2.2.3. Precision and Accuracy
| Analytes | Concentration ng/mL | Intra-Day | Inter-Day | ||
|---|---|---|---|---|---|
| Accuracy (%) | Precision (RSD, %) | Accuracy (%) | Precision (RSD, %) | ||
| Timosaponin BII | 5.20 | 86.7 | 8.8 | 94.4 | 10.4 |
| 52.00 | 97.0 | 6.4 | 99.4 | 8.3 | |
| 520.00 | 92.8 | 8.5 | 106.2 | 11.2 | |
| Anemarsaponin BIII | 4.96 | 102.8 | 8.2 | 101.2 | 9.8 |
| 49.60 | 97.4 | 11.6 | 100.0 | 9.6 | |
| 496.00 | 92.7 | 6.4 | 101.6 | 11.1 | |
| Timosaponin AIII | 3.88 | 94.8 | 11.3 | 100.9 | 10.8 |
| 38.80 | 97.7 | 9.6 | 105.5 | 11.0 | |
| 388.00 | 94.0 | 9.3 | 100.2 | 11.2 | |
| Timosaponin E1 | 4.24 | 101.0 | 4.5 | 104.2 | 6.9 |
| 42.40 | 100.6 | 9.6 | 106.8 | 9.2 | |
| 424.00 | 103.3 | 4.5 | 96.5 | 10.2 | |
2.2.4. Extraction Recovery and Matrix Effect
| Analytes | Concentration (ng/mL) | Recovery | Matrix Effects | ||
|---|---|---|---|---|---|
| Mean (%) | RSD (%) | Mean (%) | RSD(%) | ||
| Timosaponin BII | 5.20 | 83.7 | 6.5 | 101.3 | 9.8 |
| 52.00 | 81.3 | 8.2 | 99.9 | 5.9 | |
| 520.00 | 79.5 | 9.5 | 97.6 | 7.0 | |
| Anemarsaponin BIII | 4.96 | 81.7 | 6.5 | 99.7 | 5.1 |
| 49.60 | 76.1 | 6.4 | 80.7 | 8.5 | |
| 496.00 | 77.8 | 9.2 | 96.2 | 6.1 | |
| Timosaponin AIII | 3.88 | 89.3 | 4.8 | 92.4 | 4.7 |
| 38.80 | 80.7 | 10.4 | 95.5 | 10.3 | |
| 388.00 | 83.5 | 5.0 | 89.7 | 6.2 | |
| Timosaponin E1 | 4.24 | 88.0 | 4.3 | 96.4 | 6.3 |
| 42.40 | 73.9 | 10.1 | 86.2 | 10.7 | |
| 424.00 | 77.0 | 11.7 | 89.4 | 8.7 | |
2.2.5. Stability
| Analytes | Concentration (ng/mL) | Auto-Sampler for 24 h | at −80 °C for 1 Month | Freeze–Thaw Cycles | |||
|---|---|---|---|---|---|---|---|
| Mean (%) | RSD (%) | Mean (%) | RSD (%) | Mean (%) | RSD (%) | ||
| Timosaponin BII | 5.20 | 95.3 | 6.1 | 94.7 | 11.8 | 98.0 | 12.2 |
| 52.00 | 98.1 | 4.0 | 98.2 | 3.9 | 95.5 | 8.1 | |
| 520.00 | 88.3 | 5.3 | 95.4 | 8.2 | 91.4 | 9.5 | |
| Anemarsaponin BIII | 4.96 | 97.0 | 9.7 | 99.0 | 4.9 | 83.3 | 6.3 |
| 49.60 | 94.9 | 6.6 | 94.3 | 7.0 | 93.6 | 8.2 | |
| 496.00 | 94.9 | 8.7 | 91.5 | 9.8 | 88.1 | 7.5 | |
| Timosaponin AIII | 3.88 | 100.9 | 12.6 | 100.4 | 10.9 | 102.2 | 11.3 |
| 38.80 | 97.0 | 12.2 | 101.7 | 10.8 | 96.2 | 10.7 | |
| 388.00 | 96.4 | 12.2 | 99.0 | 10.3 | 102.8 | 6.4 | |
| Timosaponin E1 | 4.24 | 98.0 | 3.8 | 96.8 | 7.5 | 103.2 | 8.8 |
| 42.40 | 102.3 | 5.8 | 93.5 | 7.9 | 95.6 | 9.4 | |
| 424.00 | 99.3 | 6.1 | 95.8 | 10.8 | 89.8 | 11.1 | |
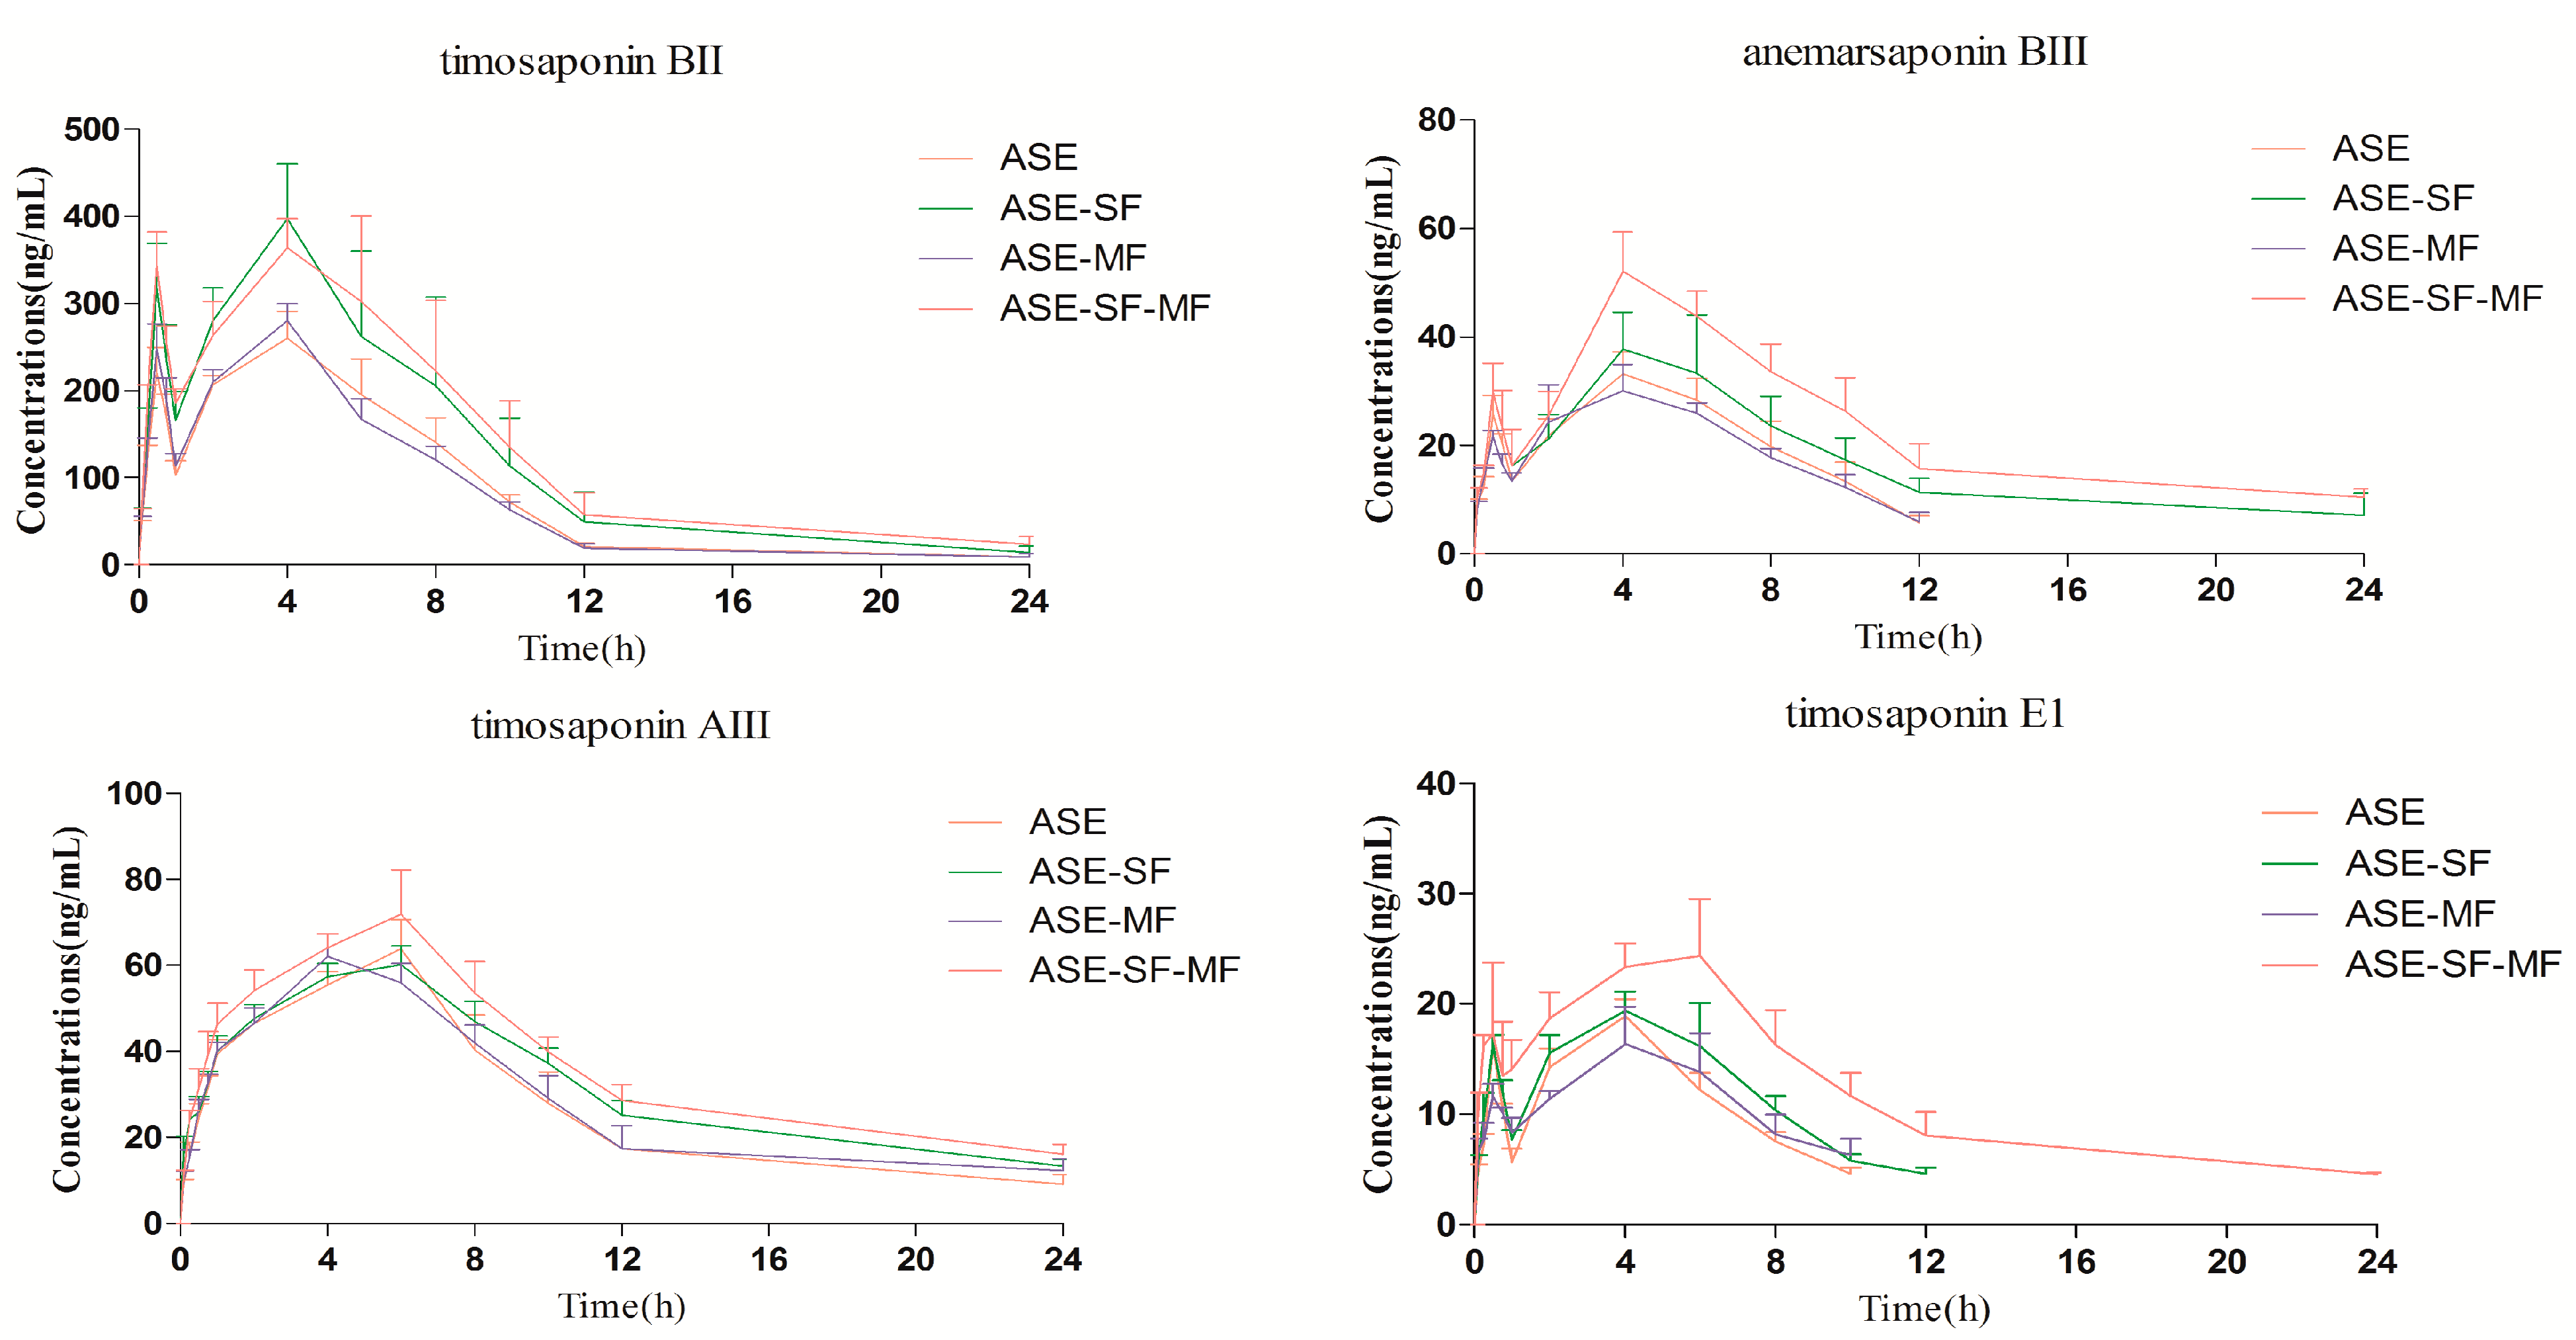
2.3. Pharmacokinetics Study

| Analytes | Parameters | Group ASE | Group ASE-SF | Group ASE-MF | Group ASE-SF-MF |
|---|---|---|---|---|---|
| Timosaponin BII | Cmax (ng/mL) | 271.22 ± 22.48 | 415.22 ± 41.79 * | 287.22 ± 11.91 | 400.20 ± 39.57 * |
| Tmax (h) | 3.75 ± 1.78 | 5.00 ± 1.67 | 3.41 ± 1.43 | 3.17 ± 2.21 | |
| T1/2 (h) | 3.21 ± 1.17 | 3.63 ± 1.28 | 3.34 ± 1.19 | 5.18 ± 1.88 * | |
| AUC0–t (ng·h/mL) | 2040.97 ± 145.87 | 3087.78 ± 627.88 * | 1983.08 ± 104.24 | 3314.05 ± 575.12 * | |
| Anemarsaponin BIII | Cmax (ng/mL) | 34.48 ± 3.75 | 43.47 ± 3.58 * | 32.30 ± 4.36 | 53.28 ± 5.06 * |
| Tmax (h) | 3.75 ± 1.78 | 4.66 ± 1.03 | 4.00 ± 1.26 | 4.33 ± 0.81 | |
| T1/2 (h) | 2.75 ± 1.14 | 5.03 ± 2.71 | 3.02 ± 1.19 | 7.63 ± 3.37 * | |
| AUC0–t (ng·h/mL) | 257.15 ± 20.39 | 406.33 ± 64.49 * | 242.35 ± 32.01 | 550.52 ± 75.03 * | |
| Timosaponin AIII | Cmax (ng/mL) | 65.18 ± 4.16 | 69.83 ± 2.86 * | 63.60 ± 3.16 | 74.01 ± 6.18 * |
| Tmax (h) | 5.66 ± 0.81 | 5.33 ± 1.03 | 4.33 ± 0.81 | 5.66 ± 0.81 | |
| T1/2 (h) | 5.31 ± 3.03 | 8.20 ± 2.74 * | 6.95 ± 6.23 | 8.94 ± 1.24 * | |
| AUC0–t (ng·h/mL) | 644.27 ± 59.05 | 778.09 ± 36. 81 * | 688.00 ± 46.31 | 889.76 ± 57.20 * | |
| Timosaponin E1 | Cmax (ng/mL) | 18.86 ± 1.54 | 21.26 ± 2.35 * | 17.78 ± 2.85 | 26.65 ± 2.73 * |
| Tmax (h) | 4.00 | 4.33 ± 0.81 | 4.66 ± 1.03 | 5.00 ± 1.09 | |
| T1/2 (h) | 2.95 ± 0.40 | 3.31 ± 0.48 | 4.39 ± 2.58 | 8.80 ± 3.83 * | |
| AUC0–t (ng·h/mL) | 115.38 ± 5.35 | 145.85 ± 8.28 * | 113.21 ± 7.43 | 286.09 ± 36.84 * |
2.3.1. Comparison of the Pharmacokinetic Profile of the Four Steroidal Saponins 1–4 in the Group ASE and Group ASE-SF
2.3.2. Comparison of the Pharmacokinetic Profiles of the Four Steroidal Saponins 1–4 in the Group ASE and Group ASE-MF
2.3.3. Comparison of Pharmacokinetic Profile of Four Steroidal Saponins 1–4 in Group ASE and Group ASE-SF-MF
2.4. Double Peak Phenomenon
2.5 Influence of SF and MF on the Pharmacokinetic Profile of Steroidal Saponins
3. Experimental Section
3.1. Chemicals and Reagents
3.2. Chromatographic Conditions
3.3. Mass Spectrometric Conditions
| Analytes | Retention Time (min) | MRM Transitions (precursor → product) | Cone Voltage (V) | Collision Energy (eV) |
|---|---|---|---|---|
| Timosaponin BII | 2.48 | 919.5→757.4 | 52 | 28 |
| Anemarsaponin BIII | 3.74 | 901.5→739.4 | 68 | 30 |
| Timosaponin AIII | 4.21 | 739.4 →577.4 | 66 | 40 |
| Timosaponin E1 | 1.95 | 935.3→773.2 | 64 | 34 |
| Ginsenoside Re | 2.33 | 945.6→637.4 | 54 | 34 |
3.4. Preparation of Administered Samples
3.5. Preparation of Standard Solution and Quality Control (QC) Samples
3.6. Preparation of Plasma Samples
3.7. Method Validation
3.7.1. Assay Specificity
3.7.2. Linearity and lower limits of quantification (LLOQ)
3.7.3. Precision and accuracy
3.7.4. Recovery and matrix effect
3.7.5. Stability
3.8. Pharmacokinetic Study
3.9. Statistical Analysis
4. Conclusions
Acknowledgements
Author Contributions
Conflicts of Interest
References
- Wang, Y.L.; Dan, Y.; Yang, D.W.; Hu, Y.L.; Zhang, L.; Zhang, C.H.; Zhu, H.; Cui, Z.H.; Li, M.H.; Liu, Y.Z. The genus Anemarrhena Bunge: A review on ethnopharmacology, phytochemistry and pharmacology. J. Ethnopharmacol. 2014, 153, 42–60. [Google Scholar] [CrossRef] [PubMed]
- Chinese Pharmacopoeia Commission. Pharmacopoeia of the People’s Republic of China (English Edition); People’s Medical Publishing House: Beijing, China, 2010/2015; Volume I. [Google Scholar]
- Deng, Y.; Ma, B.P.; Xu, Q.P.; Xiong, C.Q.; Liu, R.Q.; Zhao, Y.; Si, Y.C. Effect and mechanism of effective component in Zhimu on ability of learning and memory in vascular dementia rats. Chin. Pharm. Bull. 2005, 21, 833–837. [Google Scholar]
- Lee, B.; Trinh, H.T.; Jung, K.; Han, S.J.; Kim, D.H. Inhibitory effects of steroidal timosaponins isolated from the rhizomes of Anemarrhena asphodeloides against passive cutaneous anaphylaxis reaction and pruritus. Immunopharmacol. Immunotoxicol. 2010, 32, 357–363. [Google Scholar] [CrossRef] [PubMed]
- Tobari, A.; Teshima, M.; Koyanagi, J.; Kawase, M.; Miyamae, H.; Yoza, K.; Takasaki, A.; Nagamura, Y.; Saito, S. Spirostanols obtained by cyclization of pseudosaponin derivatives and comparison of anti-platelet agglutination activities of spirostanol glycosides. Eur. J. Med. Chem. 2008, 22, 511–527. [Google Scholar]
- Kang, Y.J.; Chung, H.J.; Nam, J.W.; Park, H.J.; Seo, E.K.; Kim, Y.S.; Lee, D.; Lee, S.K. Cytotoxic and antineoplastic activity of timosaponin A-III for human colon cancer cells. J. Nat. Prod. 2011, 74, 701–706. [Google Scholar]
- Nakashima, N.; Kimura, I.; Kimura, M.; Matsuura, H. Isolation of pseudoprototimosaponin AIII from rhizomes of Anemarrhena asphodeloides and its hypoglycemic activity in streptozotocin-induced diabetic mice. J. Nat. Prod. 1993, 56, 345–350. [Google Scholar] [CrossRef] [PubMed]
- Kaname, N.; Zhang, J.; Meng, Z.; Xu, S.; Sugahara, K.; Doi, Y.; Kodama, H. Effect of timosaponin E1 and E2 on superoxide generation induced by various stimuli in human neutrophils and on platelet aggregation in human blood. Clin. Chim. Acta 2000, 295, 129–140. [Google Scholar] [CrossRef]
- Li, Z.S.; Li, D.L.; Huang, J.; Ding, Y.; Ma, B.P.; Wang, S.Q. Investigations on the molecular mechanisms of saponins from Anemarrhena asphodeloides Bunge using oligonucleotide microarrays. Acta Pharm. Sin. 2003, 38, 496–500. [Google Scholar]
- Nian, H.; Qin, Y.P.; Chen, W.S.; Zhang, Q.Y.; Zheng, H.C. Protective effect of steroidal saponins from rhizome of Anemarrhena asphodeloides on ovariectomy-induced bone loss in rats. Acta Pharm. Sin. 2006, 27, 728–734. [Google Scholar] [CrossRef] [PubMed]
- Ni, Y.; Gong, X.G.; Lu, M.; Chen, H.M.; Wang, Y. Mitochondrial ROS burst as an early sign in sarsasapogenin-induced apoptosis in HepG2 cells. Cell Biol. Int. 2008, 32, 337–343. [Google Scholar] [CrossRef] [PubMed]
- Lee, B.; Jung, K.K.; Kim, D.H. Timosaponin AIII, A saponin isolated from Anemarrhena asphodeloides, ameliorates learning and memory deficits in mice. Pharmacol. Biochem. Behav. 2009, 93, 121–127. [Google Scholar] [CrossRef] [PubMed]
- Lu, W.Q.; Qiu, Y.; Li, T.J.; Tao, X.; Sun, L.N.; Chen, W.S. Timosaponin B-II inhibits pro-inflammatory cytokine induction by lipopolysaccharide in BV2 cells. Arch. Pharm. Res. 2009, 32, 1301–1308. [Google Scholar] [CrossRef] [PubMed]
- Li, X.; Cui, X.; Sun, X.; Li, X.; Zhu, Q.; Li, W. Mangiferin prevents diabetic nephropathy progression in streptozotocin-induced diabetic rats. Phytother. Res. 2010, 24, 893–899. [Google Scholar] [CrossRef] [PubMed]
- Jo, Y.H.; Kim, S.B.; Ahn, J.H.; Liu, Q.; Hwang, B.Y.; Lee, M.K. Inhibitory activity of benzophenones from Anemarrhena asphodeloides on pancreatic lipase. Nat. Prod. Commun. 2013, 8, 481–483. [Google Scholar] [PubMed]
- Nian, L.H.; Qin, M.J. Advances in studies on chemical resources and pharmacological research in Anemarrhena asphodeloide. Chin. Wild Plant Resour. 2005, 24, 16–21. [Google Scholar]
- Youn, U.J.; Lee, Y.J.; Jeon, H.R.; Shin, H.J.; Son, Y.M.; Nam, J.W.; Han, A.R.; Seo, E.K. A pyridyl alkaloid and benzoic acid derivatives from the rhizomes of Anemarrhena asphodeloides. Nat. Prod. Sci. 2010, 16, 203–206. [Google Scholar]
- Takahashi, M.; Konno, C.; Hikino, H. Isolation and hypoglycemic activity of anemarans A, B, C and D, glycans of Anemarrhena asphodeloides rhizomes. Plant Med. 1985, 2, 100–102. [Google Scholar] [CrossRef] [PubMed]
- Wang, L.; Wang, X.; Yuan, X.; Zhao, B. Simultaneous analysis of diosgenin and sarsasapogenin in Asparagus officinalis byproduct by thin-layer chromatography. Phytochem. Anal. 2011, 22, 14–17. [Google Scholar] [CrossRef] [PubMed]
- Liu, Y.S.; Chen, W.S.; Qiao, C.Z.; Zhao, N.Z. Determination of sarsasapogenin in Anemarrhena asphodeloides Bunge by GC. Zhongguo Zhong Yao Za Zhi 1999, 09, 42–43. [Google Scholar]
- Sun, Y.G.; Du, Y.F.; Liu, Y.; Chang, L.; Ren, Y.P.; Cao, L.; Sun, Q.; Shi, X.W.; Wang, Q.; Zhang, L.T. Simultaneous determination of nine components in Anemarrhena asphodeloides by liquid chromatography–tandem mass spectrometry combined with chemometric techniques. J. Sep. Sci. 2012, 35, 1796–1807. [Google Scholar] [CrossRef] [PubMed]
- Kite, G.C.; Porter, E.A.; Simmonds, M.S.J. Chromatographic behaviour of steroidal saponins studied by high-performance liquid chromatography-mass spectrometry. J. Chromatogr. A 2007, 1148, 177–183. [Google Scholar] [CrossRef] [PubMed]
- Cai, F.; Xu, W.; Wei, H.; Sun, L.N.; Gao, S.H.; Yang, Q.; Feng, J.; Zhang, F.; Chen, WS. Simultaneous determination of active xanthone glycosides, timosaponins and alkaloids in rat plasma after oral administration of Zi-Shen Pill extract for the pharmacokinetic study by liquid chromatography–tandem mass spectrometry. J. Chromatogr. B 2010, 878, 1845–1854. [Google Scholar] [CrossRef] [PubMed]
- Cai, F.; Sun, L.N.; Gao, S.H.; Yang, Y.; Yang, Q.; Chen, W.S. A rapid and sensitive liquid chromatography–tandem mass spectrometric method for the determination of timosaponin B-II in blood plasma and a study of the pharmacokinetics of saponin in the rat. J. Pharm. Biomed. Anal. 2008, 48, 1411–1416. [Google Scholar] [CrossRef] [PubMed]
- Liu, Z.R.; Qin, W.X.; Zhu, Z.Y.; Liu, Y.; Sun, F.J.; Chai, Y.F.; Xia, P.Y. Development and validation of liquid chromatography–tandem mass spectrometry method for simultaneous determination of six steroidal saponins in rat plasma and its application to a pharmacokinetics study. Steroids 2015, 96, 21–29. [Google Scholar]
- Zhang, X.; Zhang, D.; Xu, J.; Gu, J.; Zhao, Y. Determination of 25-OH-PPD in rat plasma by high-performance liquid chromatography–mass spectrometry and its application in rat pharmacokinetic studies. J. Chromatogr. B 2007, 858, 65–70. [Google Scholar] [CrossRef] [PubMed]
- Zhou, H. Pharmacokinetic Strategies in Deciphering Atypical Drug Absorption Profiles. J. Clin. Pharmacol. 2003, 43, 211–227. [Google Scholar] [CrossRef] [PubMed]
- Wang, J.; Liu, J.H.; Guo, X.; Zhang, J.; Yu, B.Y. A sensitive indirect competitive enzyme-linked immunosorbent assay for the detection of sarsasapogenin in rat plasma. Acta Pharmacol. Sin. 2010, 31, 984–989. [Google Scholar] [CrossRef] [PubMed]
- Liu, Z.R.; Dong, X.; Ding, X.; Chen, X.F.; Lv, L.; Li, Y.Y.; Chai, Y.F. Comparative pharmacokinetics of timosaponin B-II and timosaponin A-III after oral administration of Zhimu–Baihe herb-pair, Zhimu extract, free timosaponin B-II and free timosaponin A-III to rats. J. Chromatogr. B 2013, 926, 28–35. [Google Scholar] [CrossRef] [PubMed]
- Sample Availability: Samples of the compounds are available from the authors.
© 2015 by the authors. Licensee MDPI, Basel, Switzerland. This article is an open access article distributed under the terms and conditions of the Creative Commons Attribution license ( http://creativecommons.org/licenses/by/4.0/).
Share and Cite
Tang, Z.; Li, G.; Yang, J.; Duan, J.; Qian, D.; Guo, J.; Zhu, Z.; Song, Z. Anemarrhena asphodeloides Non-Steroidal Saponin Components Alter the Pharmacokinetic Profile of Its Steroidal Saponins in Rat. Molecules 2015, 20, 11777-11792. https://doi.org/10.3390/molecules200711777
Tang Z, Li G, Yang J, Duan J, Qian D, Guo J, Zhu Z, Song Z. Anemarrhena asphodeloides Non-Steroidal Saponin Components Alter the Pharmacokinetic Profile of Its Steroidal Saponins in Rat. Molecules. 2015; 20(7):11777-11792. https://doi.org/10.3390/molecules200711777
Chicago/Turabian StyleTang, Zhishu, Guolong Li, Jie Yang, Jinao Duan, Dawei Qian, Jianming Guo, Zhenhua Zhu, and Zhongxing Song. 2015. "Anemarrhena asphodeloides Non-Steroidal Saponin Components Alter the Pharmacokinetic Profile of Its Steroidal Saponins in Rat" Molecules 20, no. 7: 11777-11792. https://doi.org/10.3390/molecules200711777
APA StyleTang, Z., Li, G., Yang, J., Duan, J., Qian, D., Guo, J., Zhu, Z., & Song, Z. (2015). Anemarrhena asphodeloides Non-Steroidal Saponin Components Alter the Pharmacokinetic Profile of Its Steroidal Saponins in Rat. Molecules, 20(7), 11777-11792. https://doi.org/10.3390/molecules200711777