2.1. Comparative Label-Free Mass Spectrometric Analysis of mdx Skeletal Muscles
In order to identify common proteomic markers that exhibit a changed concentration in differently affected
mdx skeletal muscles, total extracts from diaphragm (DIA),
soleus (SOL),
extensor digitorum longus (EDL),
flexor digitorum brevis (FDB), and
interosseus (INT) muscles were analysed by label-free mass spectrometry.
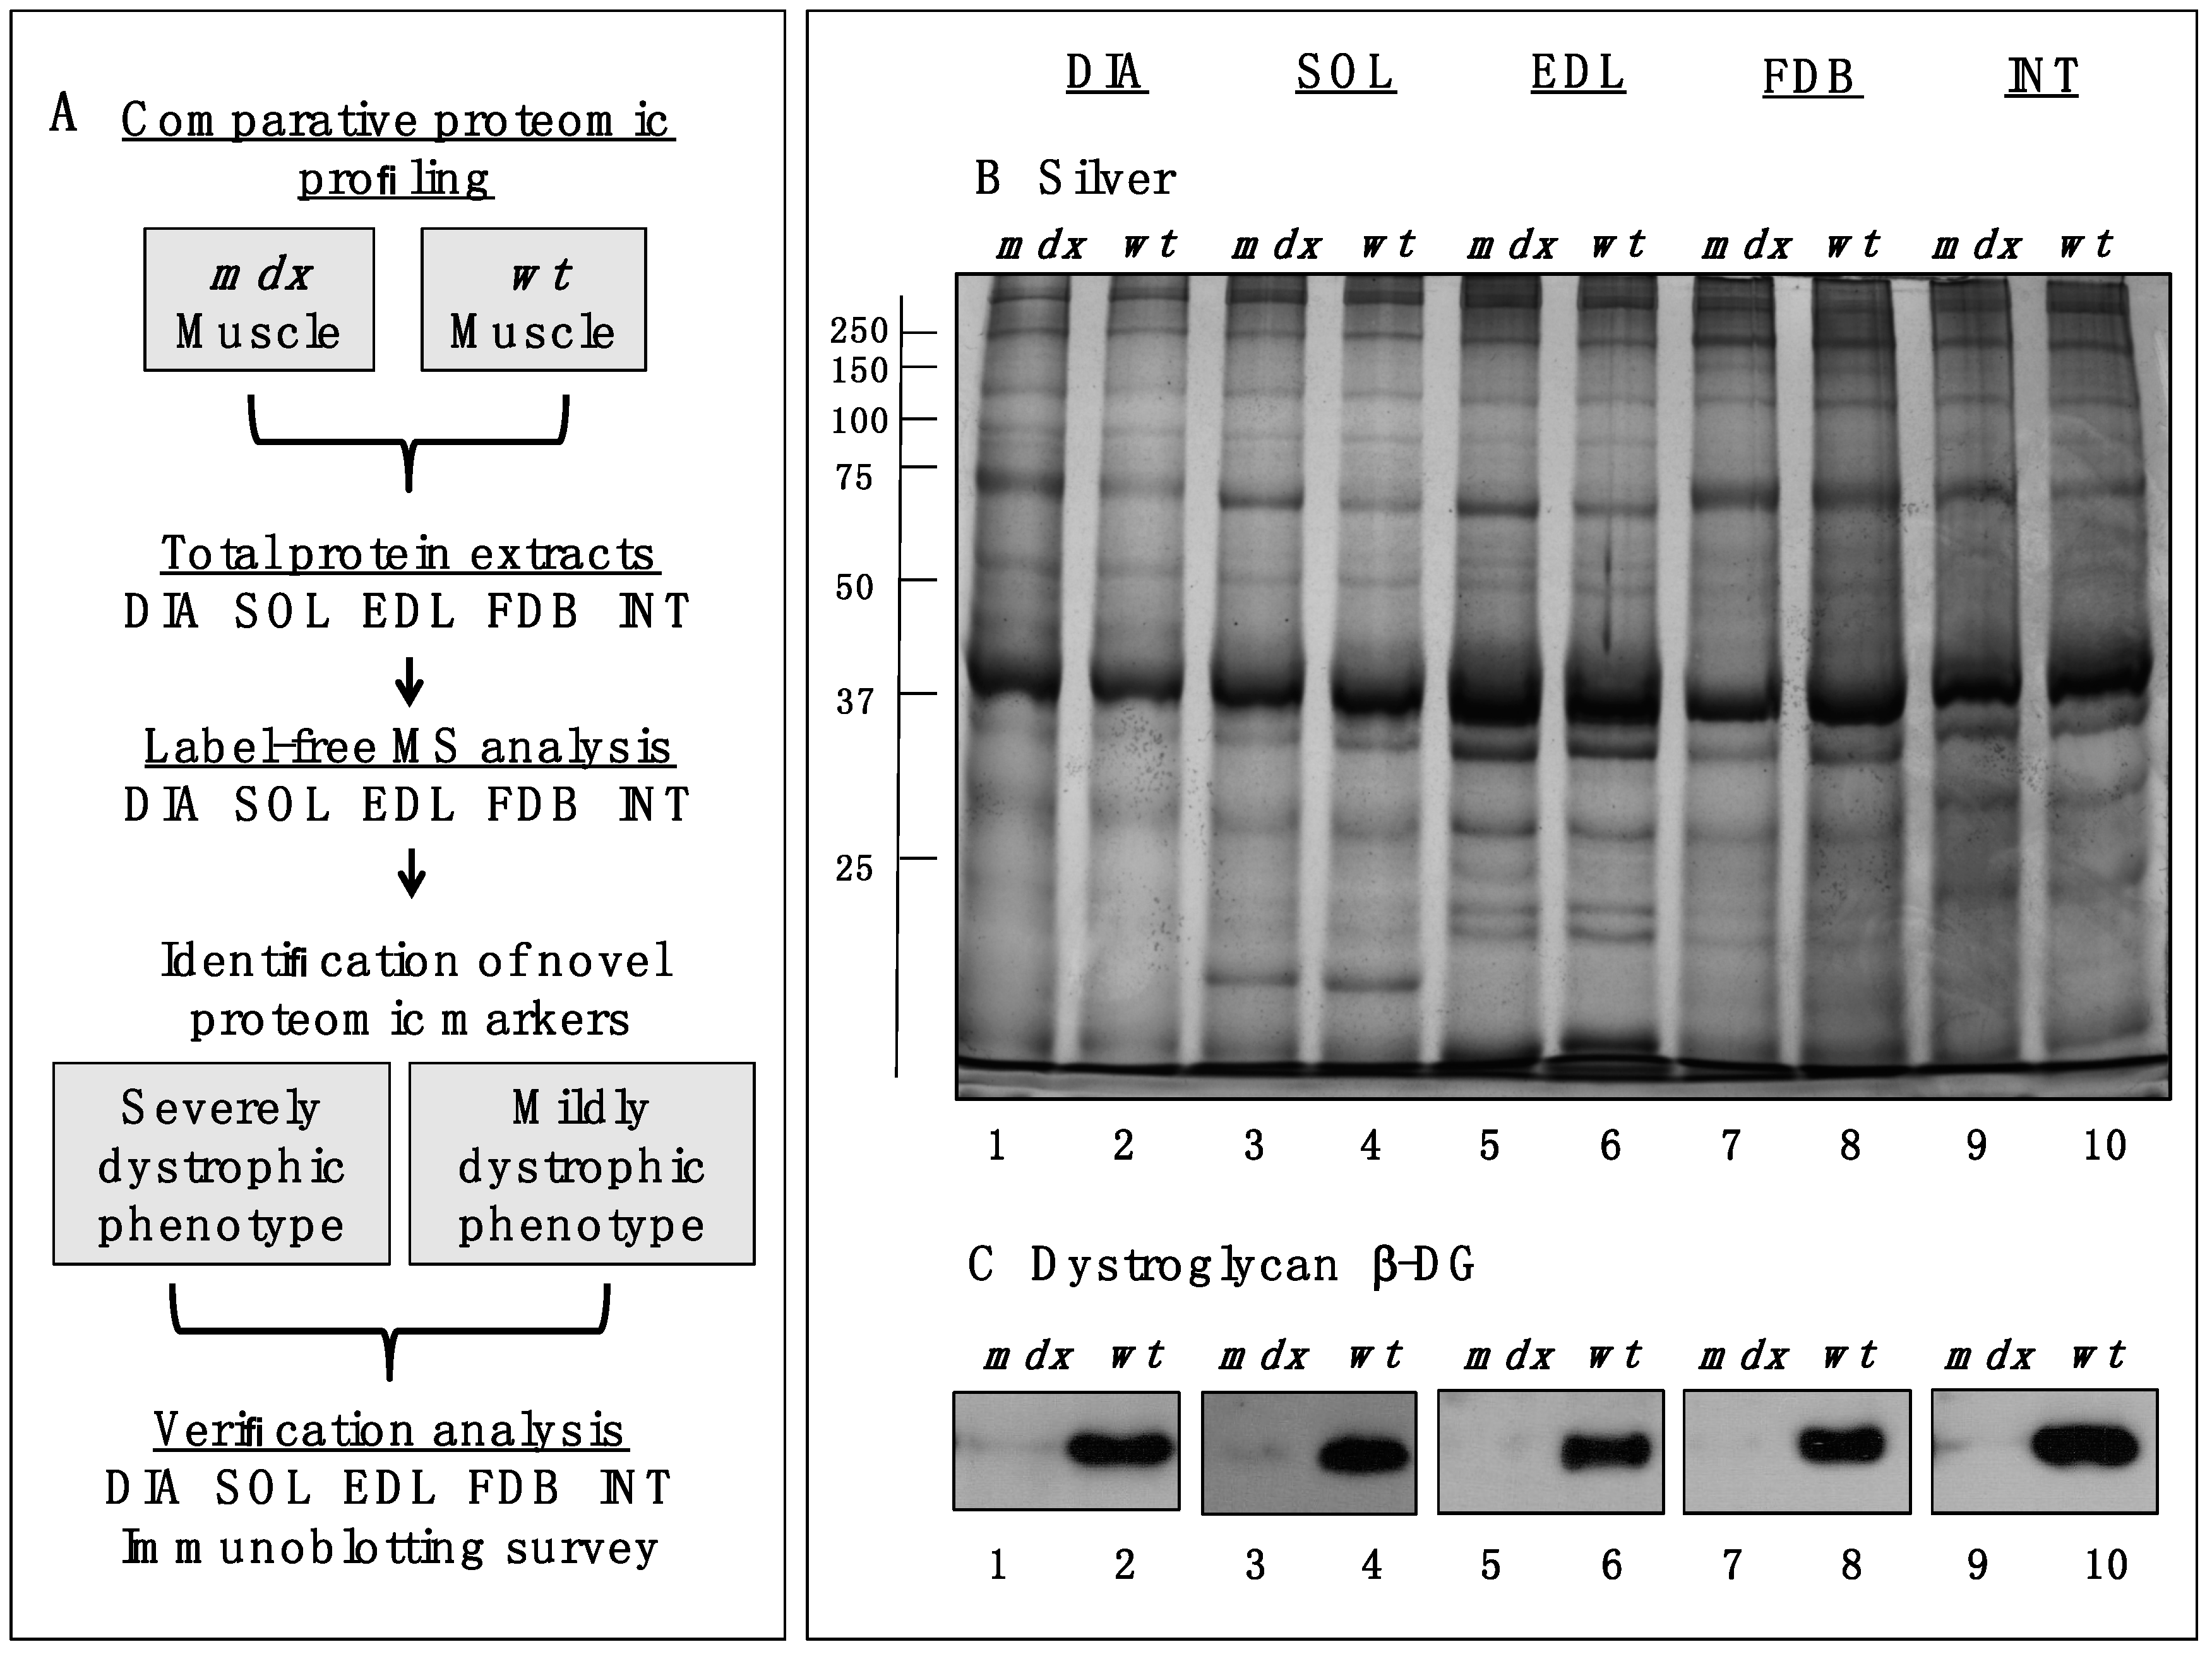
Figure 1A,B outlines the workflow of this analytical strategy and shows a representative silver-stained gel of the various preparations used in this study. The immunoblot analysis of β-dystroglycan demonstrated a drastic reduction of this dystrophin-associated glycoprotein of 43 kDa in all
mdx muscles investigated (
Figure 1C) [
29,
30]. The below displayed
Table 1 to
Table 5 list the results for each analysed skeletal muscle detailing the accession numbers of identified proteins, the number of peptides used in the analysis, the MS scores, ANOVA values and the fold change. The comparative study revealed an altered abundance in 35, 16, 18, 23 and 14 proteins in DIA, SOL, EDL, FDB and INT preparations, respectively. The total number of positively identified proteins in wild type DIA, SOL, EDL, FDB, and INT was 296 ± 17, 270 ± 13, 202 ± 11, 207 ± 7 and 215 ± 4, respectively, and in
mdx DIA, SOL, EDL, FDB and INT was 348 ± 20, 289 ± 4, 218 ± 6, 222 ± 11 and 235 ± 16, respectively. The comparison of the differences in the number of changes between individual subtypes of muscles and total numbers of identified proteins suggests, therefore, that the observed effects are mostly based on pathobiochemical variations and not technical issues associated with sample preparation. The direct comparison of proteomic findings related to the most severely affected DIA muscle
vs. mildly dystrophic INT muscle illustrates this conclusion. Although 1.4-fold more protein species were overall identified in DIA preparations, the rate of changes in DIA muscle is 2.5 fold higher as compared to INT preparations (
Table 1 and
Table 5). This indicates that the variation in the number of changes between individual muscle subtypes is due to biological effects rather than technical matters.
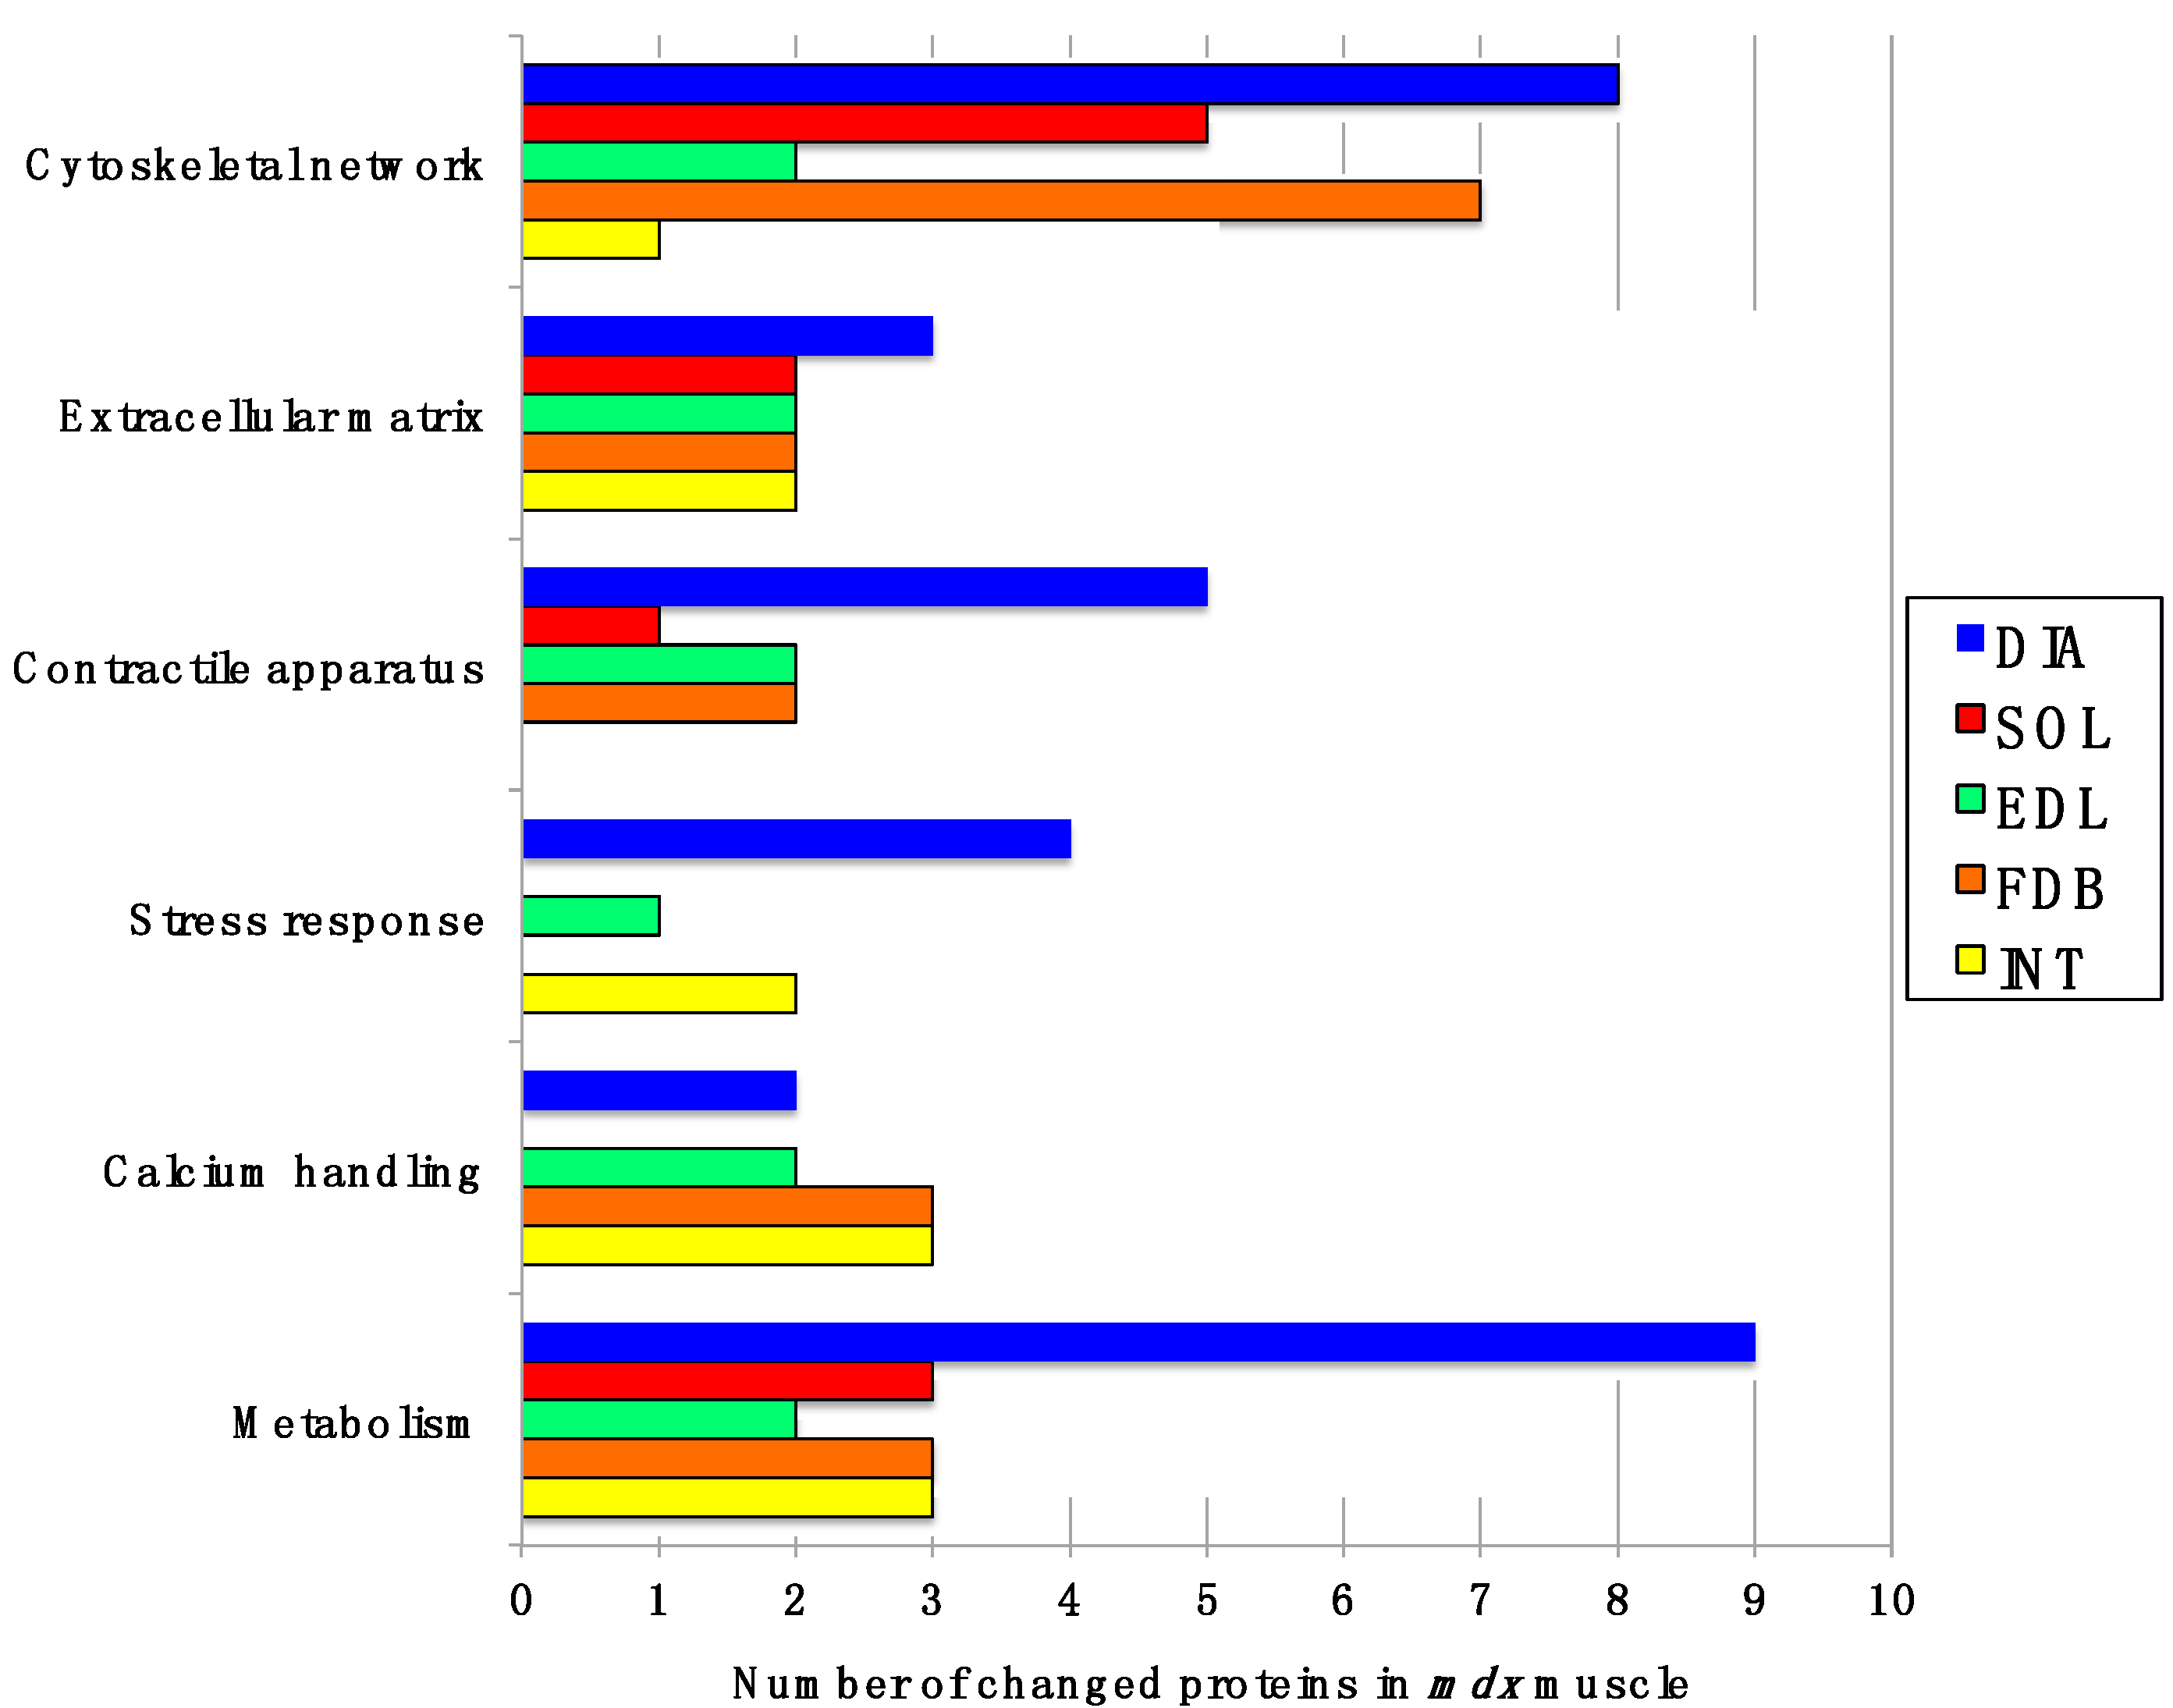
Figure 2 gives an overview of the number of changed proteins in individual
mdx muscles and their association with distinct functional families, such as the cytoskeleton, the extracellular matrix, the contractile apparatus, the cellular stress response, Ca
2+-homeostasis and metabolism. As can be deduced from
Figure 2 and
Table 1, the
mdx DIA muscle showed both quantitatively and qualitatively the largest secondary changes due to deficiency in dystrophin. Changed expression levels were shown for proteins mostly involved in fibre contraction, energy metabolism, metabolite transportation, the cytoskeleton, the extracellular matrix and the cellular stress response.
Figure 1.
Comparative profiling of wild type (wt) muscles vs. dystrophic diaphragm (DIA), soleus (SOL), extensor digitorum longus (EDL), flexor digitorum brevis (FDB), and interosseus (INT) muscles from the mdx animal model of Duchenne muscular dystrophy. (A) Workflow of the comparative proteomic analysis of normal vs. dystrophic skeletal muscles; (B) Silver-stained gel of the mdx and wt preparations from DIA (lanes 1 and 2), SOL (lanes 3 and 4), EDL (lanes 5 and 6), FDB (lanes 7 and 8), and INT (lanes 9 and 10) muscles; (C) Comparative immunoblot analysis of β-dystroglycan showing antibody labelling of this dystrophin-associated glycoprotein of 43 kDa in normal vs. dystrophic muscles.
Figure 2.
Diagrammatic presentation of the number of changed proteins in dystrophic diaphragm (DIA), soleus (SOL), extensor digitorum longus (EDL), flexor digitorum brevis (FDB), and interosseus (INT) muscles from the mdx animal model of Duchenne muscular dystrophy. The graph outlines affected functional protein families associated with the cytoskeleton, the extracellular matrix, the contractile apparatus, the cellular stress response, Ca2+-handling and metabolism.
2.2. Proteomic Analysis of mdx Diaphragm Muscle
As listed in
Table 1, 28 proteins exhibited an increased concentration and 7 proteins a decreased abundance in dystrophic DIA muscle preparations. Overall, our analysis identified 103 changed DIA proteins including those that were recognized only by one peptide (not shown). The most drastically elevated expression levels with values of 2-fold or higher were established for myosin-8, myosin-3, protein disulphide isomerase, lamin-A/C, myosin light chain 6B, vimentin, obscurin, annexin A5, hemopexin, the collagen alpha-1(VI) and alpha-2(VI) chains, lamin-B1, histone H3.2, moesin, albumin, tubulin, and the 78 kDa glucose-regulated protein. Myosin heavy chain isoforms myosin-3 and myosin-8 are embryonic isoforms and important markers of skeletal muscle regeneration. Their substantially increased concentration suggests both fibre regeneration and the compensatory re-organization of myofibrils within dystrophic fibres. The perinatal myosin-8 isoform has been identified in mature skeletal muscles by shotgun proteomics [
31] and its elevated levels in the
mdx diaphragm suggests the potential recruitment of new myofibre populations containing embryonic isoforms of myosin heavy chains. Importantly, high levels of the intermediate filament protein vimentin in
mdx diaphragm muscle were also previously described to occur in EDL, FDB, GAS (
gastrocnemius), INT, SOL, and VL (
vastus lateralis) muscles from various dystrophin-deficient mouse and dog models of X-linked muscular dystrophy [
21,
23,
24,
25,
32,
33,
34,
35,
36]. This establishes this protein as an interesting biomarker candidate that might be extremely helpful to evaluate animal models of dystrophinopathy. Changes in annexins, such as isoforms A1, A2, A5, or A6, are also an established alteration in dystrophic muscle tissues [
25,
33,
37,
38]. The specific increase in annexin A5 in the 100-day old
mdx diaphragm agrees with the proteomic profiling of the senescent
mdx diaphragm muscle by two-dimensional fluorescence difference in-gel electrophoresis [
37] and the six-month old
mdx hind limb muscles using standard two-dimensional gel electrophoresis combined with silver staining [
38].
Moderately increased levels, ranging from approximately 1.5- to 2-fold change, were shown for transferrin, filamin-C, histone H1.2, elongation factor EEF2, the heat shock proteins Hsp90-beta, Hsp71 cognate and Hsp beta-1, the SERCA2 isoform of the sarcoplasmic reticulum Ca
2+-ATPase, desmin, vinculin, and anti-trypsin. Decreased proteins were identified as the muscle-specific isoform of glycogen phosphorylase, mitochondrial 3-ketoacyl-CoA thiolase, medium-chain specific acyl-CoA dehydrogenase, myozenin, myoglobin, parvalbumin, and carbonic anhydrase isoform CA3. In analogy to this study, a variety of molecular chaperones belonging to the Hsp70 and Hsp90 families of heat shock proteins [
27] were also identified in gel-based studies of dystrophic muscles [
23,
37,
39].
Table 1.
List of changed proteins in 100-day old mdx diaphragm muscle vs. age-matched wild type muscle as determined by label-free mass spectrometric analysis.
Table 1.
List of changed proteins in 100-day old mdx diaphragm muscle vs. age-matched wild type muscle as determined by label-free mass spectrometric analysis.
| Accession Number | Protein Name | Tissue Localization | Peptides | Score | ANOVA (p) | Fold Change |
|---|
| P13542 | Myosin-8 (perinatal MHC) | Myofibrils (myosin complex) | 3 | 518.76 | 1.88 × 10⁻⁵ | 798.68 |
| P13541 | Myosin-3 (embryonic MHC-3) | Myofibrils (myosin complex) | 2 | 345.71 | 1.13 × 10⁻⁵ | 84.52 |
| P09103 | Protein disulfide-isomerase | Endoplasmic reticulum | 2 | 154.39 | 1.39 × 10⁻⁵ | 3.35 |
| P48678 | Prelamin-A/C | Nuclear lamina | 8 | 511.85 | 2.87 × 10⁻⁷ | 3.31 |
| Q8CI43 | Myosin light chain 6B | Myofibrils (myosin complex) | 3 | 142.05 | 1.16 × 10⁻⁵ | 3.31 |
| P20152 | Vimentin | Intermediate filaments | 5 | 434.45 | 1.90 × 10⁻⁵ | 3.10 |
| A2AAJ9 | Obscurin | Contractile apparatus | 2 | 145.90 | 5.47 × 10⁻⁵ | 2.97 |
| P48036 | Annexin A5 | Sarcolemma region | 2 | 137.12 | 4.69 × 10⁻⁴ | 2.67 |
| Q91X72 | Hemopexin | Extracellular space | 2 | 94.70 | 1.03 × 10⁻⁴ | 2.62 |
| Q02788 | Collagen alpha-2(VI) chain | Extracellular matrix | 5 | 266.91 | 5.40 × 10⁻⁴ | 2.31 |
| P14733 | Lamin-B1 | Nuclear envelope | 2 | 127.83 | 5.32 × 10⁻⁵ | 2.23 |
| Q6LBE8 | Histone H3.2 | Nucleus | 2 | 149.87 | 1.23 × 10⁻³ | 2.20 |
| P26041 | Moesin | Cytoskeleton/sarcolemma | 2 | 113.60 | 4.09 × 10⁻⁴ | 2.18 |
| P07724 | Serum albumin | Extracellular space | 3 | 176.70 | 3.07 × 10⁻³ | 2.15 |
| Q04857 | Collagen alpha-1(VI) chain | Extracellular matrix | 5 | 305.12 | 4.35 × 10⁻⁴ | 2.12 |
| Q7TMM9 | Tubulin beta-2A chain | Microtubules | 3 | 188.58 | 2.56 × 10⁻⁴ | 2.05 |
| P20029 | 78 kDa glucose-regulated protein | Endoplasmic reticulum | 3 | 145.99 | 4.79 × 10⁻⁴ | 2.00 |
| Q921I1 | Serotransferrin | Extracellular space | 5 | 257.43 | 6.48 × 10⁻⁵ | 1.99 |
| Q8VHX6 | Filamin-C | Actin cytoskeleton | 16 | 1111.06 | 5.07 × 10⁻⁷ | 1.93 |
| P15864 | Histone H1.2 | Nucleus | 2 | 128.46 | 8.47 × 10⁻³ | 1.88 |
| P58252 | Elongation factor 2 | Cytoplasm/ribosome | 5 | 286.21 | 2.42 × 10⁻⁵ | 1.87 |
| P11499 | Heat shock protein Hsp90-beta (HSPAB1) | Cytoplasm | 5 | 285.81 | 6.42 × 10⁻⁵ | 1.86 |
| P63017 | Heat shock cognate 71 kDa protein (HSPA8, Hsc70) | Cytoplasm | 4 | 294.22 | 5.69 × 10⁻⁴ | 1.77 |
| P14602 | Heat shock protein beta-1 (HSPB1, Hsp27) | Cytoplasm | 2 | 114.96 | 2.04 × 10⁻⁴ | 1.77 |
| O55143 | SERCA2 Ca2+-ATPase | Sarcoplasmic reticulum | 2 | 106.96 | 3.43 × 10⁻² | 1.72 |
| P31001 | Desmin | Intermediate filaments | 6 | 478.06 | 1.41 × 10⁻⁴ | 1.71 |
| Q64727 | Vinculin | Cytoskeleton | 2 | 145.57 | 7.51 × 10⁻⁴ | 1.68 |
| Q00897 | Alpha-1-antitrypsin 1-4 | Extracellular region | 3 | 148.95 | 1.47 × 10⁻⁶ | 1.63 |
| Q9WUB3 | Glycogen phosphorylase, muscle | Cytoplasm | 7 | 418.32 | 1.10 × 10⁻³ | −1.51 |
| Q8BWT1 | 3-ketoacyl-CoA thiolase, mitochondrial | Mitochondrion | 2 | 107.43 | 6.21 × 10⁻³ | −1.55 |
| P45952 | Medium-chain specific acyl-CoA dehydrogenase | Mitochondrial matrix | 2 | 112.72 | 4.60 × 10⁻⁴ | −1.56 |
| Q9JK37 | Myozenin-1 | Actin cytoskeleton | 2 | 96.43 | 1.24 × 10⁻³ | −1.97 |
| P04247 | Myoglobin | Cytoplasm | 3 | 144.52 | 3.35 × 10⁻⁴ | −2.73 |
| P32848 | Parvalbumin alpha | Cytoplasm | 4 | 255.00 | 6.93 × 10⁻⁴ | −2.83 |
| P16015 | Carbonic anhydrase CA3 | Cytoplasm | 3 | 192.85 | 3.38 × 10⁻⁴ | −3.76 |
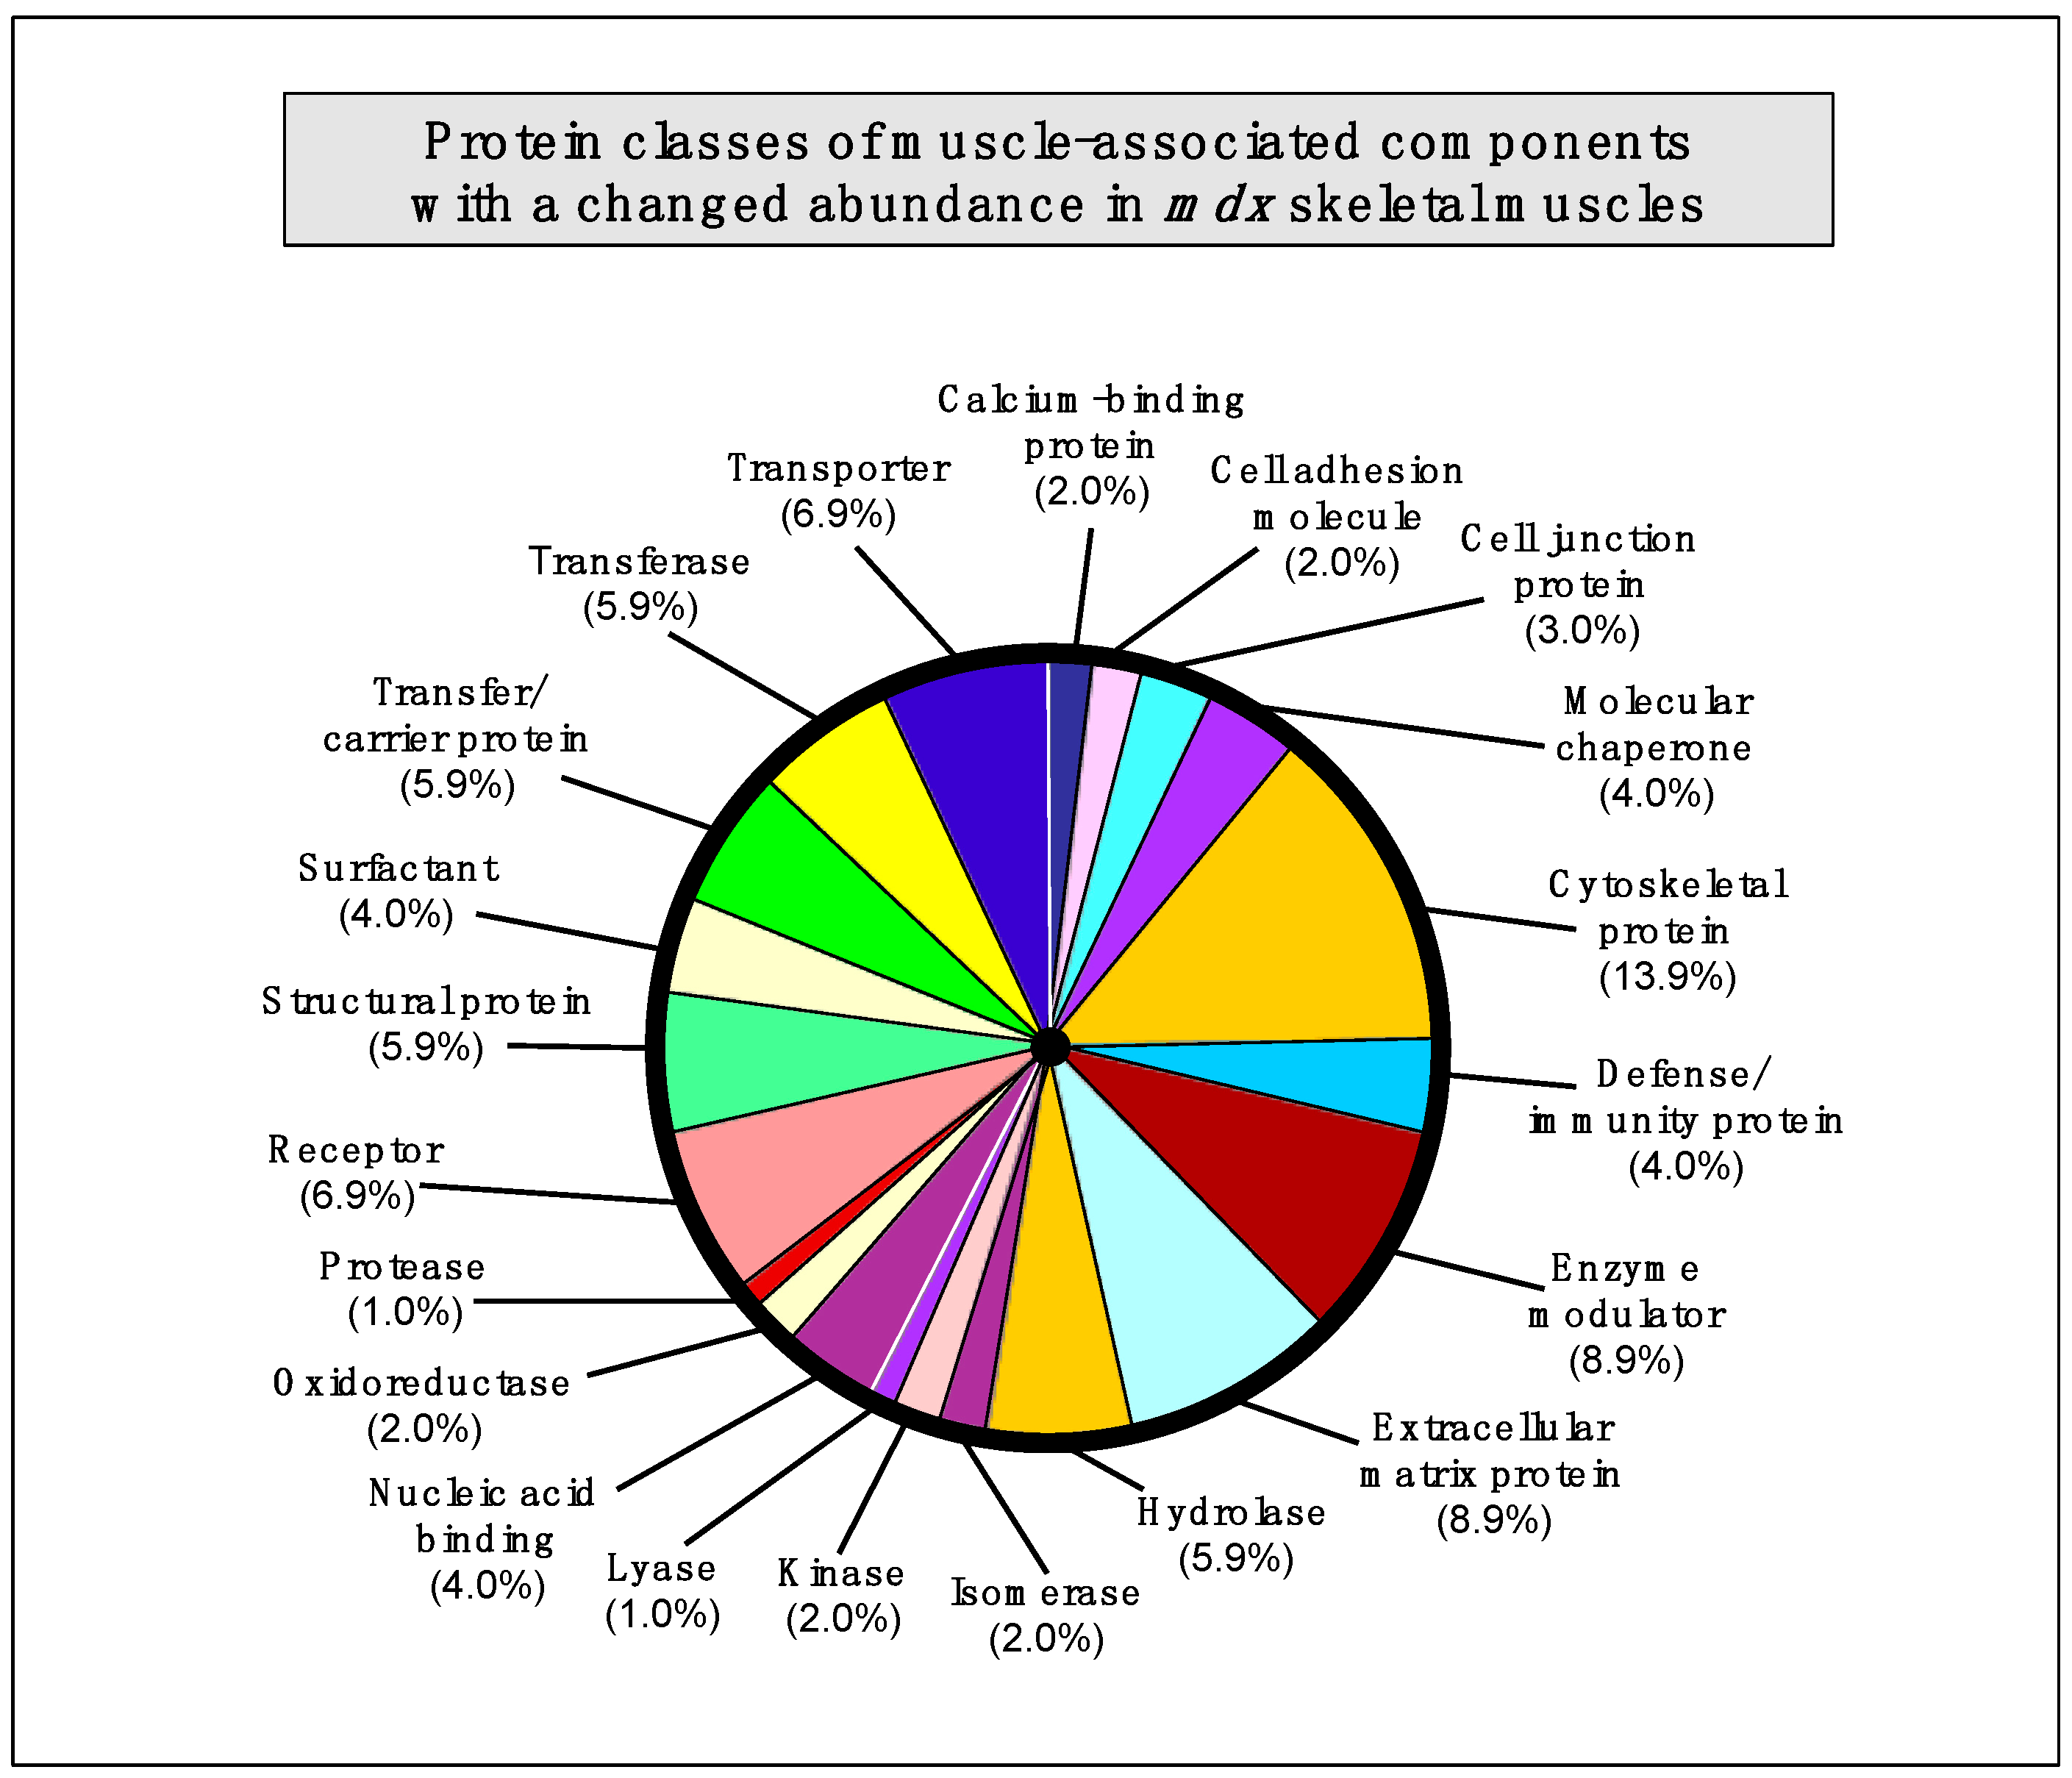
2.7. Summary of Protein Classes with a Changed Abundance in mdx Muscles
The bioinformatics analysis of altered proteins using the PANTHER database of protein families [
40] resulted in the cataloguing of distinct muscle protein categories that had been identified by label-free mass spectrometric analysis in the various
mdx tissues [
41] (
Figure 3).
Table 5.
List of changed proteins in 100-day old mdx interosseus muscle vs. age-matched wild type muscle as determined by label-free mass spectrometric analysis.
Table 5.
List of changed proteins in 100-day old mdx interosseus muscle vs. age-matched wild type muscle as determined by label-free mass spectrometric analysis.
| Accession Number | Protein Name | Tissue Localization | Peptides | Score | ANOVA (p) | Fold Change |
|---|
| P13541 | Myosin-3 (perinatal MHC) | Myofibrils (myosin complex) | 2 | 299.48 | 6.78 × 10⁻⁴ | 15.70 |
| P13542 | Myosin-4 (MHC-IIB) | Myofibrils (myosin complex) | 3 | 502.66 | 1.99 × 10⁻⁴ | 8.88 |
| P07356 | Annexin A2 | Sarcolemma/basal lamina | 2 | 120.25 | 6.70 × 10⁻⁵ | 2.88 |
| P20152 | Vimentin | Intermediate filaments | 4 | 293.05 | 1.26 × 10⁻³ | 2.82 |
| P48678 | Prelamin-A/C | Nuclear lamina | 11 | 736.17 | 1.43 × 10⁻³ | 2.56 |
| Q99MQ4 | Asporin | Extracellular matrix | 2 | 93.48 | 3.76 × 10⁻³ | 2.53 |
| P10126 | Elongation factor 1-alpha 1 | Cytoplasm/ribosome | 2 | 87.24 | 3.21 × 10⁻³ | 2.27 |
| Q921I1 | Serotransferrin | Extracellular space | 3 | 167.69 | 7.26 × 10⁻³ | 2.05 |
| Q04857 | Collagen alpha-1(VI) chain | Extracellular matrix | 2 | 99.46 | 2.25 × 10⁻² | 1.86 |
| P28654 | Decorin | Extracellular matrix | 2 | 162.96 | 1.49 × 10⁻² | 1.79 |
| Q60854 | Serpin B6 | Cytoplasm | 2 | 113.51 | 3.31 × 10⁻³ | 1.66 |
| Q6PIE5 | Na+/K+-ATPase, alpha-2 subunit | Sarcolemma | 3 | 235.21 | 5.85 × 10⁻³ | −1.54 |
| Q8R429 | SERCA1 Ca2+-ATPase | Sarcoplasmic reticulum | 3 | 163.52 | 1.49 × 10⁻³ | −2.02 |
| Q91Z83 | Myosin-7 (cardiac MHC-β) | Myofibrils (myosin complex) | 6 | 528.44 | 1.84 × 10⁻² | −2.88 |
Figure 3.
Bioinformatic summary of changed protein classes in
mdx skeletal muscles, as determined by the software programme PANTHER [
40,
41]. The graph outlines the clustering of protein classes based on the label-free mass spectrometric analysis of normal
vs. dystrophic muscles (
Table 1,
Table 2,
Table 3,
Table 4,
Table 5).
The following protein classes exhibited a changed concentration: cytoskeletal protein (13.9%), extracellular matrix protein (8.9%), enzyme modulator (8.9%), enzyme modulator (8.9%), transporter (6.9%), receptor (6.9%), transferase (5.9%), structural protein (5.9%), hydrolase (5.9%), transfer/carrier protein (5.9%), nucleic acid binding protein (4.0%), molecular chaperone (4%), surfactant (4.0%), defense/immunity protein (4.0%), cell junction protein (3.0%), cell adhesion molecule (2.0%), calcium-binding protein (2.0%), cell adhesion molecule (2.0%), oxidoreductase (2.0%), kinase (2%), isomerase (2%), protease (1.0%), and lyase (1.0%).
2.8. Identification of Universal Markers of Dystrophinopathy
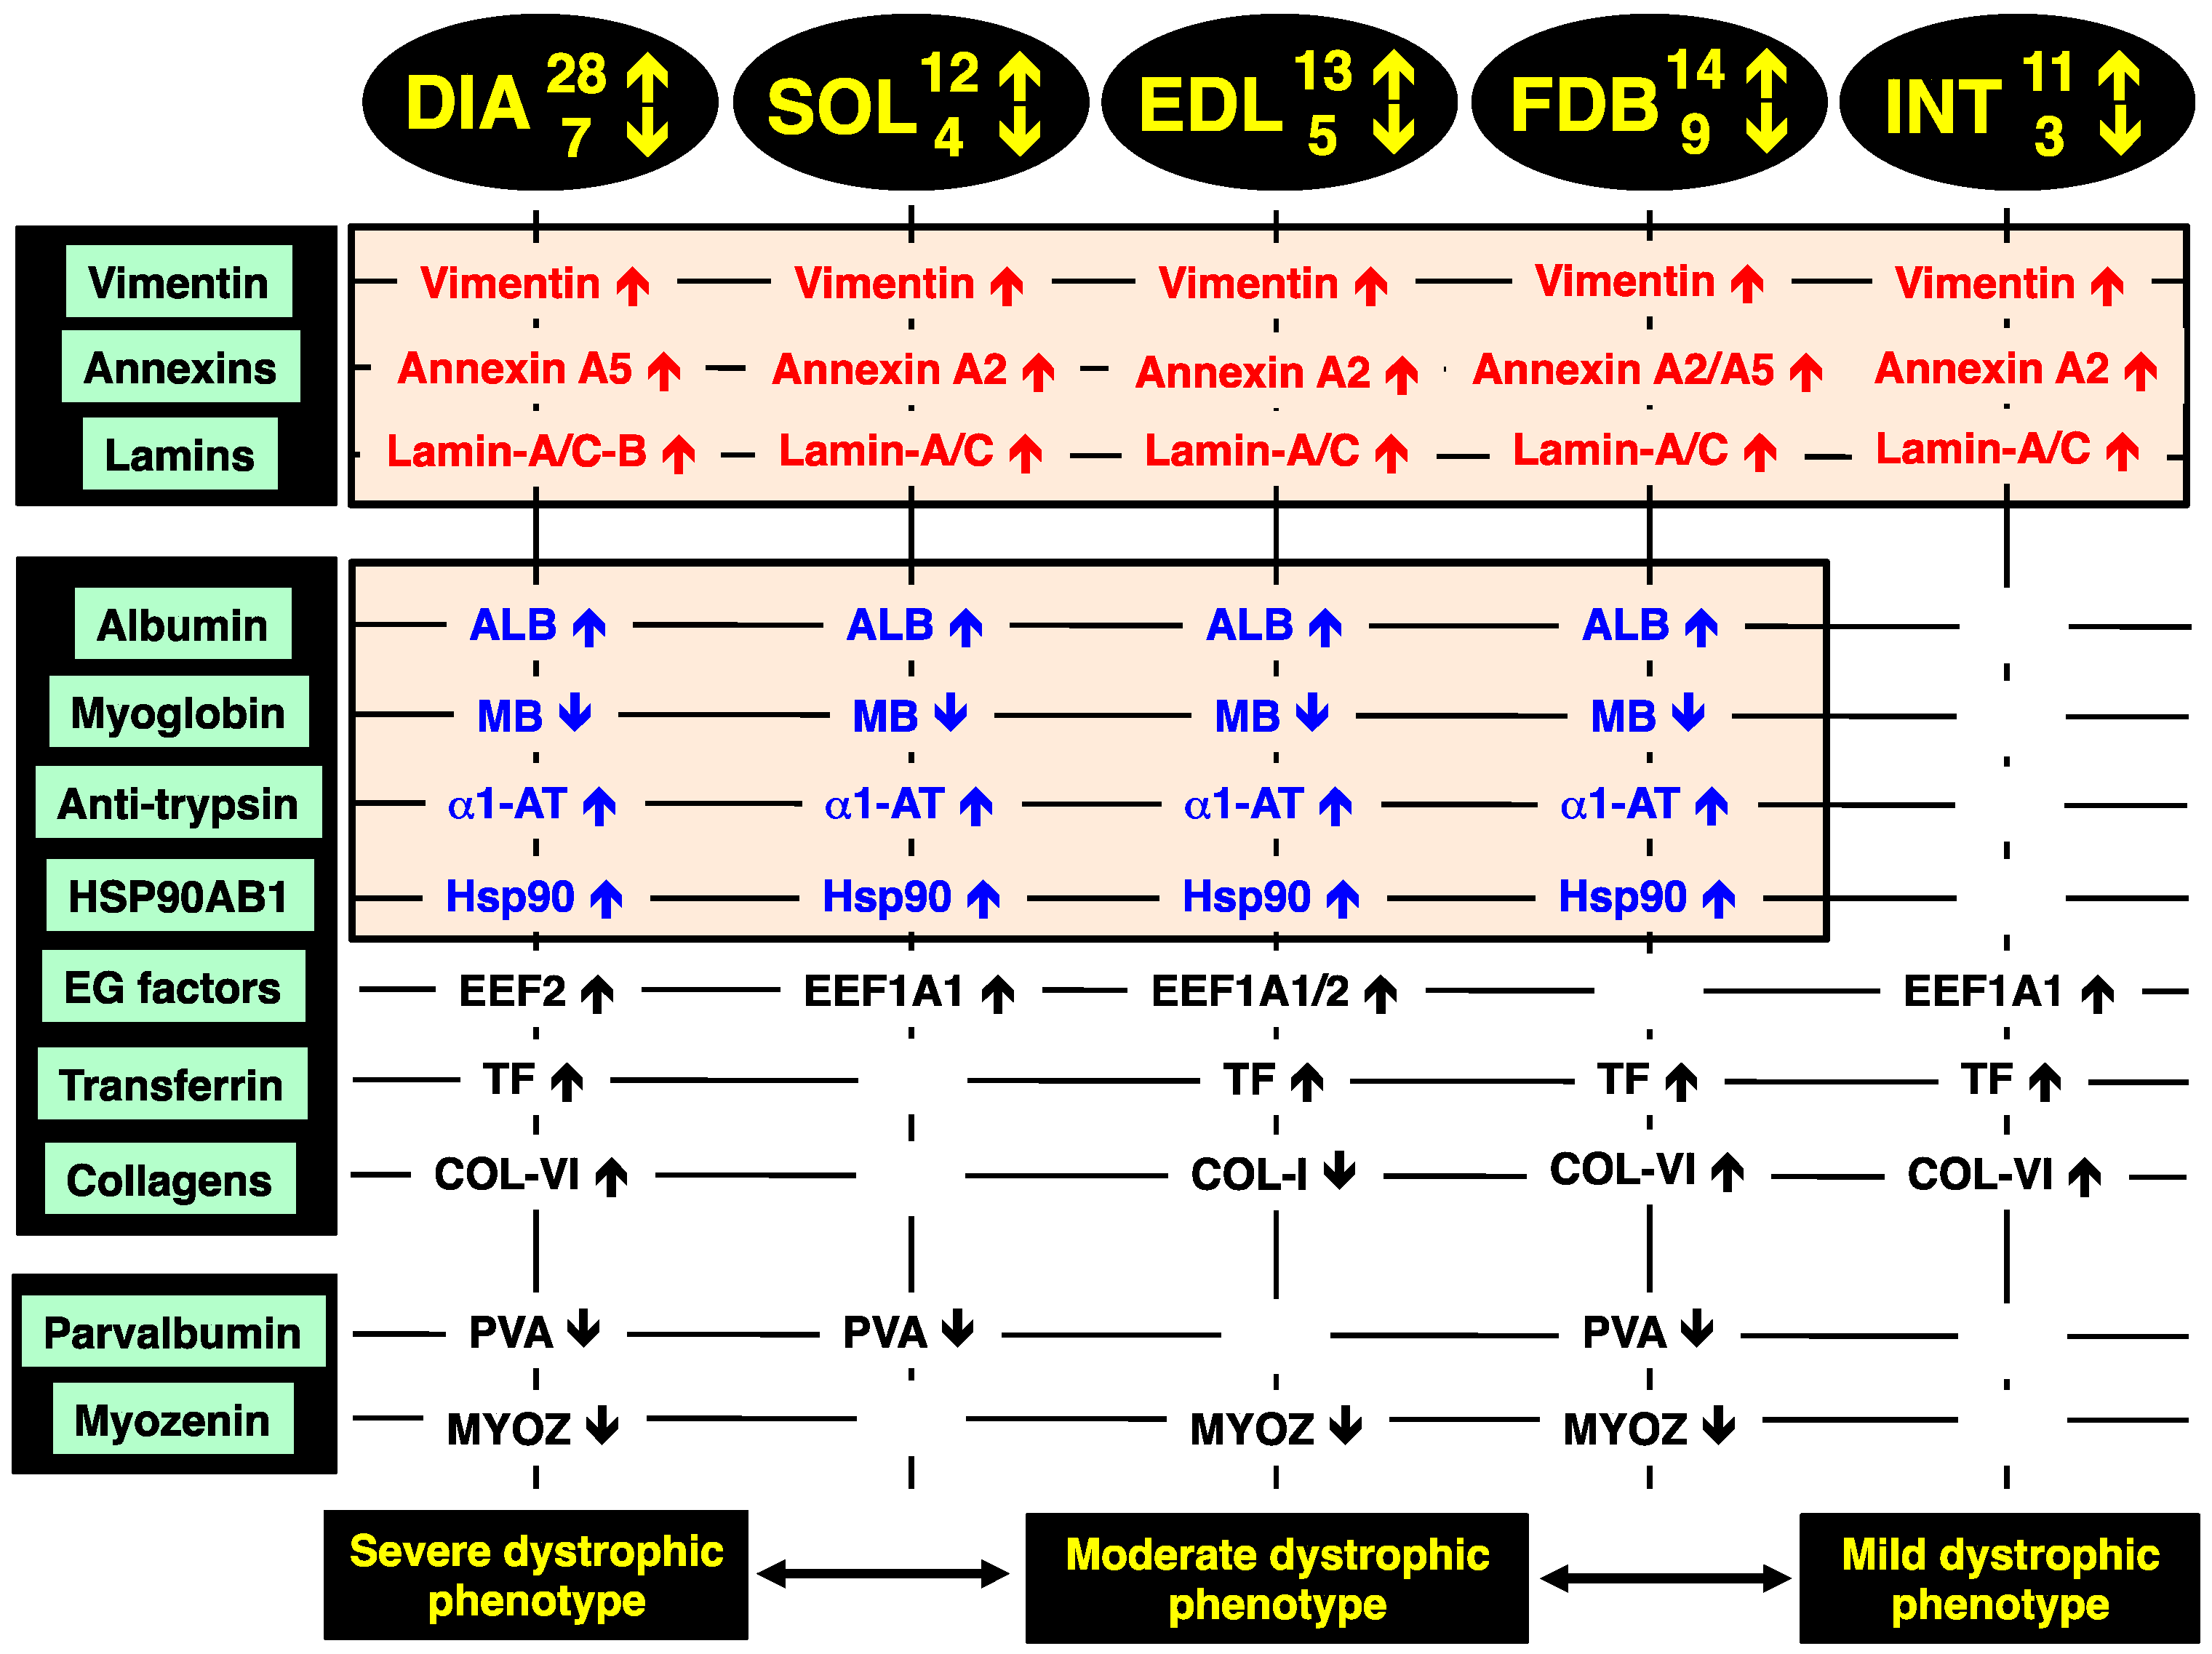
The comparison of the proteomic data sets revealed that 3 protein species show similar changes in all dystrophic tissue specimens investigated in this study,
i.e., a significant increase in the intermediate filament protein vimentin, the Ca
2+-dependent membrane binding protein annexin (isoforms A2, A5), and the nuclear envelope protein lamin (isoforms A/C, B). These new universal biomarker candidates are summarised in
Figure 4.
Figure 4.
Overview of the universal biomarker signature of dystrophic diaphragm (DIA), soleus (SOL), extensor digitorum longus (EDL), flexor digitorum brevis (FDB), and interosseus (INT) muscles from the mdx animal model of Duchenne muscular dystrophy, as revealed by label-free mass spectrometry.
Figure 4.
Overview of the universal biomarker signature of dystrophic diaphragm (DIA), soleus (SOL), extensor digitorum longus (EDL), flexor digitorum brevis (FDB), and interosseus (INT) muscles from the mdx animal model of Duchenne muscular dystrophy, as revealed by label-free mass spectrometry.
In addition, all investigated
mdx muscles, with the exception of INT preparations, showed analogous changes in four other muscle-associated proteins. Increases were demonstrated for albumin, anti-trypsin protein and the molecular chaperone Hsp90-beta (HSPAB1) and a decrease established for the cytoplasmic oxygen-carrier myoglobin. Additional proteins with a differential expression pattern in some of the analysed dystrophin-deficient muscles were identified as elongation factors EEF1A1 and EEF2, the iron-binding protein transferrin, various isoforms of collagen, the cytosolic Ca
2+-binding protein parvalbumin, and the Z-line α-actinin binding protein myozenin (
Figure 4).
The increase in the intermediate filament protein vimentin is probably a compensatory mechanism to stabilize the weakened cytoskeletal network and to rescue the load-bearing function of the fibre interior that lacks the dystrophin lattice in muscular dystrophy. Although a previous report has shown that vimentin is only transiently expressed during myotube maturation [
42], vimentin can act synergistically to desmin and support the structural backbone of intermediate filaments [
43]. The finding agrees with previous gel-based proteomic analyses of dystrophic mouse and dog skeletal muscles [
23,
24,
25,
32,
34,
36], as well as a comprehensive
in vivo SILAC proteomic study of the
mdx mouse [
33] and a label-free mass spectrometric survey of the highly fibrotic
mdx-4cv diaphragm [
35]. This large number of corresponding proteomic results establishes this intermediate filament protein as a reliable and versatile muscle-associated biomarker candidate for evaluating animal models of dystrophinopathy [
28].
The drastic increase in annexin isoforms A2 and A5 suggests impaired Ca
2+-handling and an altered membrane organization in dystrophin-deficient fibres [
44]. Since annexins are linked to the maintenance of the extracellular matrix and the actin-associated cytoskeletal network in muscle [
45], their apparent up-regulation could also be an adaptive response and attempt to partially substitute for the loss of the dystrophin-actin axis [
26]. The dystrophic
grmd dog model of Duchenne muscular dystrophy also exhibited an increased level of annexins in the
vastus lateralis muscle [
36]. Since lamins are nuclear intermediate filament proteins that provide nuclear stability and support the structural linkage between muscle nuclei and the cytoskeleton [
46], increased levels of lamin isoforms A/C and B probably enhance the assembly of lamin-based fibrous structures. This would maintain the inner nuclear membrane structure during degeneration-regeneration cycles and stabilize muscle fibres affected by inflammatory processes.
Altered albumin levels in dystrophic muscles may reflect disturbed oxidative metabolism and/or is connected to an increased permeability of the Dp427-deficient sarcolemma, which represents a major pathological feature in muscular dystrophies [
47]. The up-regulation of alpha-1-antitrypin [
48], which functions as a protective anti-protease and anti-inflammatory factor [
49], might be an adaptation of dystrophic muscle tissues in response to fibre degeneration and inflammation [
50]. Anti-trypsin, also known as serpina 1d protein, was also shown to be greatly increased in FDB muscles by a gel-based study [
24]. The change in the Serpin B6 serine protease inhibitor was also reported by Ge
et al. [
38]. The loss of the cytoplasmic oxygen-carrier myoglobin, usually present at high levels in oxidative skeletal muscle fibres [
51], could be due to leakage from dystrophic muscles and therefore be indicative of progressive disintegration of the dystrophic sarcolemma. Since elongation factors control muscle protein synthesis by delivering the aminoacyl-tRNA to the ribosome and thereby ensuring the proper elongation of the nascent polypeptide chain [
52], increased levels of EEF1A1 and EEF2 may be involved in regenerative processes. Disturbed iron metabolism is indicated by the increased concentration of the iron-binding protein transferrin [
53,
54] in muscular dystrophy.
The drastic increase of collagen in the
mdx diaphragm agrees with fibrosis-associated changes in dystrophinopathy [
55,
56,
57] and confirms the results from previous analyses of dystrophic muscles [
34,
35]. The drastic decrease of the cytosolic Ca
2+-binding protein parvalbumin [
58,
59] in dystrophic muscle indicates abnormal Ca
2+-buffering and supports the calcium hypothesis of dystrophinopathy [
60,
61,
62,
63,
64]. A preferential susceptibility of differing fibre populations may be linked to lowered levels of parvalbumin [
24,
35,
37]. An interesting finding is the increase in the large heat shock protein Hsp90 that represents a major ATP-dependent molecular chaperone [
27]. Hsp90 is involved in the activation and stabilization of many signalling proteins involved in cellular pathways. Changes in this molecular chaperone and its cyto-protective action indicate increased levels of cellular stress in muscular dystrophy [
65,
66] and might be a suitable marker of progressive dystrophic alterations [
28]. Changes in the α-actinin binding protein myozenin of the Z-disc region [
67] are also a potential new indicator of dystrophinopathy-related abnormalities within the complex arrangement of the contractile apparatus [
68].
In order to relate the mass spectrometric analysis presented here with previous studies, significant proteomic hits were compared to major findings from already published reports on proteome-wide alterations in established model systems of dystrophinopathy.
Table 6 and
Table 7 summarize the list of major biomarker candidates identified in this report by label-free mass spectrometry and correlates the changes in 28 proteins with the proteomic results from 13 previous studies that have focused on the
mdx mouse, the
mdx-4cv mouse and the
grmd dog models of Duchenne muscular dystrophy [
21,
22,
23,
24,
25,
32,
33,
34,
35,
36,
37,
38,
39]. The tables outline the identified proteins, whereby certain proteomic hits exhibit dystrophy-related changes in more than one isoform [
26,
27,
28], their subcellular localization and a list of analysed skeletal muscle types and animal models. Importantly,
Table 6 illustrates that the observed increase in the intermediate filament component vimentin has also been shown in a considerable number of other studies [
21,
22,
23,
24,
25,
32,
33,
34,
35,
36] and
Table 7 confirms that the significant decrease in the cytosolic Ca
2+-binding protein parvalbumin was also identified in previous proteomic investigations [
24,
33,
35,
37] of dystrophin-deficient skeletal muscles. This establishes these two muscle-associated proteins with opposite changes in their concentration in dystrophic fibres as excellent analytical tools for the future assessment of animal models of X-linked muscular dystrophy.
Table 6.
Overview of increased biomarker candidates and correlation to previously published proteomic studies of secondary changes in animal models of dystrophinopathy.
Table 6.
Overview of increased biomarker candidates and correlation to previously published proteomic studies of secondary changes in animal models of dystrophinopathy.
| Protein Name | Tissue Localization | Animal Models | Skeletal Muscles | References |
|---|
| Vimentin | Intermediate filaments | mdx, mdx-4cv, grmd | DIA, EDL, FDB, GAS, INT, SOL, VL | [21,23,24,25,32,33,34,35,36] |
| Annexin A1, A2, A5, A6 | Sarcolemma region | mdx | DIA, EDL, FDB, INT, SOL | [25,33,37,38] |
| Lamin A/C, B | Nuclear lamina | mdx, mdx-4cv | DIA, EDL, FDB, INT, SOL | [35] |
| Myosin, embryonic MHC-3, MHC-8 | Myofibrils | mdx, mdx-4cv | DIA, GAS, INT | [33,35] |
| Obscurin | Contractile apparatus | mdx, mdx-4cv | DIA | [35] |
| Hemopexin | Extracellular space | mdx, grmd | DIA, SOL | [36] |
| Collagens, especially COL-VI | Extracellular matrix | mdx, mdx-4cv | DIA, FDB, GAS, SOL | [23,24,34,35] |
| Histone | Nucleus | mdx, mdx-4cv | DIA, EDL, GAS | [23,25,33,35] |
| Serum albumin | Extracellular space | mdx, grmd | DIA, EDL, FDB, GAS, SOL, VL | [23,32,36] |
| Tubulin | Microtubules | mdx, mdx-4cv, grmd | DIA, GAS, VL | [23,33,35,36] |
| 78 kDa glucose-regulated protein | Endoplasmic reticulum | mdx | DIA, GAS | [25,33,37] |
| Transferrin | Extracellular space | mdx, mdx-4cv | DIA, EDL, FDB, GAS, INT | [23,33,35,37,39] |
| Filamin A, C | Actin cytoskeleton | mdx, mdx-4cv | DIA, GAS | [33,35] |
| Proteoglycans (aporin, lumican, prolargin, biglycan, decorin) | | mdx, mdx-4cv | DIA, INT | [35,37] |
| Elongation factors | Cytoplasm/ribosome | mdx | DIA, EDL, GAS, INT, SOL | [23] |
| Heat shock protein Hsp90 | Cytoplasm | mdx, mdx-4cv | DIA, EDL, FDB, GAS, SOL | [23,35] |
| Heat shock protein Hsp70 | Cytoplasm | mdx | DIA, GAS | [23,37,39] |
| Small heat shock proteins (HspB1, HspB5, HspB7) | Cytoplasm | mdx | DIA, GAS, INT, SOL | [21,23,24] |
| Desmin | Intermediate filaments | mdx, mdx-4cv | DIA, EOM, GAS | [32,33,35] |
| Vinculin | Cytoskeleton | mdx, mdx-4cv | DIA, GAS | [33,35] |
| Anti-trypsin | Extracellular region | mdx | DIA, EDL, FDB, GAS, SOL | [33,38] |
Table 7.
Overview of decreased biomarker candidates and correlation to previously published proteomic studies of secondary changes in animal models of dystrophinopathy.
Table 7.
Overview of decreased biomarker candidates and correlation to previously published proteomic studies of secondary changes in animal models of dystrophinopathy.
| Protein Name | Tissue Localization | Animal Models | Skeletal Muscles | References |
|---|
| Parvalbumin | Cytoplasm | mdx, mdx-4cv | DIA, FDB, GAS, INT, SOL | [24,33,35,37] |
| Myoglobin | Cytoplasm | mdx | DIA, EDL, FDB, SOL | [24,37] |
| Fatty acid-binding protein FABP3 | Cytoplasm | mdx | DIA, SOL, GAS | [33,37] |
| Carbonic anhydrase CA3 | Cytoplasm | mdx | DIA | [21] |
| Perilipin | Cytoplasm | mdx, mdx-4cv | DIA, FDB | [35] |
| Myozenin | Actin cytoskeleton | mdx, mdx-4cv | DIA, EDL, FDB, GAS | [34,35] |
| Glycogen phosphorylase, muscle | Cytoplasm | mdx, mdx-4cv | DIA, EDL, GAS | [23,24,35] |
From the comparative analysis of the existing literature, in conjunction with the proteomic findings from this report, a variety of other promising biomarker candidates other than vimentin and parvalbumin have been identified. Increased proteins included various annexins, desmin, vinculin, tubulin, lamin, embryonic isoforms of myosin heavy chains, obscurin, hemopexin, various histones, albumin, transferrin, filamin, elongation factors, a variety of molecular chaperones and anti-trypsin, as well as collagen and associated proteoglycans (
Table 6). Decreased proteins with a great potential to be useful for studying particular aspects of the molecular pathogenesis of dystrophinopathy or for the systematic monitoring of experimental therapies are myoglobin, the fatty acid-binding protein isoform FABP3, carbonic anhydrase CA3, perilipin, myozenin, and the muscle isoform of glycogen phosphorylase (
Table 7). Since the identified proteins cover a wide range of cellular and structural activities in skeletal muscle tissues, their combined usage for the determination of changes in a biomarker signature would cover the maintenance of the cytoskeletal network, the extracellular matrix, energy metabolism, metabolite transportation, the cellular stress response, the excitation-contraction-relaxation cycle and other core activities.
2.9. Immunoblotting Survey of mdx Skeletal Muscles
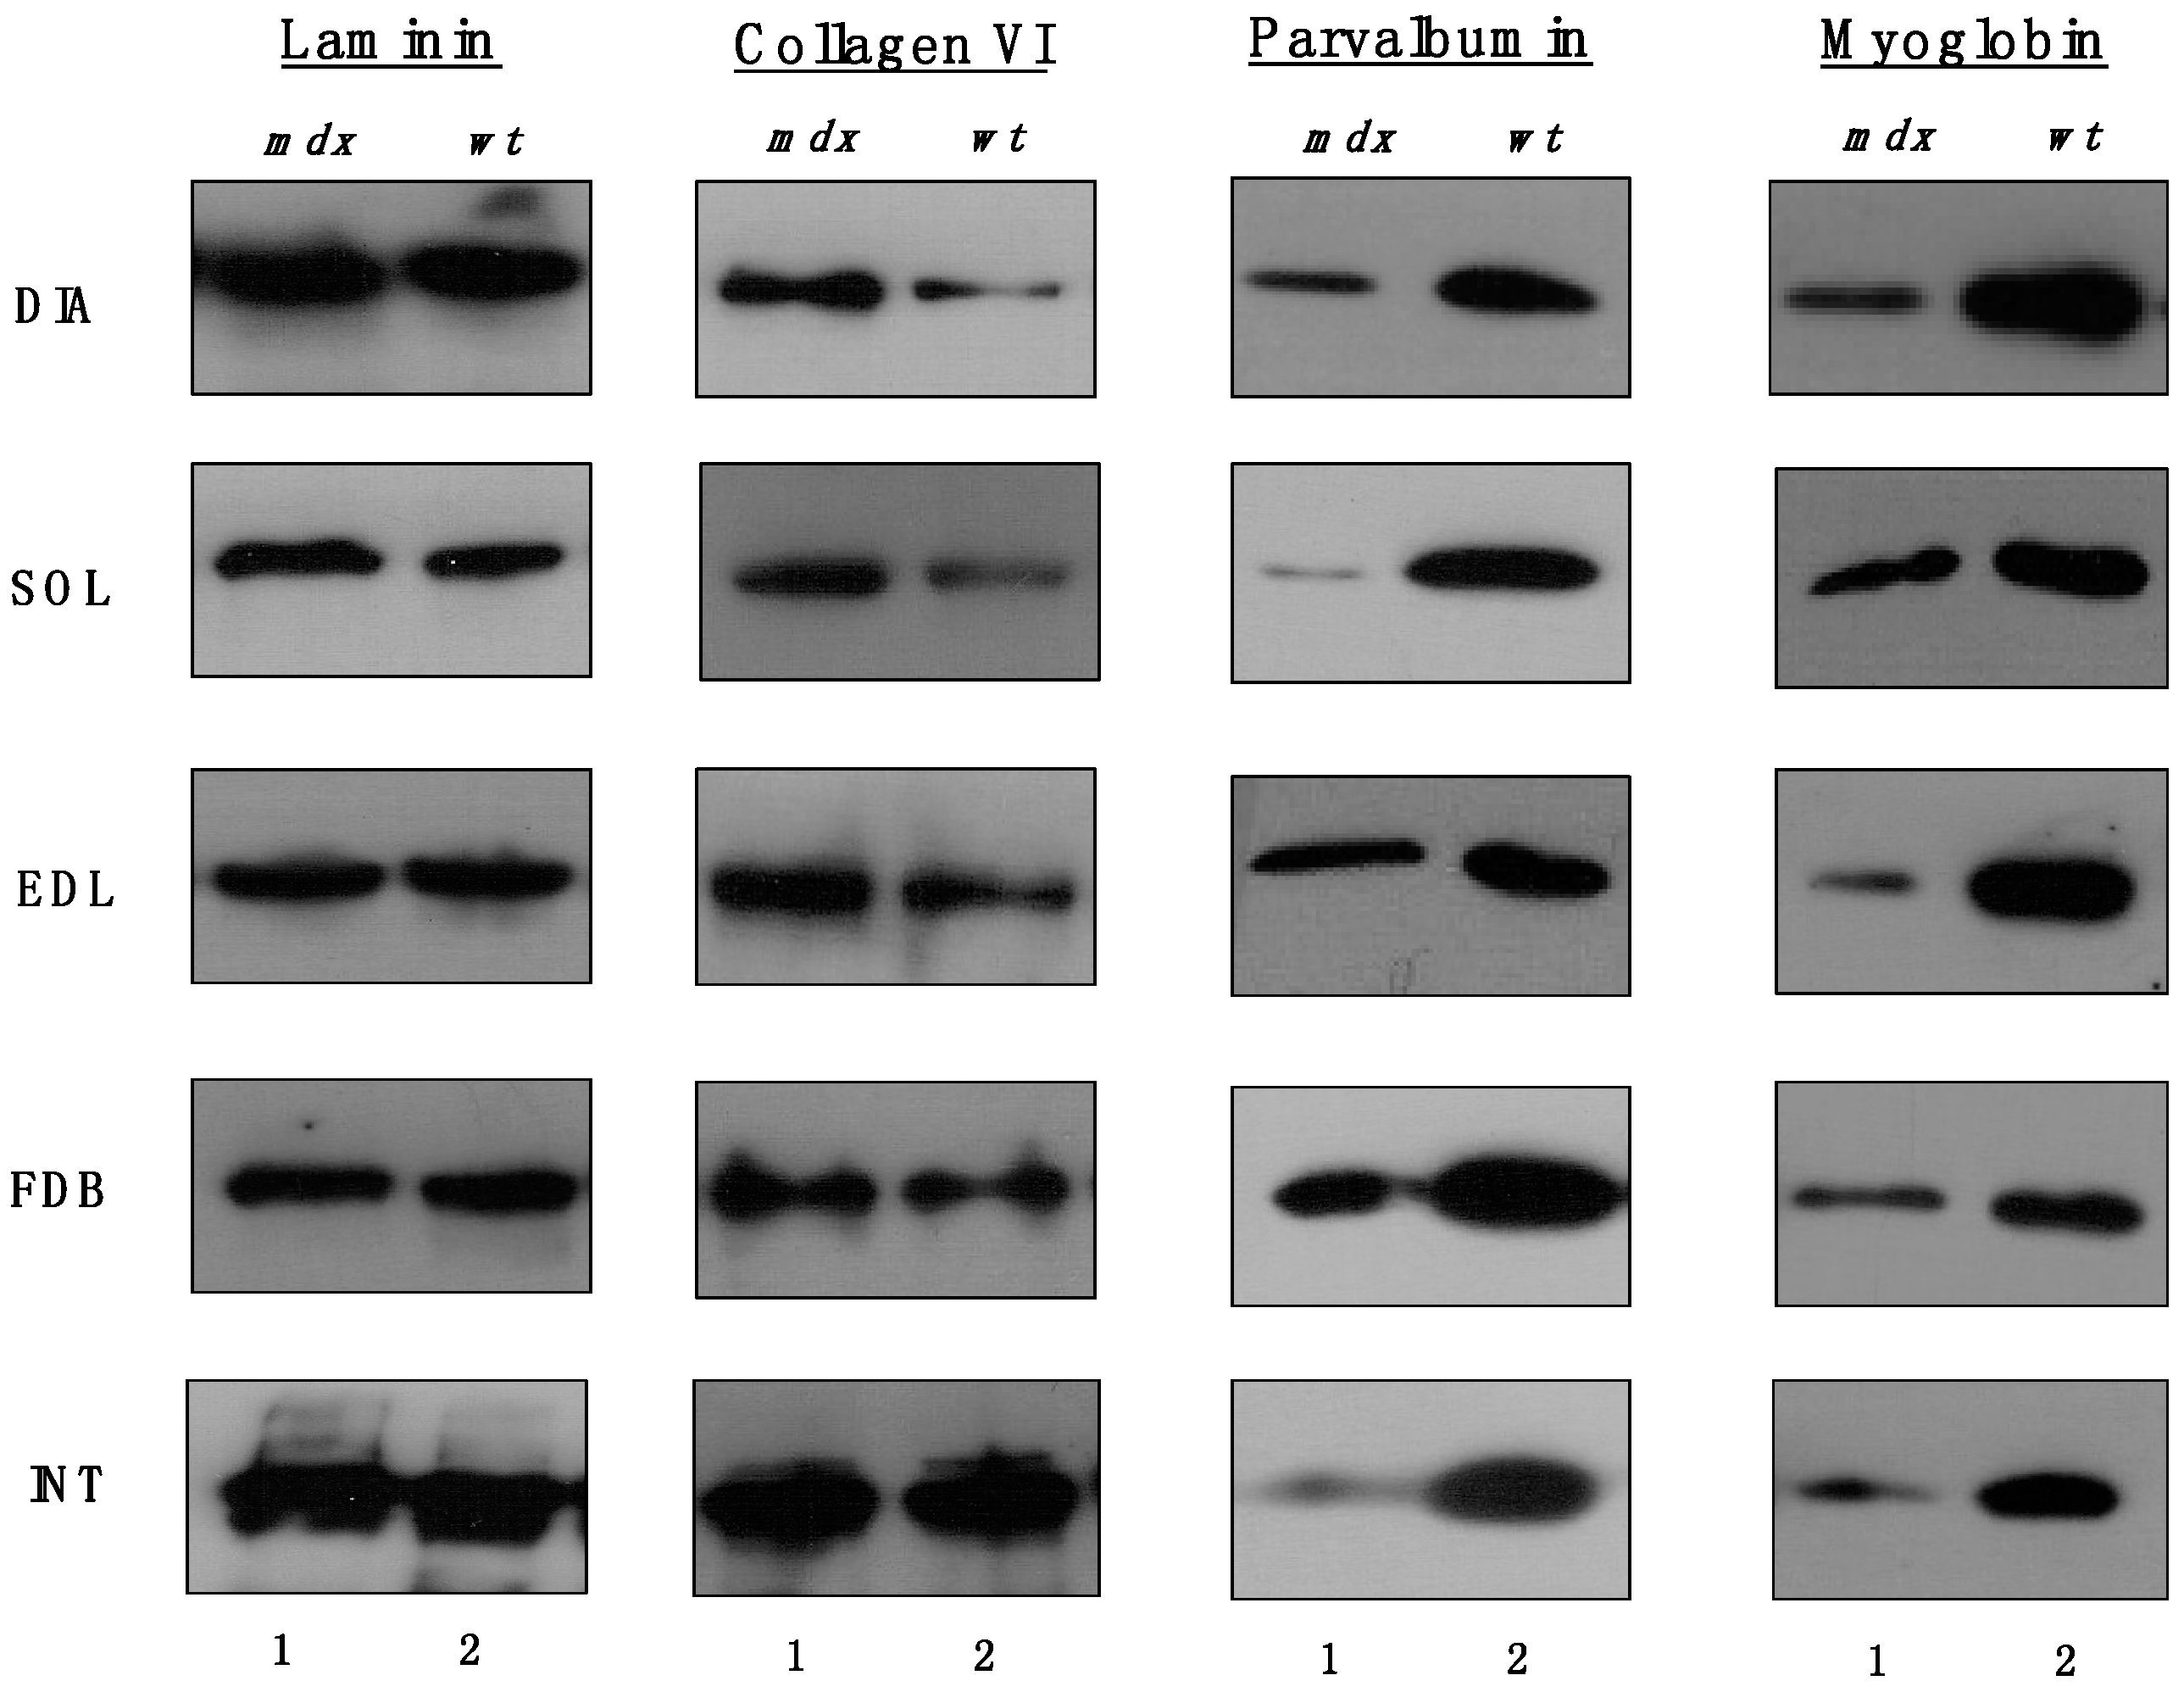
The immunoblots shown in
Figure 5 confirmed the relatively unchanged concentration levels of laminin in dystrophin-deficient skeletal muscles and the tendency of increased collagen levels in all
mdx preparations except INT muscle. All
mdx muscles exhibited drastic decreases in myoglobin and parvalbumin, which agrees with previous findings [
26,
27,
28].
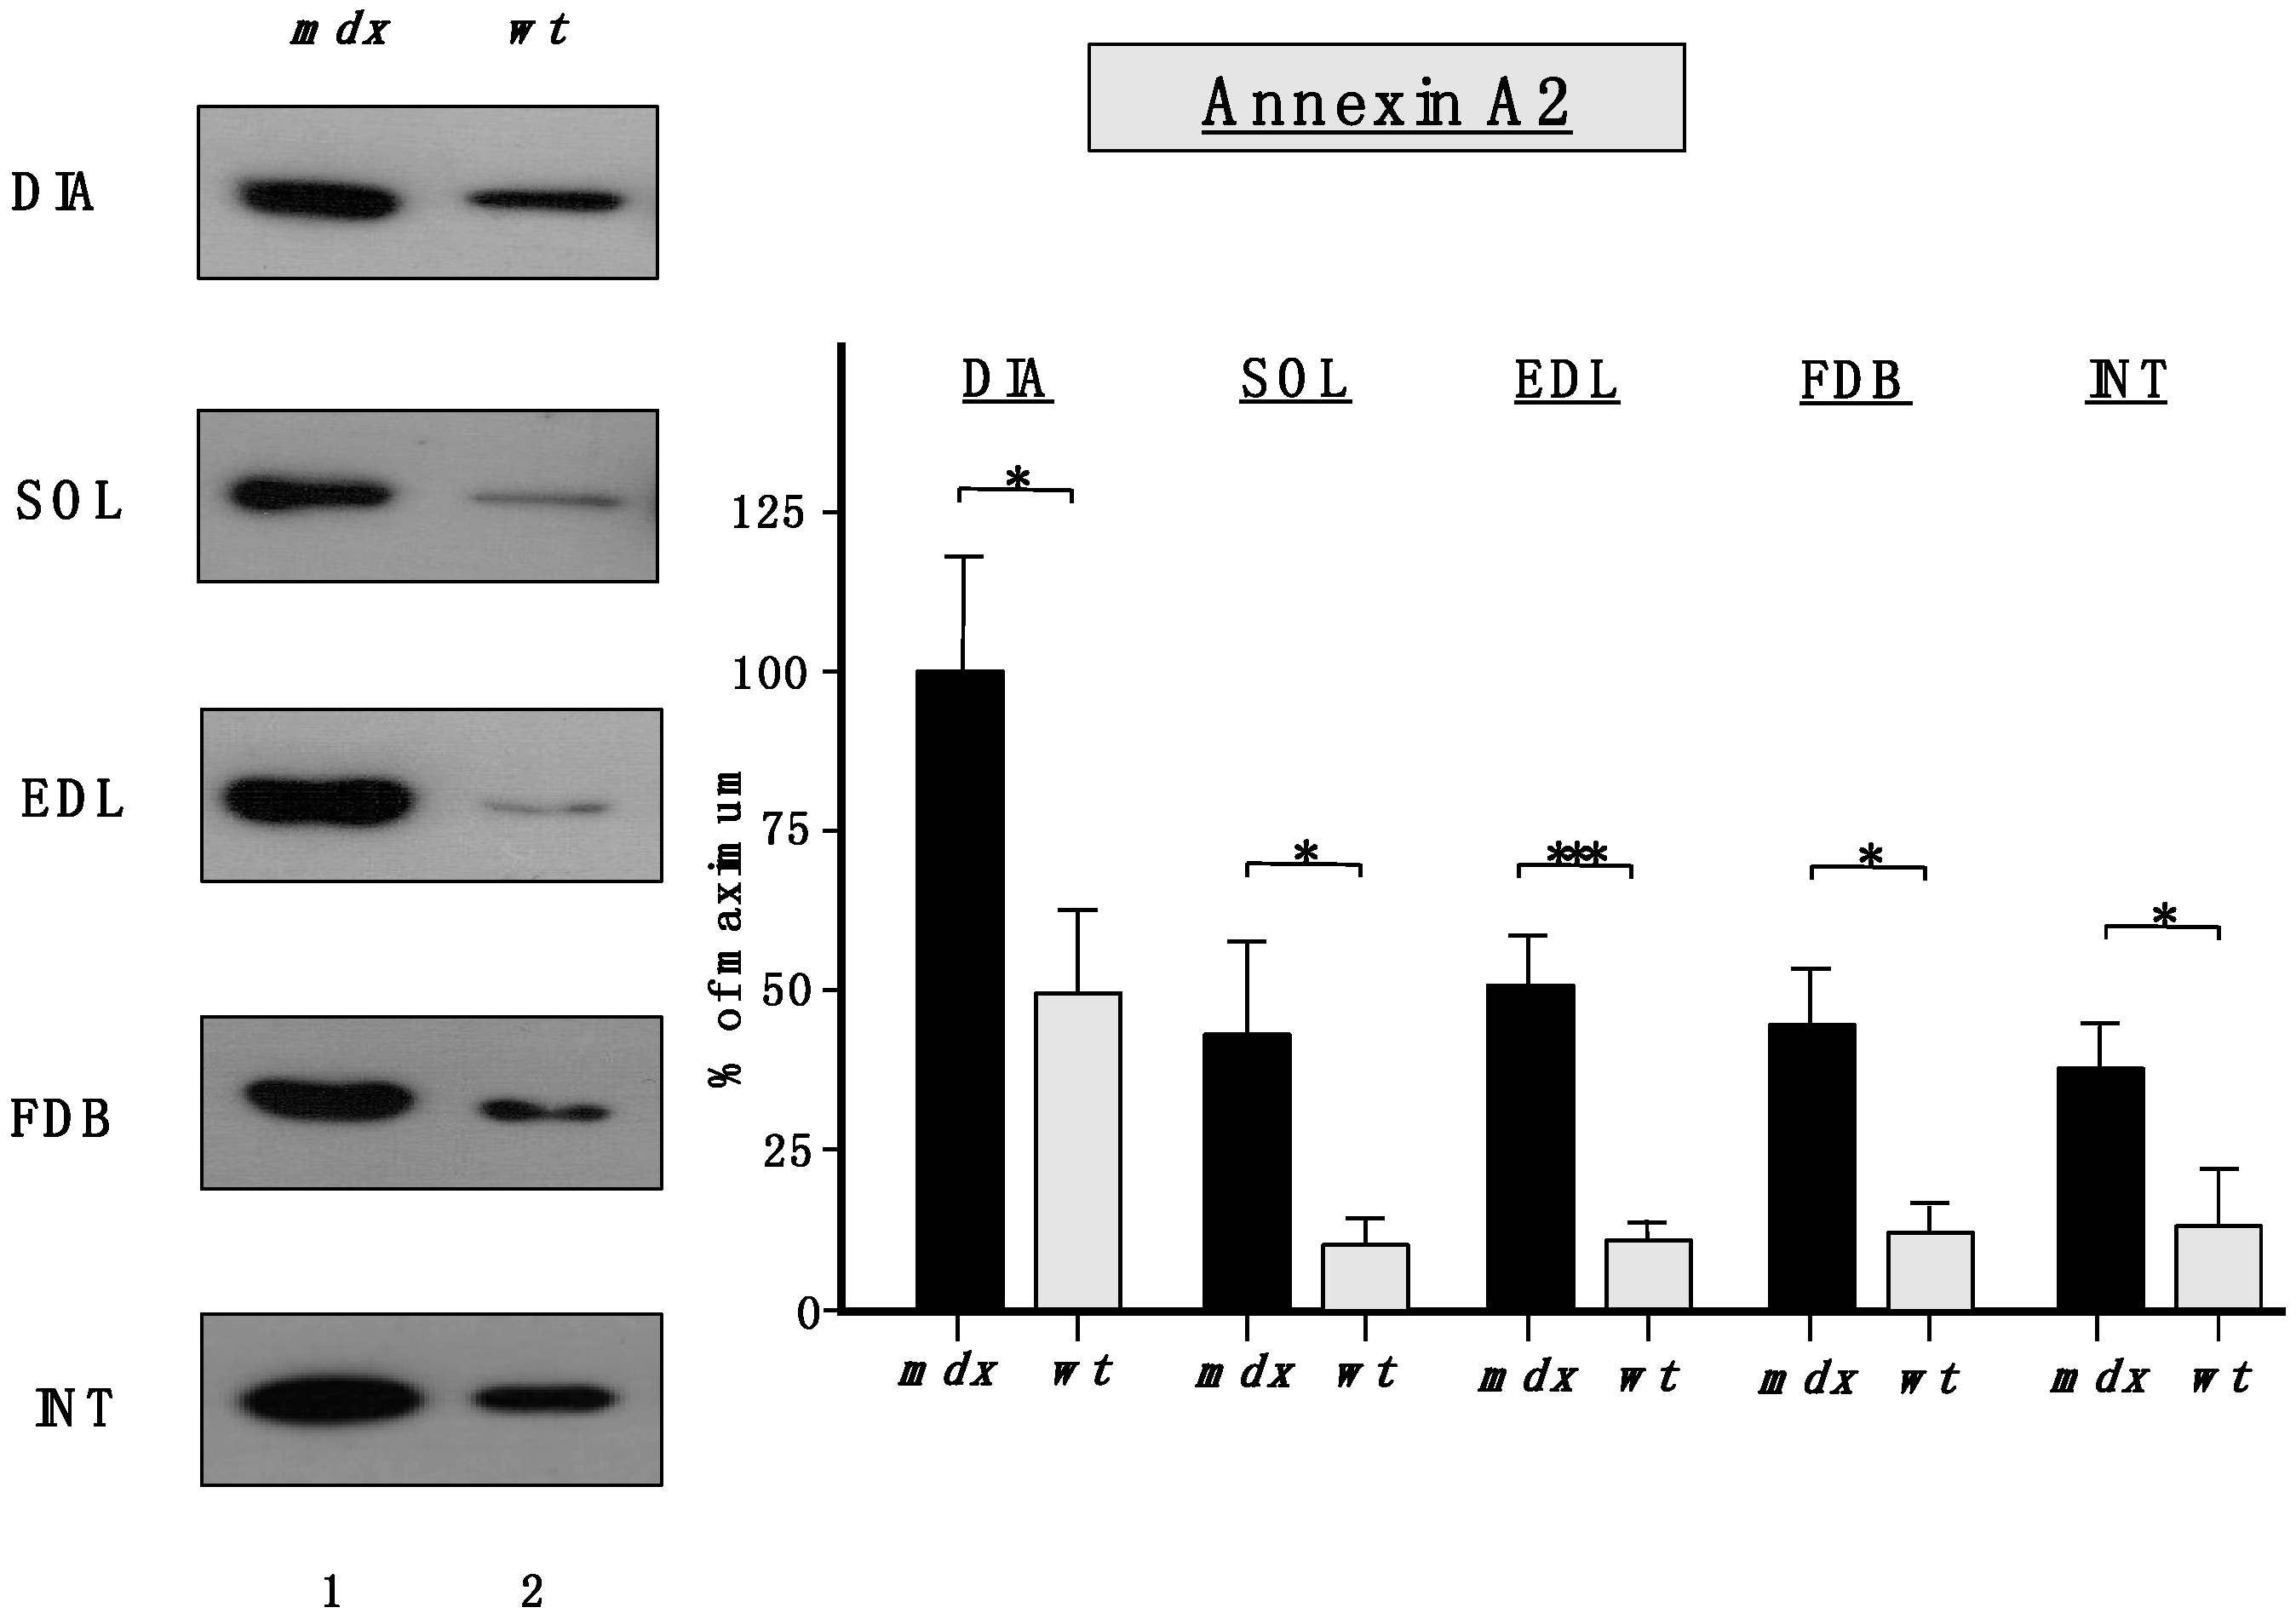
Importantly,
Figure 6 clearly confirmed the findings from the proteomic survey of
mdx muscles and demonstrated that annexins are significantly increased in the
mdx muscles investigated in this study. The immunoblot analysis focused on annexin isoform A2.
Figure 5.
Comparative immunoblotting survey of dystrophic diaphragm (DIA), soleus (SOL), extensor digitorum longus (EDL), flexor digitorum brevis (FDB), and interosseus (INT) muscles from the mdx (lane 1) animal model of Duchenne muscular dystrophy vs. wild type (wt; lane 2) muscles. Antibody labelling was used to determine the concentration of laminin, collagen, parvalbumin and myoglobin.
Figure 6.
Comparative immunoblot analysis of dystrophic diaphragm (DIA), soleus (SOL), extensor digitorum longus (EDL), flexor digitorum brevis (FDB), and interosseus (INT) muscles from the mdx (lane 1) animal model of Duchenne muscular dystrophy vs. wild type (wt; lane 2) muscles. Antibody labeling was used to determine the concentration of annexin isoform A2 and is shown on the left side of this figure. The graphical representation of the immuno-decoration levels for annexin in mdx vs. wild type (wt) muscles is shown on the right side of this figure (Student’s t-test, unpaired; n = 4; * p < 0.05; *** p < 0.001).
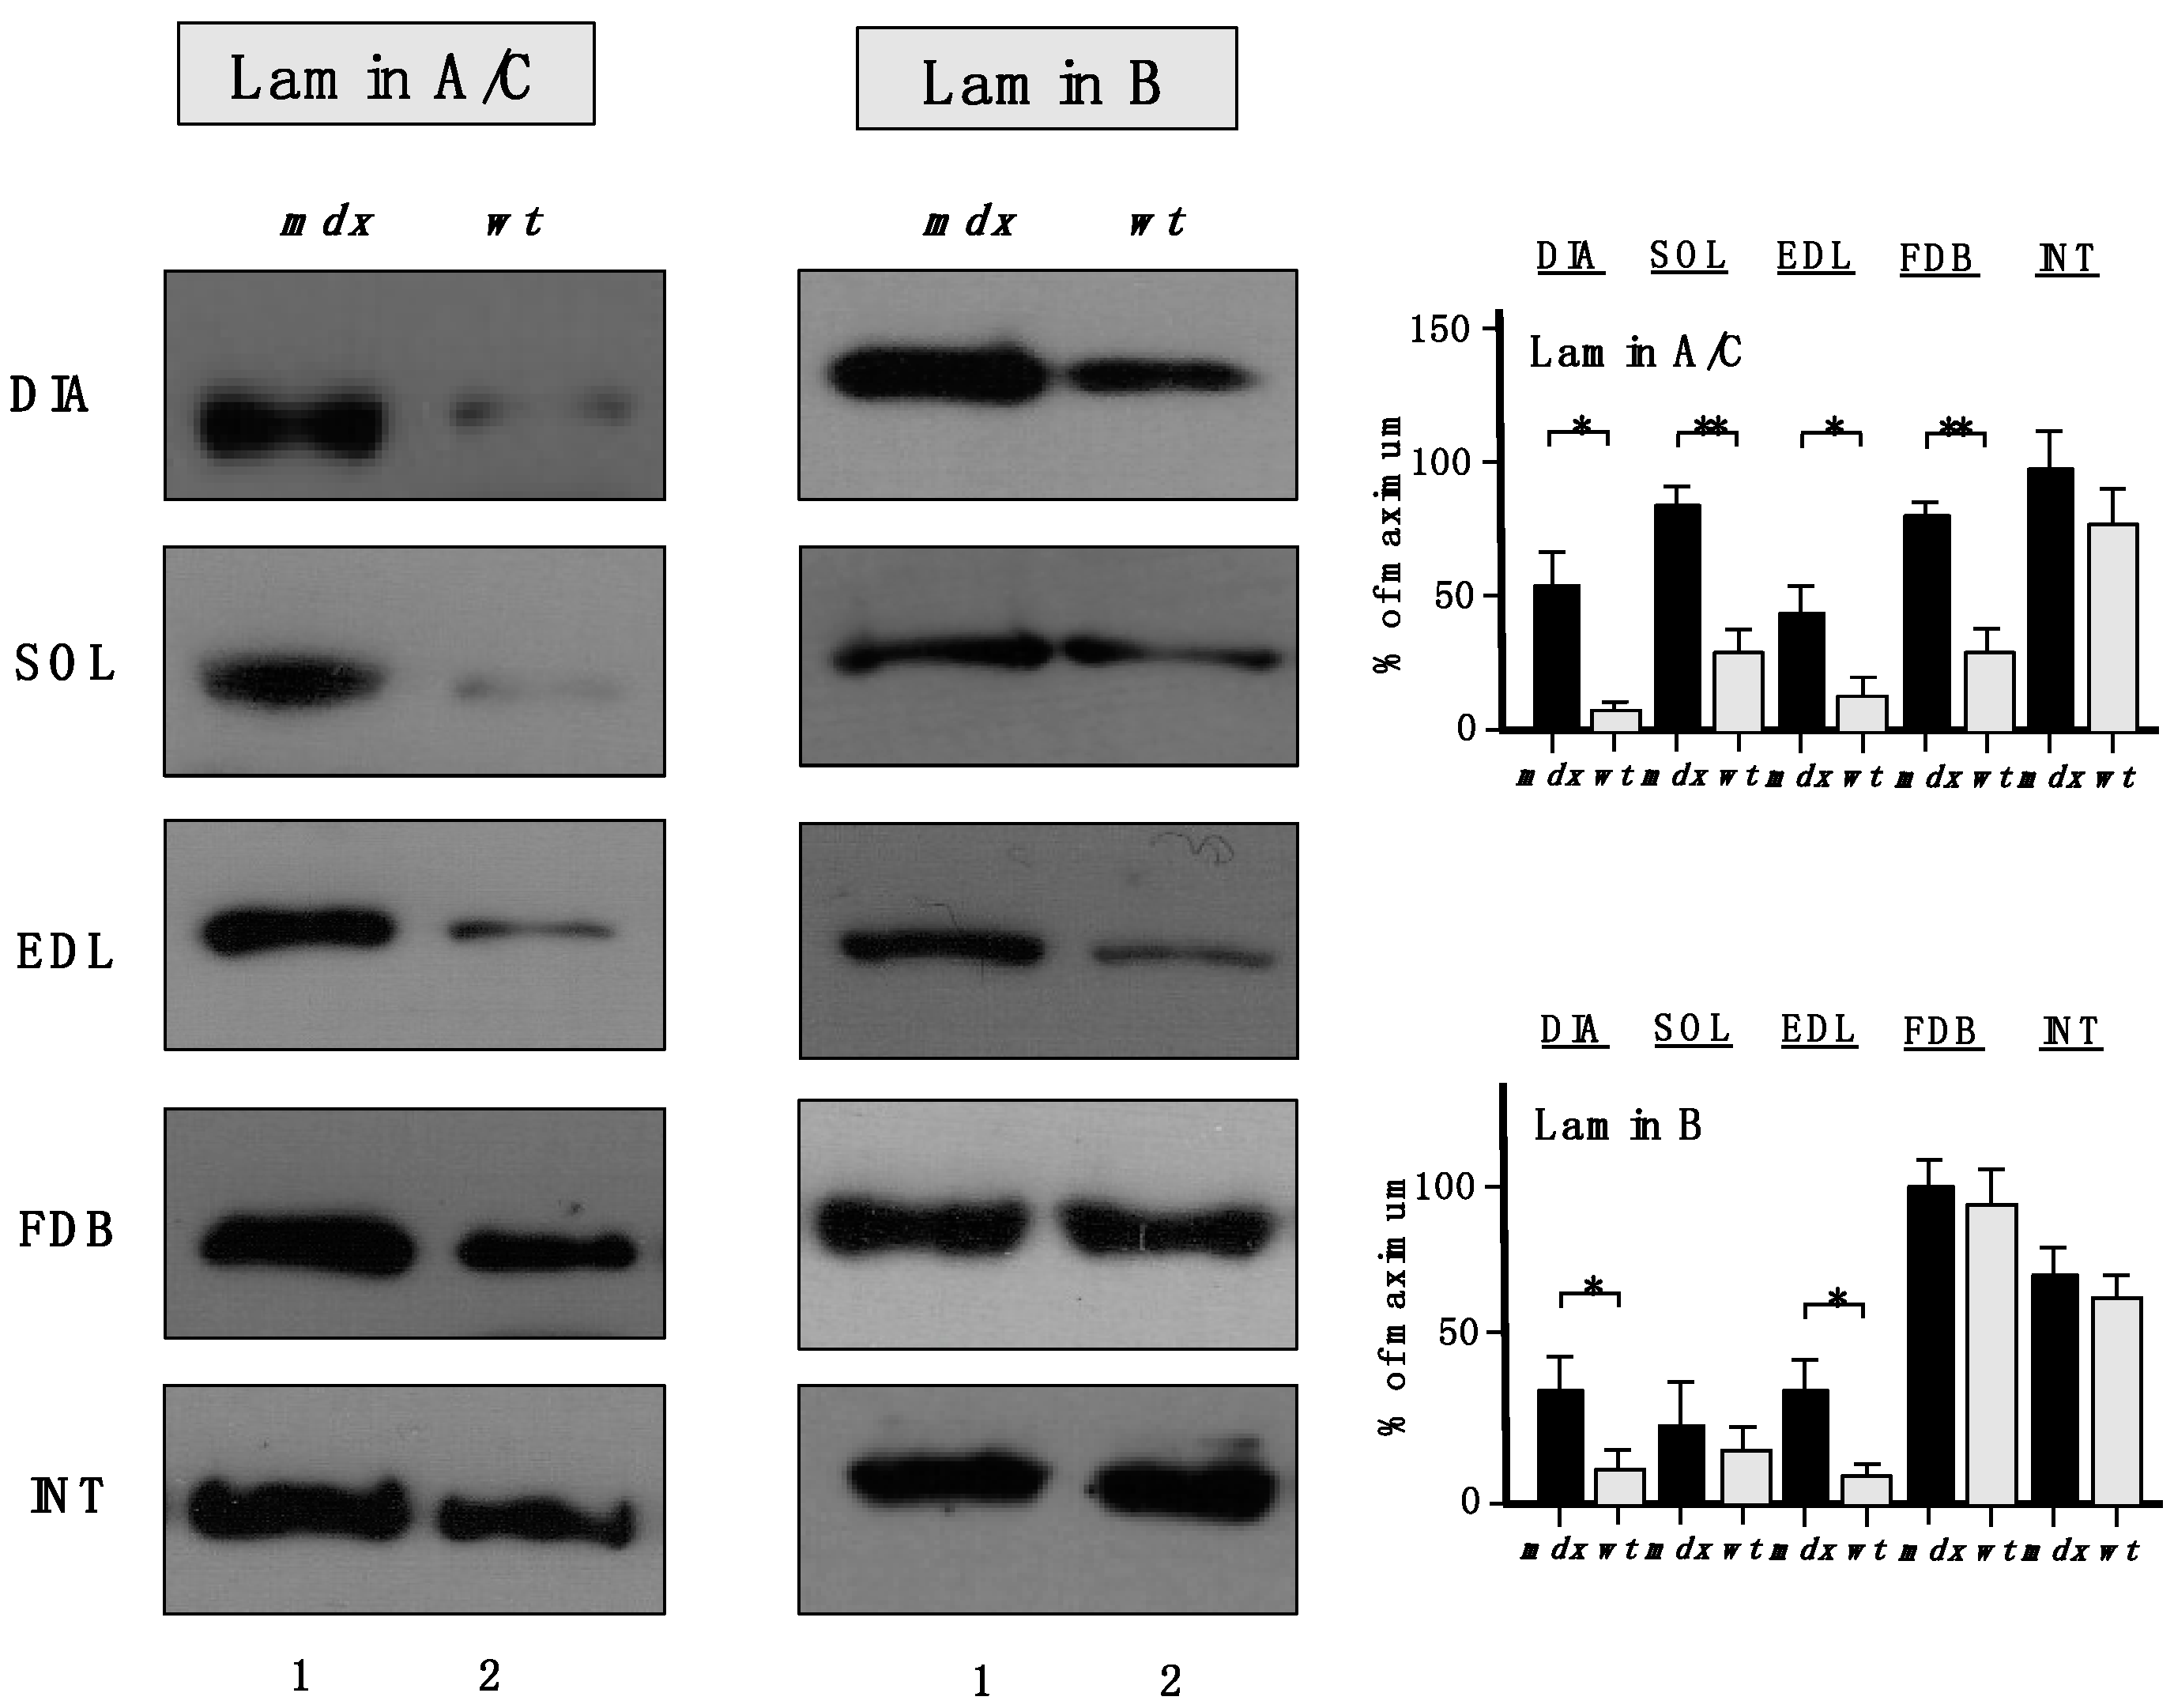
The increased levels of the nuclear envelope lamins, as suggested by proteomic analyses, were confirmed to be significant for lamin-A/C, with the exception of INT muscle (
Figure 7). A drastic increase of lamin-B levels was also shown to occur in DIA and EDL muscles.
Figure 7.
Comparative immunoblot analysis of dystrophic diaphragm (DIA), soleus (SOL), extensor digitorum longus (EDL), flexor digitorum brevis (FDB), and interosseus (INT) muscles from the mdx (lane 1) animal model of Duchenne muscular dystrophy vs. wild type (wt; lane 2) muscles. Antibody labelling was used to determine the concentration of lamin isoform A/C and lamin isoform B, as shown on the left side of the figure. Graphical representation of the immuno-decoration levels for lamin A/C and lamin B in mdx vs. wild type (wt) muscles is shown on the right side of the figure (Student’s t-test, unpaired; n = 4; * p < 0.05; ** p < 0.01).
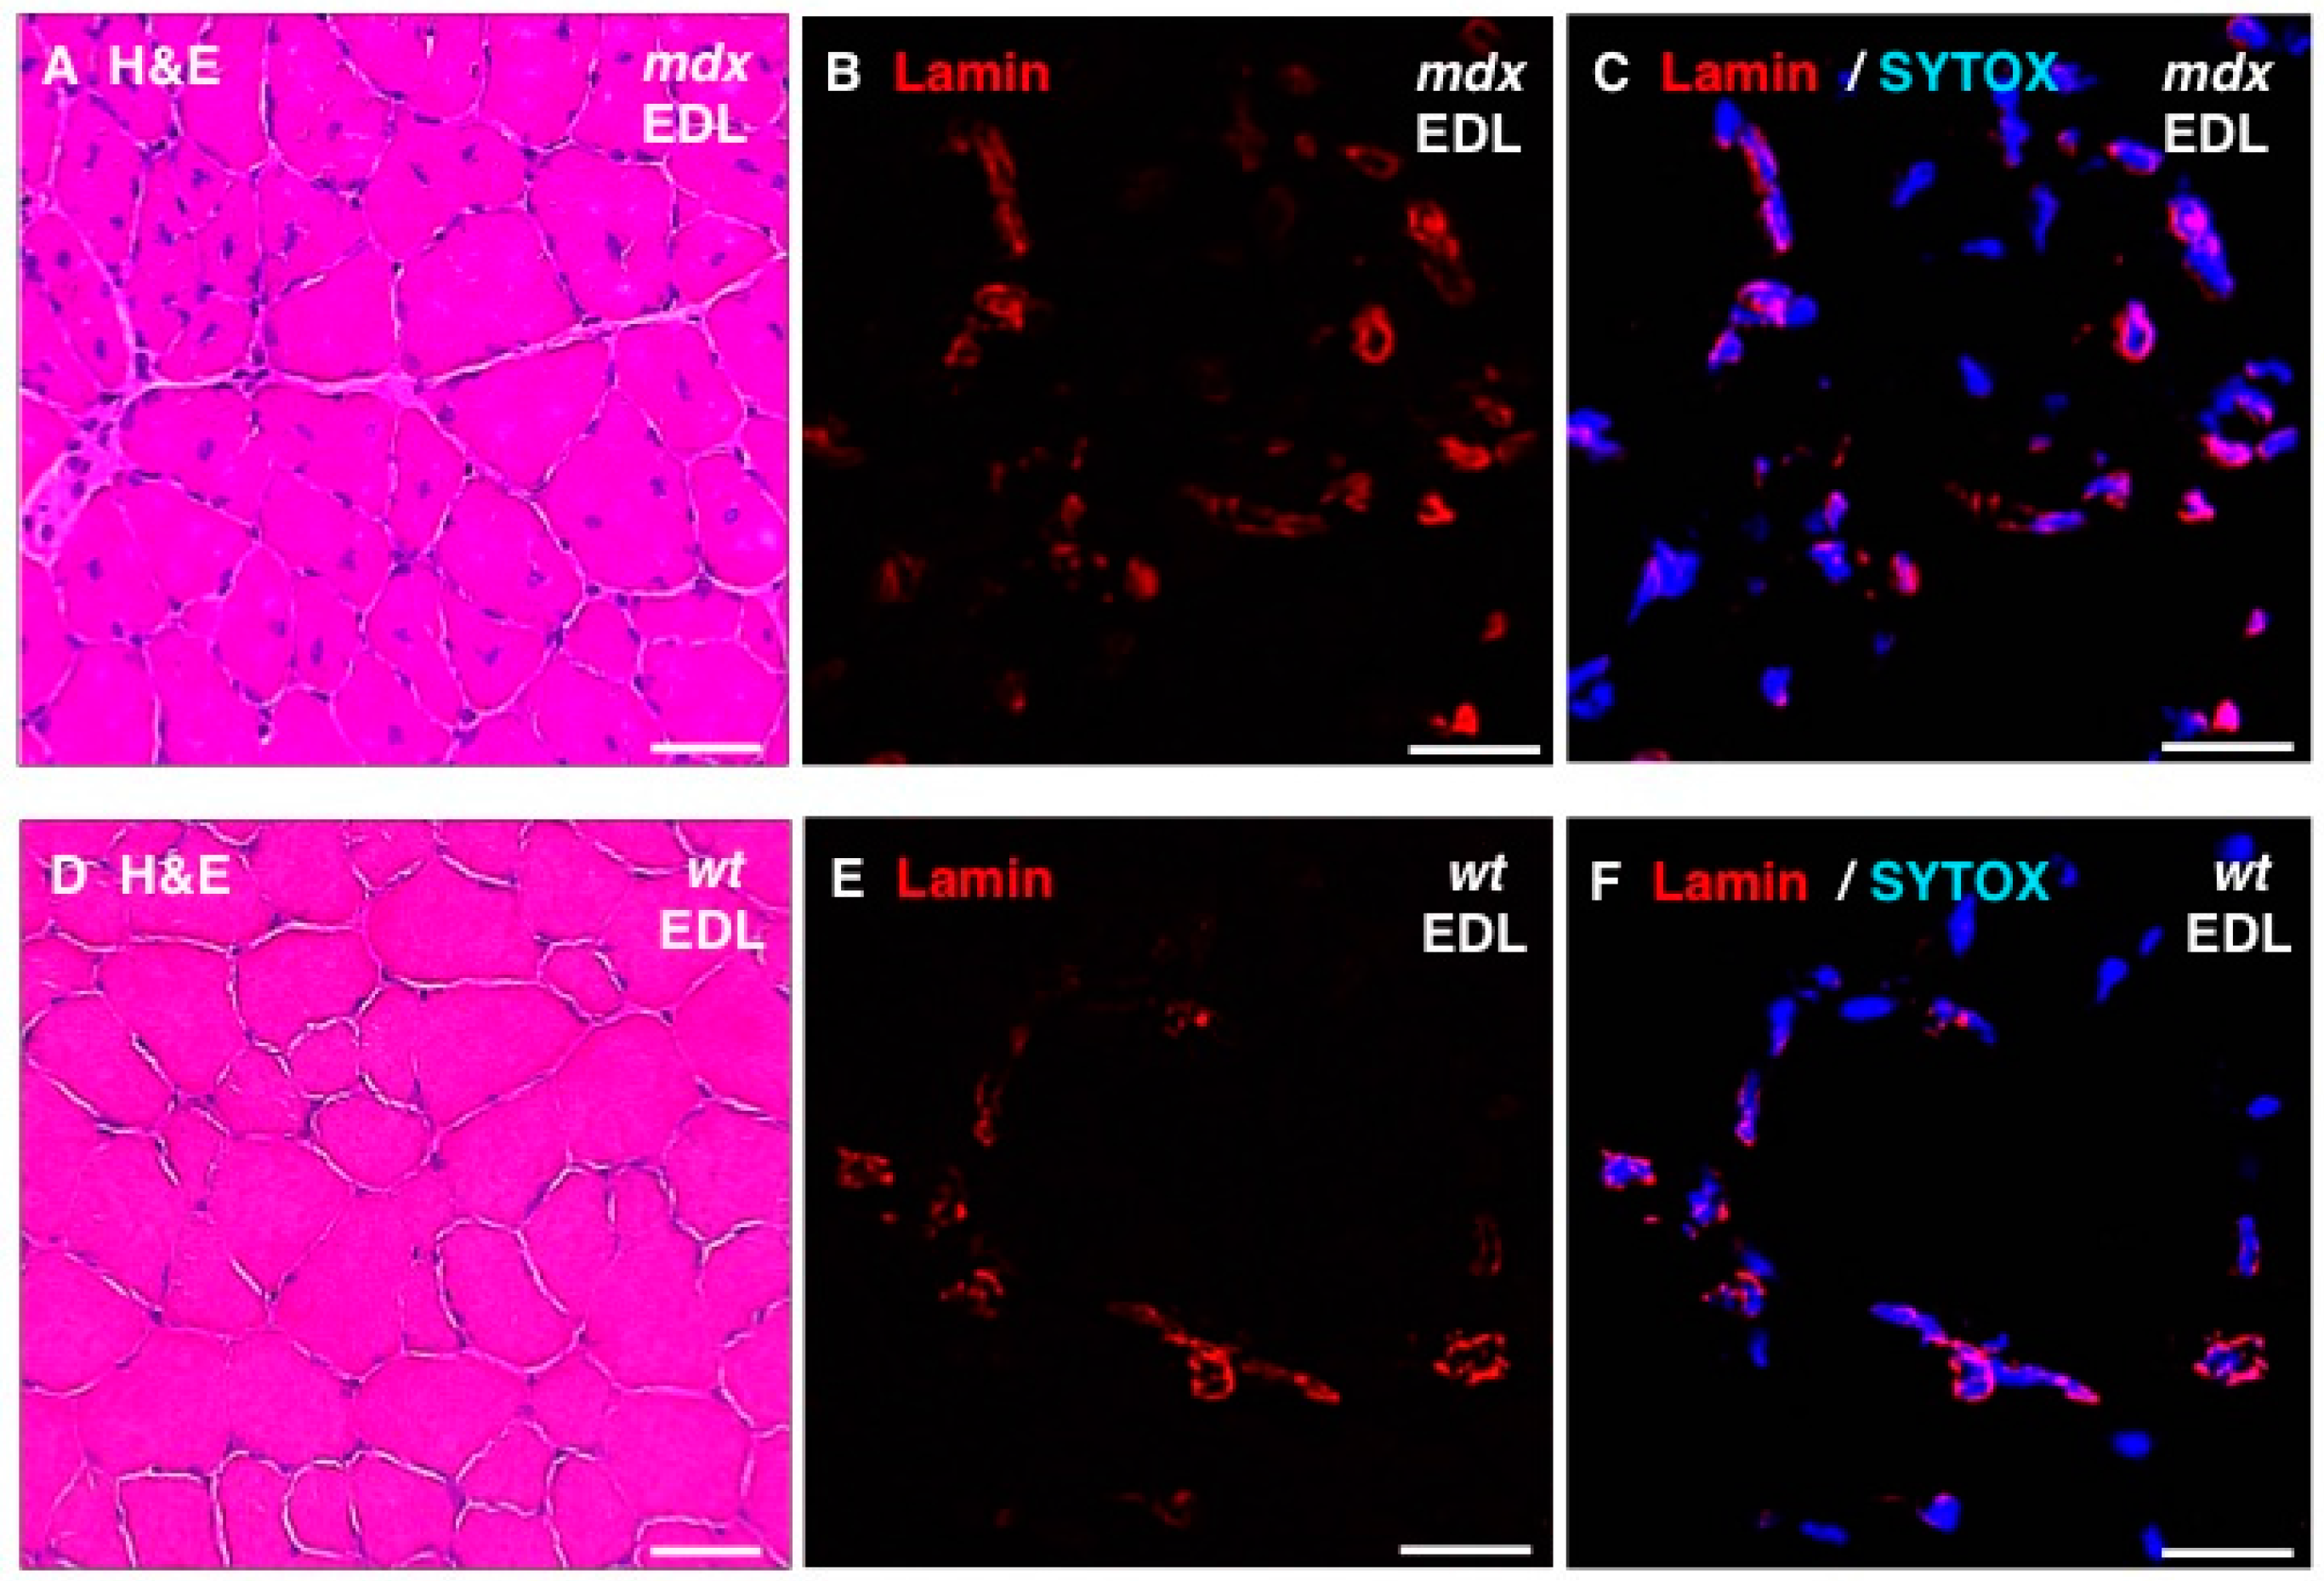
In addition, standard histochemical staining of transverse tissue sections with hematoxylin and eosin was used to estimate changes in the position and number of nuclei in dystrophic EDL muscles (
Figure 8A,D). Immunofluorescence microscopy was employed to illustrate the localization and amounts of lamin in
mdx fibres (
Figure 8B,E) and these findings were correlated to the position of nuclei as judged by labelling of nucleic acids with SYTOX (
Figure 8C,F). The histochemical analysis suggests that
mdx fibres contain a considerably higher degree of central nucleation and an overall increased number of nuclei, which agrees with the previous histological profiling of the
mdx mouse model of Duchenne muscular dystrophy [
24,
69]. Immunofluorescence microscopy revealed specific labelling of the nuclear envelope by antibodies to lamin A/C and the comparison between
mdx and wild type EDL muscles suggests increased levels of lamin in dystrophin-deficient muscles.
Figure 8.
Histochemical analysis and immunofluorescence labelling of lamin in dystrophic mdx vs. wild type (wt) skeletal muscles. Shown are transverse sections of extensor digitorum longus (EDL) muscles from 100-day old mdx (A–C) and wild type (D–F) mice. Cryosections were stained with hematoxylin and eosin (H & E) (A,D) or analysed by immunofluorescence microscopy using antibodies to lamin A/C (B,C,E,F). In panels (C,F), merged images of SYTOX-based nucleic acid staining of nuclei (blue) and immunofluorescence labelling of lamin (red) are shown. In panels (A,D): bar equals 50μm; and in panels (B,C,E,F): bar equals 20 μm.
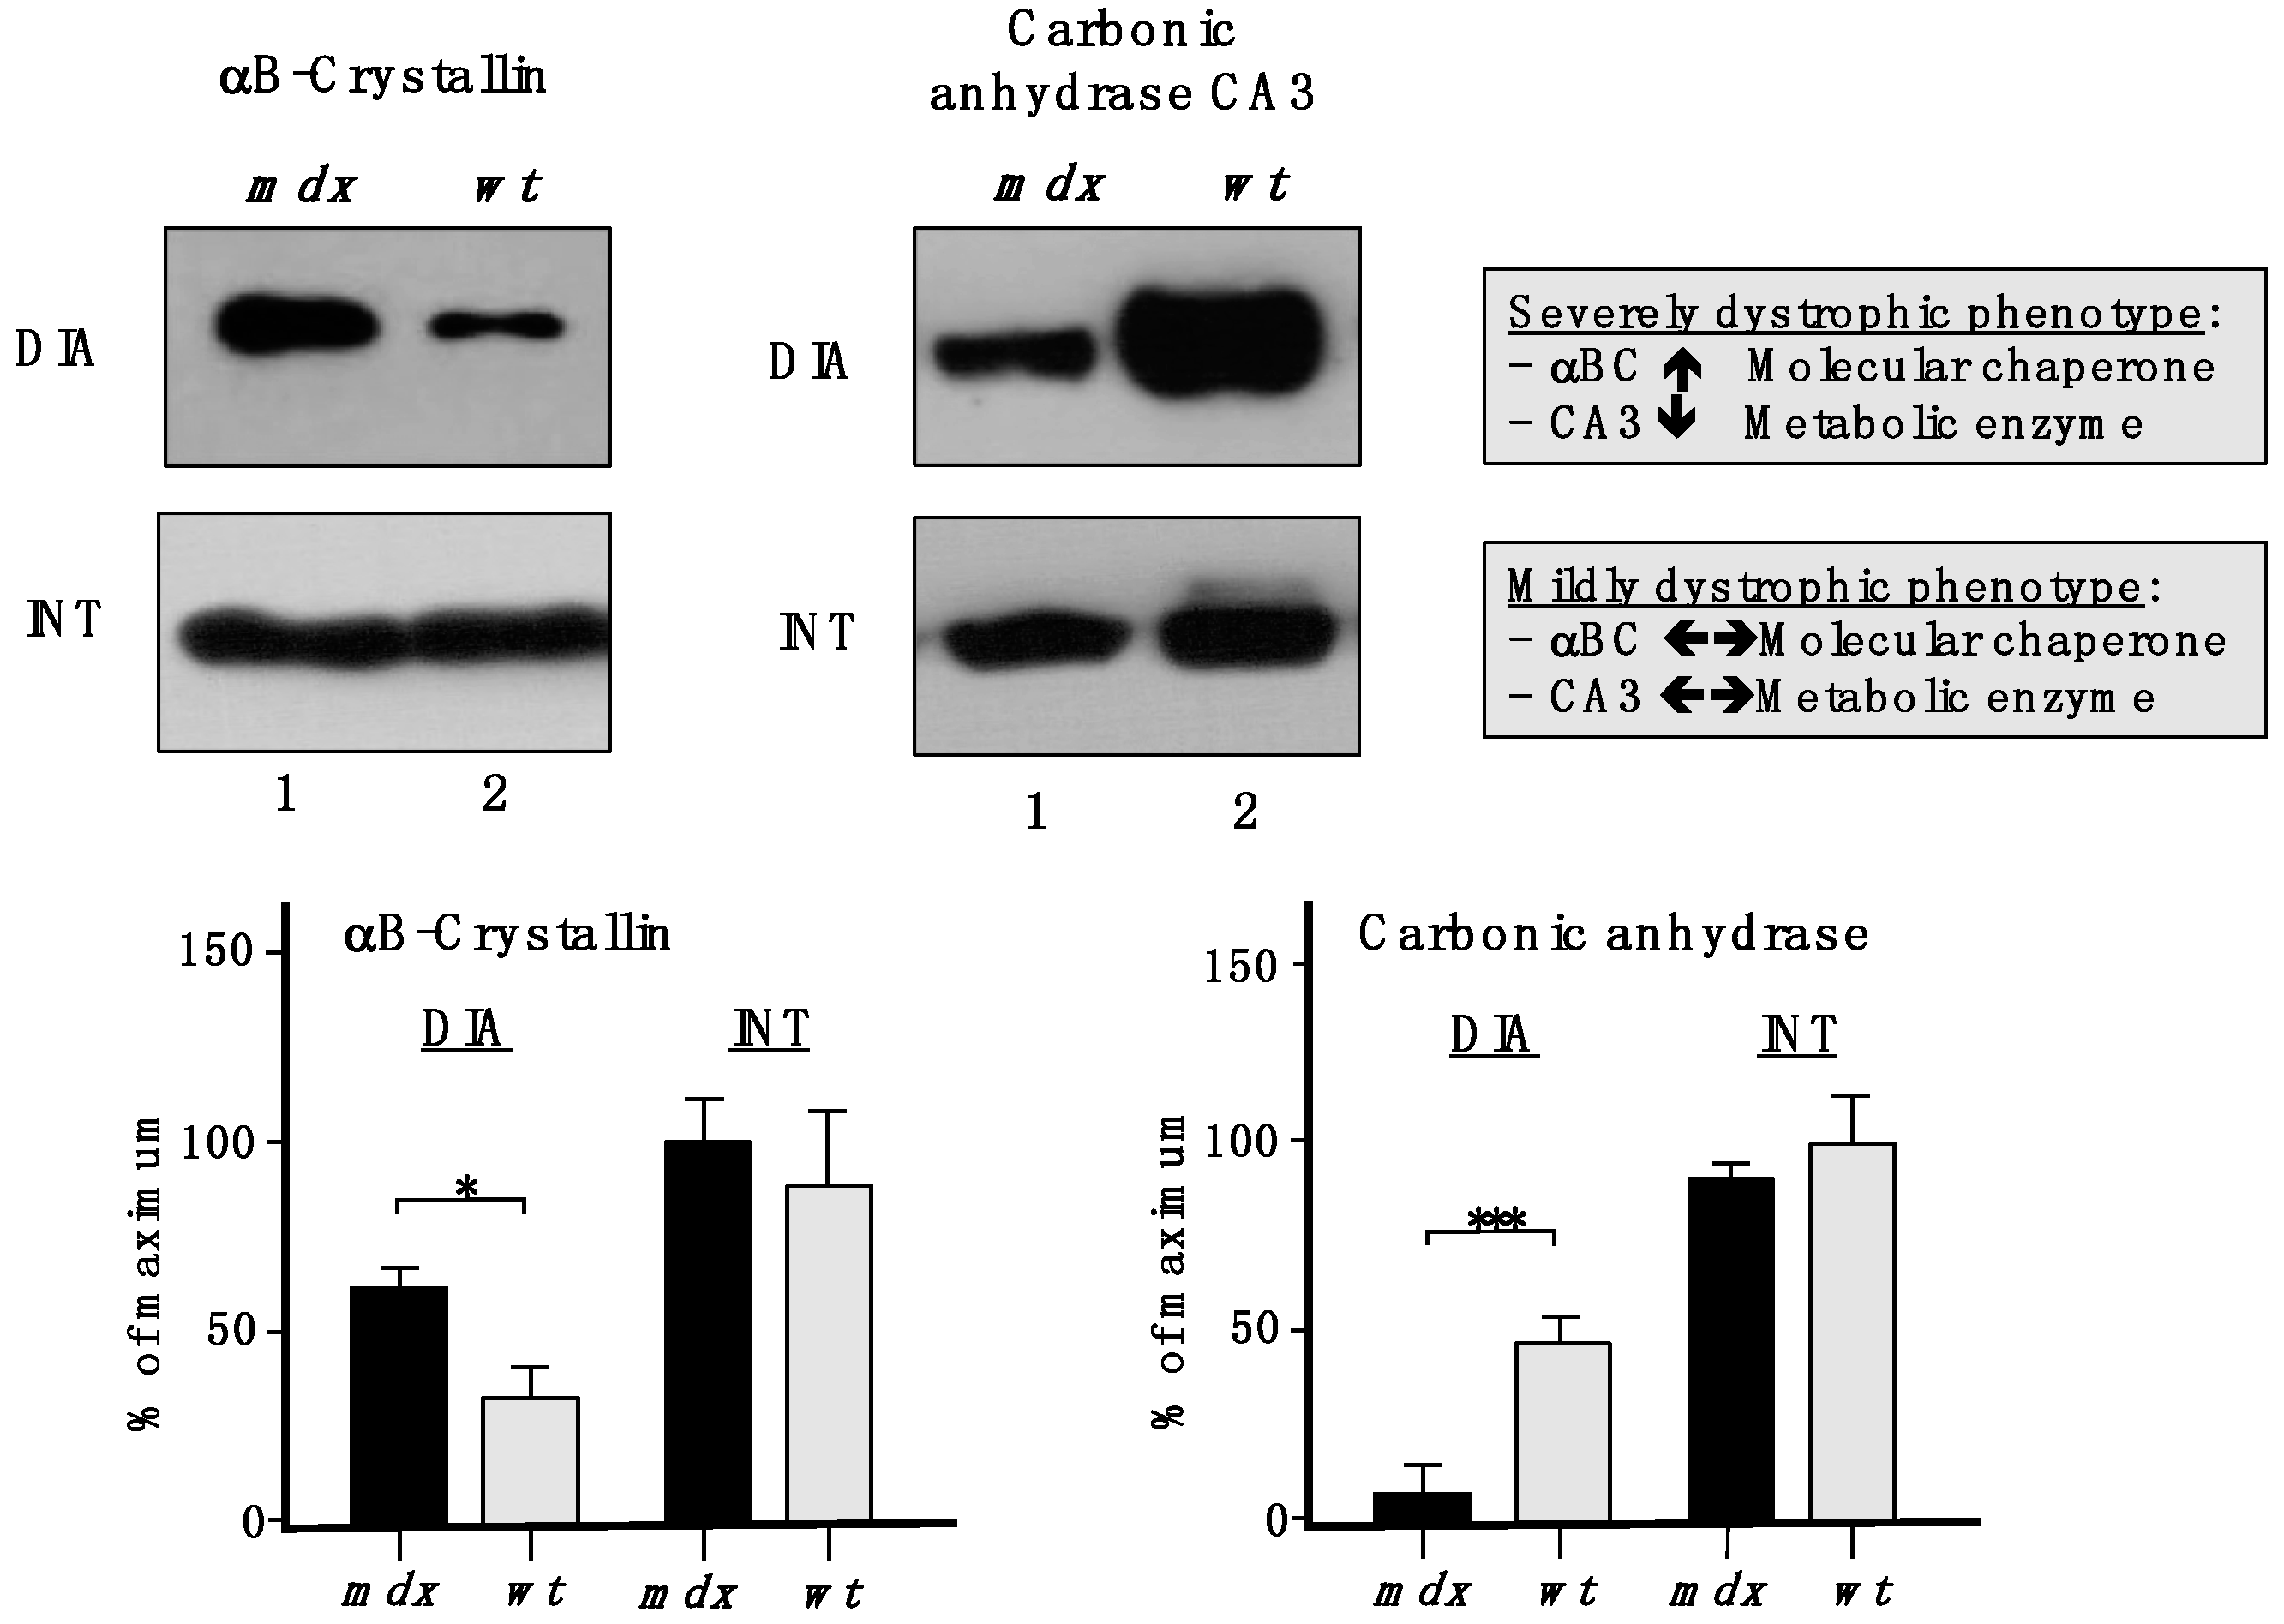
To show the drastic differences between a severely dystrophic phenotype
vs. a mildly affected muscle, immunoblotting with two marker proteins is shown in
Figure 9. In contrast to a drastic increase of the small heat shock protein αB-crystallin and a decrease in the CA3 isoform of carbonic anhydrase in
mdx DIA muscle, both proteins exhibited comparable levels in
mdx INT muscle
vs. wild type INT muscle.
The findings from the comparative proteomic profiling and the select immunoblotting survey of the mdx diaphragm, interosseus, flexor digitorum brevis, soleus, and extensor digitorum longus muscles clearly reflect differences in the number and extent of expression changes in proteins in severely vs. moderately or mildly dystrophic skeletal muscles. These pathobiochemical differences are probably due to variations in compensatory or adaptive mechanisms. The different subtypes of skeletal muscles studied in this report exhibit considerable dissimilarities in their contractile properties, their cellular size, motor unit organization, physiological adaptability, fibre type distribution, the extent of their calcium extrusion systems, vulnerability to proteolytic degradation, susceptibility to fibre degeneration, exposure to fatty tissue substitution, and predisposition to progressive myofibrosis. This would explain the differences in proteome-wide alterations related to proteins involved in the excitation-contraction-relaxation cycle, metabolite transportation, glycolysis, oxidative metabolism, the cytoskeletal network, the matrisome and the cellular stress response. Secondary changes in severely affected muscles that lack dystrophin are related to an (i) up-regulation of molecular chaperones, (ii) the compensatory increase in proteins of the intermediate filaments, (iii) the fibrosis-related increase in collagen levels, and (iv) the pathophysiological decrease in calcium binding proteins.
Figure 9.
Comparative immunoblotting to illustrate the drastic differences in biomarker concentrations between a severely dystrophic phenotype, the mdx diaphragm (DIA), vs. a mildly affected muscle, the mdx interosseus (INT) muscle. Lane 1 and 2 represent specimens from the mdx animal model of Duchenne muscular dystrophy vs. wild type (wt) specimens, respectively. Antibody labelling was used to determine the concentration of the small heat shock protein αB-crystallin and carbonic anhydrase isoform CA3, as shown in the upper part of the figure. The graphical representation of the immuno-decoration levels for αB-crystallin and carbonic anhydrase in mdx vs. wt muscles is shown in the lower part of the figure (Student’s t-test, unpaired; n = 4; * p < 0.05; *** p < 0.001).
The new set of universal and muscle-associated biomarkers of progressive muscular dystrophy, such as annexin, lamin, and vimentin, can now be employed to establish improved predictive, diagnostic, prognostic and therapy-monitoring approaches focusing on murine models of dystrophinopathy [
70]. Besides pharmacological treatments of general muscle wasting and cardio-respiratory complications, using glucocorticoids, diuretics and beta-blockers [
71,
72,
73,
74], new efforts to address the progressive nature of X-linked muscular dystrophy lie in cell-based, gene transfer, stop-codon read-through and exon-skipping procedures [
75,
76,
77,
78,
79,
80,
81]. Proteomic markers can be extremely helpful in judging the overall effectiveness of these new therapeutic methods, since changes in these muscle proteins can give excellent indications of the reversal of specific damage pathways involved in progressive dystrophinopathies of model organisms [
82].


