
Understanding the Mechanism of Action of Triazine-Phosphonate Derivatives as Flame Retardants for Cotton Fabric


 ,
,
Abstract
:
1. Introduction

2. Results and Discussion
2.1. Fabric Treatment
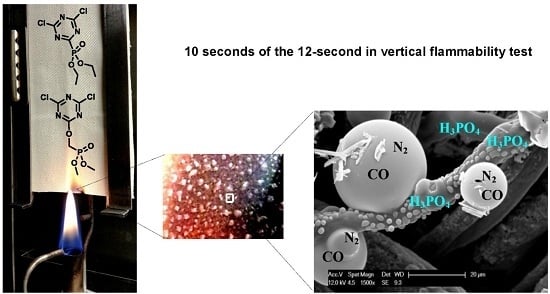
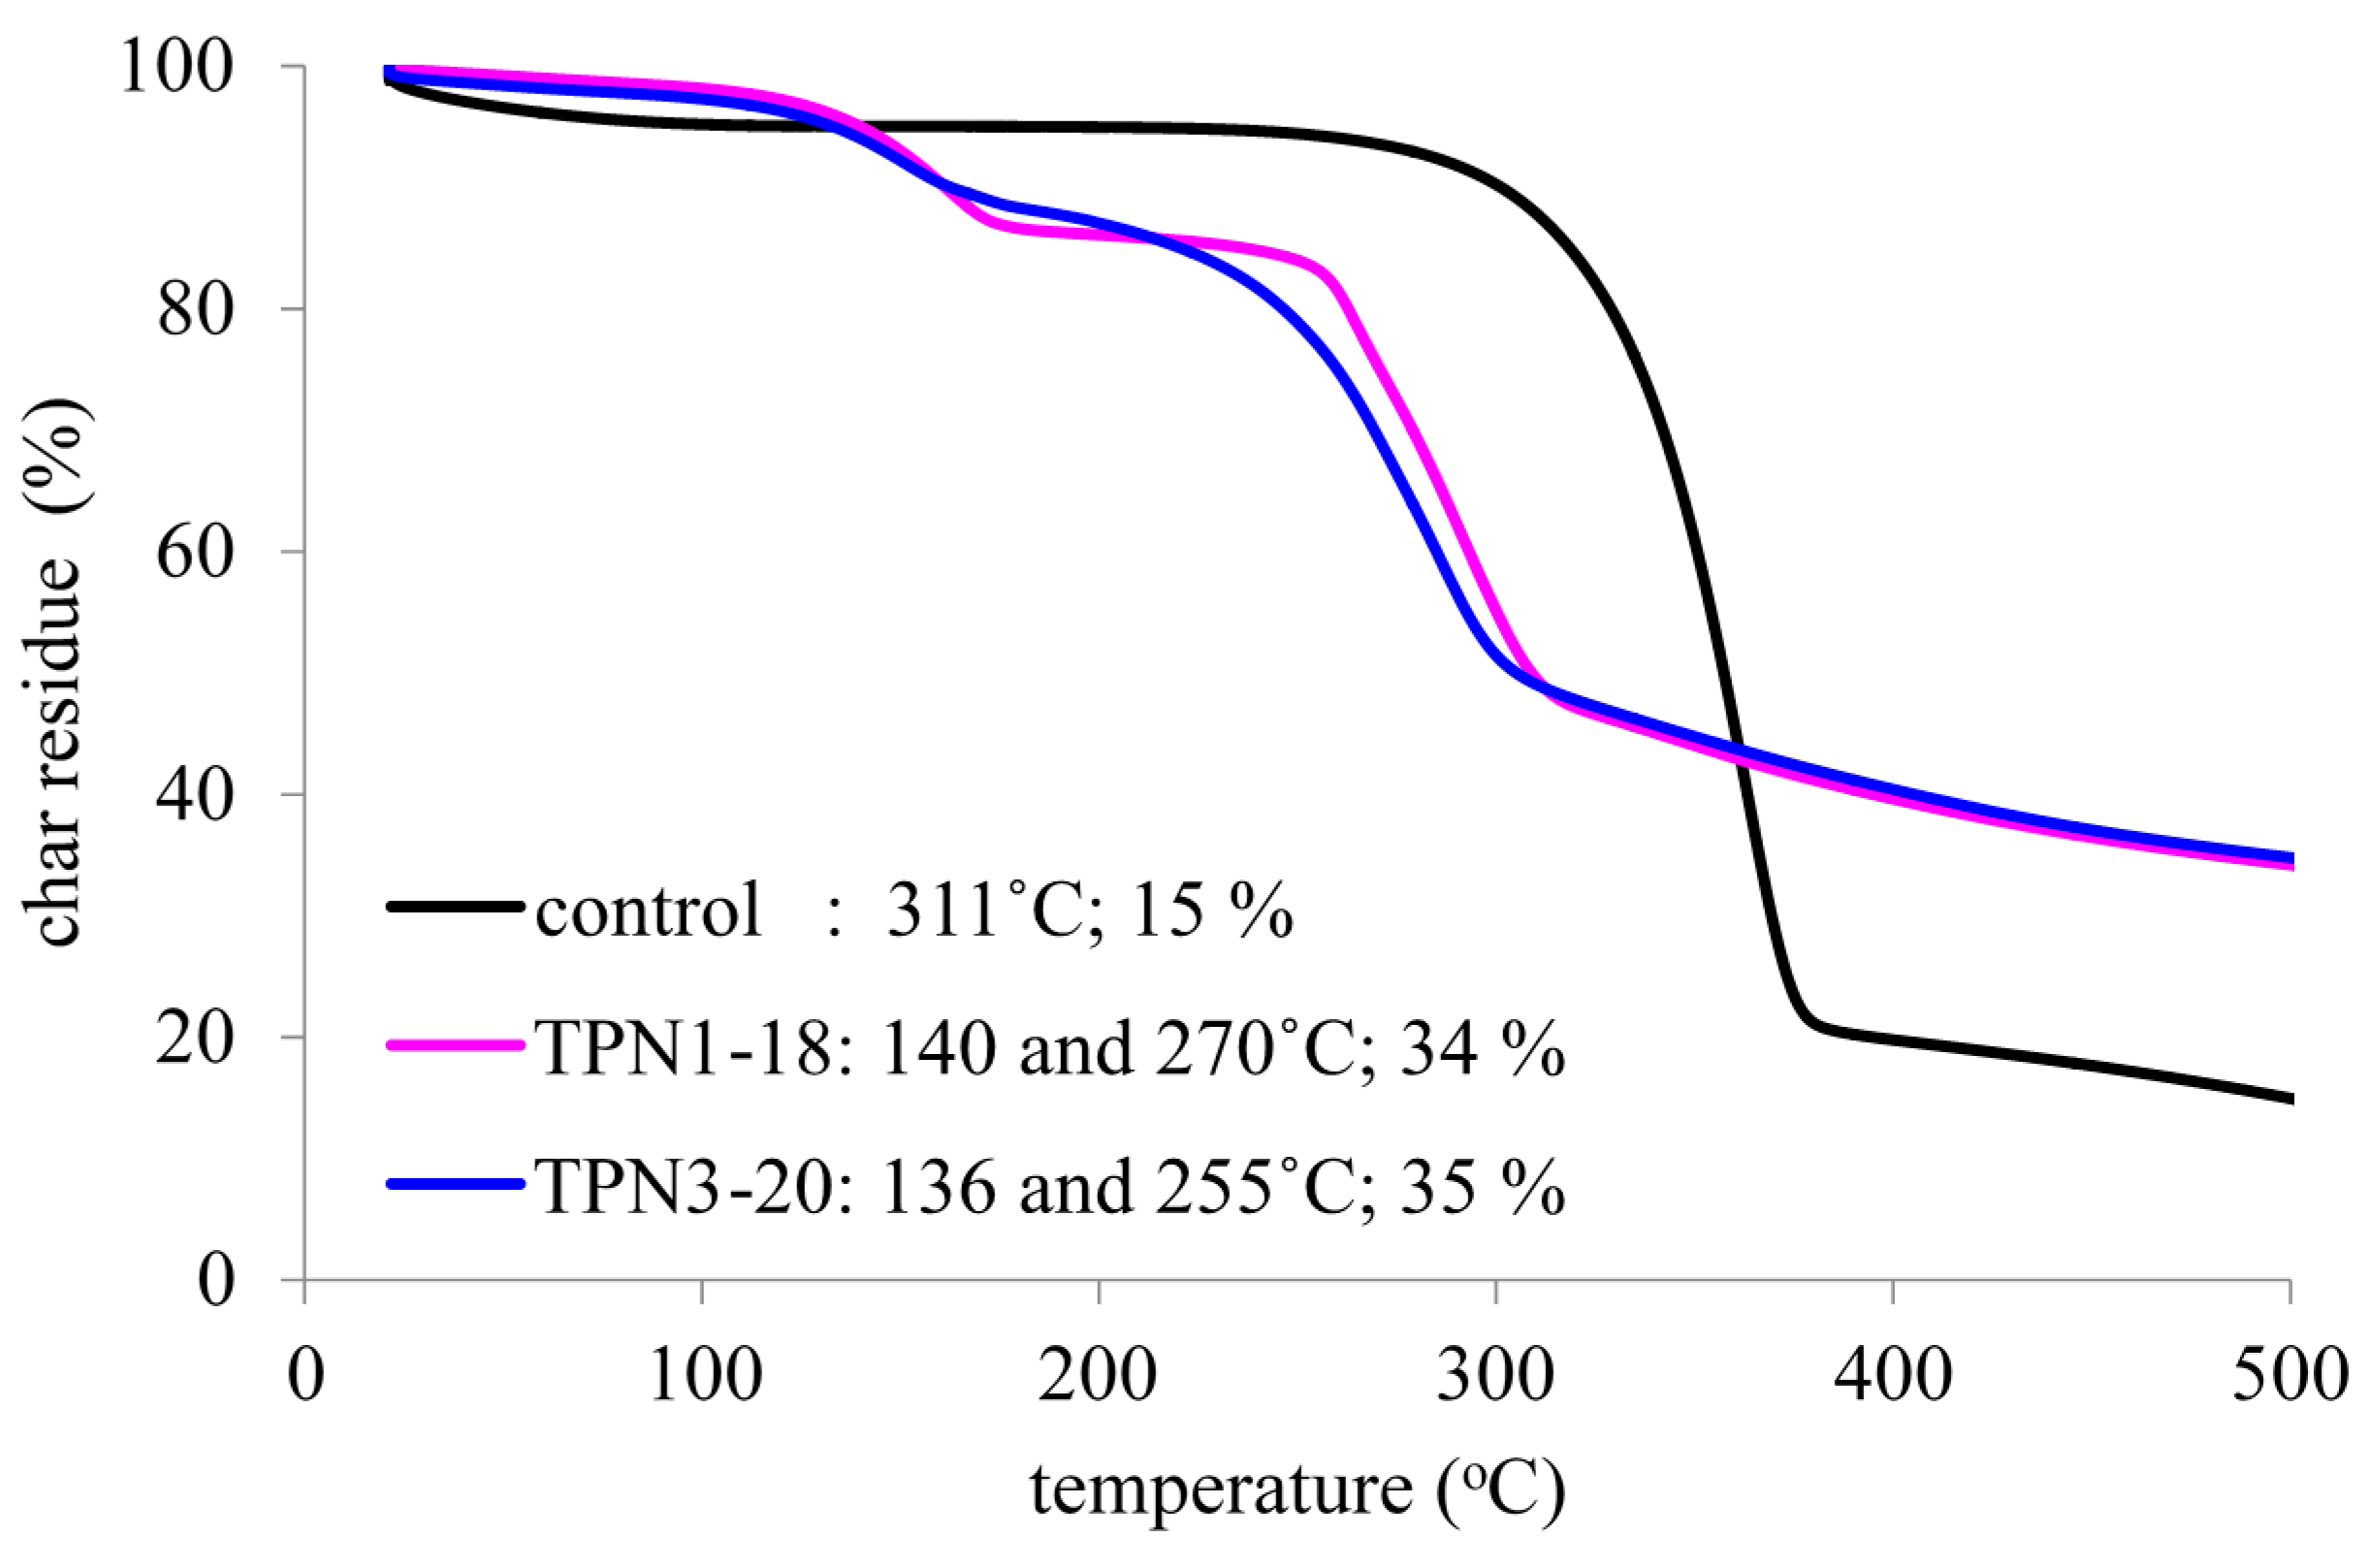
2.2. Thermal Decomposition of Fabrics Treated with TPN1 and TPN3: Investigation of Chemical Components in both Gas and Solid Phases
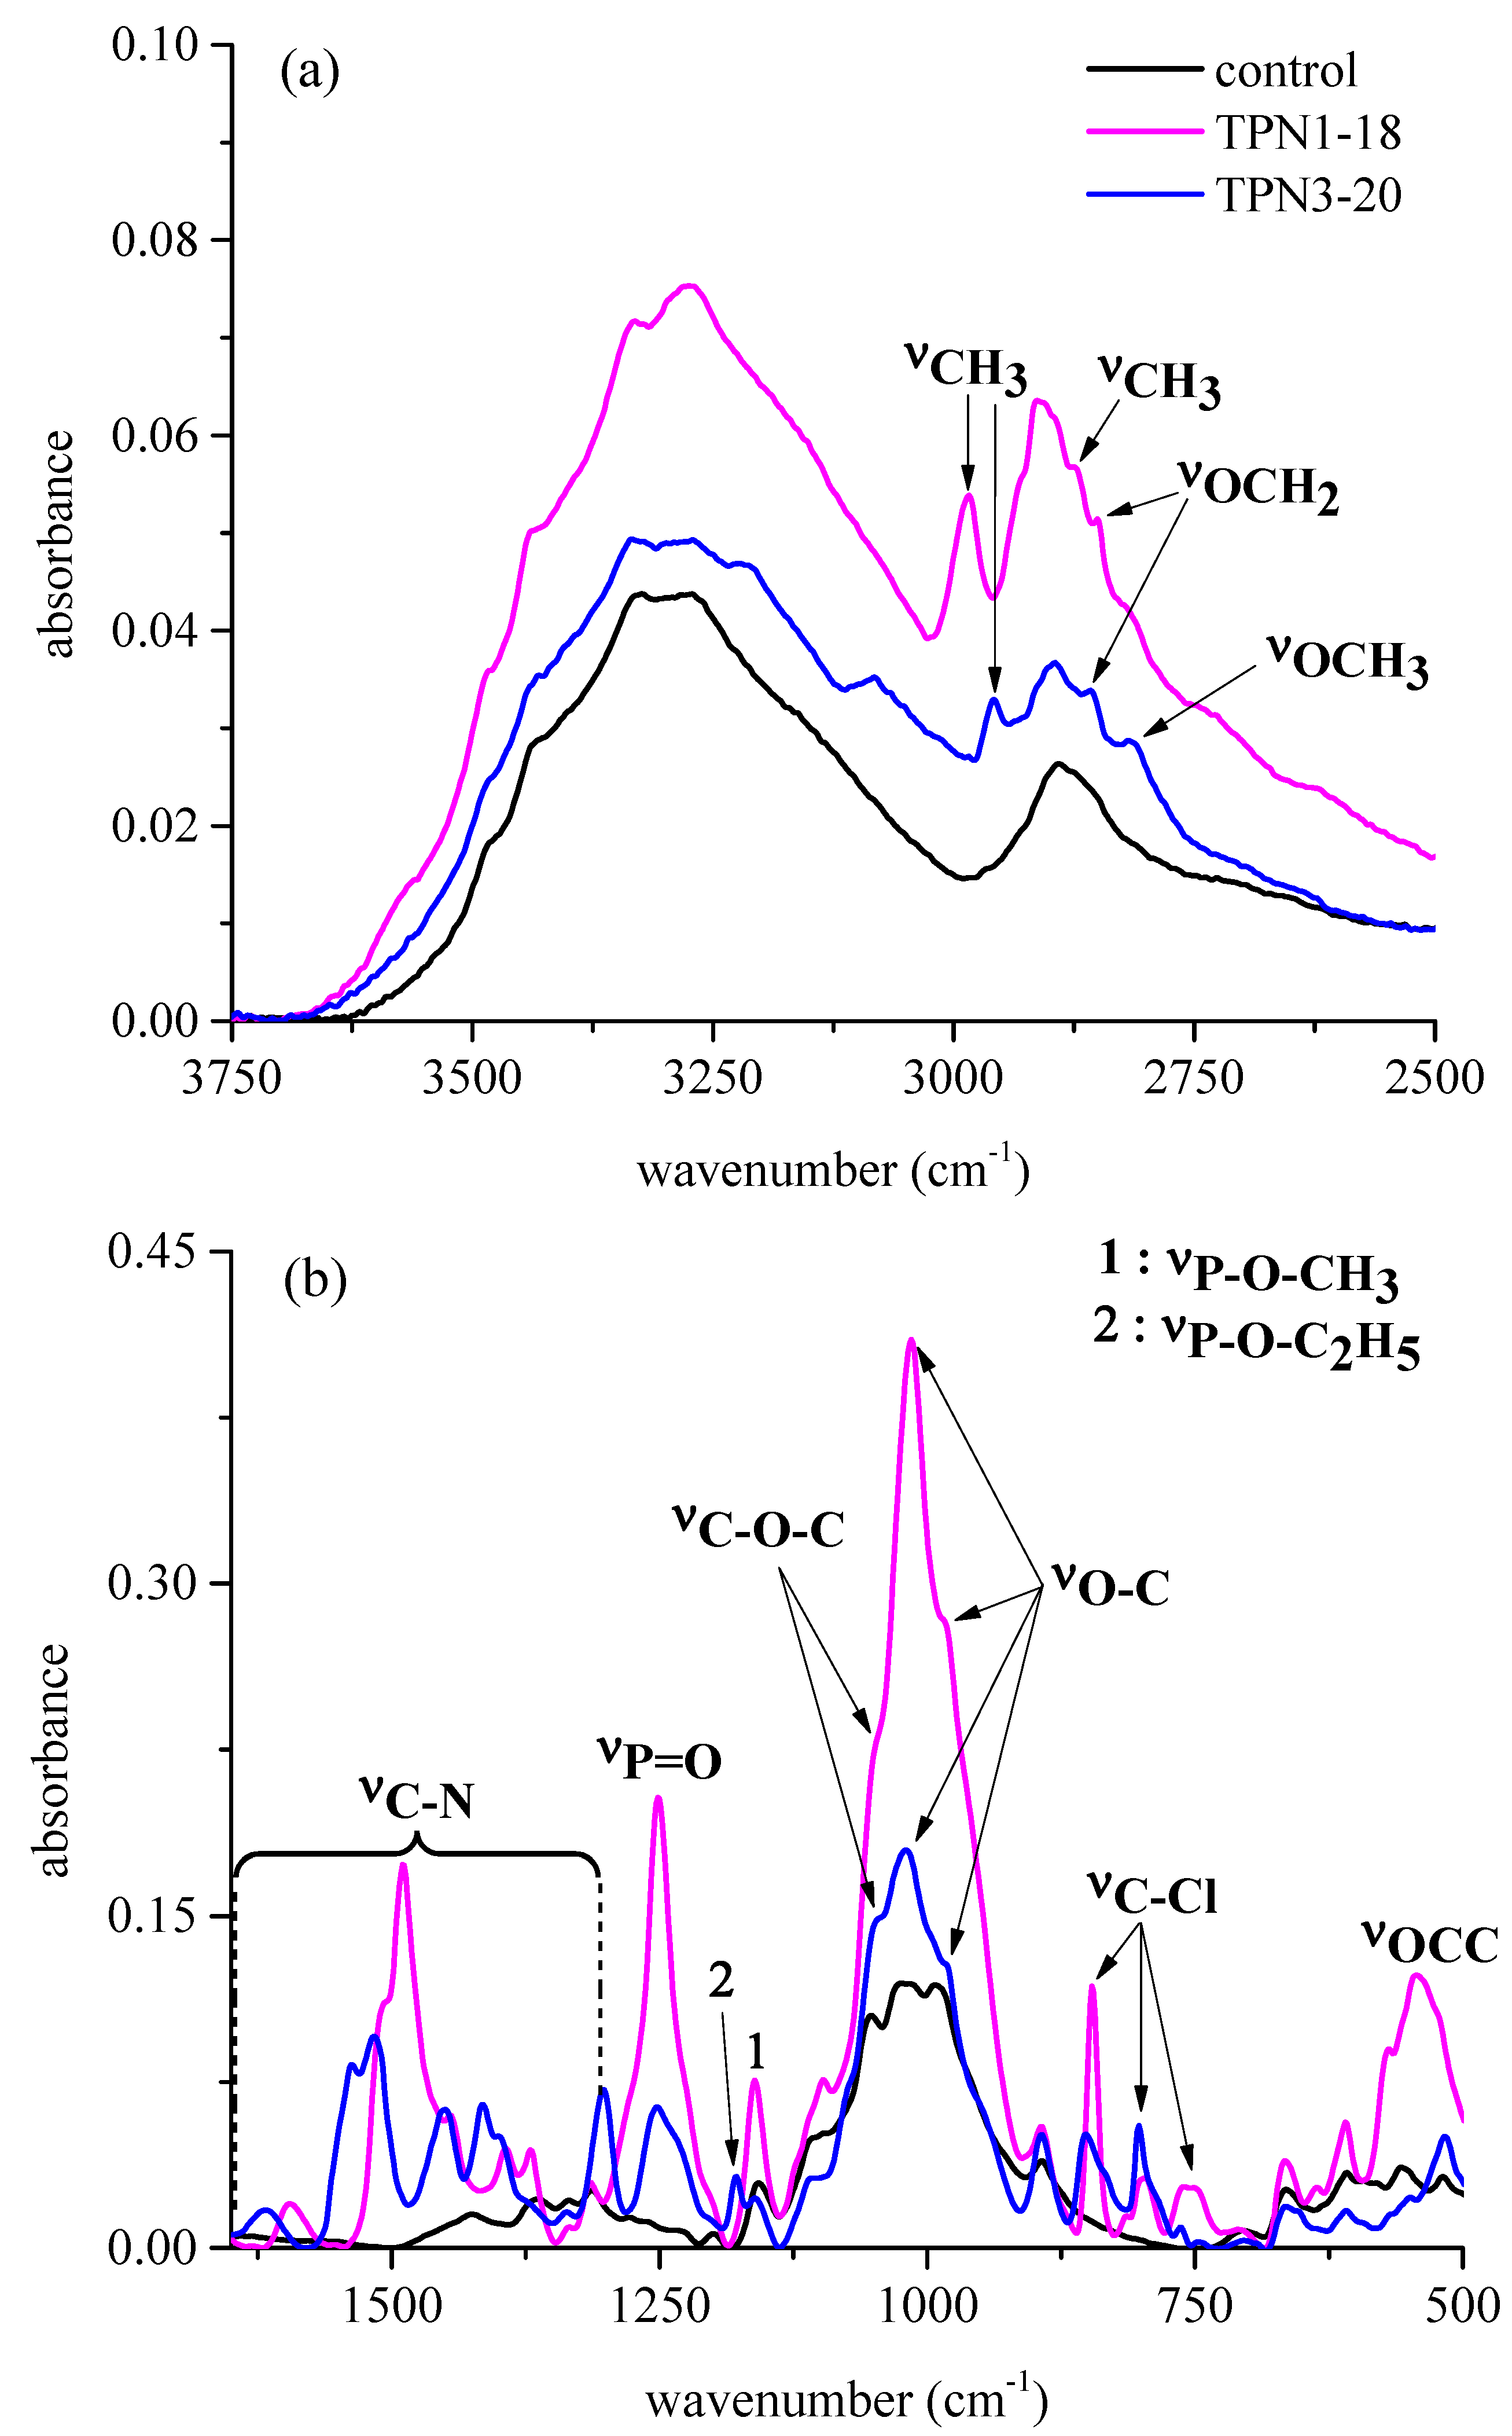
2.2.1. Functional Groups Observed on the Surface of Treated Fabrics before thermal Decomposition

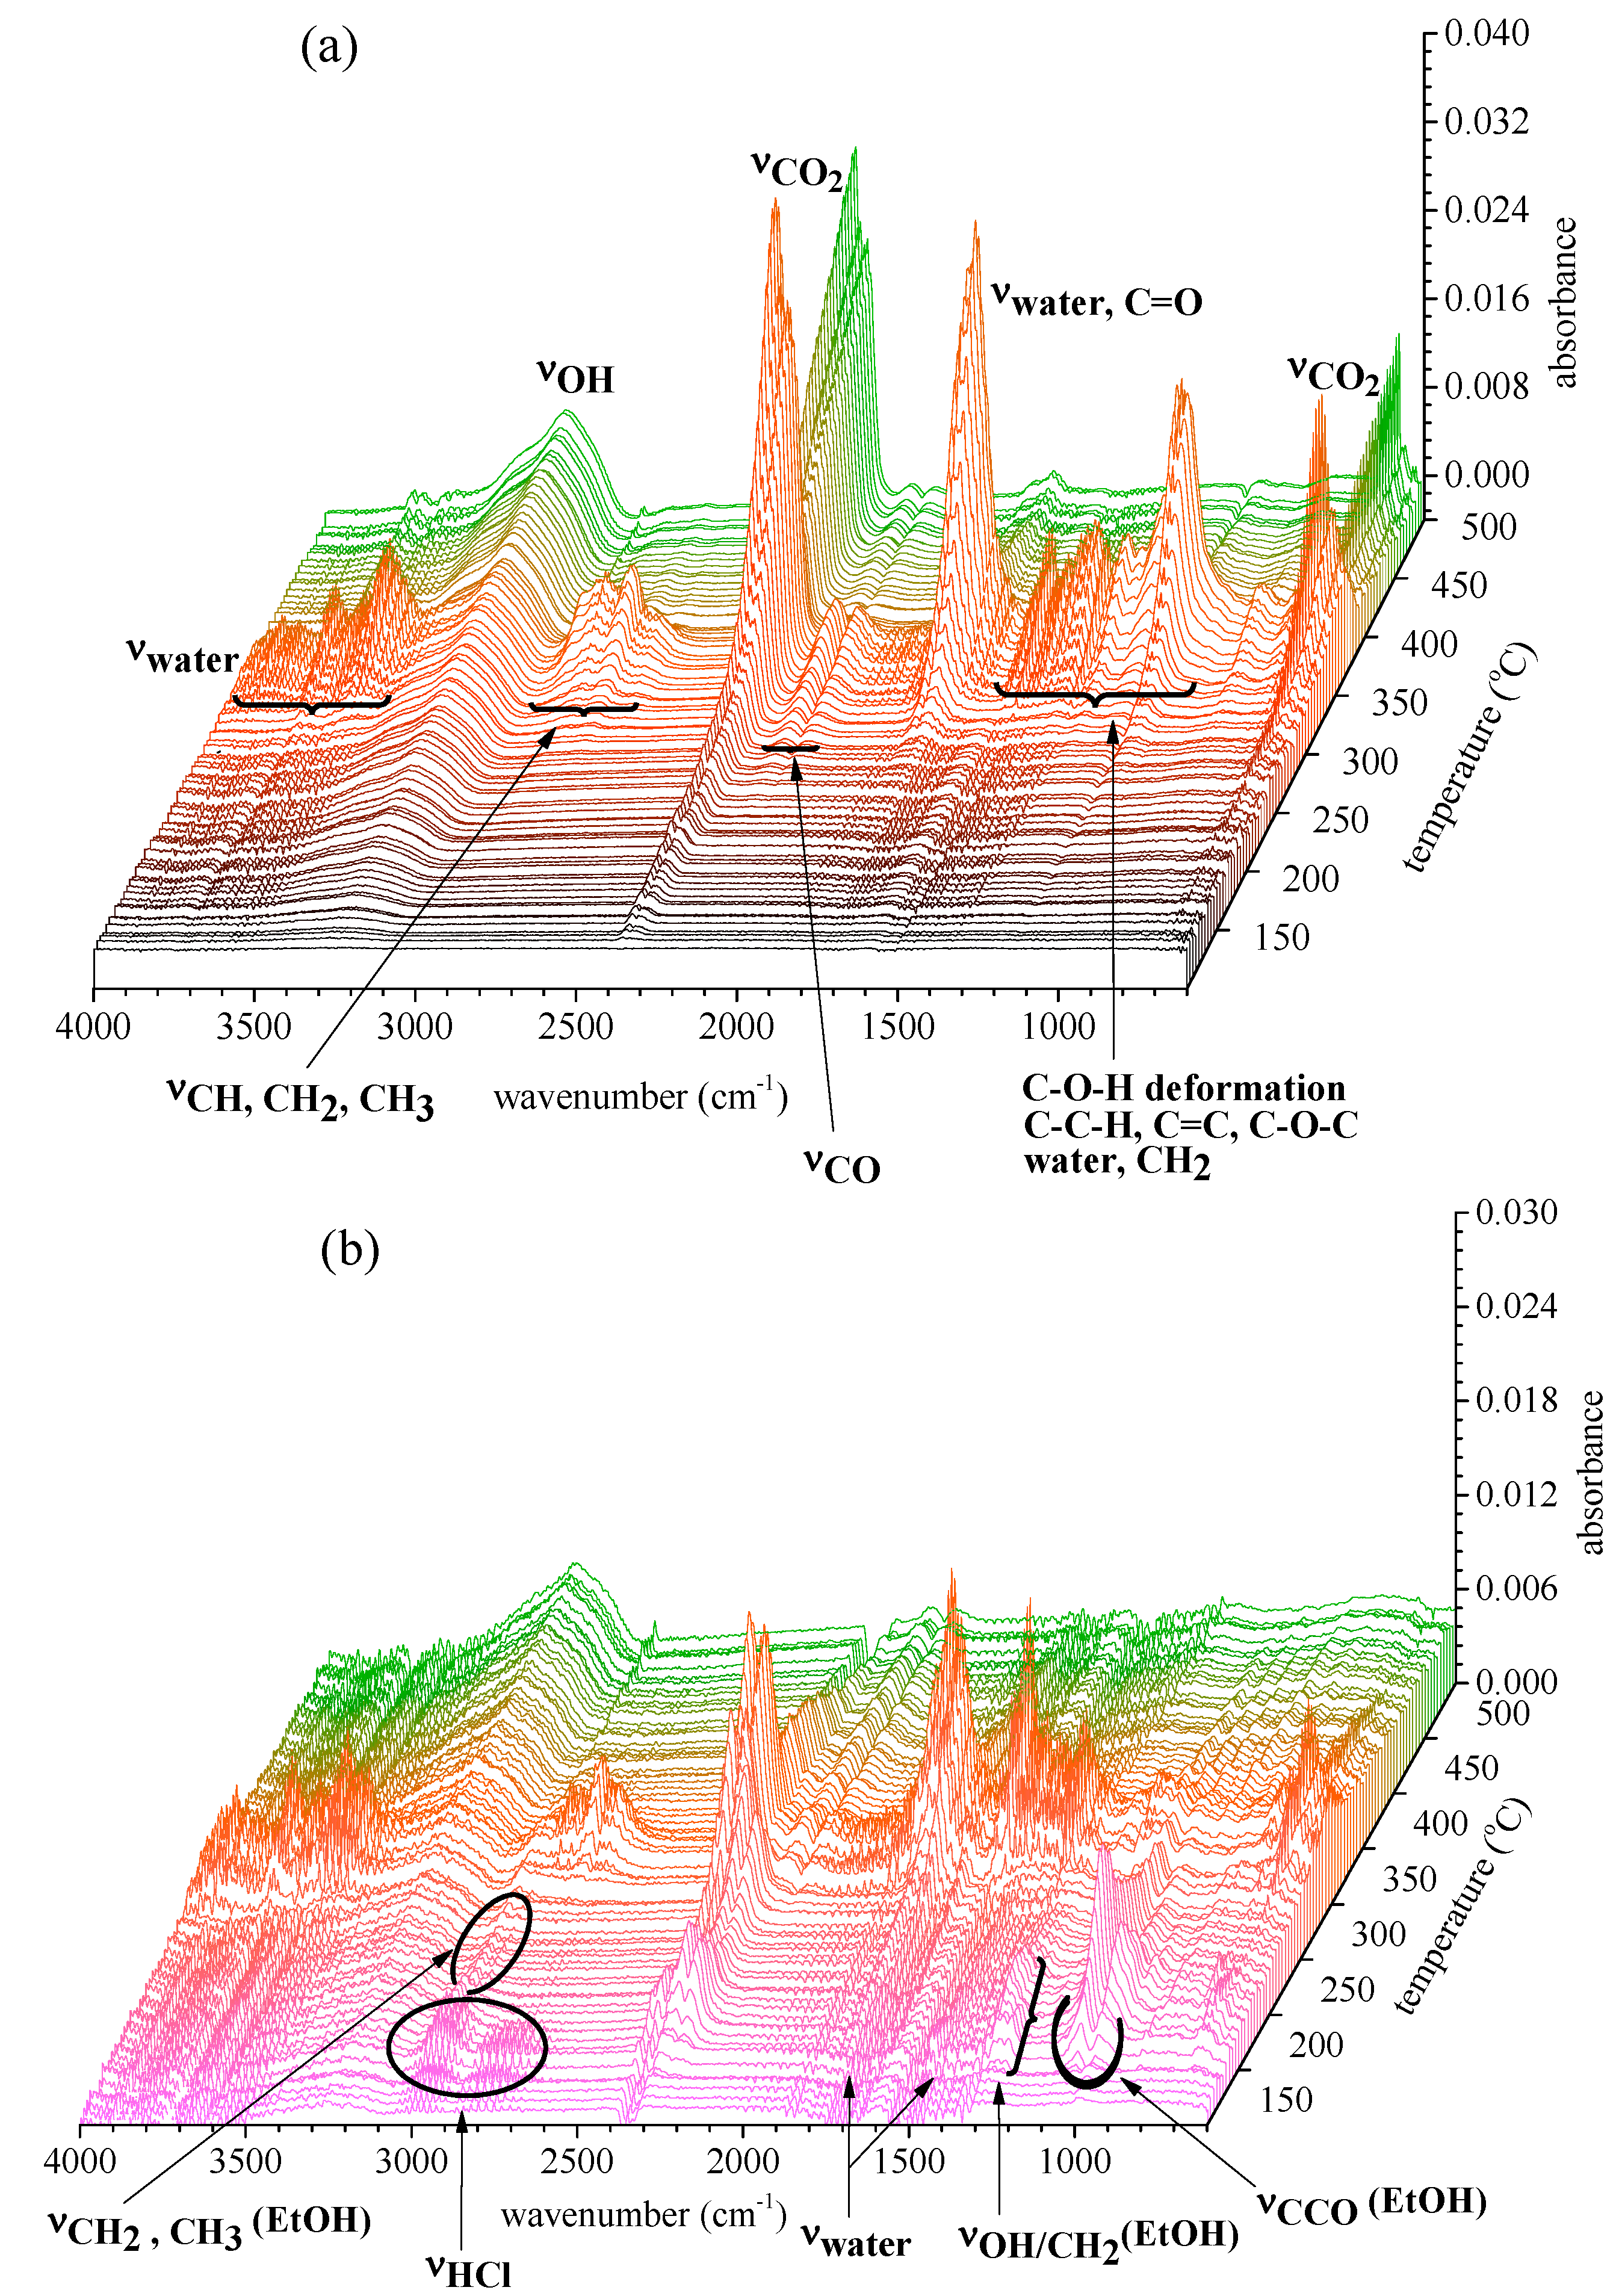
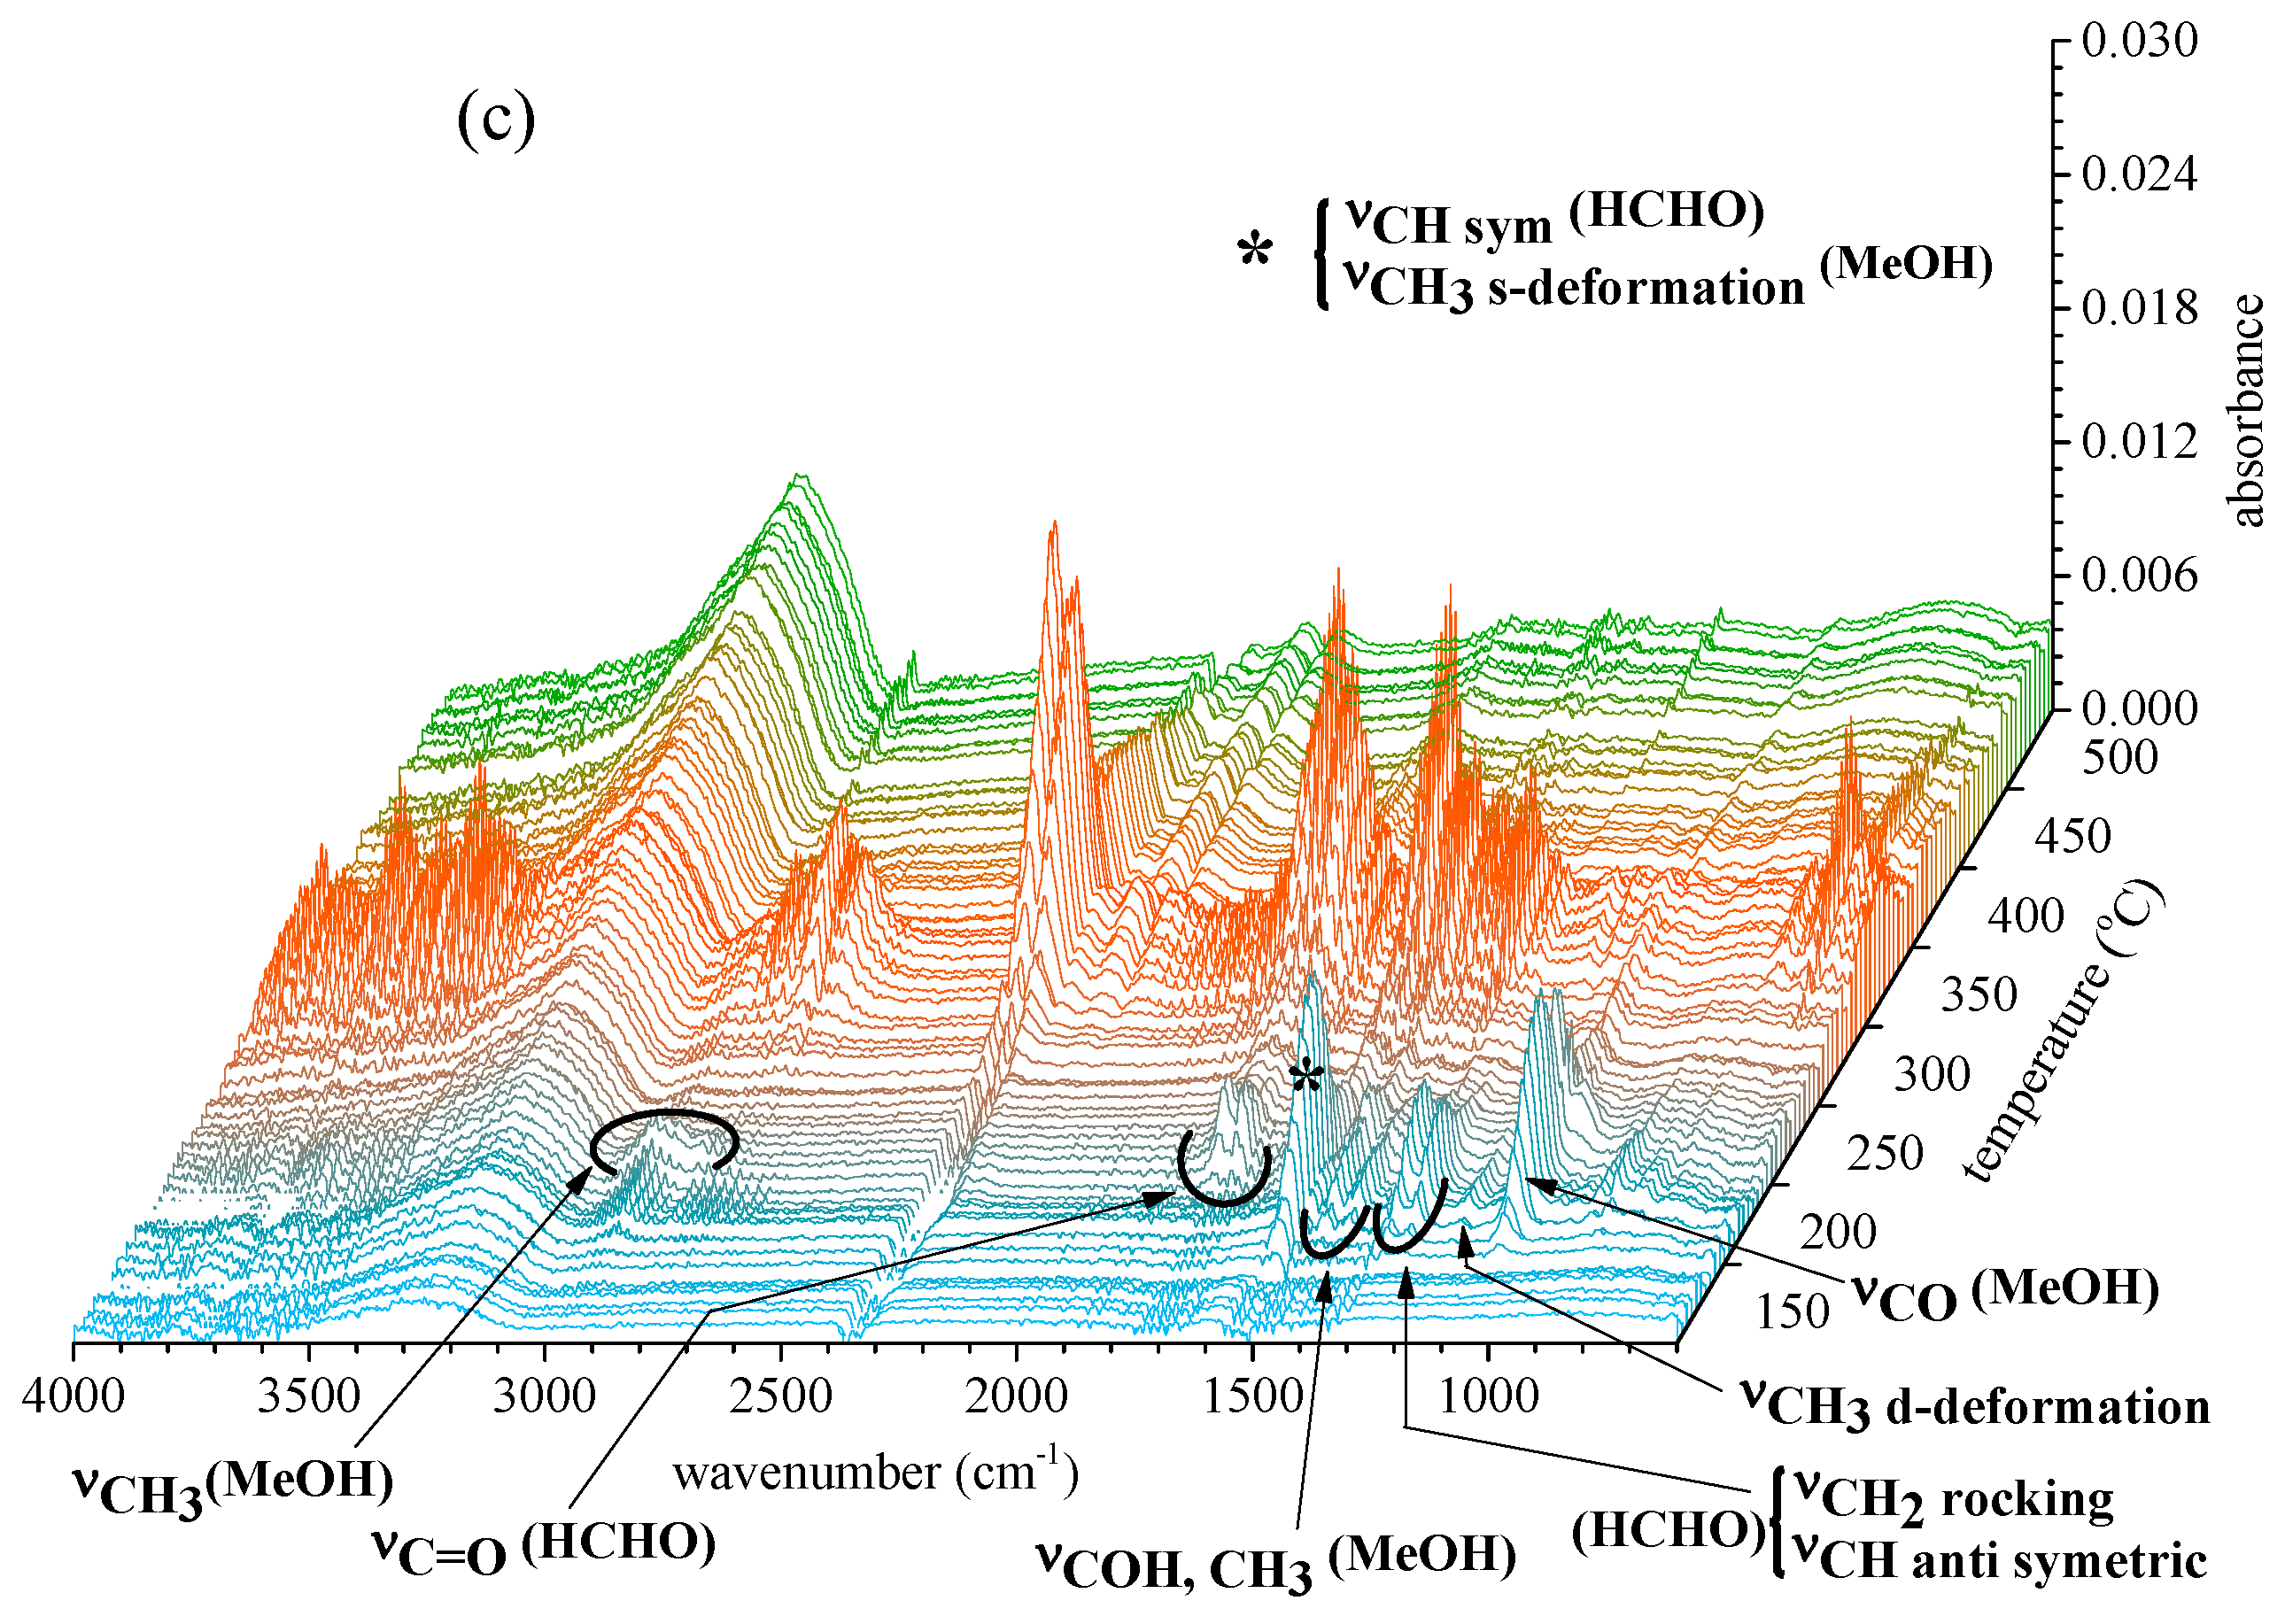
2.2.2. Gas Products Released during Thermal Decomposition


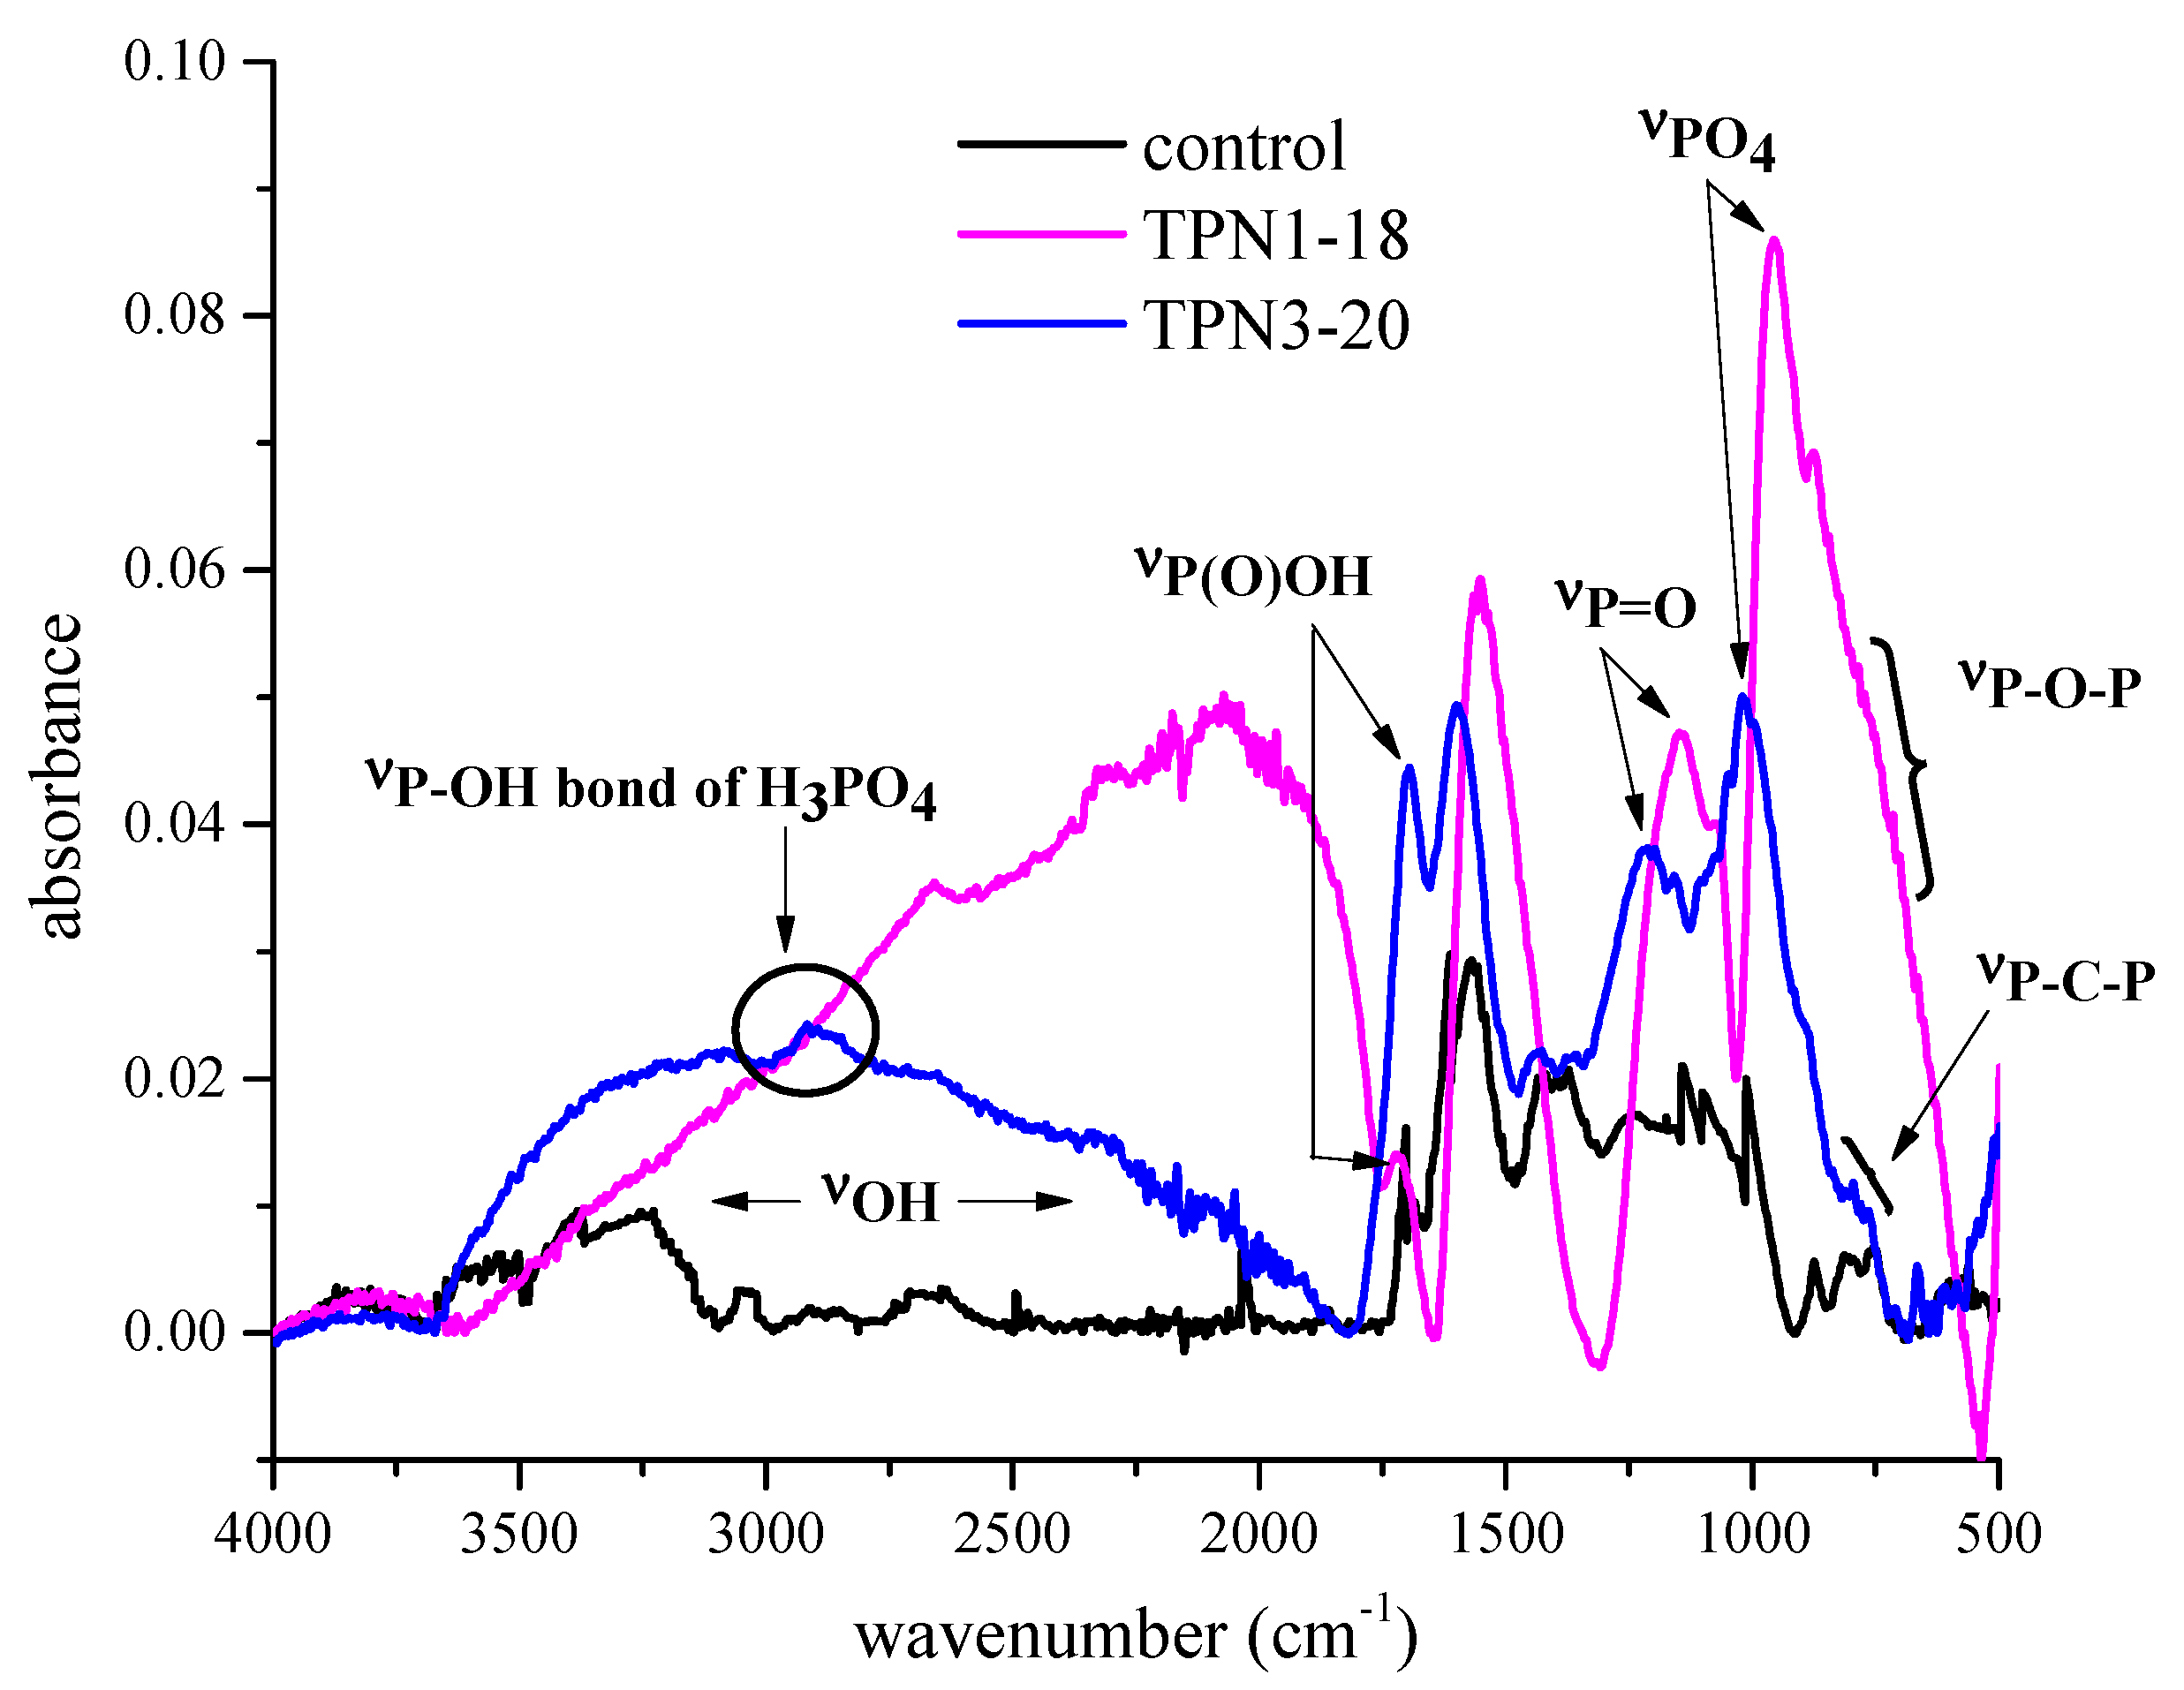
2.2.3. Information on Char: Functional Groups Observed by ATR-IR
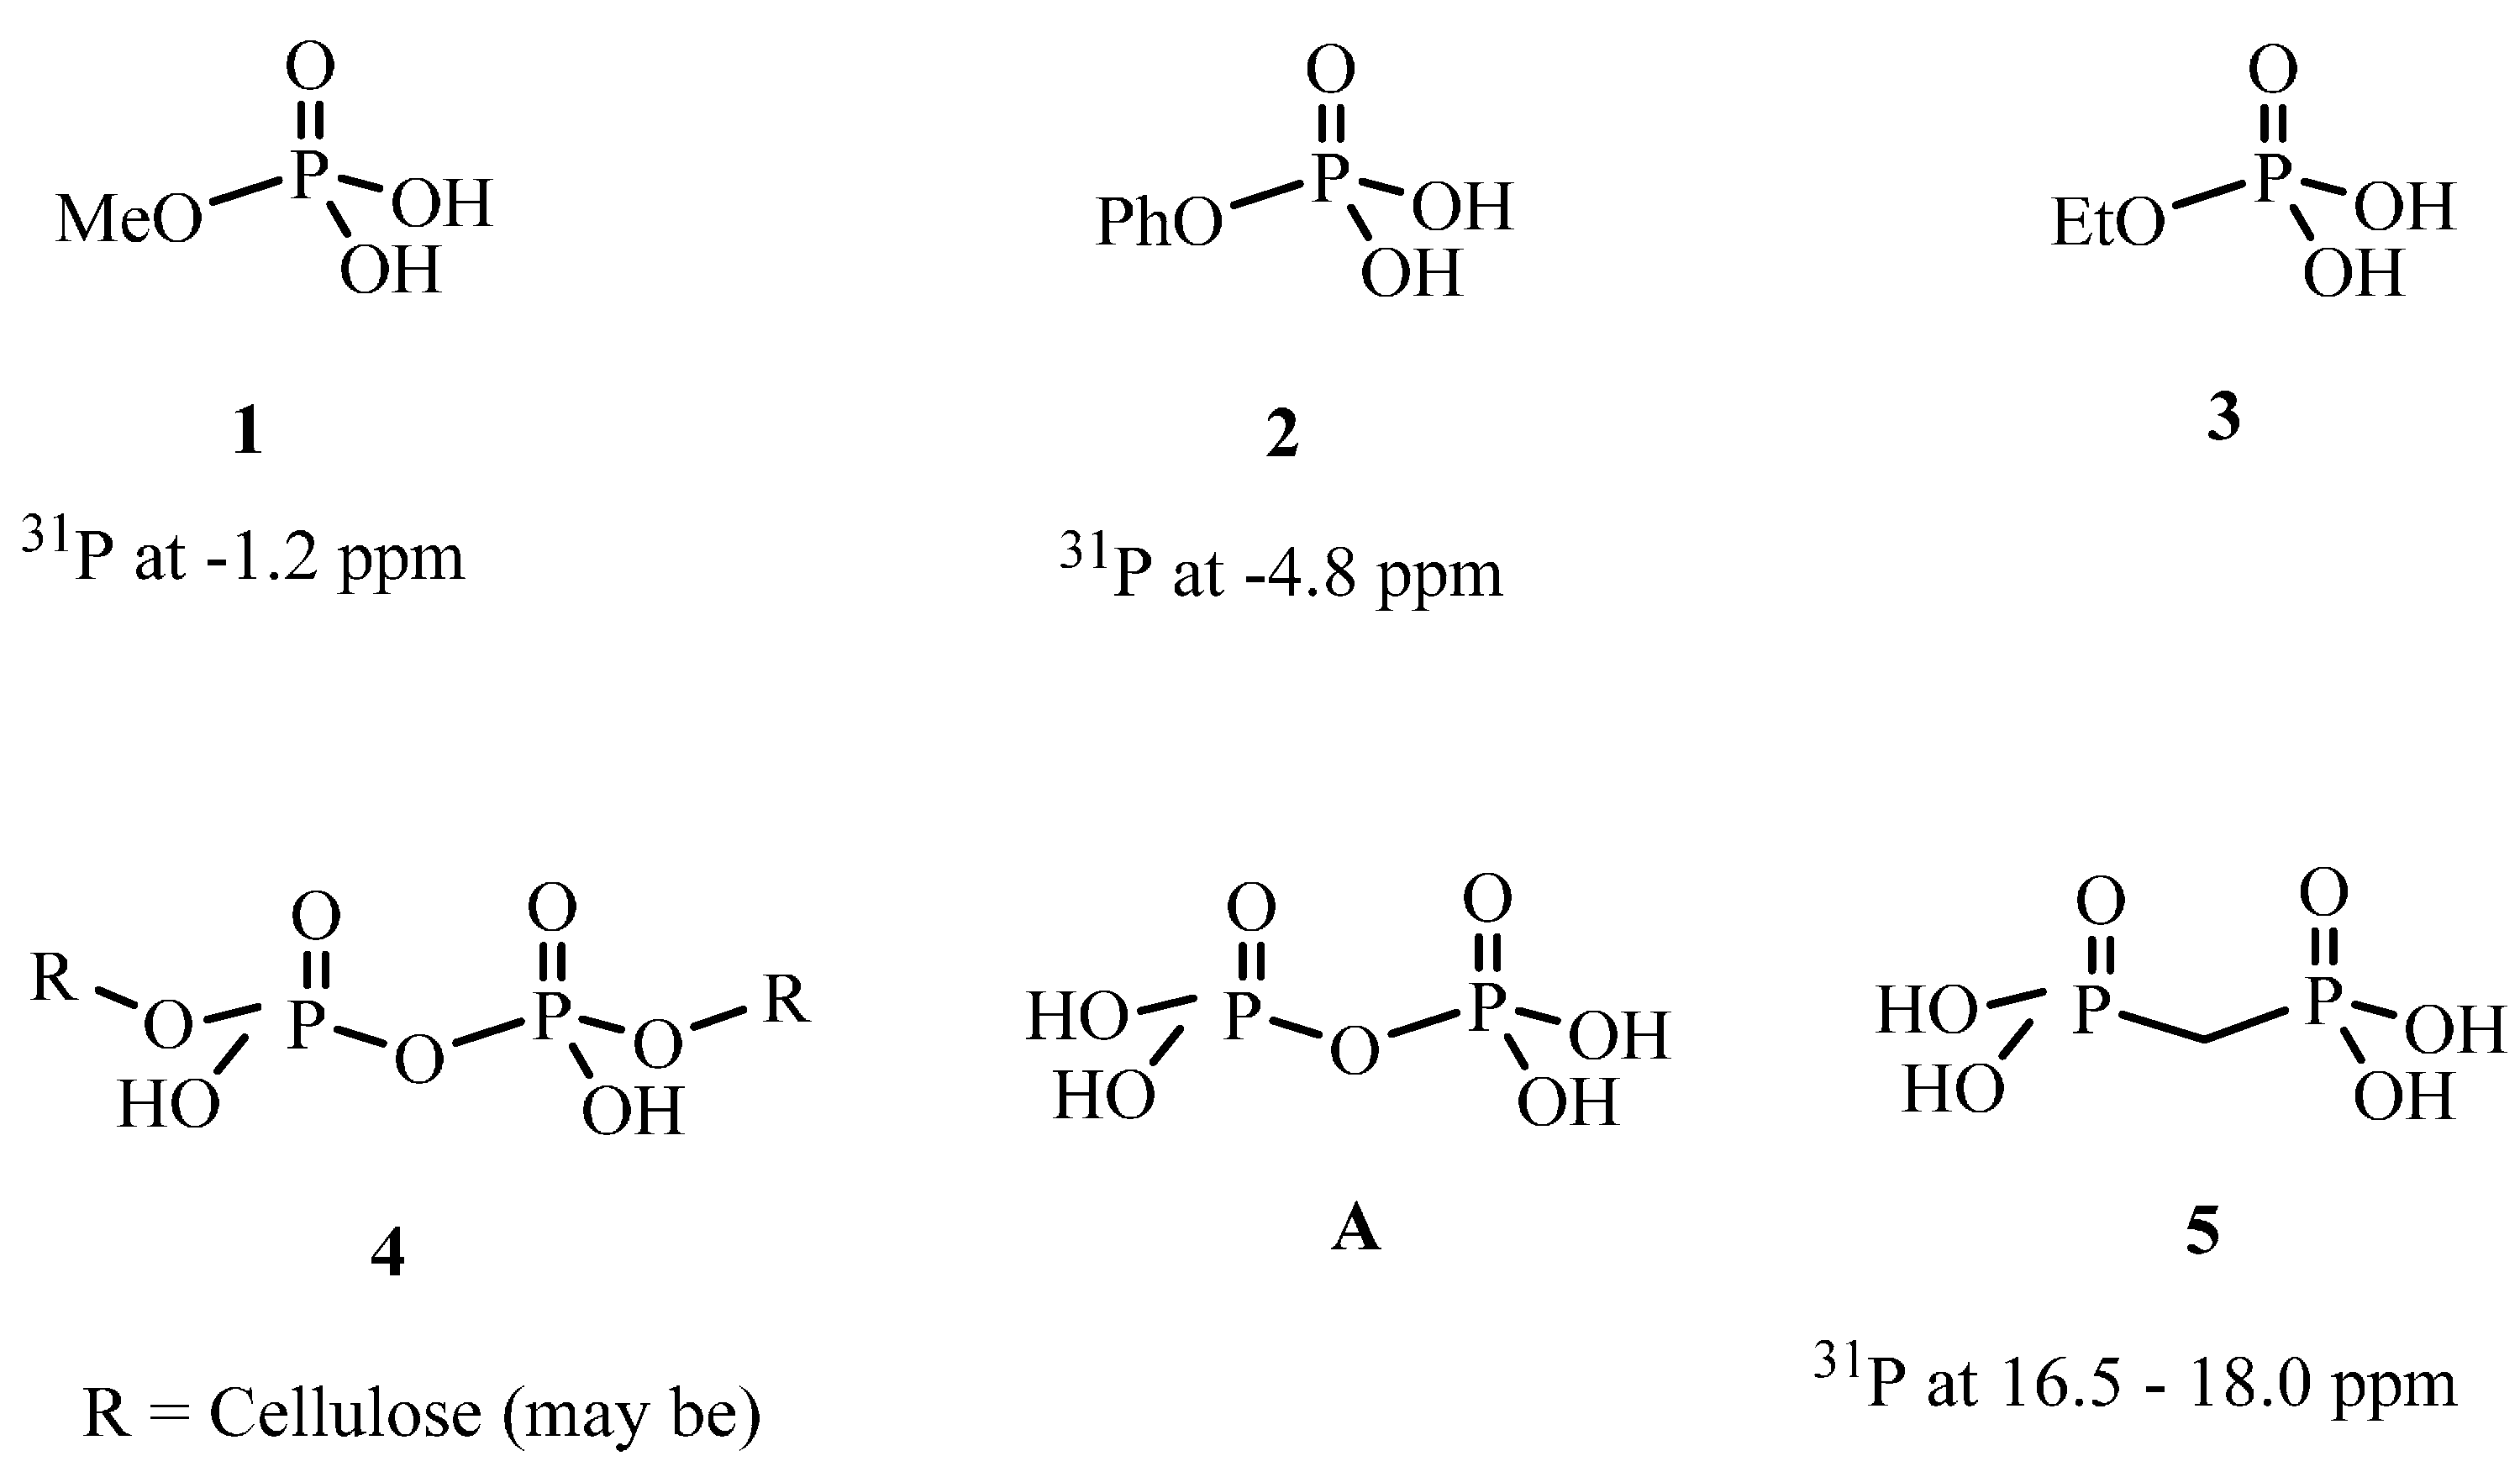
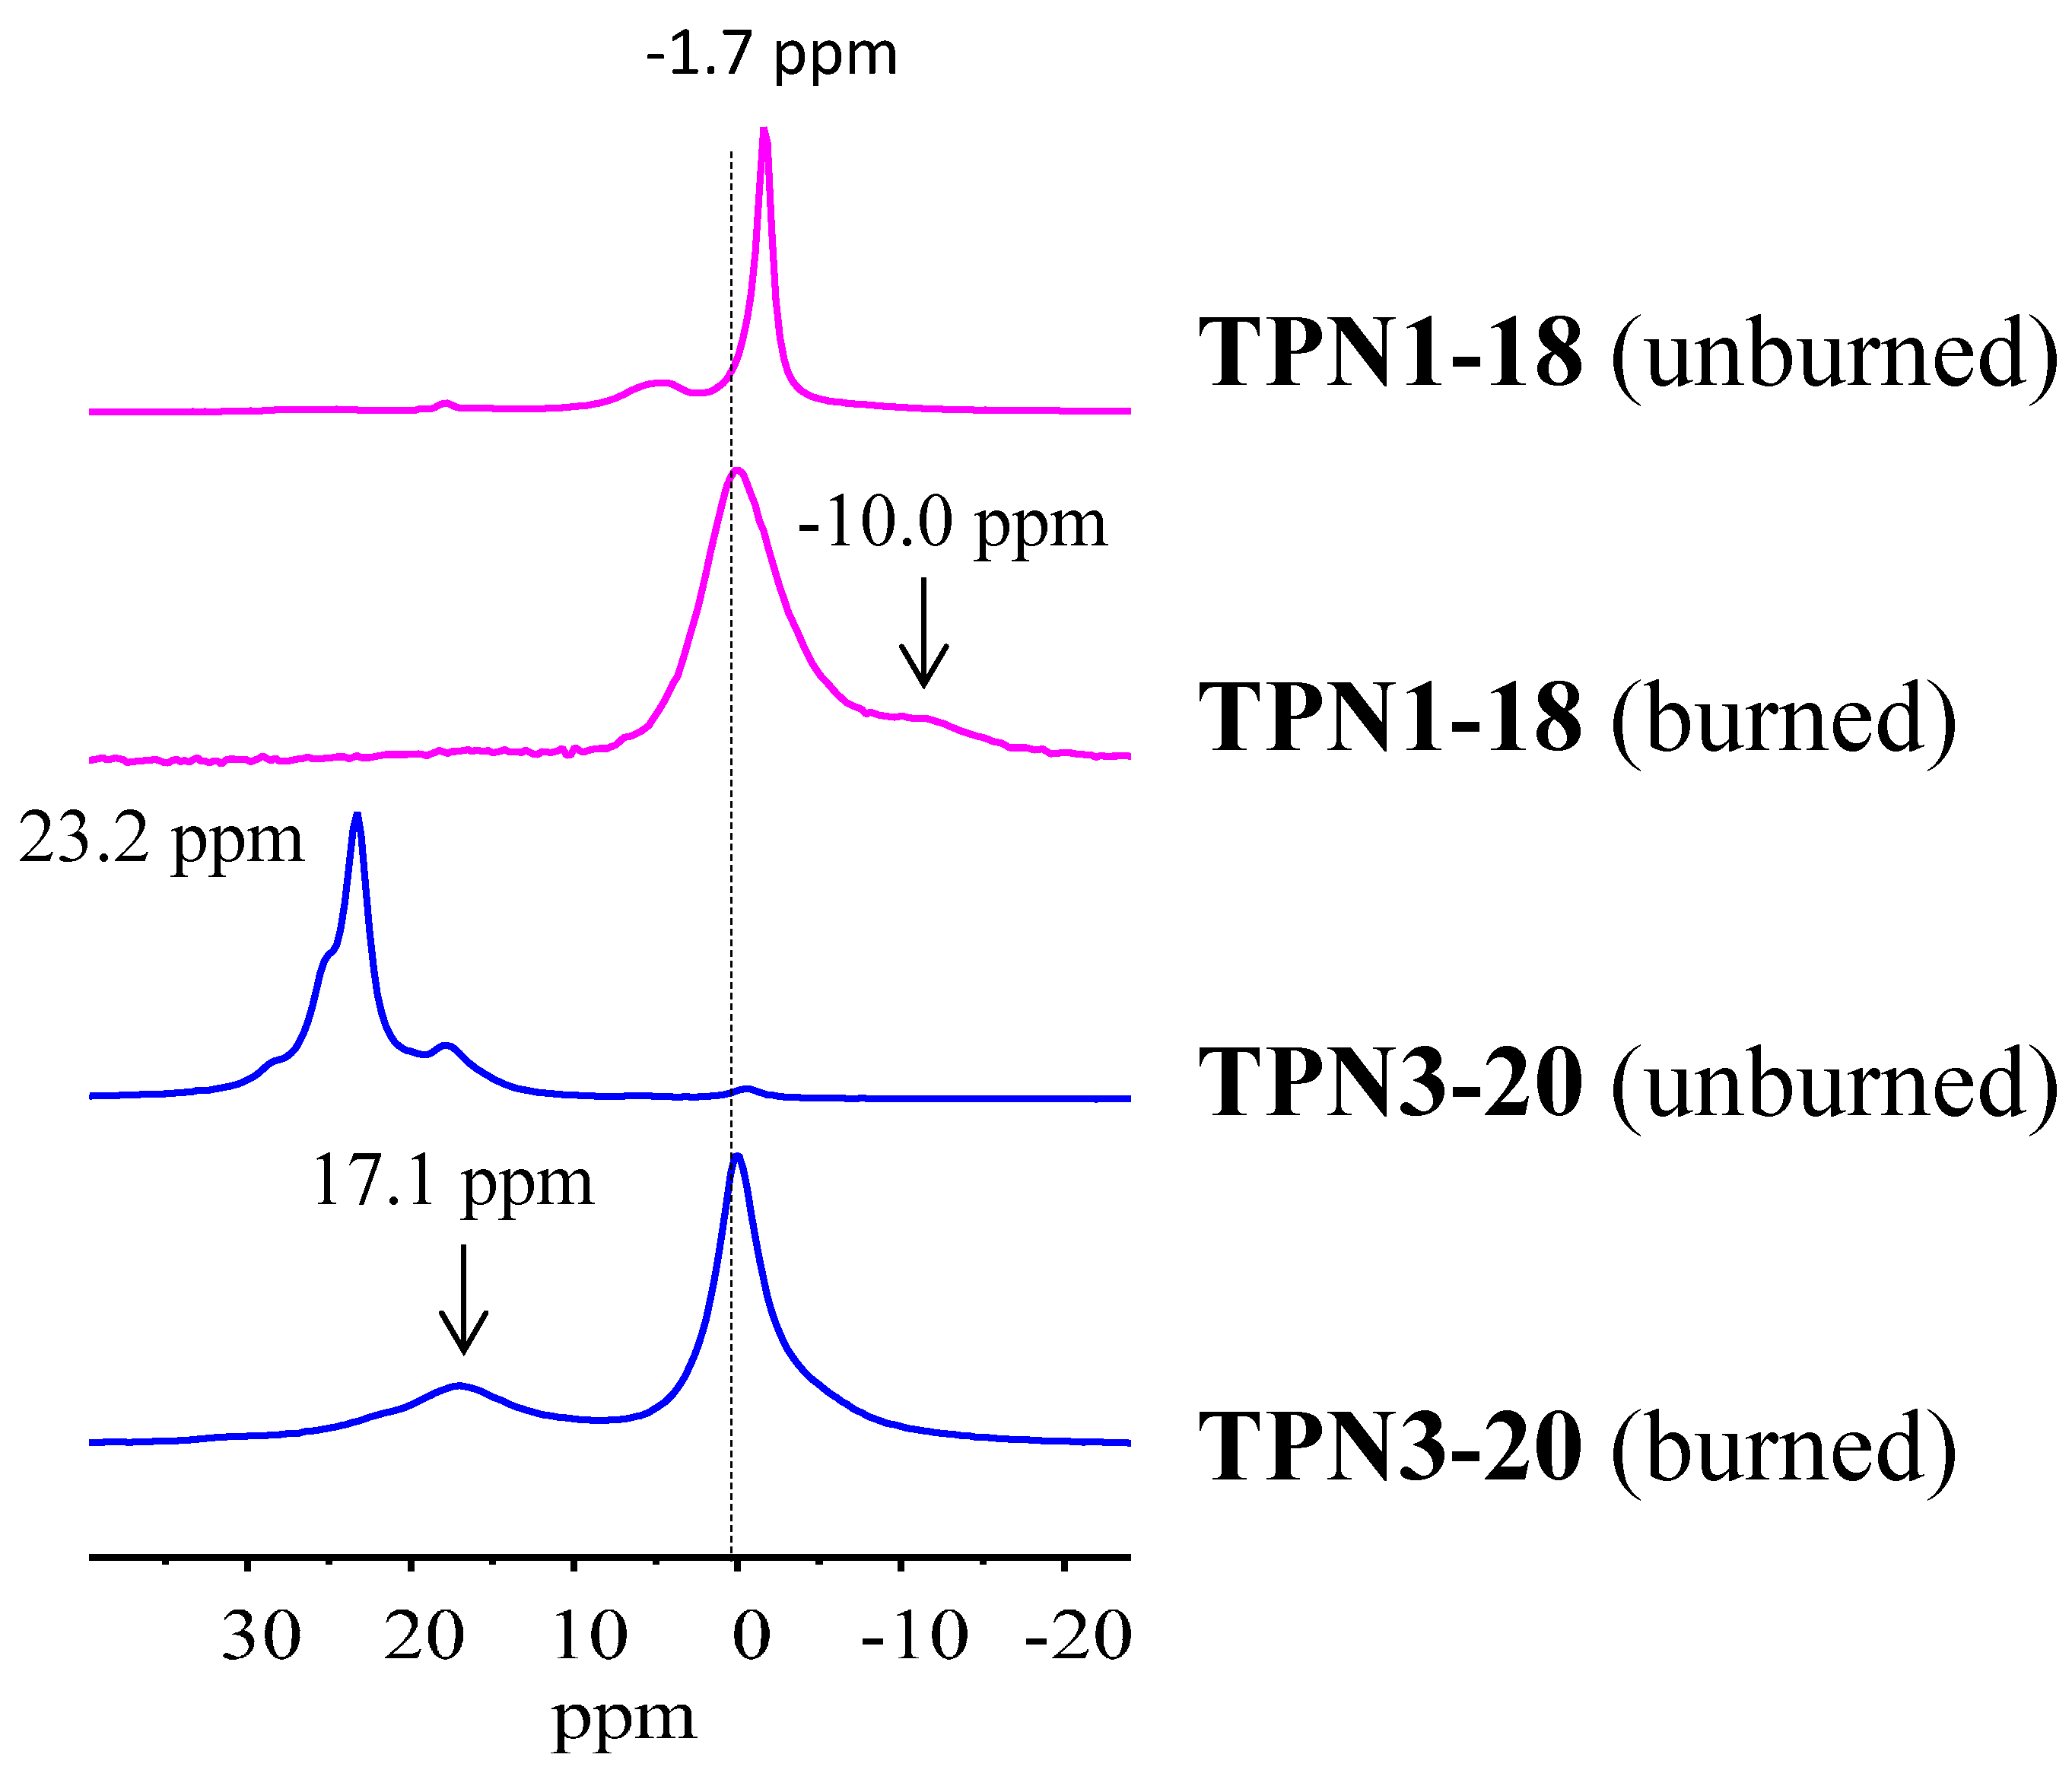
2.2.4. 31P solid State NMR of Treated Fabrics

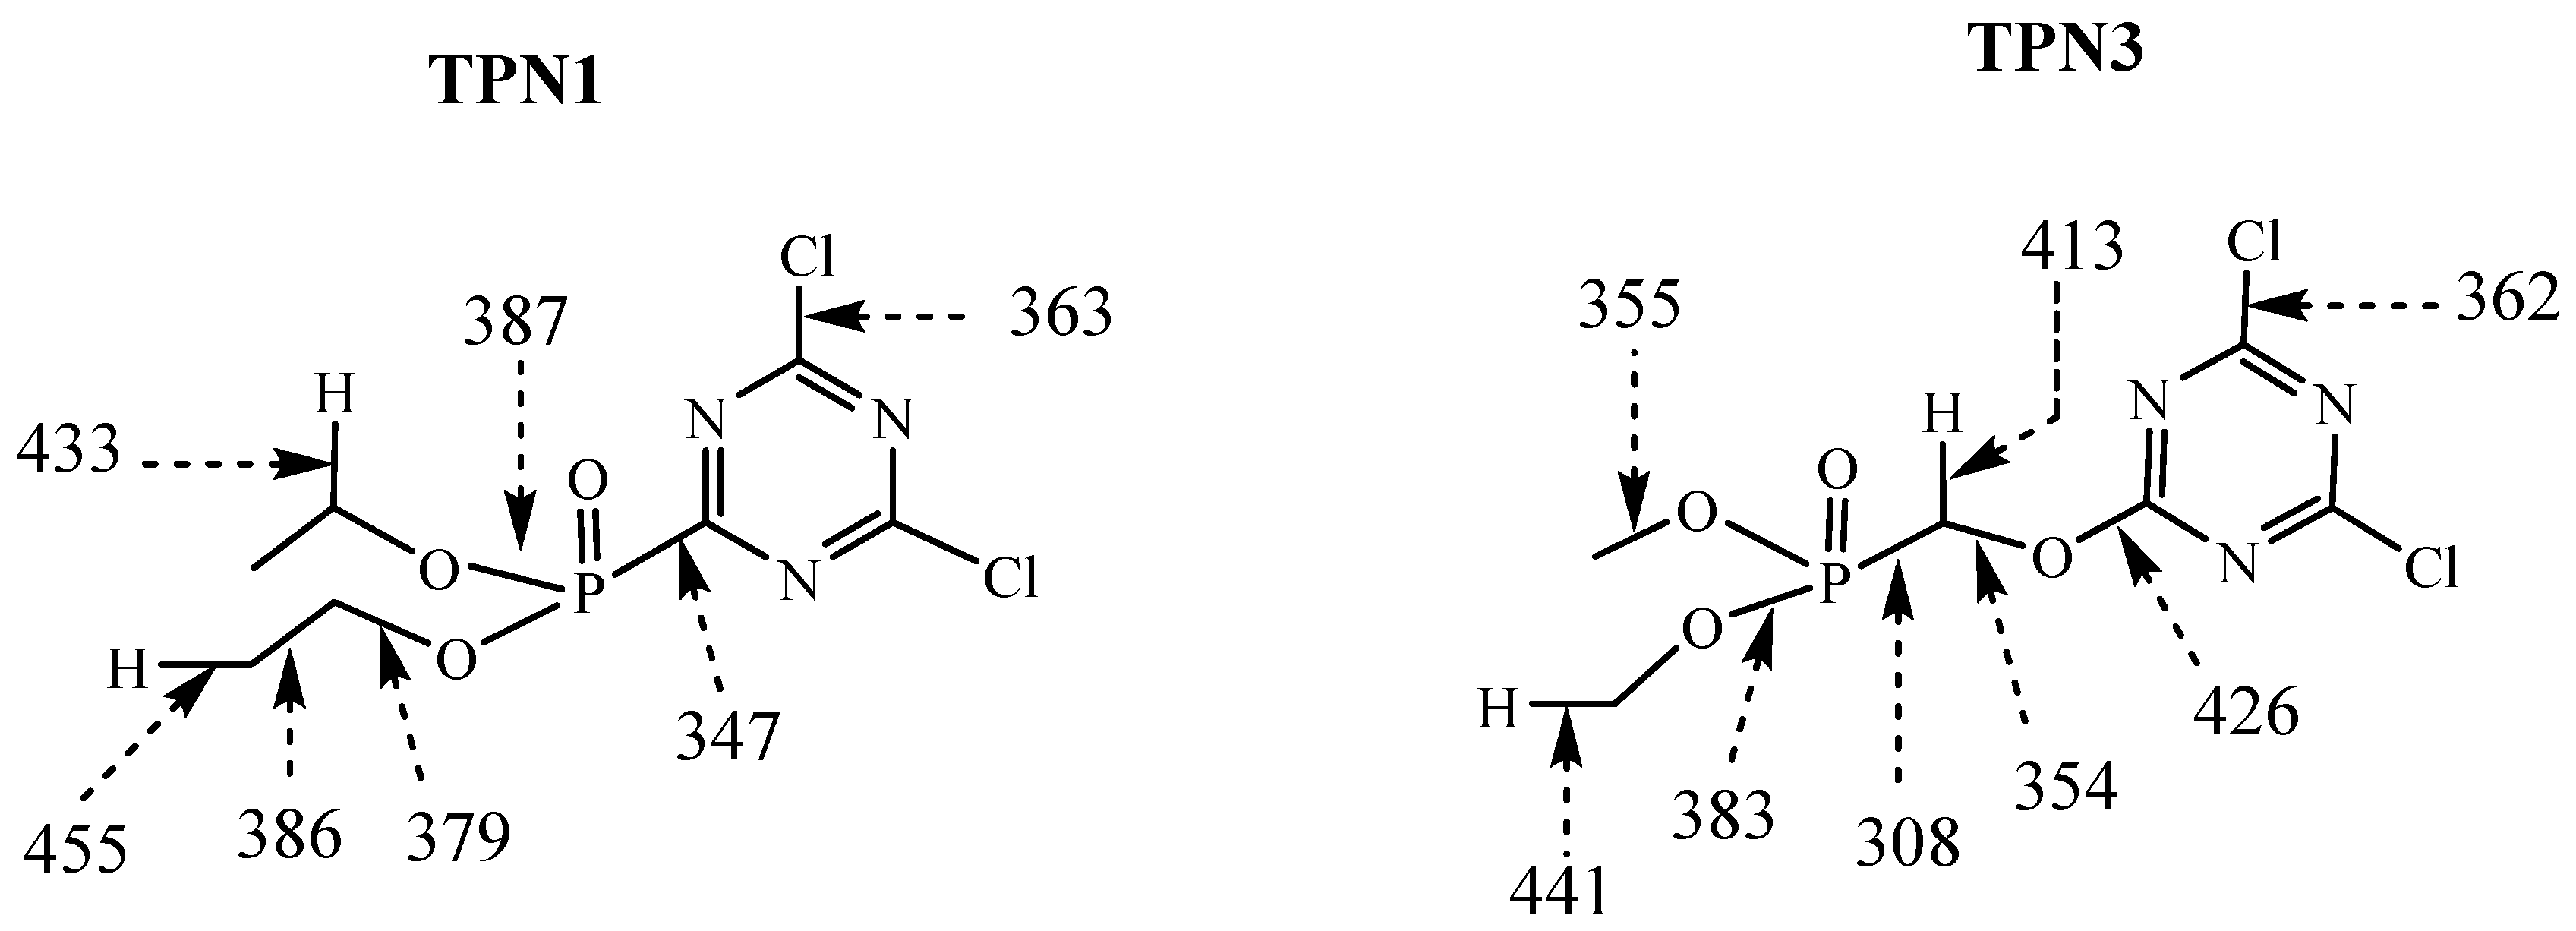
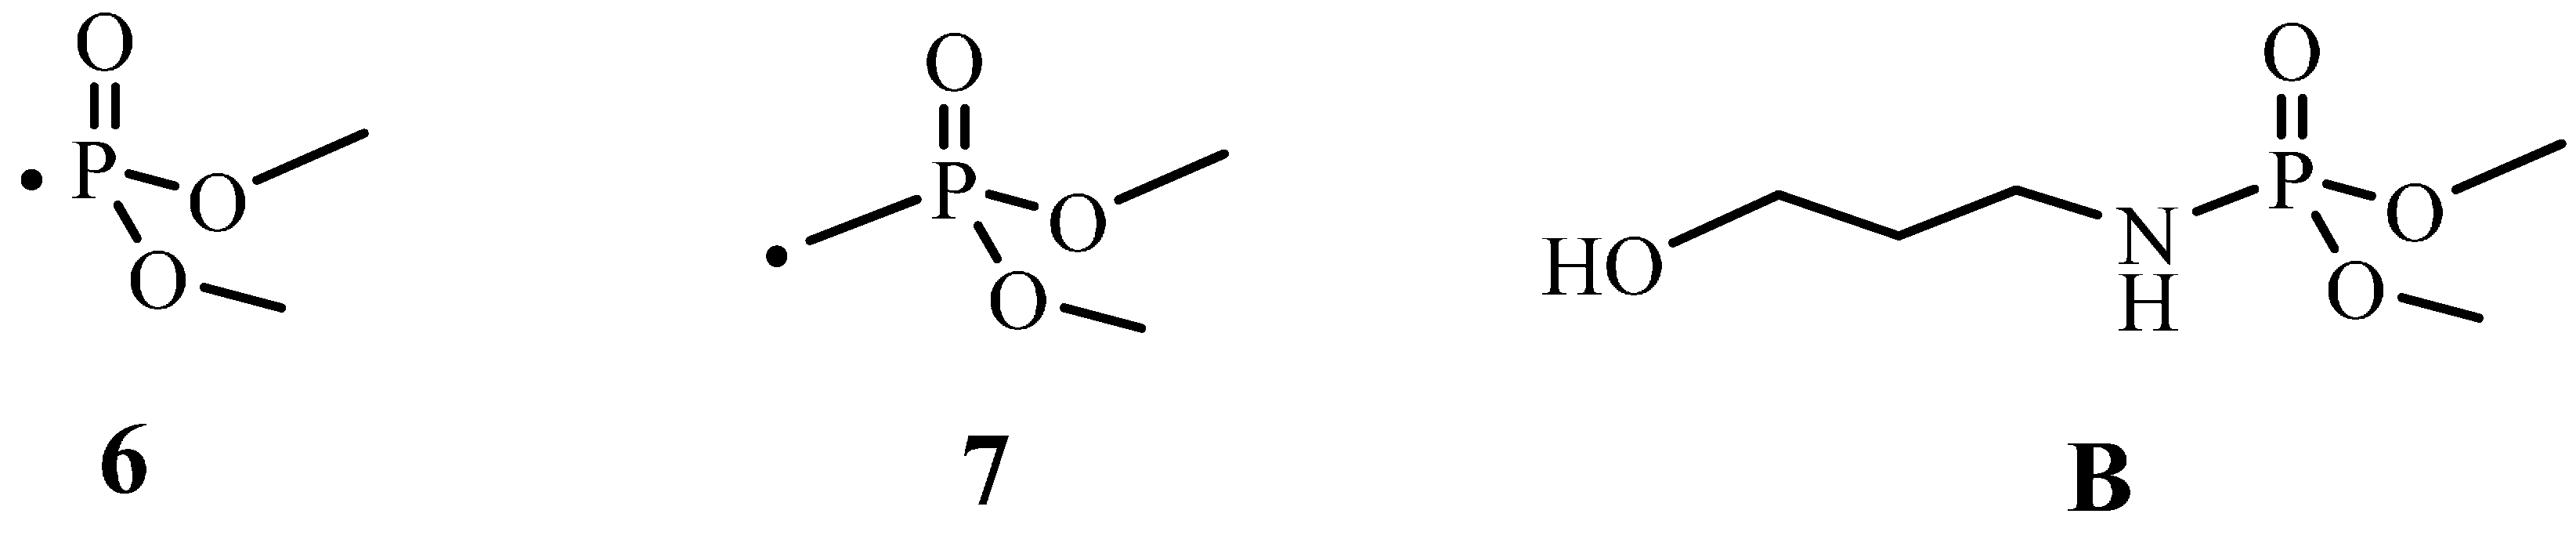
2.3. Predicted Energy Required Fragmenting TPN1 and TPN3 at Different Positions

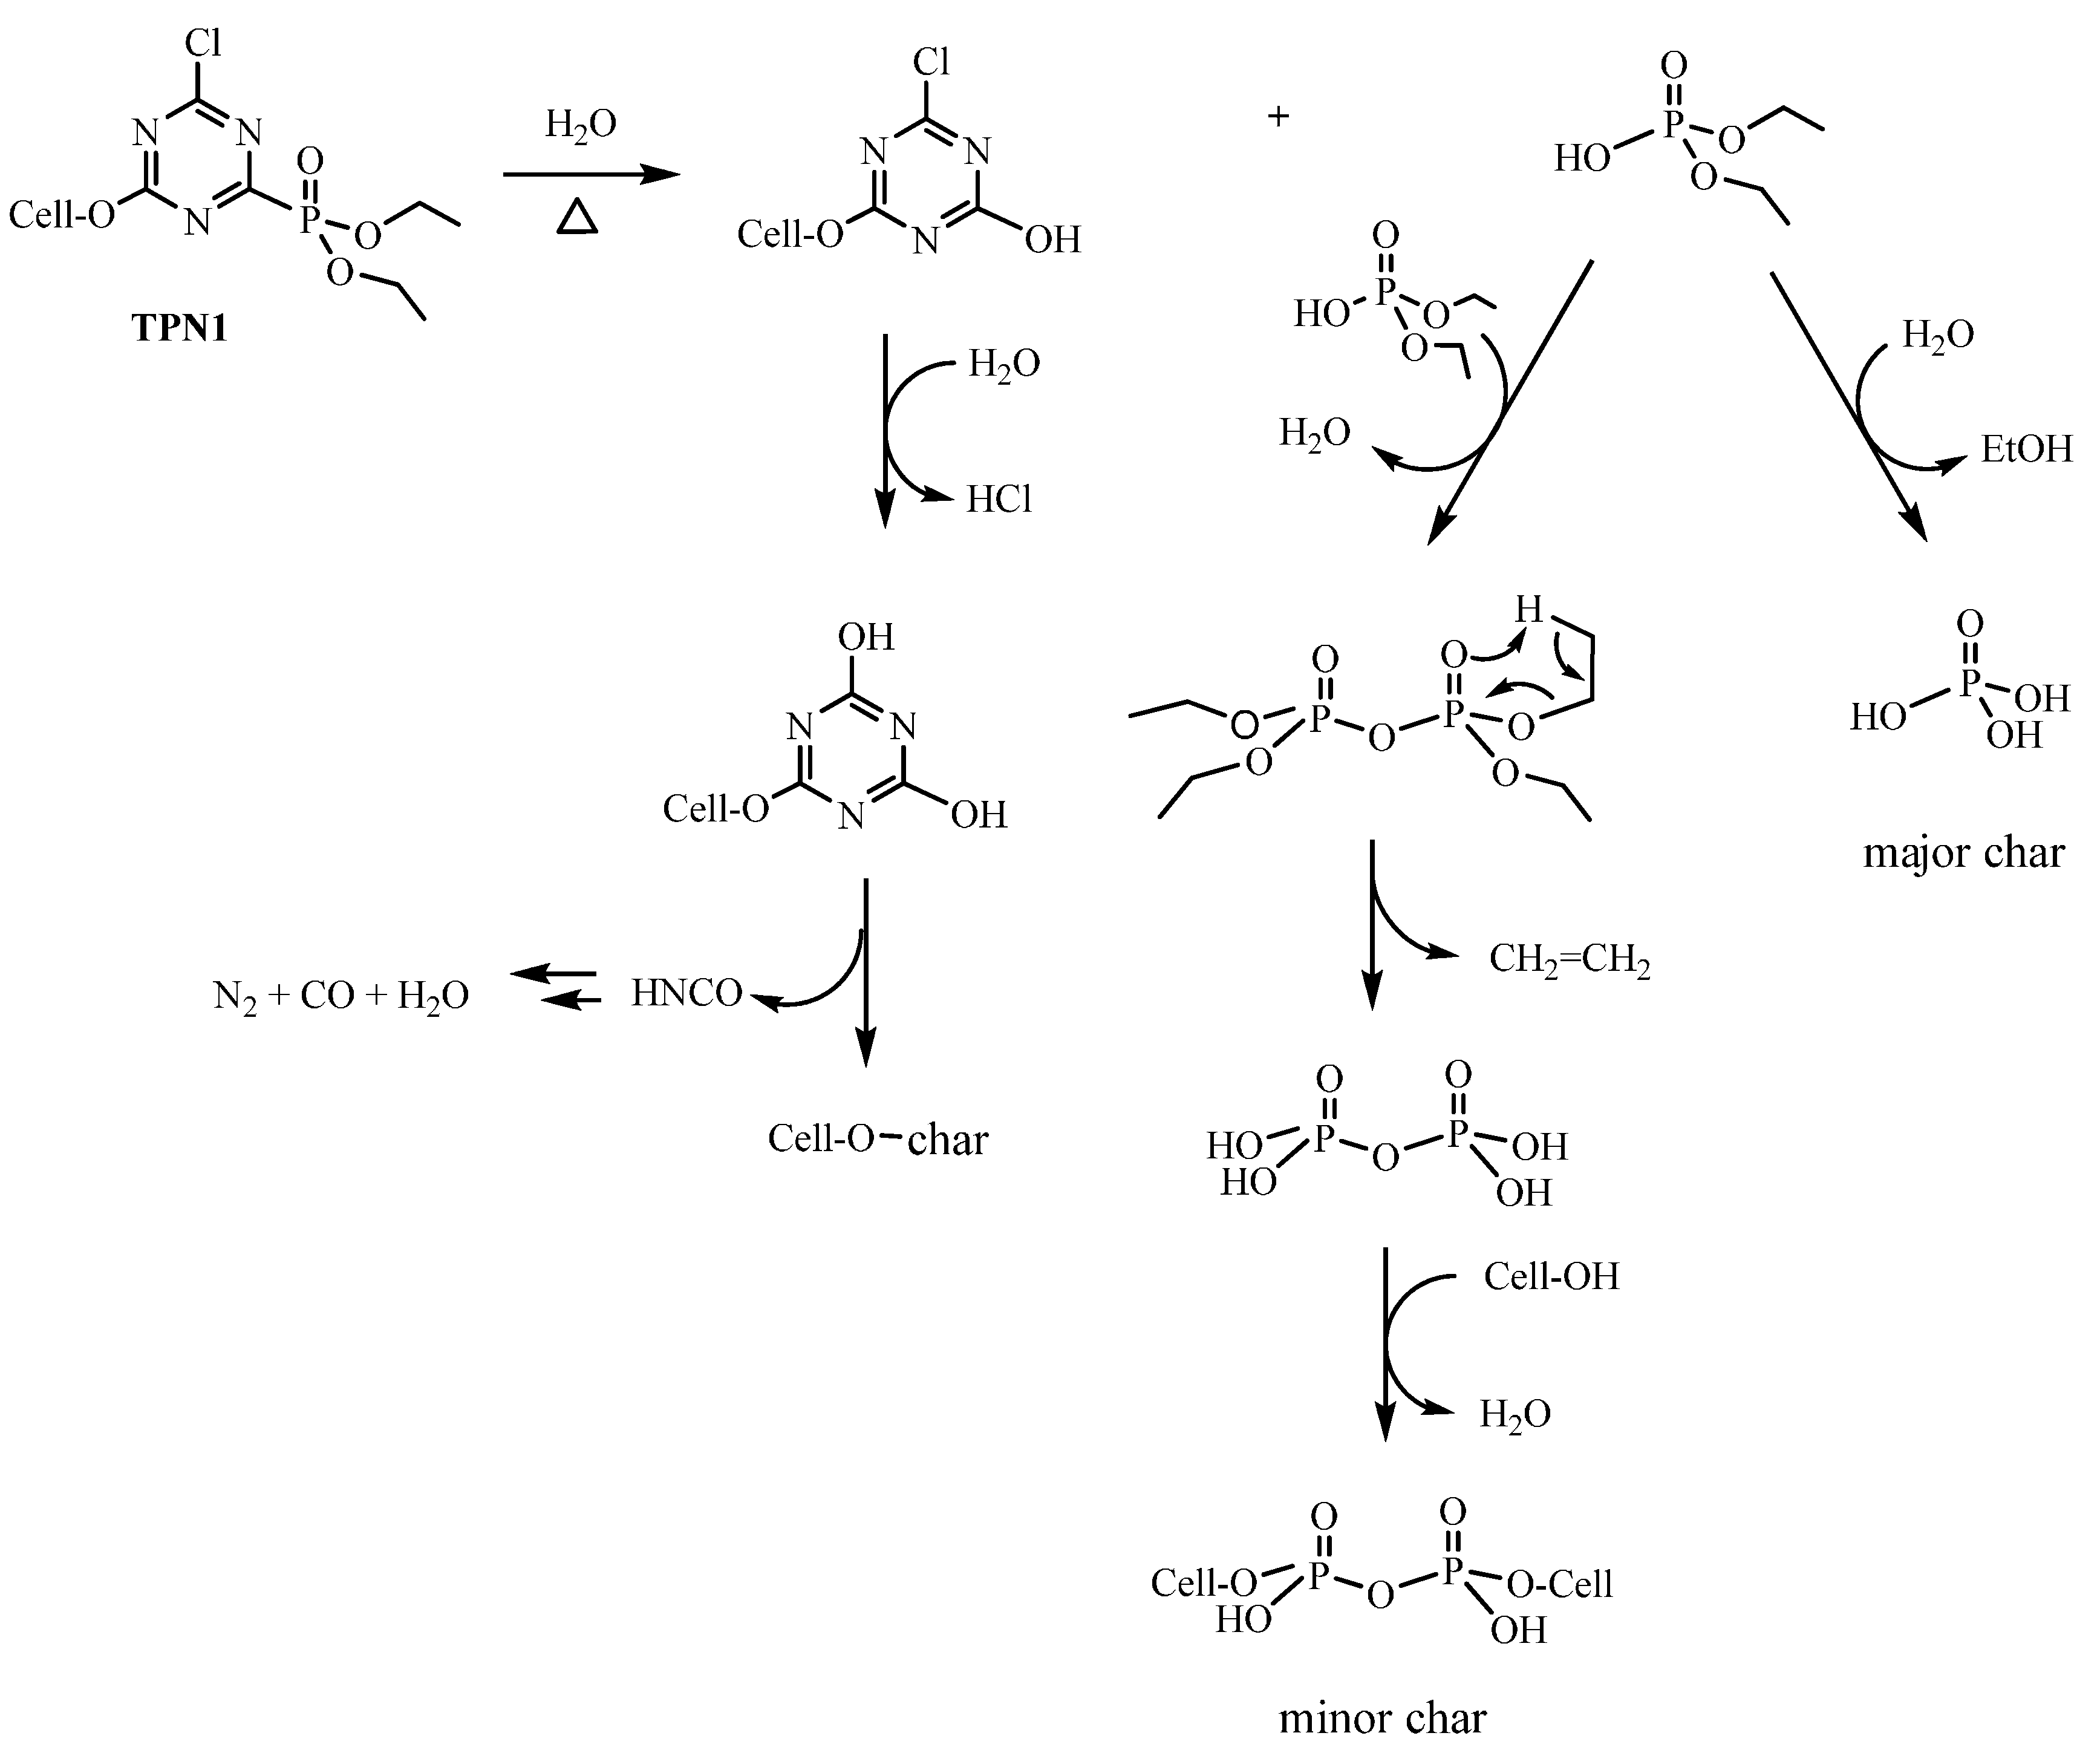
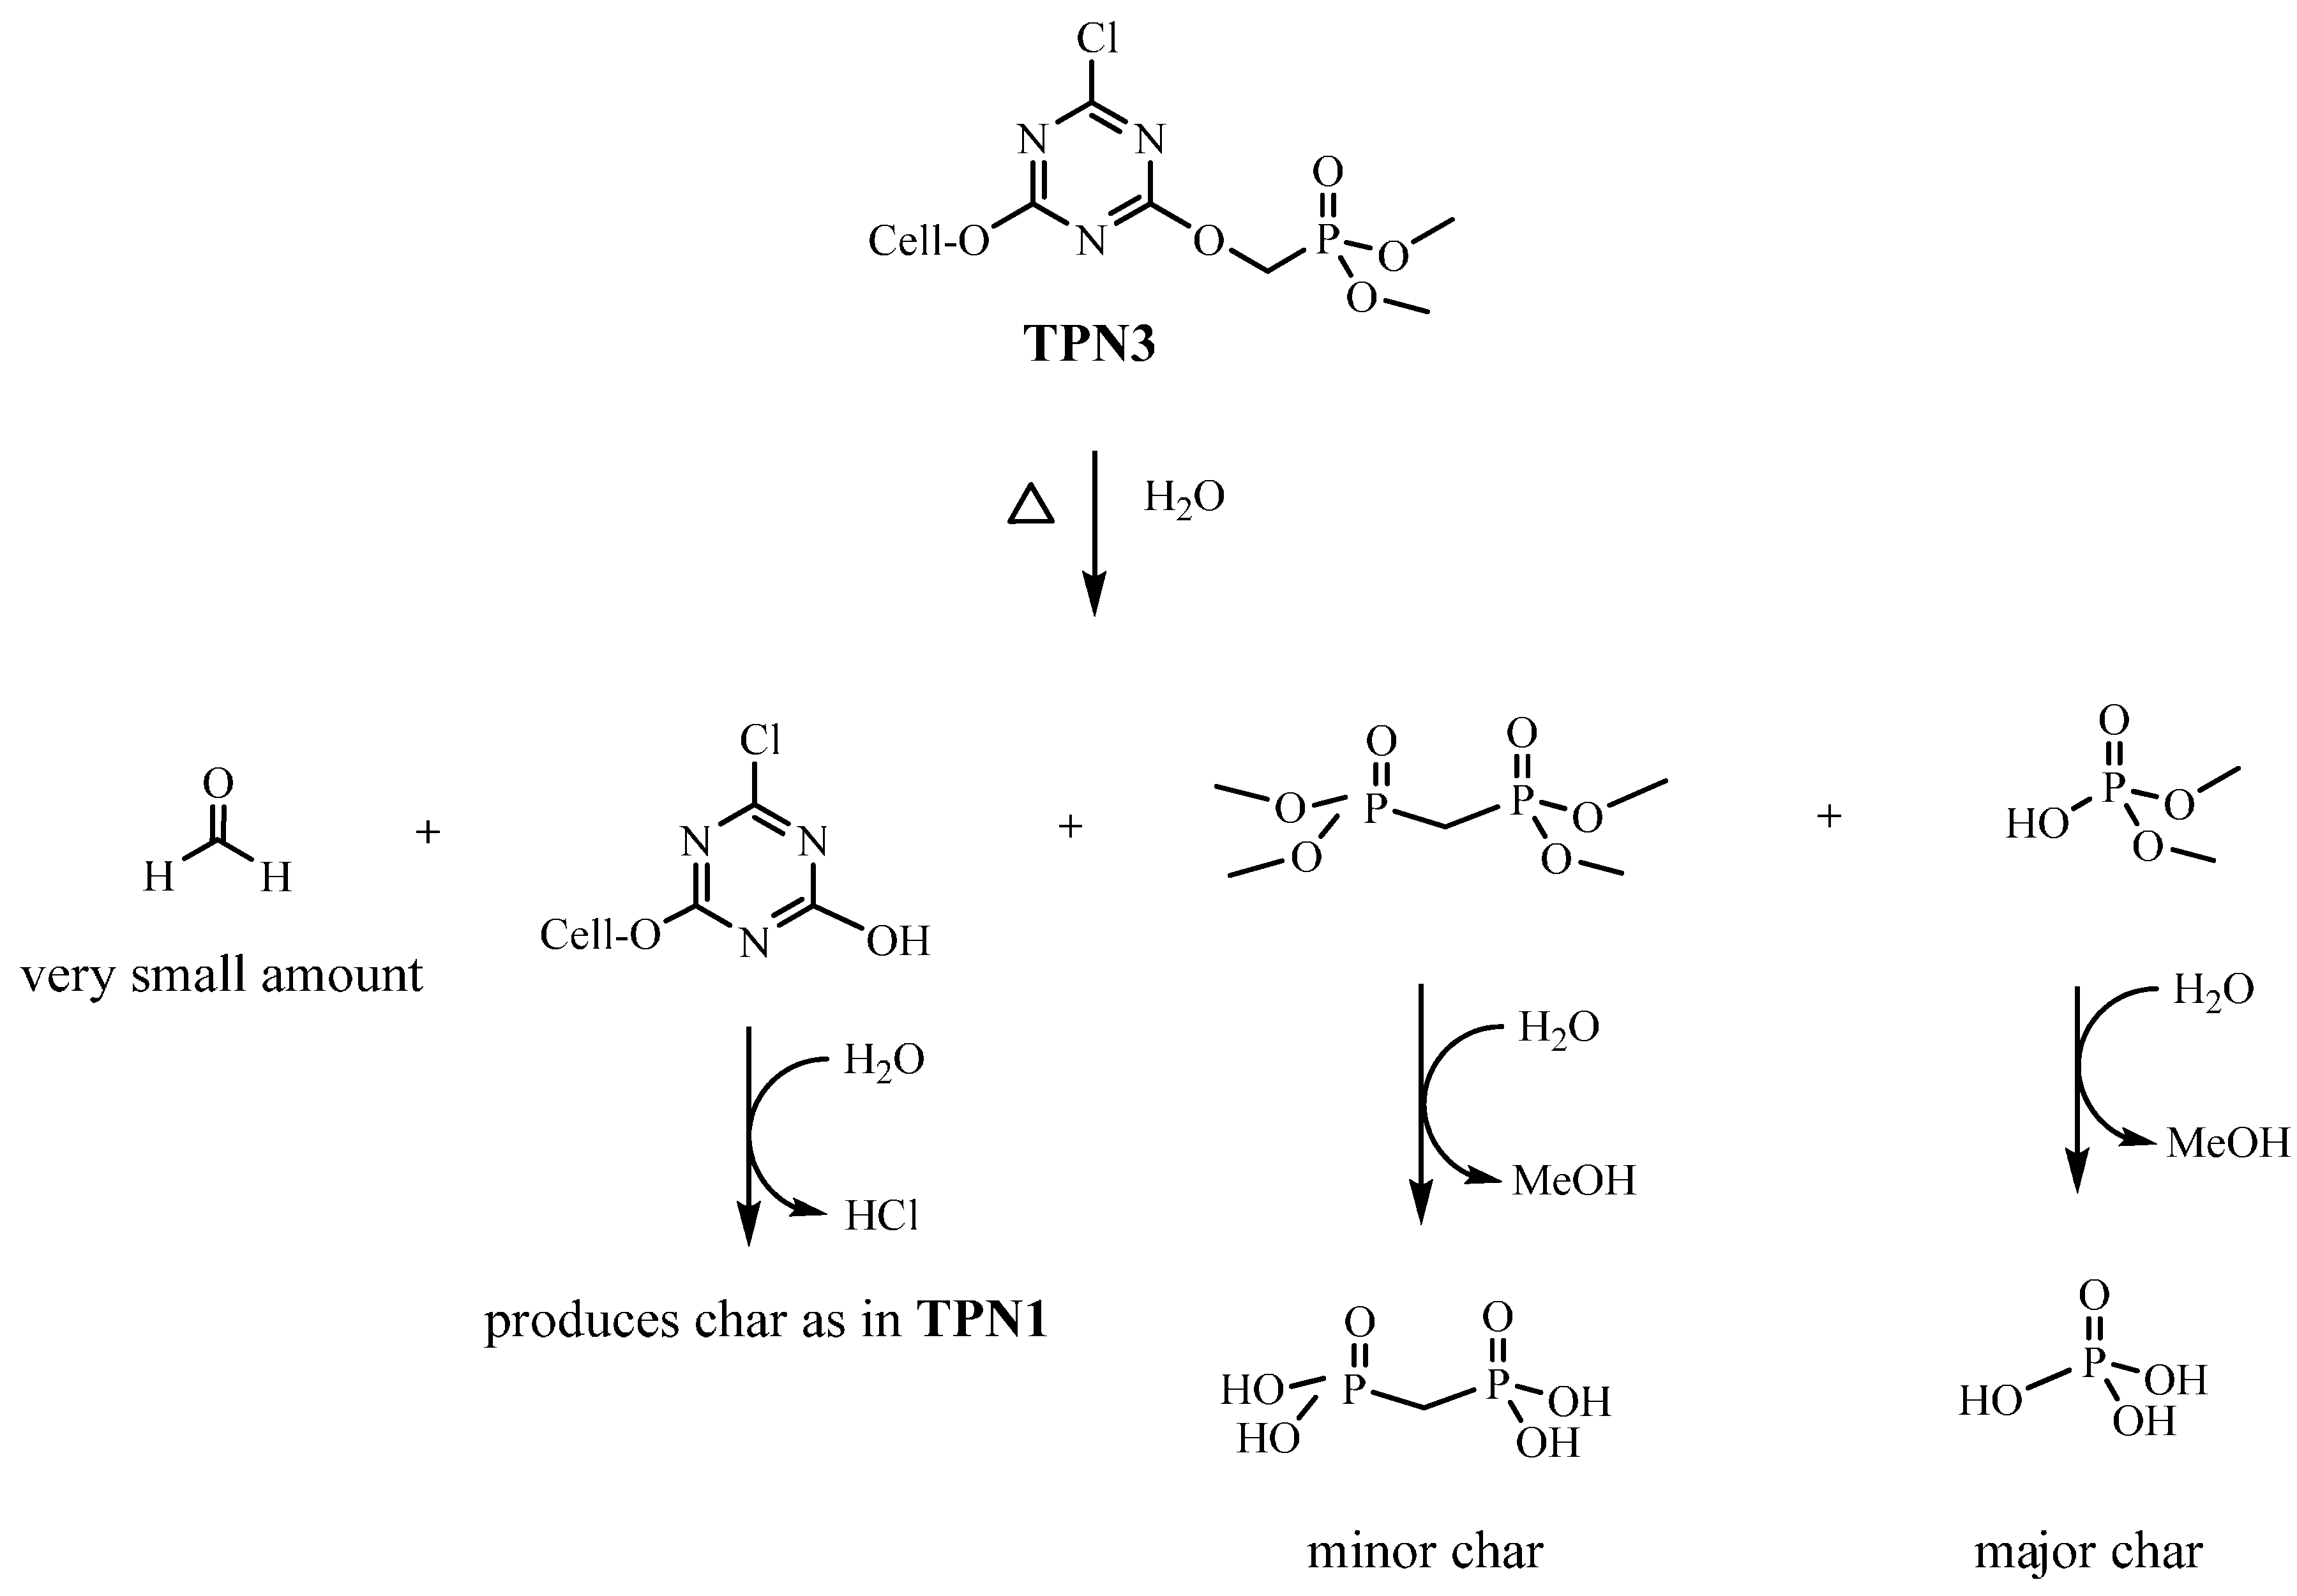
2.4. Plausible Explanation for Thermal Degradation of TPN1 and TPN3
3. Experimental Section
3.1. Materials
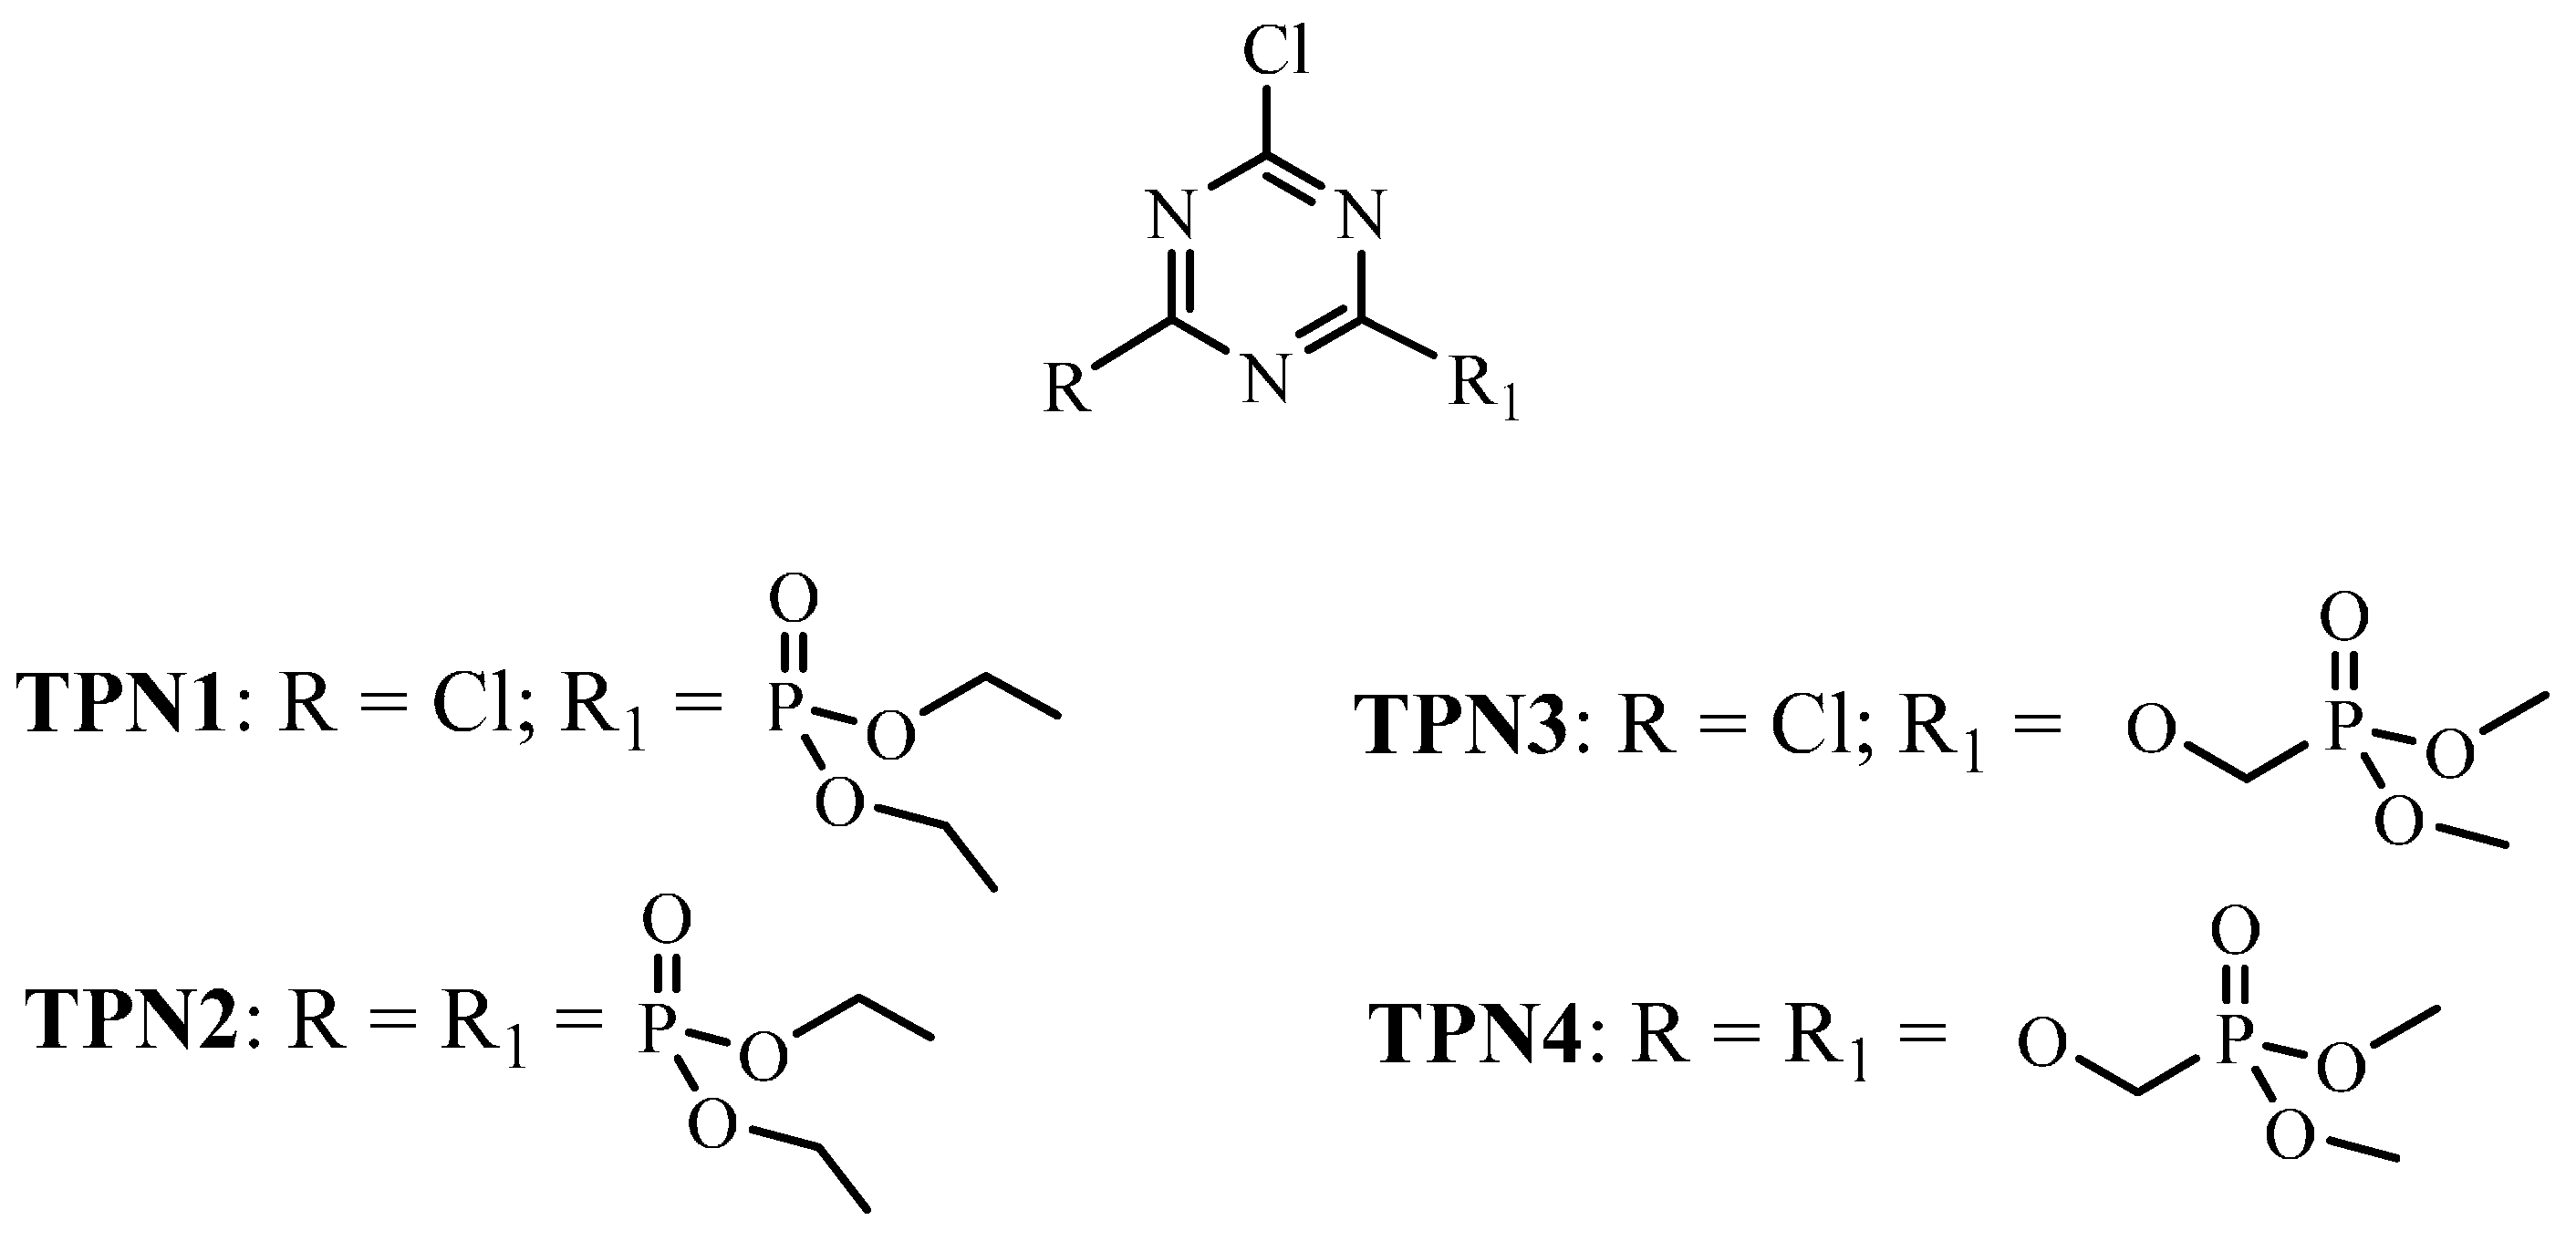
3.2. Synthesis

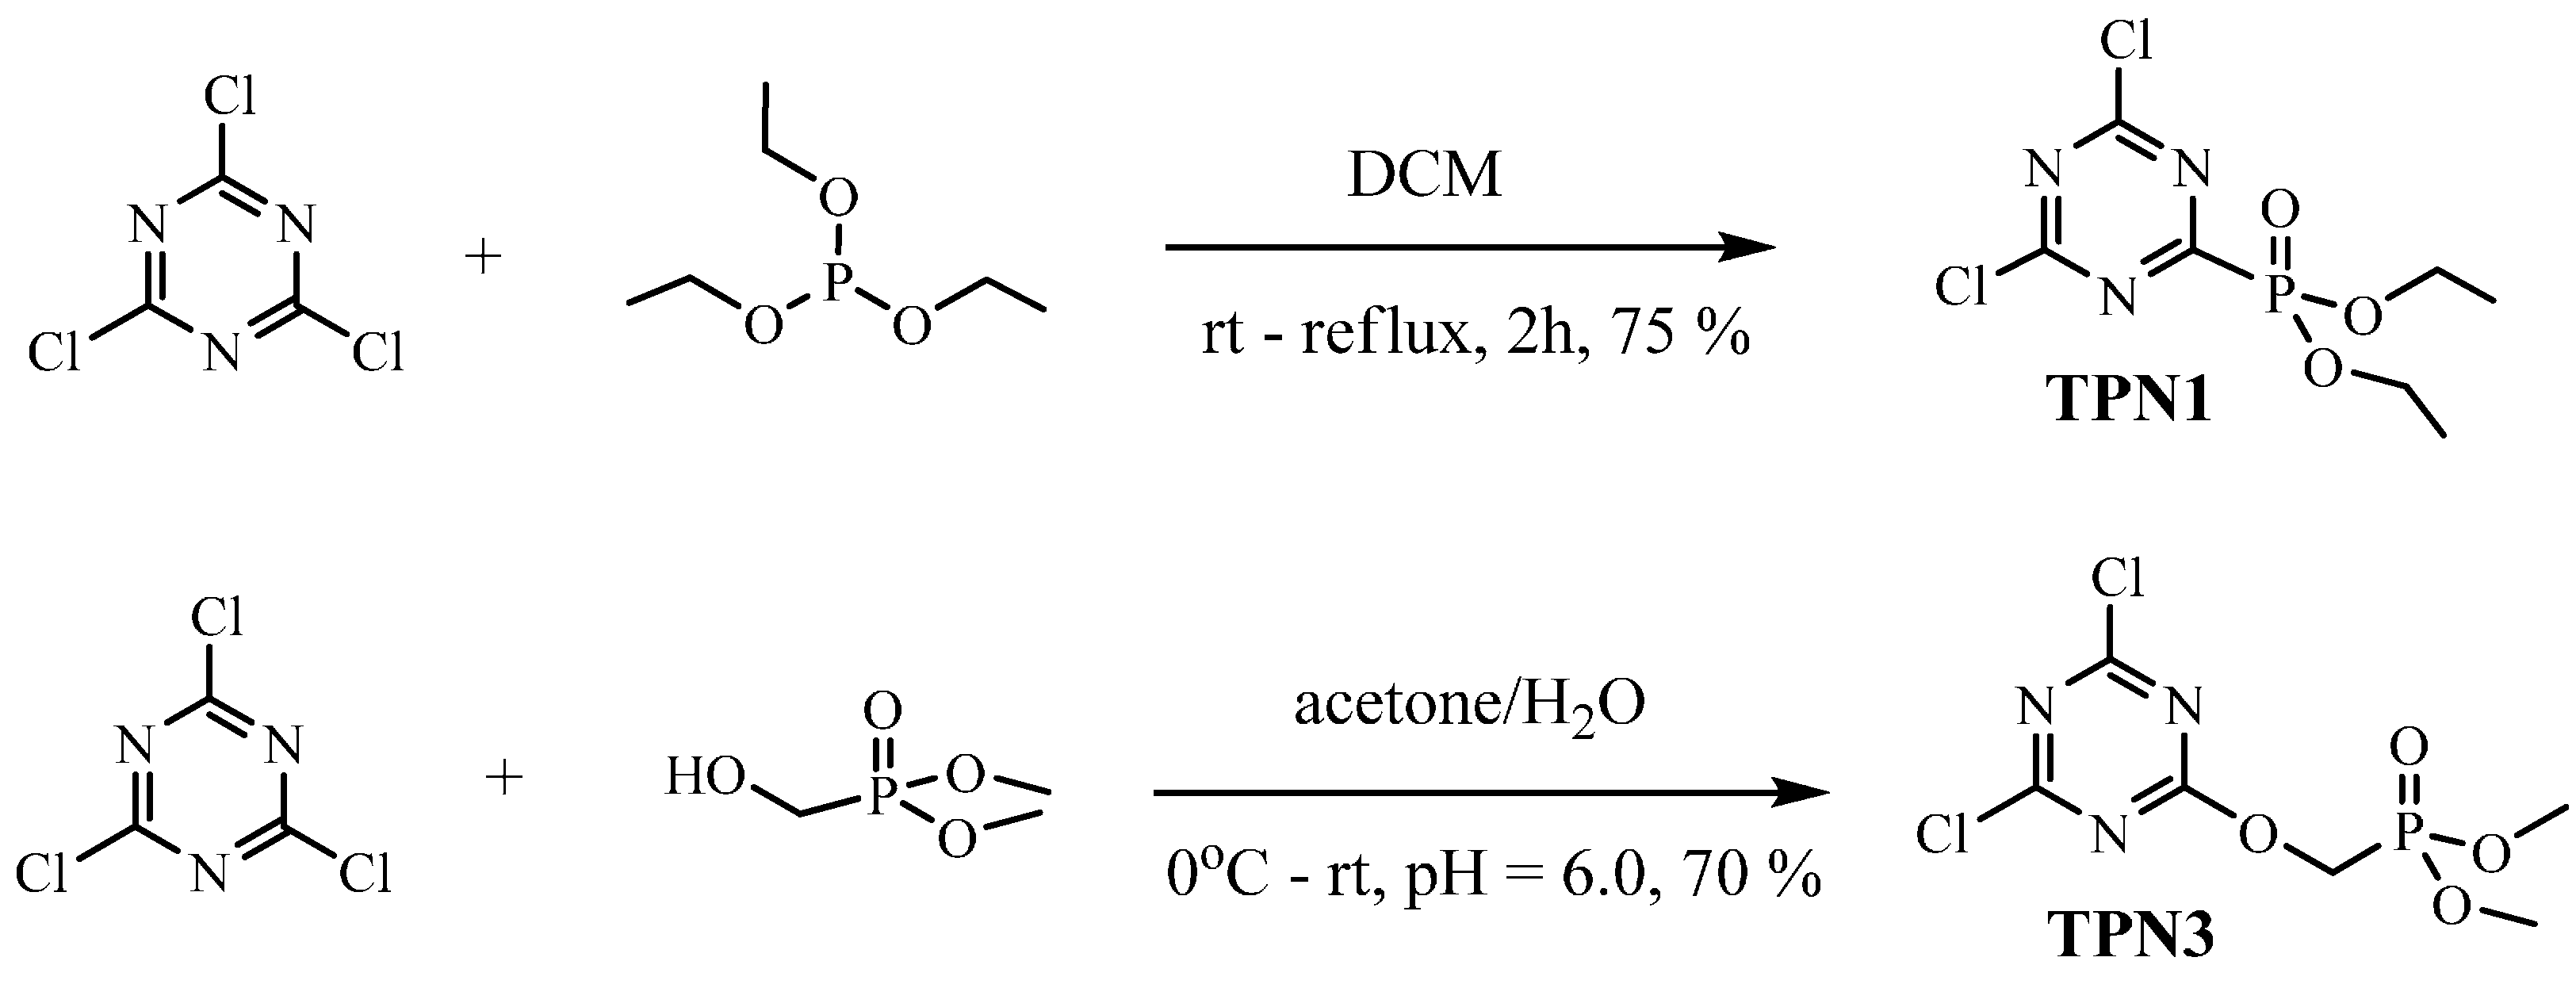
3.2.1. Synthesis of TPN1
3.2.2. Synthesis of TPN3
3.3. Fabric Treatment
3.4. Instrumentation
3.4.1. ATR-IR and TGA/FTIR
3.4.2. 31P Solid State NMR
3.5. BDE
4. Conclusions
Acknowledgments
Author Contributions
Conflicts of Interest
References
- Schartel, B.; Balabanovich, A.I.; Braun, U.; Knoll, U.; Artner, J.; Ciesielski, M.; Döring, M.; Perez, R.; Sandler, J.K.W.; Altstädt, V.; et al. Pyrolysis of epoxy resins and fire behavior of epoxy resin composites flame-retarded with 9,10-dihydro-9-oxa-10-phosphaphenanthrene-10-oxide additives. J. Appl. Polym. Sci. 2007, 104, 2260–2269. [Google Scholar] [CrossRef]
- Pawlowski, K.H.; Schartel, B. Flame retardancy mechanisms of triphenyl phosphate, resorcinol bis(diphenyl phosphate) and bisphenol A bis(diphenyl phosphate) in polycarbonate/acrylonitrile–butadiene–styrene blends. Polym. Int. 2007, 56, 1404–1414. [Google Scholar] [CrossRef]
- Joseph, P.; Tretsiakova-McNally, S. Combustion behaviours of chemically modified polyacrylonitrile polymers containing phosphorylamino groups. Polym. Degrad. Stabil. 2012, 97, 2531–2535. [Google Scholar] [CrossRef]
- Aaronson, A.M. Phosphorus flame retardants for a changing world. In Phosphorus Chemistry; Walsh, E.N., Griffith, E.J., Parry, R.W., Quin, L.D., Eds.; American Chemical Society: Washington, DC, USA, 1992; Volume 486, pp. 218–228. [Google Scholar]
- Levchik, S.V.; Levchik, G.F.; Balabanovich, A.I.; Weil, E.D.; Klatt, M. Phosphorus Oxynitride: A Thermally Stable Fire Retardant Additive for Polyamide 6 and Poly(butylene terephthalate). Angew. Makromol. Chem. 1999, 264, 48–55. [Google Scholar] [CrossRef]
- Dittrich, B.; Wartig, K.A.; Mülhaupt, R.; Schartel, B. Flame-Retardancy Properties of Intumescent Ammonium Poly(Phosphate) and Mineral Filler Magnesium Hydroxide in Combination with Graphene. Polymers 2014, 6, 2875–2895. [Google Scholar] [CrossRef]
- Braun, U.; Schartel, B. Effect of Red Phosphorus and Melamine Polyphosphate on the Fire Behavior of HIPS. J. Fire Sci. 2005, 23, 5–30. [Google Scholar] [CrossRef]
- Jayaweera, T.M.; Melius, C.F.; Pitz, W.J.; Westbrook, C.K.; Korobeinichev, O.P.; Shvartsberg, V.M.; Shmakov, A.G.; Rybitskaya, I.V.; Curran, H.J. Flame inhibition by phosphorus-containing compounds over a range of equivalence ratios. Combust. Flame 2005, 140, 103–115. [Google Scholar] [CrossRef]
- Fenimore, C.P.; Jones, G.W. Phosphorus in the burnt gas from fuel-rich hydrogen-oxygen flames. Combust. Flame 1964, 8, 133–137. [Google Scholar] [CrossRef]
- Gijsman, P.; Steenbakkers, R.; Fürst, C.; Kersjes, J. Differences in the flame retardant mechanism of melamine cyanurate in polyamide 6 and polyamide 66. Polym. Degrad. Stabil. 2002, 78, 219–224. [Google Scholar] [CrossRef]
- Liu, Y.; Wang, Q. The investigation on the flame retardancy mechanism of nitrogen flame retardant melamine cyanurate in polyamide 6. J. Polym. Res. 2009, 16, 583–589. [Google Scholar] [CrossRef]
- Fu, X.M.; Liu, Y.; Wang, Q.; Zhang, Z.J.; Wang, Z.Y.; Zhang, J.Z. Novel Synthesis Method for Melamine Polyphosphate and Its Flame Retardancy on Glass Fiber Reinforced Polyamide 66. Polym. Plast. Technol. Eng. 2011, 50, 1527–1532. [Google Scholar] [CrossRef]
- Jimenez, M.; Duquesne, S.; Bourbigot, S. Characterization of the performance of an intumescent fire protective coating. Surf. Coat. Technol. 2006, 201, 979–987. [Google Scholar] [CrossRef]
- Tesoro, G.G.; Sello, S.B.; Willard, J.J. Nitrogen-Phosphorus Synergism in Flame-Retardart Cellulose. Text. Res. J. 1969, 39, 180–190. [Google Scholar]
- Willard, J.J.; Wondra, R.E. Quantitative Evaluation of Flame-Retardant Cotton Finishes by the Limiting-Oxygen Index (LOI) Technique. Text. Res. J. 1970, 40, 203–210. [Google Scholar] [CrossRef]
- Reeves, W.A.; Perkins, R.M.; Piccolo, B.; Drake, G.L. Some Chemical and Physical Factors Influencing Flame Retardancy. Text. Res. J. 1970, 40, 223–231. [Google Scholar] [CrossRef]
- Deo, H.T.; Patel, N.K.; Patel, B.K. Eco-friendly Flame Retardant (FR) Pet Fibers through P–N Synergism. J. Eng. Fiber. Fabr. 2008, 3, 23–38. [Google Scholar]
- Abdel-Mohdy, F.A.; Belyakova, M.K.; Gaballa, M.M. Studies on some flame retardants for cotton. Colourage 2002, 49, 27–34. [Google Scholar]
- Zhou, T.; He, X.; Guo, C.; Yu, J.; Lu, D.; Yang, Q. Synthesis of a novel flame retardant phosphorus/nitrogen/siloxane and its application on cotton fabrics. Text. Res. J. 2014, 85, 701–708. [Google Scholar] [CrossRef]
- Carosio, F.; Di Blasio, A.; Alongi, J.; Malucelli, G. Green DNA-based flame retardant coatings assembled through Layer by Layer. Polymer 2013, 54, 5148–5153. [Google Scholar] [CrossRef]
- Laufer, G.; Kirkland, C.; Morgan, A.B.; Grunlan, J.C. Intumescent Multilayer Nanocoating, Made with Renewable Polyelectrolytes, for Flame-Retardant Cotton. Biomacromolecules 2012, 13, 2843–2848. [Google Scholar] [CrossRef] [PubMed]
- Nguyen, T.M.; Chang, S.; Condon, B.; Slopek, R. Synthesis of a novel flame retardant containing phosphorus-nitrogen and its comparison for cotton fabric. Fiber. Polym. 2012, 13, 963–970. [Google Scholar] [CrossRef]
- Chang, S.; Condon, B.D.; Graves, E.; Uchimiya, M.; Fortier, C.; Easson, M.W.; Wakelyn, P. Flame retardant properties of triazine phosphonates derivative with cotton fabric. Fiber. Polym. 2011, 12, 334–339. [Google Scholar] [CrossRef]
- Moreau, J.P.; Chance, L.H. Flame-retardant cottons using phosphorus-containing triazines. Am. Dyest. Rep. 1970, 59, 37–38. [Google Scholar]
- Tesoro, G.C.; Sello, S.B.; Moore, D.R.; Wurster, R.F. N-(oxymethyl) Derivatives of Phosphonopolyamino-S Triazine Used as Flame Retardants for Cellulosic Materials. U.S. Patent 3,650,670, 21 March 1972. [Google Scholar]
- Tesoro, G. Current research on chemical modification of cellulose. Pure Appl. Chem. 1976, 46, 239–245. [Google Scholar] [CrossRef]
- Alger, R. Pyrolysis and Combustion of Cellulosic Materials. In The Mechanisms of Pyrolysis, Oxidation, and Burning of Organic Materials, Proceedings of the 4th Materials Research Symposium, Gaithersburg, MD, USA, 26–29 October 1970; Wall, L.A., Ed.; National Bureau of Standards Special Publication 357: Gaithersburg, MD, USA, 1970; pp. 171–183. [Google Scholar]
- Bellamy, L.J. The Infrared Spectra of Complex Molecules, 3rd ed.; Chapman and Hall Ltd.: London, UK, 1975; pp. 13–17, 72–95, 129–130, 348–349, 355–357. [Google Scholar]
- Prabhaharan, M.; Prabakaran, A.R.; Srinivasan, S.; Gunasekaran, S. Experimental and theoretical spectroscopic analysis, HOMO–LUMO, and NBO studies of cyanuric chloride. Spectrochim. Acta A 2014, 127, 454–462. [Google Scholar] [CrossRef] [PubMed]
- Shagidullin, R.R.; Chernova, A.V.; Vinogradova, V.S.; Mukhametow, F.S. Atlas of IR Spectra of Organophosphorus Compounds; Nauka and Kluwer Academic: Moscow, Russia; Boston, MA, USA; London, UK, 1990. [Google Scholar]
- Mikroyannidis, J.A. Synthesis, Physical, and Thermal Properties of Linear Poly(dialkoxyphhosphinyl-s-Triazine)s. J. Polym. Sci. A 1988, 26, 588–593. [Google Scholar] [CrossRef]
- Akaranta, O.; Agiri, G.O. Synthesis and characterization of reactive dye-casava mesocarp cation exhange resins. Afr. J. Biotechnol. 2010, 9, 2977–2984. [Google Scholar]
- El-Shafei, A.; Knittel, D.; Schollmeyer, E. Anionically-modified cotton and surface layer formation with polyelectrolytes. Autex Res. J. 2006, 6, 175–181. [Google Scholar]
- Shen, D.K.; Gu, S. The mechanism for thermal decomposition of cellulose and its main products. Bioresour. Technol. 2009, 100, 6496–6504. [Google Scholar] [CrossRef] [PubMed]
- Nguyen, T.M.; Chang, S.; Condon, B.D.; Thomas, T.P.; Azadi, P. Thermal decomposition reactions of cotton fabric treated with piperazine-phosphonates derivatives as a flame retardant. J. Anal. Appl. Pyrol. 2014, 110, 122–129. [Google Scholar] [CrossRef]
- Speitel, L.C. Fourier Transform Infrared Analysis of Combustion Gases. J. Fire Sci. 2002, 20, 349–371. [Google Scholar] [CrossRef]
- Koizumi, N.; Murai, K.; Takasaki, S.; Yamada, M. Methanol synthesis activity of alkaline earth and lanthanoid metal added sulfided Pd/SiO2 and their surface fine structures investigated by drift spectroscopy. Fuel Chem. Div. Repr. 2002, 47, 140–141. [Google Scholar]
- Araña, J.; Doña-Rodrı́guez, J.M.; Cabo, C.G.I.; González-Dı́az, O.; Herrera-Melián, J.A.; Pérez-Peña, J. FTIR study of gas-phase alcohols photocatalytic degradation with TiO2 and AC-TiO2. Appl. Catal. B 2004, 53, 221–232. [Google Scholar] [CrossRef]
- Fridgen, T.D.; MacAleese, L.; McMahon, T.B.; Lemaire, J.; Maitre, P. Gas phase infrared multiple-photon dissociation spectra of methanol, ethanol and propanol proton-bound dimers, protonated propanol and the propanol/water proton-bound dimer. Phys. Chem. Chem. Phys. 2006, 8, 955–966. [Google Scholar] [CrossRef] [PubMed]
- Lohilahti, J. Rotation-Vibration Spectroscopy Stsudies of Formaldehyde and Formic Acid Molecules. Ph.D. Thesis, University of Oulu, Oulu, Finland, 2006. [Google Scholar]
- Lohilahti, J.; Alanko, S. The ν2 Band of Formaldehyde-d2. J. Mol. Spectrosc. 2001, 205, 248–251. [Google Scholar] [CrossRef] [PubMed]
- Nakanaga, T.; Kondo, S.; Saëki, S. Infrared band intensities of formaldehyde and formaldehyded 2. J. Chem. Phys. 1982, 76, 3860–3865. [Google Scholar] [CrossRef]
- Bockelee-Movan, D.; Crovisier, J. Formaldehyde in comets. II. Excitation of the rotational lines. Astron. Astrophys. 1992, 264, 282–291. [Google Scholar]
- Nguyen, T.-M.D.; Chang, S.; Condon, B.D.; Slopek, R.; Graves, E.; Yoshioka-Tarver, M. Structural Effect of Phosphoramidate Derivatives on the Thermal and Flame Retardant Behaviors of Treated Cotton Cellulose. Ind. Eng. Chem. Res. 2013, 52, 4715–4724. [Google Scholar] [CrossRef]
- Soares, S.; Camino, G.; Levchik, S. Comparative study of the thermal decomposition of pure cellulose and pulp paper. Polym. Degrad. Stabil. 1995, 49, 275–283. [Google Scholar] [CrossRef]
- Eisazadeh, A.; Kassim, K.A.; Nur, H. Physicochemical Characteristics of Phosphoric Acid Stabilized Bentonite. Electron. J. Geotech. Eng. 2010, 15, 327–336. [Google Scholar]
- Dhouib, I.; Al-Juaid, S.; Mhiri, T.; Elaoud, Z. Crystal Structure, Thermal Behaviour and Vibrational Spectra of Tetraethylammonium Dihydrogenmonophosphate Bis Phosphoric Acid. Cryst. Struct. Theor. Appl. 2013, 2, 8–15. [Google Scholar] [CrossRef]
- Budinova, T.; Ekinci, E.; Yardim, F.; Grimm, A.; Björnhom, E.; Minkova, V.; Goranova, M. Characterization and application of activated carbon produced by H3PO4 and water vapor activation. Fuel Process. Technol. 2006, 887, 899–905. [Google Scholar] [CrossRef]
- Klasson, K.T.; Wartelle, L.H.; Rodgers, J.E., III; Lima, I.M. Copper(II) adsorption by activated carbons from pecan shells: Effect of oxygen level during activation. Ind. Crop. Prod. 2009, 30, 72–77. [Google Scholar] [CrossRef]
- Yakout, S.M.; El-Deen, G.S. Characterization of activated carbon prepared by phosphoric acid activation of olive stones. Arabian J. Chem. 2011. [Google Scholar] [CrossRef]
- Rudolph, W.W.; Fisher, D. Vibrational Spectroscopic Investigation on H3PO4(aq) and the Anhydrous Melt. Available online: http://www.researchgate.net/publication/261109753_Vibrational_spectroscopic_investigation_on_H3PO4(aq)_and_the_anhydrous_melt (accessed on 17 June 2015).
- Haverbeke, V.L.L.V.; Desseyn, H.O.; Herman, M.A. Vibrational spectra of mono- and polymethylene diphosphohic acids. Bull. Soc. Chim. Belg. 1972, 81, 547–554. [Google Scholar] [CrossRef]
- Moedritzer, K.; Irani, R.R. Synthesis and properties of mono- and poly-methylene-diphosphonic acids and esters. J. Inorg. Nucl. Chem. 1961, 22, 297–304. [Google Scholar] [CrossRef]
- Quin, L.D.; Williams, A.J. Practical Interpretation of P-31 NMR Spectra and Computer-Assisted Structure Verification; Advanced Chemistry Development, Inc.: Toronto, ON, Canada, 2004. [Google Scholar]
- Sørensen, R.D.; Nielsen, U.G.; Skou, E.M. Solid state 31P MAS NMR spectroscopy and conductivity measurements on NbOPO4 and H3PO4 composite materials. J. Solid State Chem. 2014, 219, 80–86. [Google Scholar] [CrossRef]
- Ebdon, J.R.; Hunt, B.J.; Joseph, P.; Konkel, C.S.; Price, D.; Pyrah, K.; Hull, T.R.; Milnes, G.J.; Hill, S.B.; Lindsay, C.I.; et al. Thermal degradation and flame retardance in copolymers of methyl methacrylate with diethyl(methacryloyloxymethyl)phosphonate. Polym. Degrad. Stabil. 2000, 70, 425–436. [Google Scholar] [CrossRef]
- Satterthwait, A.C.; Westheimer, F.H. Monomeric methyl metaphosphate: Reactions with carbonyl groups. J. Am. Chem. Soc. 1980, 102, 4464–4472. [Google Scholar] [CrossRef]
- Nielsen, M.L.; Pustinger, J.V.; Strobel, J. Phosphorus-31 Nuclear Magnetic Resonance Chemical Shifts of Phosphorus Compounds. J. Chem. Eng. Data 1964, 9, 167–170. [Google Scholar] [CrossRef]
- Koukhareva, I. Available online:. Available online: http://www.trilinkbiotech.com/tech/31p.asp (accessed on 17 June 2015).
- Kee, T.P.; Bryant, D.E.; Herschy, B.; Marriott, D.E.R.; Cosgrove, N.E.; Pasek, M.A.; Atlas, Z.D.; Cousins, C.R. Phosphate Activation via Reduced Oxidation State Phosphorus (P). Mild Routes to Condensed-P Energy Currency Molecules. Life 2013, 3, 386–402. [Google Scholar] [CrossRef] [PubMed]
- Kohli, P.; Blanchard, G.J. Probing Interfaces and Surface Reactions of Zirconium Phosphate/Phosphonate Multilayers Using 31P-NMR Spectrometry. Langmuir 2000, 16, 695–701. [Google Scholar] [CrossRef]
- Satre, M.; Martin, J.-B.; Klein, G. Methyl phosphonate as a 31P-NMR probe for intracellular pH measurements in Dictyostelium amoebae. Biochimie 1989, 71, 941–948. [Google Scholar] [CrossRef]
- Simon, N.S.; Ali, A.A.; Samperton, K.M.; Korson, C.S.; Fischer, K.; Hughes, M.L. Characterization of Cyanophyte Biomass in a Bureau of Reclamation Reservoir; Open-File Report 2013-1156; U.S. Geological Survey: Reston, VA, USA, 2013; pp. 18–19. [Google Scholar]
- Belloque, J.; Ramos, M. Determination of the casein content in bovine milk by 31P-NMR. J. Dairy Res. 2002, 69, 411–418. [Google Scholar] [CrossRef] [PubMed]
- Jayakody, J.R.P.; Chung, S.H.; Durantino, L.; Zhang, H.; Xiao, L.; Benicewicz, B.C.; Greenbauma, S.G. NMR Studies of Mass Transport in High-Acid-Content Fuel Cell Membranes Based on Phosphoric Acid and Polybenzimidazole. J. Electrochem. Soc. 2007, 154, B242–B246. [Google Scholar] [CrossRef]
- Jang, B.N.; Wilkie, C.A. The thermal degradation of bisphenol A polycarbonate in air. Thermochim. Acta 2005, 426, 73–84. [Google Scholar] [CrossRef]
- Atkin, P.; Jones, L. Chemical Principles: The Quest for Insight, 4th ed.; W.H. Freeman and Company: New York, NY, USA, 2008; pp. 80–81. [Google Scholar]
- Smith, M.B.; March, J. March’s Advanced Organic Chemistry, 6th ed.; A John Wiley & Sons, Inc.: Hoboken, NJ, USA, 2007; pp. 28–29. [Google Scholar]
- Hemelsoet, K.; van Durme, F.; van Speybroeck, V.; Reyniers, M.F.; Waroquier, M. Bond Dissociation Energies of Organophosphorus Compounds: An Assessment of Contemporary Ab Initio Procedures. J. Phys. Chem. A 2010, 114, 2864–2873. [Google Scholar] [CrossRef] [PubMed]
- Garcia, Y.; Schoenebeck, F.; Legault, C.Y.; Merlic, C.A.; Houk, K.N. Theoretical Bond Dissociation Energies of Halo-Heterocycles: Trends and Relationships to Regioselectivity in Palladium-Catalyzed Cross-Coupling Reactions. J. Am. Chem. Soc. 2009, 131, 6632–6639. [Google Scholar] [CrossRef] [PubMed]
- Ramirez, M.L.; Walter, R.; Savitski, E.P.; Lyon, R.E. Thermal Decomposition of Cyanate Ester Resins; National Technical Information Service (NTIS): Springfield, VA, USA, 2001; pp. 4–5. [Google Scholar]
- Perry, R.A.; Siebers, D.L. Rapid reduction of nitrogen oxides in exhaust gas streams. Nature 1986, 324, 657–658. [Google Scholar] [CrossRef]
- Perry, R.A. No Reduction Using Sublimation of Cyanuric Acid. U.S. Patent 4731231, 15 March 1988. [Google Scholar]
- Aleksandrov, V.V.; Boldyrev, V.V.; Marusin, V.V.; Morozov, V.G.; Solovjev, V.S.; Rozhentseva, T.M. Effect of heating rate on the thermal decomposition of lead dioxide. J. Therm. Anal. 1978, 13, 205–212. [Google Scholar] [CrossRef]
- Alongi, J.; Milnes, J.; Malucelli, G.; Bourbigot, S.; Kandola, B. Thermal degradation of DNA-treated cotton fabrics under different heating conditions. J. Anal. Appl. Pyrol. 2014, 108, 212–221. [Google Scholar] [CrossRef]
- Sample Availability: Not available.
© 2015 by the authors. Licensee MDPI, Basel, Switzerland. This article is an open access article distributed under the terms and conditions of the Creative Commons Attribution license ( http://creativecommons.org/licenses/by/4.0/).
Share and Cite
Nguyen, M.M.; Al-Abdul-Wahid, M.S.; Fontenot, K.R.; Graves, E.E.; Chang, S.; Condon, B.D.; Grimm, C.C.; Lorigan, G.A. Understanding the Mechanism of Action of Triazine-Phosphonate Derivatives as Flame Retardants for Cotton Fabric. Molecules 2015, 20, 11236-11256. https://doi.org/10.3390/molecules200611236
Nguyen MM, Al-Abdul-Wahid MS, Fontenot KR, Graves EE, Chang S, Condon BD, Grimm CC, Lorigan GA. Understanding the Mechanism of Action of Triazine-Phosphonate Derivatives as Flame Retardants for Cotton Fabric. Molecules. 2015; 20(6):11236-11256. https://doi.org/10.3390/molecules200611236
Chicago/Turabian StyleNguyen, Monique M., M. Sameer Al-Abdul-Wahid, Krystal R. Fontenot, Elena E. Graves, SeChin Chang, Brian D. Condon, Casey C. Grimm, and Gary A. Lorigan. 2015. "Understanding the Mechanism of Action of Triazine-Phosphonate Derivatives as Flame Retardants for Cotton Fabric" Molecules 20, no. 6: 11236-11256. https://doi.org/10.3390/molecules200611236
APA StyleNguyen, M. M., Al-Abdul-Wahid, M. S., Fontenot, K. R., Graves, E. E., Chang, S., Condon, B. D., Grimm, C. C., & Lorigan, G. A. (2015). Understanding the Mechanism of Action of Triazine-Phosphonate Derivatives as Flame Retardants for Cotton Fabric. Molecules, 20(6), 11236-11256. https://doi.org/10.3390/molecules200611236