Article

Qualitative and Quantitative Analysis of Lignan Constituents in Caulis Trachelospermi by HPLC-QTOF-MS and HPLC-UV

1
Beijing Institute of Pharmacology and Toxicology, Beijing 100850, China
2
School of Traditional Chinese Materia Medica, Shenyang Pharmaceutical University, Shenyang 110016, China
*
Authors to whom correspondence should be addressed.
Molecules 2015, 20(5), 8107-8124; https://doi.org/10.3390/molecules20058107
Submission received: 2 March 2015 / Revised: 22 April 2015 / Accepted: 27 April 2015 / Published: 5 May 2015
(This article belongs to the Section Natural Products Chemistry)

Abstract

:
A high-performance liquid chromatography coupled with quadrupole tandem time-of-flight mass (HPLC-QTOF-MS) and ultraviolet spectrometry (HPLC-UV) was established for simultaneous qualitative and quantitative analysis of the major chemical constituents in Caulis Trachelospermi, respectively. The analysis was performed on an Agilent Zorbax Eclipse Plus C18 column (4.6 mm × 150 mm, 5 μm) using a binary gradient system of water and methanol, with ultraviolet absorption at 230 nm. Based on high-resolution ESI-MS/MS fragmentation behaviors of the reference standards, the characteristic cleavage patterns of lignano-9, 9'-lactones and lignano-8'-hydroxy-9, 9'-lactones were obtained. The results demonstrated that the characteristic fragmentation patterns are valuable for identifying and differentiating lignano-9,9'-lactones and lignano-8'-hydroxy-9,9'-lactones. As such, a total of 25 compounds in Caulis Trachelospermi were unambiguously or tentatively identified via comparisons with reference standards or literature. In addition, 14 dibenzylbutyrolatone lignans were simultaneously quantified in Caulis Trachelospermi by HPLC-UV method. The method is suitable for the qualitative and quantitative analyses of dibenzylbutyrolatone lignans in Caulis Trachelospermi.

Graphical Abstract

1. Introduction

Caulis Trachelospermi, the stems and leaves of Trachelospermum jasminoides (Lindl.) Lem, is mainly distributed in Henan, Anhui, Hubei, Shandong and Guangxi provinces in China. It has been used in traditional Chinese medicine for the treatment of rheumatic arthralgia, aching of the loins and knees, traumatic injuries [1], and its medicinal properties such as anticancer and anti-inflammation have been reported [2,3]. Chemical investigations indicated that it mainly contains lignans, flavonoids and triterpenoids [4,5,6]. In our previous study, the extract of Caulis Trachelospermi and its main dibenzylbutyrolactone lignan constituents exhibited marked anti-inflammatory activity in animal model [7], moderate inhibiting activity on NF-κB signaling pathway induced by TNF-α [8] as well as strong inhibiting activity on JAK/STAT pathway [9]. As mentioned above, the major bioactive constituents of Caulis Trachelospermi are disclosed to be dibenzylbutyrolactone lignans.
Up to now, high-performance liquid chromatography (HPLC) [10,11,12,13,14,15,16] and ultraviolet spectrophotometry (UV) [17,18] have been developed and focused on the quantitative analysis of total flavonoid, total lignans and a few active compounds such as trachelogenin and tracheloside in Caulis Trachelospermi. However, the fingerprint analysis in our previous research [19] has led to the discovery of more than 15 characteristic peaks, the content of which is still unequivocal. To the best of our knowledge, there have been no reports for the simultaneous determination of 14 main dibenzylbutyrolactone lignans by HPLC so far. Therefore, it is necessary to develop a sensitive and selective method to quantify the dibenzylbutyrolactone lignan constituents in Caulis Trachelospermi.
Currently, HPLC coupled with quadrupole time-of-flight mass spectrometry (QTOF-MS) is used in composition analysis and quantification of a wide variety of natural product compounds [20,21,22]. On the other hand, QTOF allows the generation of mass information with greater accuracy and precision, and it provides both elemental compositions and fragmentation patterns in a highly sensitive and convenient way [23]. However, no attempts have been made to identify the constituents in Caulis Trachelospermi based on accurate mass measurements using HPLC-QTOF-MS.
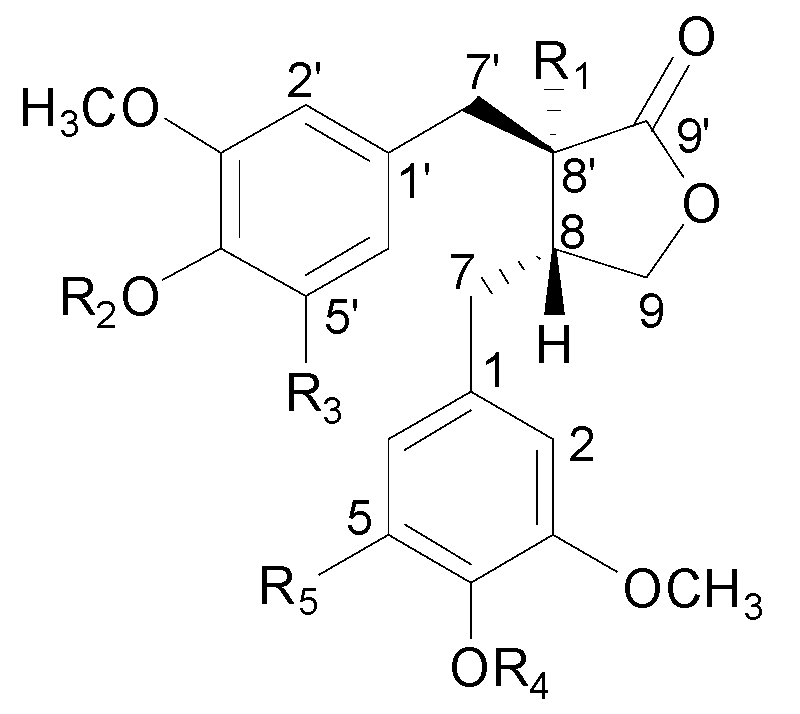
In the present study, a combinative method using HPLC-QTOF-MS and HPLC-UV was first established for the identification and simultaneous quantification of the major constituents whose chemical structures are presented in Figure 1 in 14 batch samples of Caulis Trachelospermi, which could provide an alternative, feasible approach for the quality assessment of Caulis Trachelospermi.
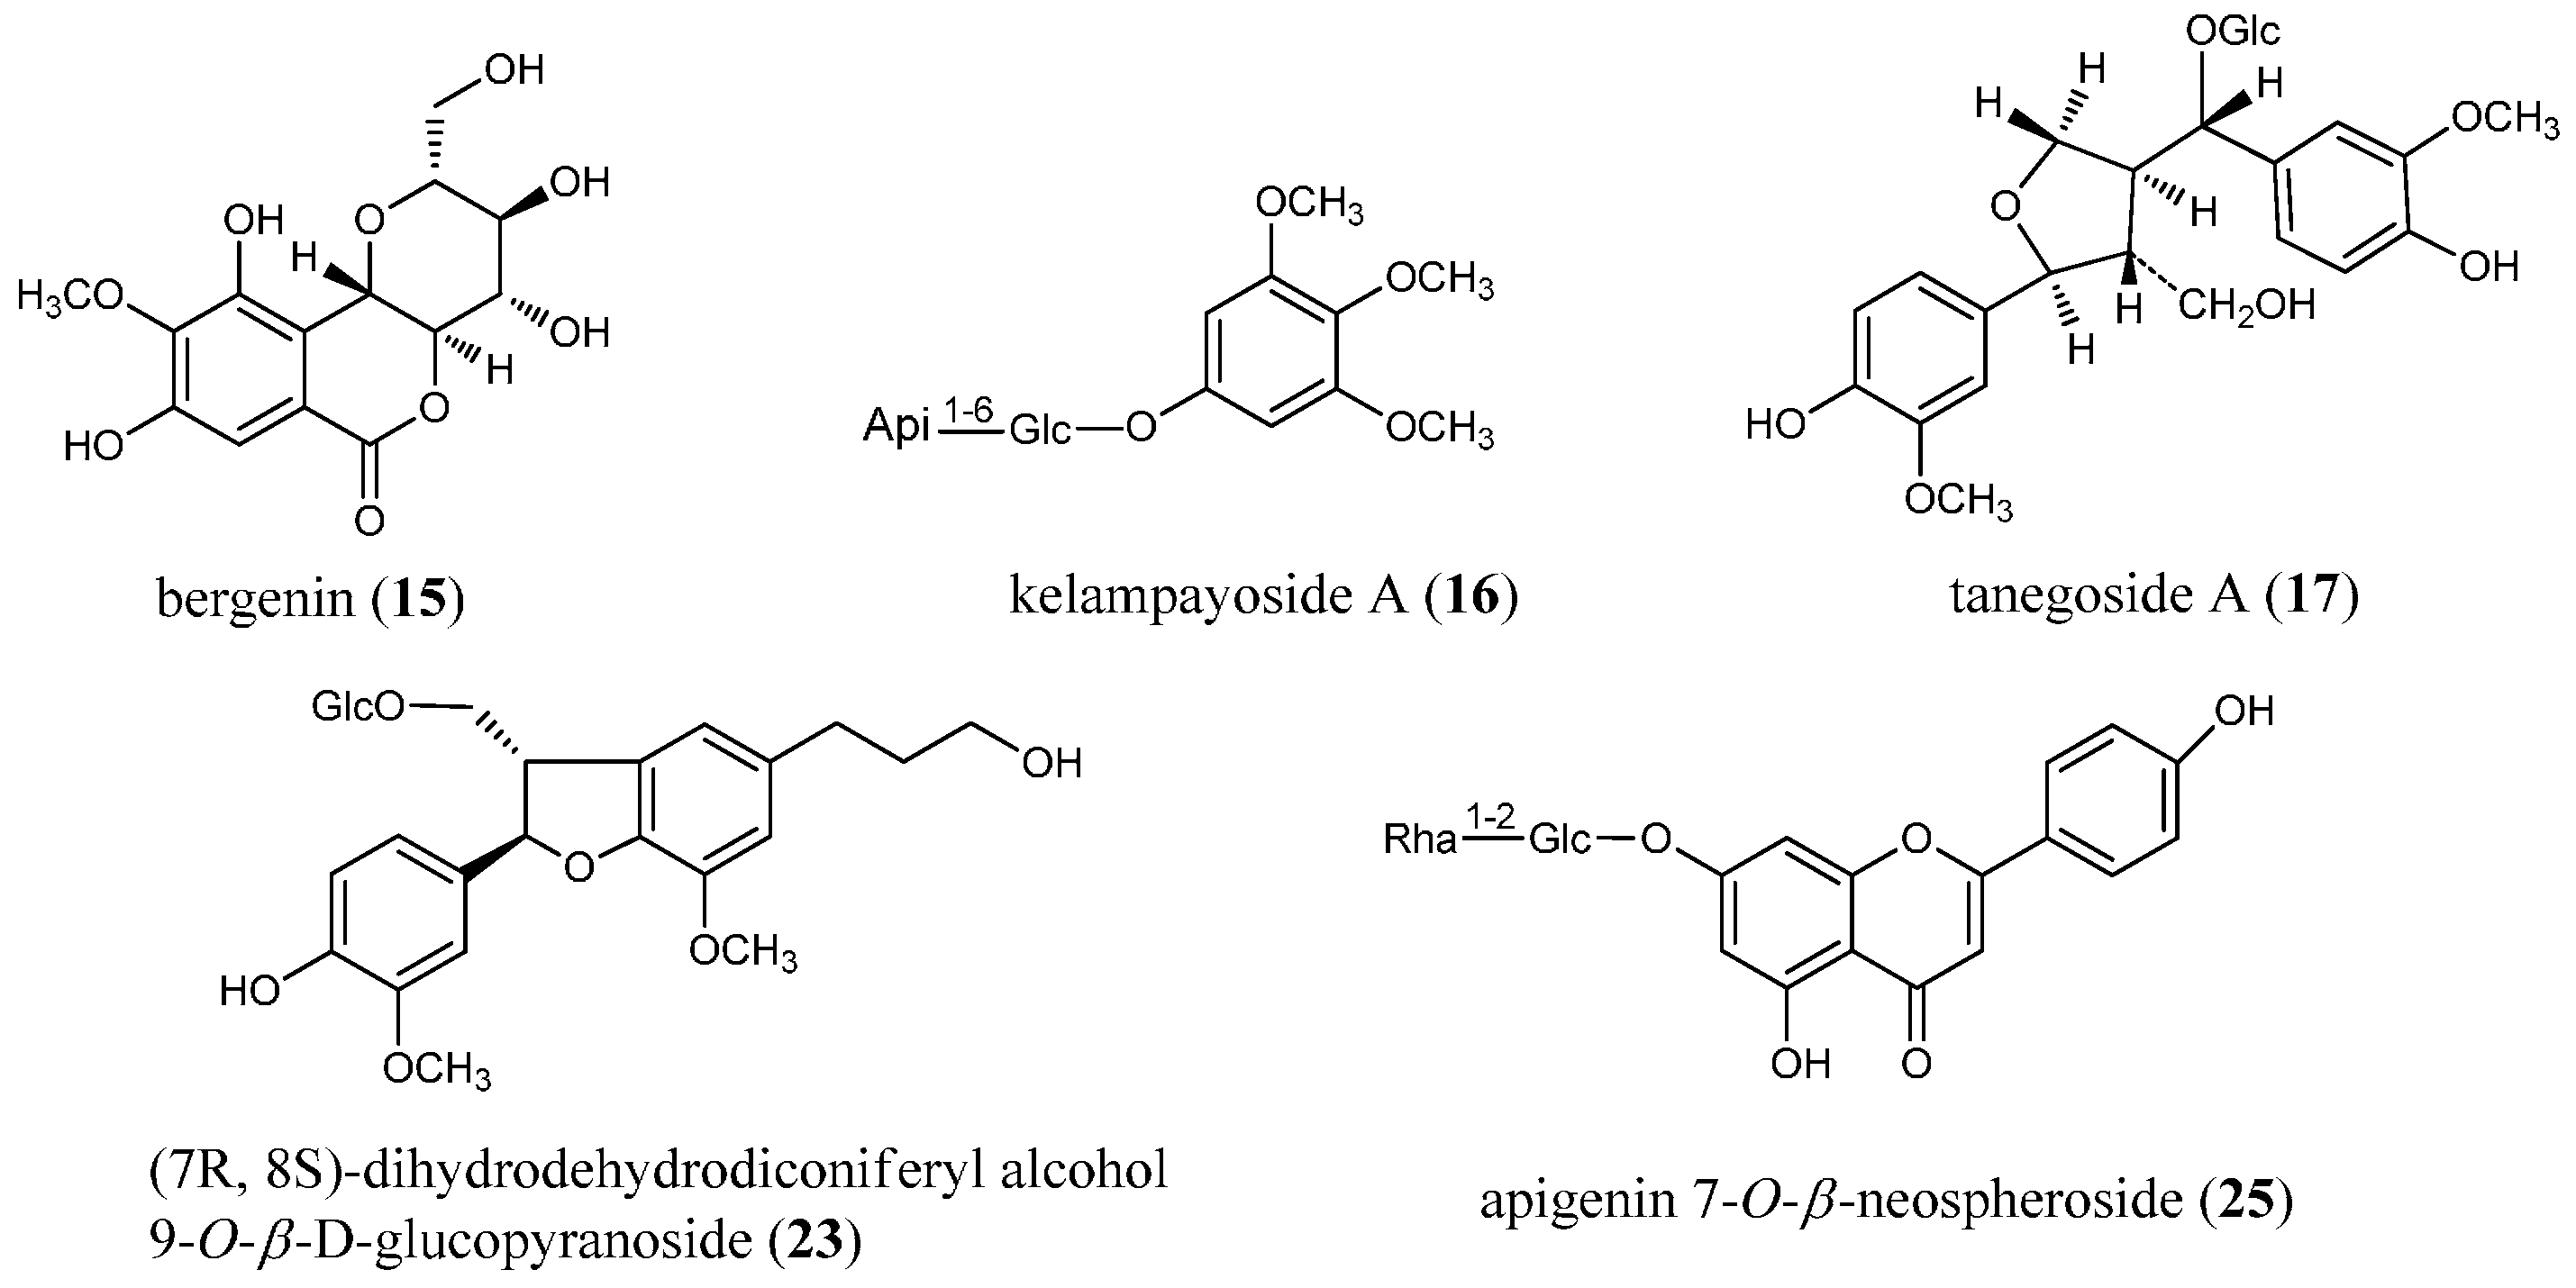
Figure 1. Chemical structures of compounds identified in Caulis Trachelospermi. Glc: glucose, Api: apiose, Rha: rhamnose.
Molecules 20 08107 g001aMolecules 20 08107 g001b

No.Compound NameR1R2R3R4R5
1nortrachelogenin 5'-C-β-d-glucosideOHHGlcHH
2nortrachelosideOHGlcHHH
3nortrachelogenin 8'-O-β-d-glucosideO-GlcHHHH
4matairesinol 4'-O-β-gentiobiosideHGlc 6-1GlcHHH
5trachelogenin 4'-O-β-gentiobiosideOHGlc 6-1GlcHCH3H
6matairesinosideHGlcHHH
7trachelosideOHGlcHCH3H
8arctigenin 4'-O-β-gentiobiosideHGlc 6-1GlcHCH3H
9nortrachelogeninOHHHHH
10arctiinHGlcHCH3H
11matairesinolHHHHH
12trachelogeninOHHHCH3H
135-methoxytrachelogeninOHHHCH3OCH3
14arctigeninHHHCH3H
18nortrachelogenin 4,4'-di-O-β-d-glucosideOHGlcHGlcH
19matairesinol 4,4'-di-O-β-d-glucosideHGlcHGlcH
20nortrachelogenin 4'-O-β-gentiobiosideOHGlc 6-1GlcHHH
21nortrachelogenin 4-O-β-d-glucosideOHHHGlcH
224-demethyltraxillasideHGlcHHOCH3
24traxillagesideHGlcHOCH3OCH3

2. Results and Discussion

2.1. Quantitative Analysis of Dibenzylbutyrolatone Lignans

2.1.1. Validation of the Developed Method

The quantification method was validated in terms of linearity, LODs and LOQs, precision, repeatability, stability, and accuracy. The results are listed in Table 1 and Table 2. All calibration curves showed good linearity (r2 > 0.9997) within the test ranges, and the LODs and LOQs were 1.24–9.00 and 3.71–31.71 ng, respectively. The intra and inter-day precision of the standard solutions were found in the range of 0.17%–0.75% and 0.15%–2.87%, respectively. Both for repeatability and stability test, the RSD were less than 2.94% and 2.78%, respectively. Recovery was between 96.68% and 103.63% with RSD values below 1.87%. These validation results indicated that the present method was sensitive, precise, repeatable, stable and accurate for the quantitative analysis of 14 dibenzylbutyrolatone lignans in Caulis Trachelospermi.
Table 1. Linear regression, LOD and LOQ, intra-day and inter-day precisions of the 14 dibenzylbutyrolatone lignans.
CompoundRegression Equation bR2Range (ng)LOD (ng)LOQ (ng)Intra-day (RSD%, n = 6)Inter-day (RSD%, n = 6)
1 ay = 0.9845x − 3.04671.000036.18–1266.304.278.540.331.70
2y = 1.2843x − 12.48951.000091.80–3213.009.0018.010.440.15
3y = 1.0255x− 11.82320.999939.03–1366.058.3718.300.420.41
4y = 0.8371x − 4.30341.000046.29–1620.154.9914.970.330.26
5y = 1.1938x − 4.77731.000086.31–3020.851.396.950.170.47
6y = 0.9789x − 15.63691.000091.60–3206.006.2527.490.440.85
7y = 1.8986x + 12.27281.0000280.56–9819.602.9412.730.280.42
8y = 1.0888x − 3.45181.0000107.38–3758.307.9331.740.240.46
9y = 1.7141x − 29.04981.000061.05–2136.758.0624.930.220.41
10y = 1.2220x − 1.40931.000086.40–3024.007.7224.950.310.85
11y = 1.0257x − 24.04420.999749.50–1732.501.243.710.190.48
12y = 2.1915x − 41.17401.0000125.20–4382.003.1310.420.220.43
13y = 1.5909x − 0.01341.000012.35–432.254.0613.950.172.87
14y = 1.7761x − 4.46370.999922.76–796.433.3511.180.752.22
a The compounds are the same as in Figure 1; by is the peak area, x is the concentration (ng) of compound.
Table 2. Repeatability, stability and recovery of 14 dibenzylbutyrolatone lignans in Caulis Trachelospermi.
CompoundRSD (%, n = 6)Recovery (%, n = 6)
RepeatabilityStabilityOriginal (μg)Spiked (μg)Observed (μg)MeanRSD (%)
10.711.51163.01164.02329.03101.221.02
20.460.31343.80362.30706.23100.040.24
32.940.85127.43143.63273.94102.011.87
40.892.08170.29175.29344.4299.330.45
50.411.23375.40335.38718.15102.200.75
62.072.78483.13474.85946.7697.641.09
70.520.281325.261242.482542.1797.940.34
80.701.19224.28257.71478.2998.560.38
90.901.03198.16234.43429.0898.510.17
100.762.21421.27421.63858.20103.630.39
111.470.80292.02277.20575.80102.370.30
121.120.26439.82420.67859.5699.780.27
132.701.1415.8820.7536.93101.430.71
141.981.0089.0087.38174.4896.680.48

2.1.2. Sample Analysis

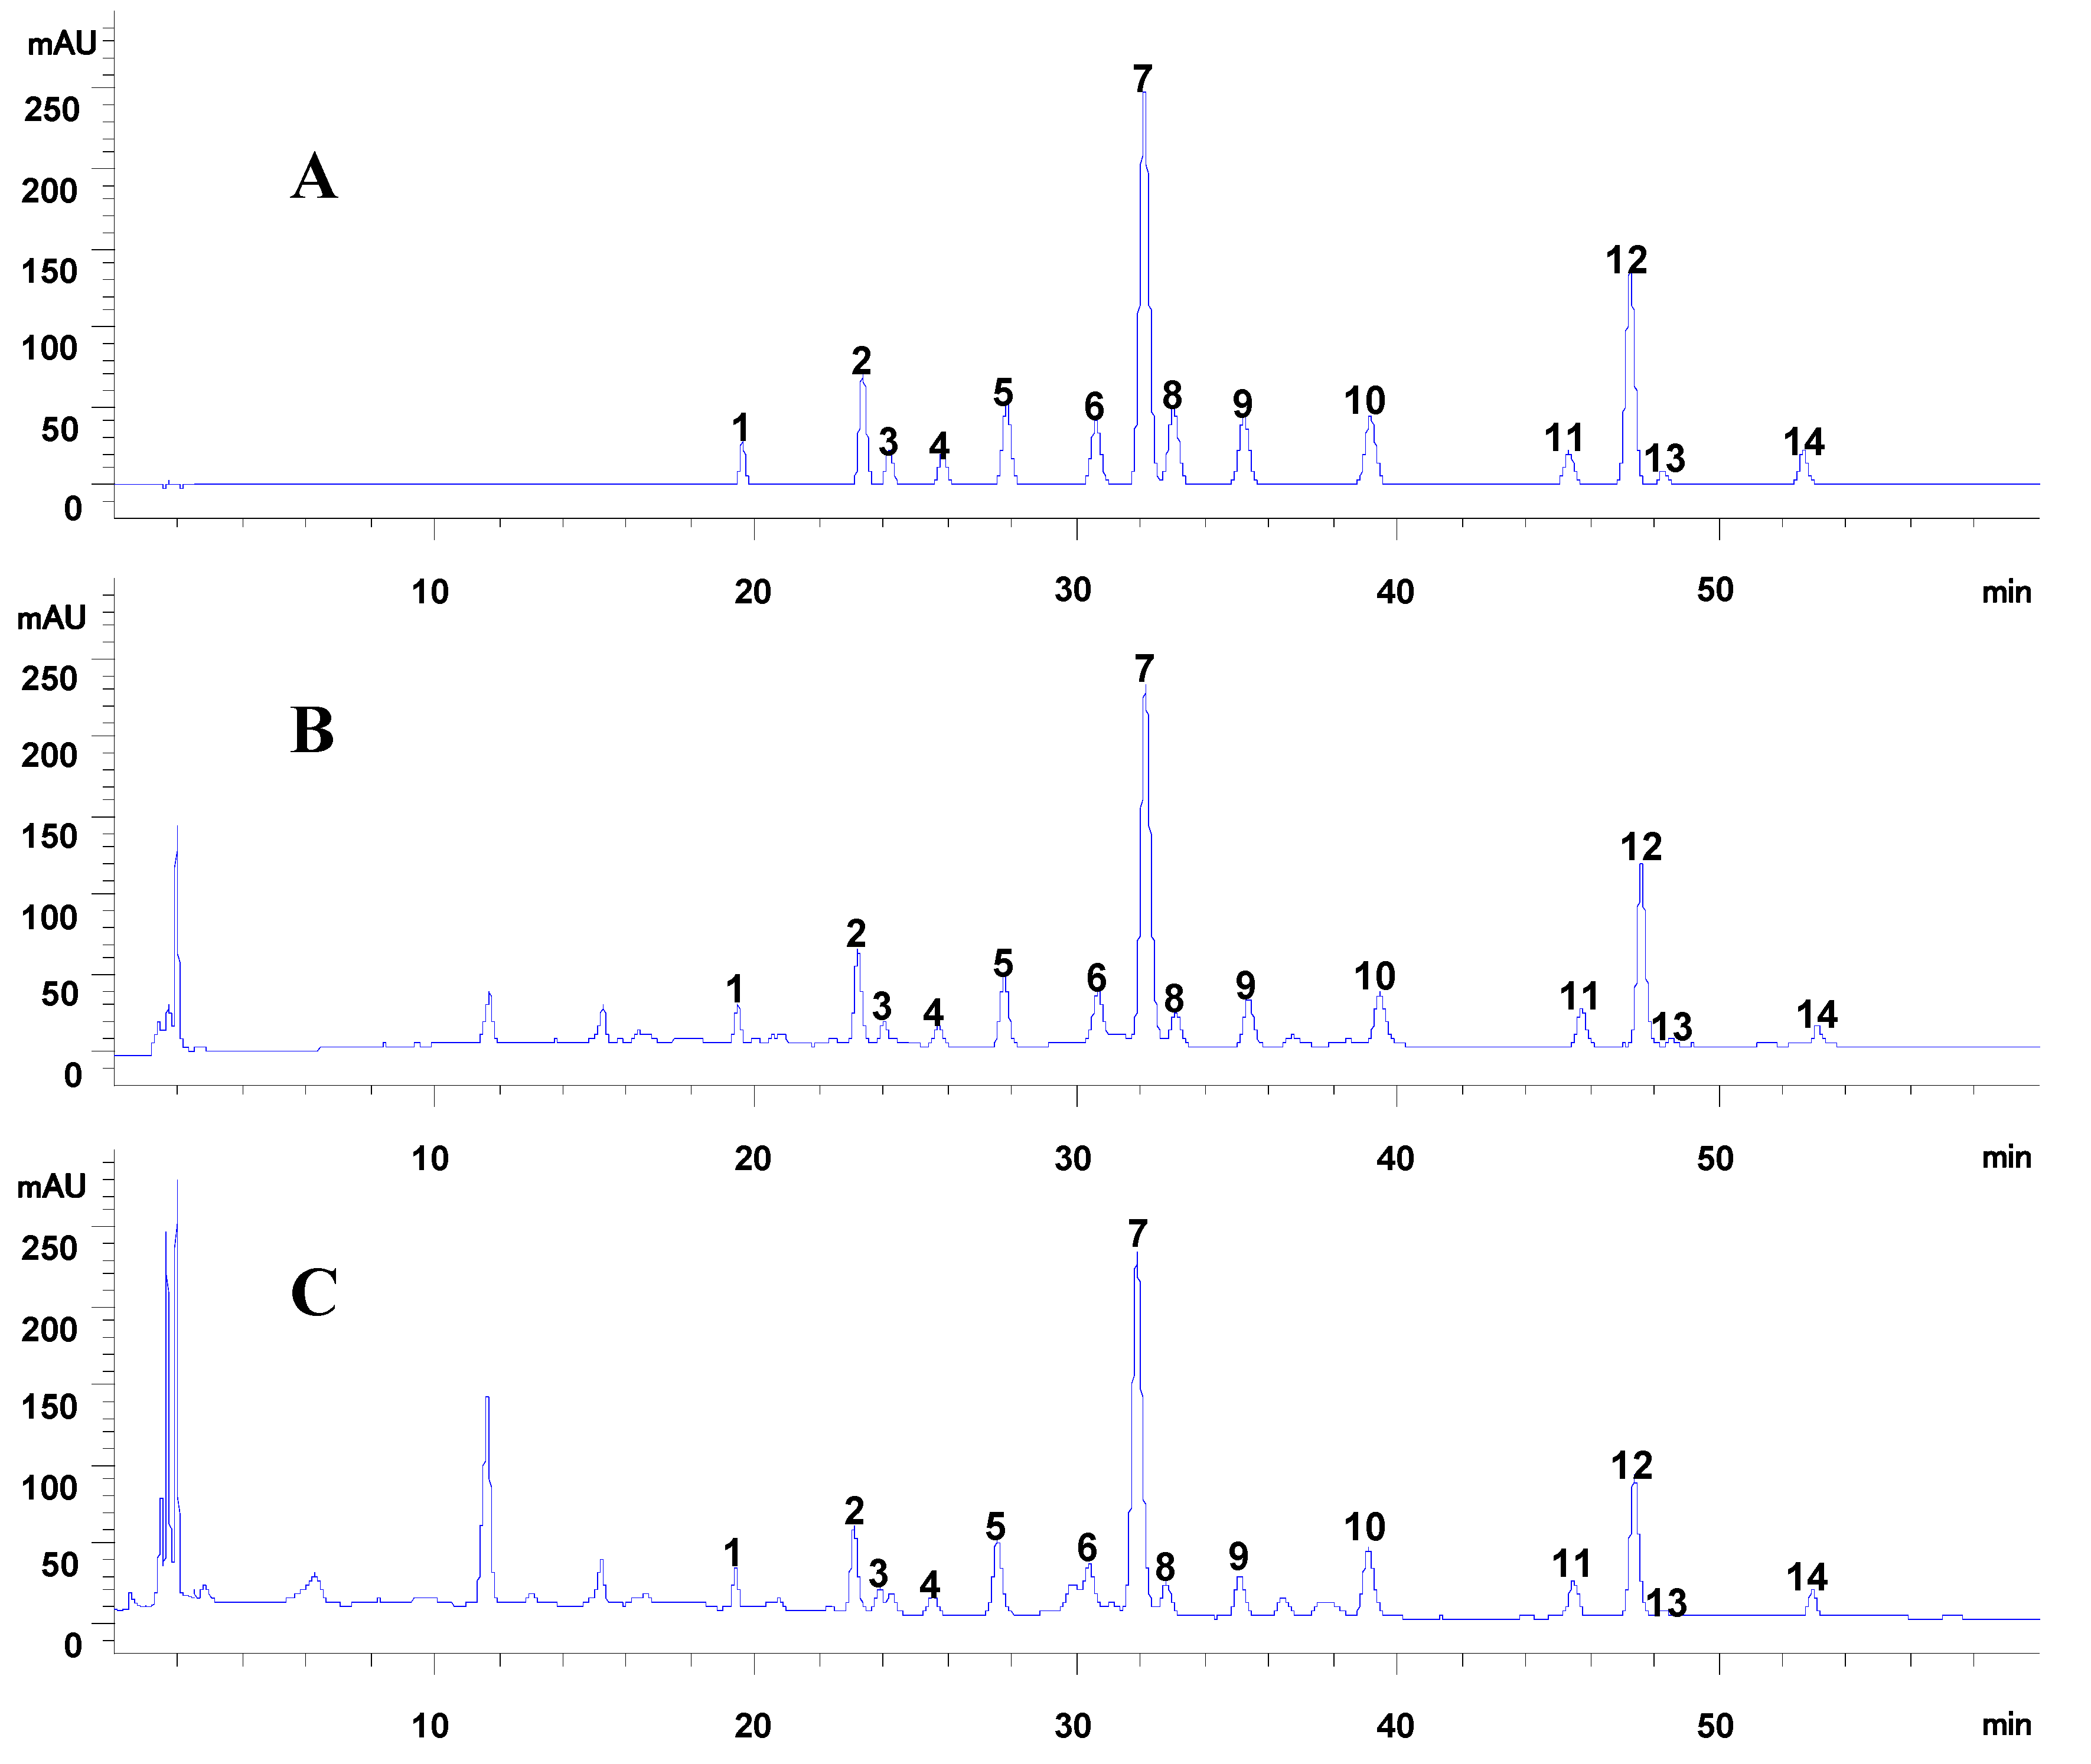
The developed method was successfully applied to the simultaneous determination of 14 dibenzylbutyrolatone lignans in 14 batches of Caulis Trachelospermi. Representative chromatograms are shown in Figure 2C. Quantification of each compound in the samples was calculated with the external standard using the calibration curves. Information regarding the content is summarized in Table 3. According to Table 3, all the 14 compounds were detected from the 14 batches of Caulis Trachelospermi samples. Their contents varied dramatically with RSD (%) ranging from 30.54%–61.54%, but the variation of total content of all compounds was not that large. The average total content of these 14 compounds was 28.531 mg/g. The results also showed that in all samples, tracheloside was the maximal constituent, with a mean content of 7.237 mg/g. Besides, as shown in Table 3, most compounds in Y2-4 revealed relatively lower contents than others, and the contents of Y2-12 differed greatly from other batches. This was probably caused by the poor native quality of the analyzed samples. In general, the full scale multiple compounds quantification method developed in this paper has not been provided so far which will shed some new light on the quality control of Caulis Trachelospermi.
Figure 2. (A) HPLC-UV chromatogram of mixed standards. (B) HPLC-UV chromatogram of the sample extracted from Caulis Trachelospermi. (C) HPLC-UV chromatogram of Caulis Trachelospermi. The number of peaks marked in Figure 2 is corresponding to Figure 1.
Molecules 20 08107 g002
Table 3. Content (n = 3, mg/g) of 14 dibenzylbutyrolatone lignans in the tested samples.
Sample1234567891011121314Sum
Y2-10.7851.7060.6670.7581.9492.1216.6021.1300.9322.1841.3882.0410.0920.40522.761
Y2–21.3554.7121.3971.6392.6435.29411.3012.1360.9662.6781.4401.8330.1160.42337.934
Y2–31.0683.3942.0131.7571.5335.6277.2181.8080.3133.1660.5840.9170.0480.34829.795
Y2–40.7061.0320.7350.3060.3331.1722.7770.3141.0431.1551.1712.2220.1470.30313.415
Y2–50.9892.4911.1130.5401.3272.4088.0541.0401.5172.5791.4983.5050.1590.48427.703
Y2–61.0003.9840.6220.5631.3782.1138.7420.8141.9320.5701.4093.4220.3030.25927.112
Y2–71.4023.6011.4271.5852.7484.23410.3391.7691.1162.0471.5542.2550.1610.41334.650
Y2–81.0804.0981.1081.7422.6985.12410.3442.3770.9552.2561.3832.0030.1310.45335.751
Y2–90.6761.0290.8620.6161.3141.8294.5050.8051.3811.8392.2514.1680.2100.66422.148
Y2–100.9274.2731.9312.1741.6256.8328.6132.0210.4713.7890.8651.3140.0560.57335.464
Y2–110.8053.5441.2341.1051.4143.7967.7181.2801.2621.8780.8471.5340.0990.44226.958
Y2–120.3970.9840.7790.6080.6061.3643.0540.6771.2670.7012.3603.9060.2471.64418.594
Y2–130.8272.1641.2391.0701.4982.7747.2751.0452.5461.4843.1025.3350.3480.90031.607
Y2–140.6160.9980.8950.6601.3981.7444.7750.9431.3411.7362.2794.3520.2060.81022.752
Average0.9022.7151.1451.0801.6053.3177.2371.2971.2172.0041.5812.7720.1660.58028.531
RSD (%)30.5450.9438.1754.6944.4854.8636.7947.7445.8044.3743.6947.9253.4161.5426.20

2.2. Qualitative Analysis of Caulis Trachelospermi

2.2.1. Fragmentation Characteristics of Dibenzylbutyrolatone Lignans
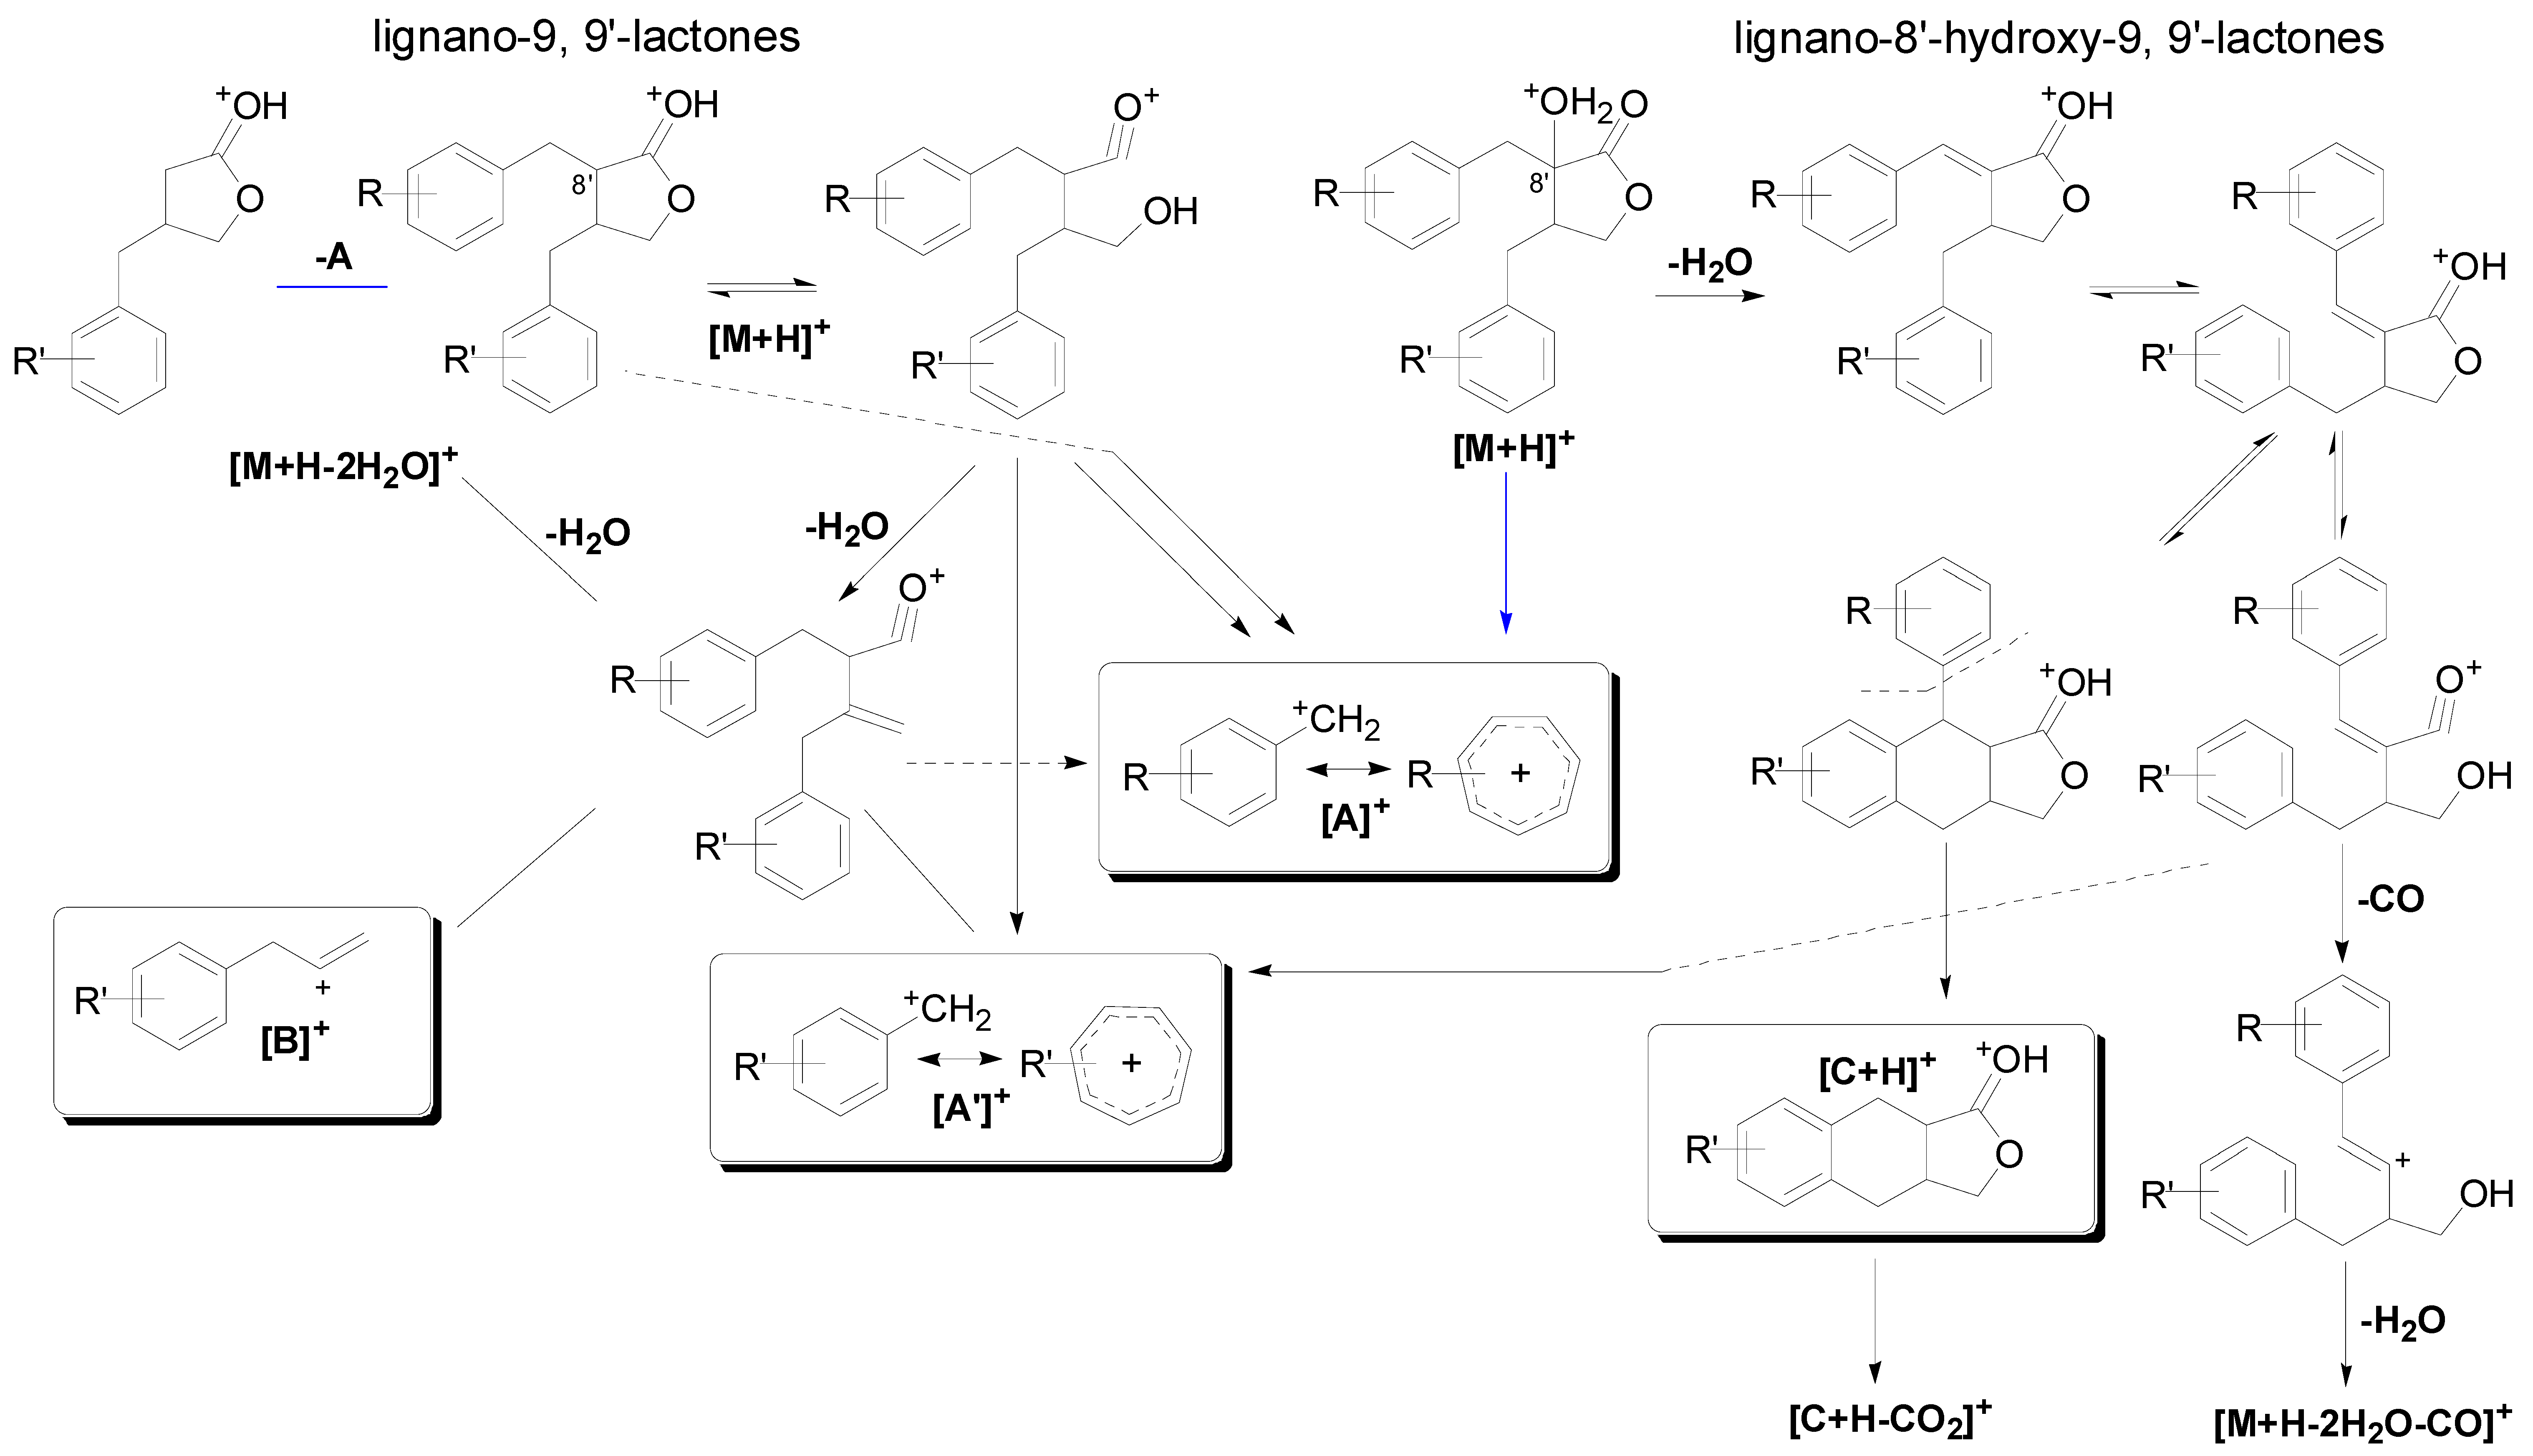
The mass spectra of reference compounds indicated that the accurate molecule weight of the quasi-molecule ions was highly consistent with that of the calculated ones (see Table S1). Thus, the molecule formula of the compounds in the sample can be uniquely deduced with the accurate molecule weight. In the MS spectra, all dibenzylbutyrolatone lignan standards showed strong [M+Na]+ signals in the positive ion mode. The selected precursor ions were dissociated using MS/MS to generate a series of abundant fragment ions. According to the MS data, the fragmentation patterns of lignano-9, 9'-lactones and lignano-8'-hydroxy-9, 9'-lactones exhibited diagnostic distinction between each other. The fragmentation pathways are summarized in Figure 3 and characteristic fragment ions of reference standards in MS/MS spectra are shown in Table 4 and Table 5.
The fragmentation pathways (Figure 3) of lignano-9, 9'-lactones such as matairesinol were in agreement with Schmidt’s research that the [A]+ ion, the analogous product ion [A']+ and the ion [B]+ is observed with significant abundance [24]. Furthermore, the high-resolution MS experiment of our research provides sufficient confirmation for Schmidt’s conclusions. The formation of two characteristic fragments ([A]+ and [B]+) provides information allowing the distinction between isomers with exchanged substitution of the two benzyl moieties [25]. Notably, the fragment ion at m/z 223.0968 (corresponding to [M+H−A]+ of matairesinol) which was first observed in our research can also determine the substitution of the two benzyl moietites of lignano-9,9'-lactones. Thus, the ion [M+H−A]+ can be interpreted as a complementary of [B]+ for the characteristic product ions.
The MS/MS spectrum of trachelogenin which is representative of lignano-8'-hydroxy-9,9'-lactones generated an abundant fragment at m/z 371.1496 [M+H−H2O]+ to yield a lign-7-eno-9,9'-lactones intermediate. The subsequent fragmentation pathways are identical with that of lign-7-eno-9,9'-lactones proposed by Schmidt et al. [25] and very abundant ions [C+H]+ and [A']+ were observed. However, fragmentary ion at m/z 137.0613 (termed [A]+ in Figure 3) which has not been reported by Schmidt et al. in lign-7-eno-9,9'-lactones can also be detected. Consequently, the fragment described above is of diagnostic value in the straightforward assignment of aromatic substitution in lignano-8'-hydroxy-9,9'-lactones.
In the MS/MS spectra of lignano-9,9'-lactone and lignano-8'-hydroxy-9,9'-lactone O-glycosides, ion [M+H−162]+ or [M+H−162−162]+ was obtained after eliminating the glucose residue (−162 Da) and subsequent MS behavior is in line with the typical fragmentation pathways of the aglycone moieties except matairesinol 4'-O-β-gentiobioside (4). On the other hand, nortrachelogenin 5'-C-β-d-glucoside (1) showed the characteristic fragment ions at 441.1555 [M+H−2H2O−60]+ and 423.1459 [M+H−3H2O−60]+ which was result from a cross-link cleavage of the C-glycoside moiety. Unfortunately, the diagnostic ion cannot be detected in 5-methoxytrachelogenin (13) and arctigenin (14). It was likely due to the inadequate MS/MS conditions or some unknown factors which requires further investigation.
Overall, the characteristic [B]+ and [C+H]+ ions in combination with the [A]+ and [A']+ ions allows the unambiguous identification and distinction between lignano-9,9'-lactones and lignano-8'-hydroxy-9,9'-lactones.
Figure 3. MS/MS fragmentation pathways of lignano-9, 9'-lactones and lignano-8'-hydroxy-9, 9'-lactones.
Molecules 20 08107 g003
Table 4. Key MS/MS fragmentation data of reference lignano-9,9'-lactones compounds.
Peak No.[A]+ (Measured)[A]+ (Calculated)Error (ppm)[A']+ (Measured)[A']+ (Calculated)Error (ppm)[B]+ (Measured)[B]+ (Calculated)Error (ppm)[M+H−A]+ (Measured)[M+H−A]+ (Calculated)Error (ppm)
4137.0603137.06030137.0603137.06030
6137.0599137.0603−2.92137.0599137.0603−2.92163.0755163.07540.61223.0973223.09653.55
8137.0601137.0603−1.46 237.1117237.1121−1.69
10137.0604137.06030.73151.0759151.07543.31177.0923177.09107.34237.1127237.11212.53
11137.0607137.06032.92137.0607137.06032.92163.0762163.07624.91223.0968223.09651.35
14137.0599137.0603−2.92151.0753151.0754−0.66
Table 5. Key MS/MS fragmentation data of reference lignano-8'-hydroxy-9,9'-lactones compounds.
Peak No.[A]+ (Measured)[A]+ (Calculated)Error (ppm)[A']+ (Measured)[A']+ (Calculated)Error (ppm)[C+H]+ (Measured)[C+H]+ (Calculated)Error (ppm)
1 137.0607137.06032.92
2137.0610137.06035.12137.0610137.06035.12233.0816233.08083.43
3137.0602137.0603−0.73137.0602137.0603−0.73233.0812233.08081.72
5137.0619137.060311.67151.0775151.075413.90247.0982247.09656.88
7137.0605137.06031.46151.0763151.07545.96247.0973247.09653.24
9137.0614137.06038.03137.0614137.06038.03233.0820233.08085.15
12137.0613137.06037.30151.0770151.075410.59247.0977247.09654.86
13137.0613137.06037.30181.0861181.08591.10

2.2.2. Identification of Constituents in the Sample Extracted from Caulis Trachelospermi
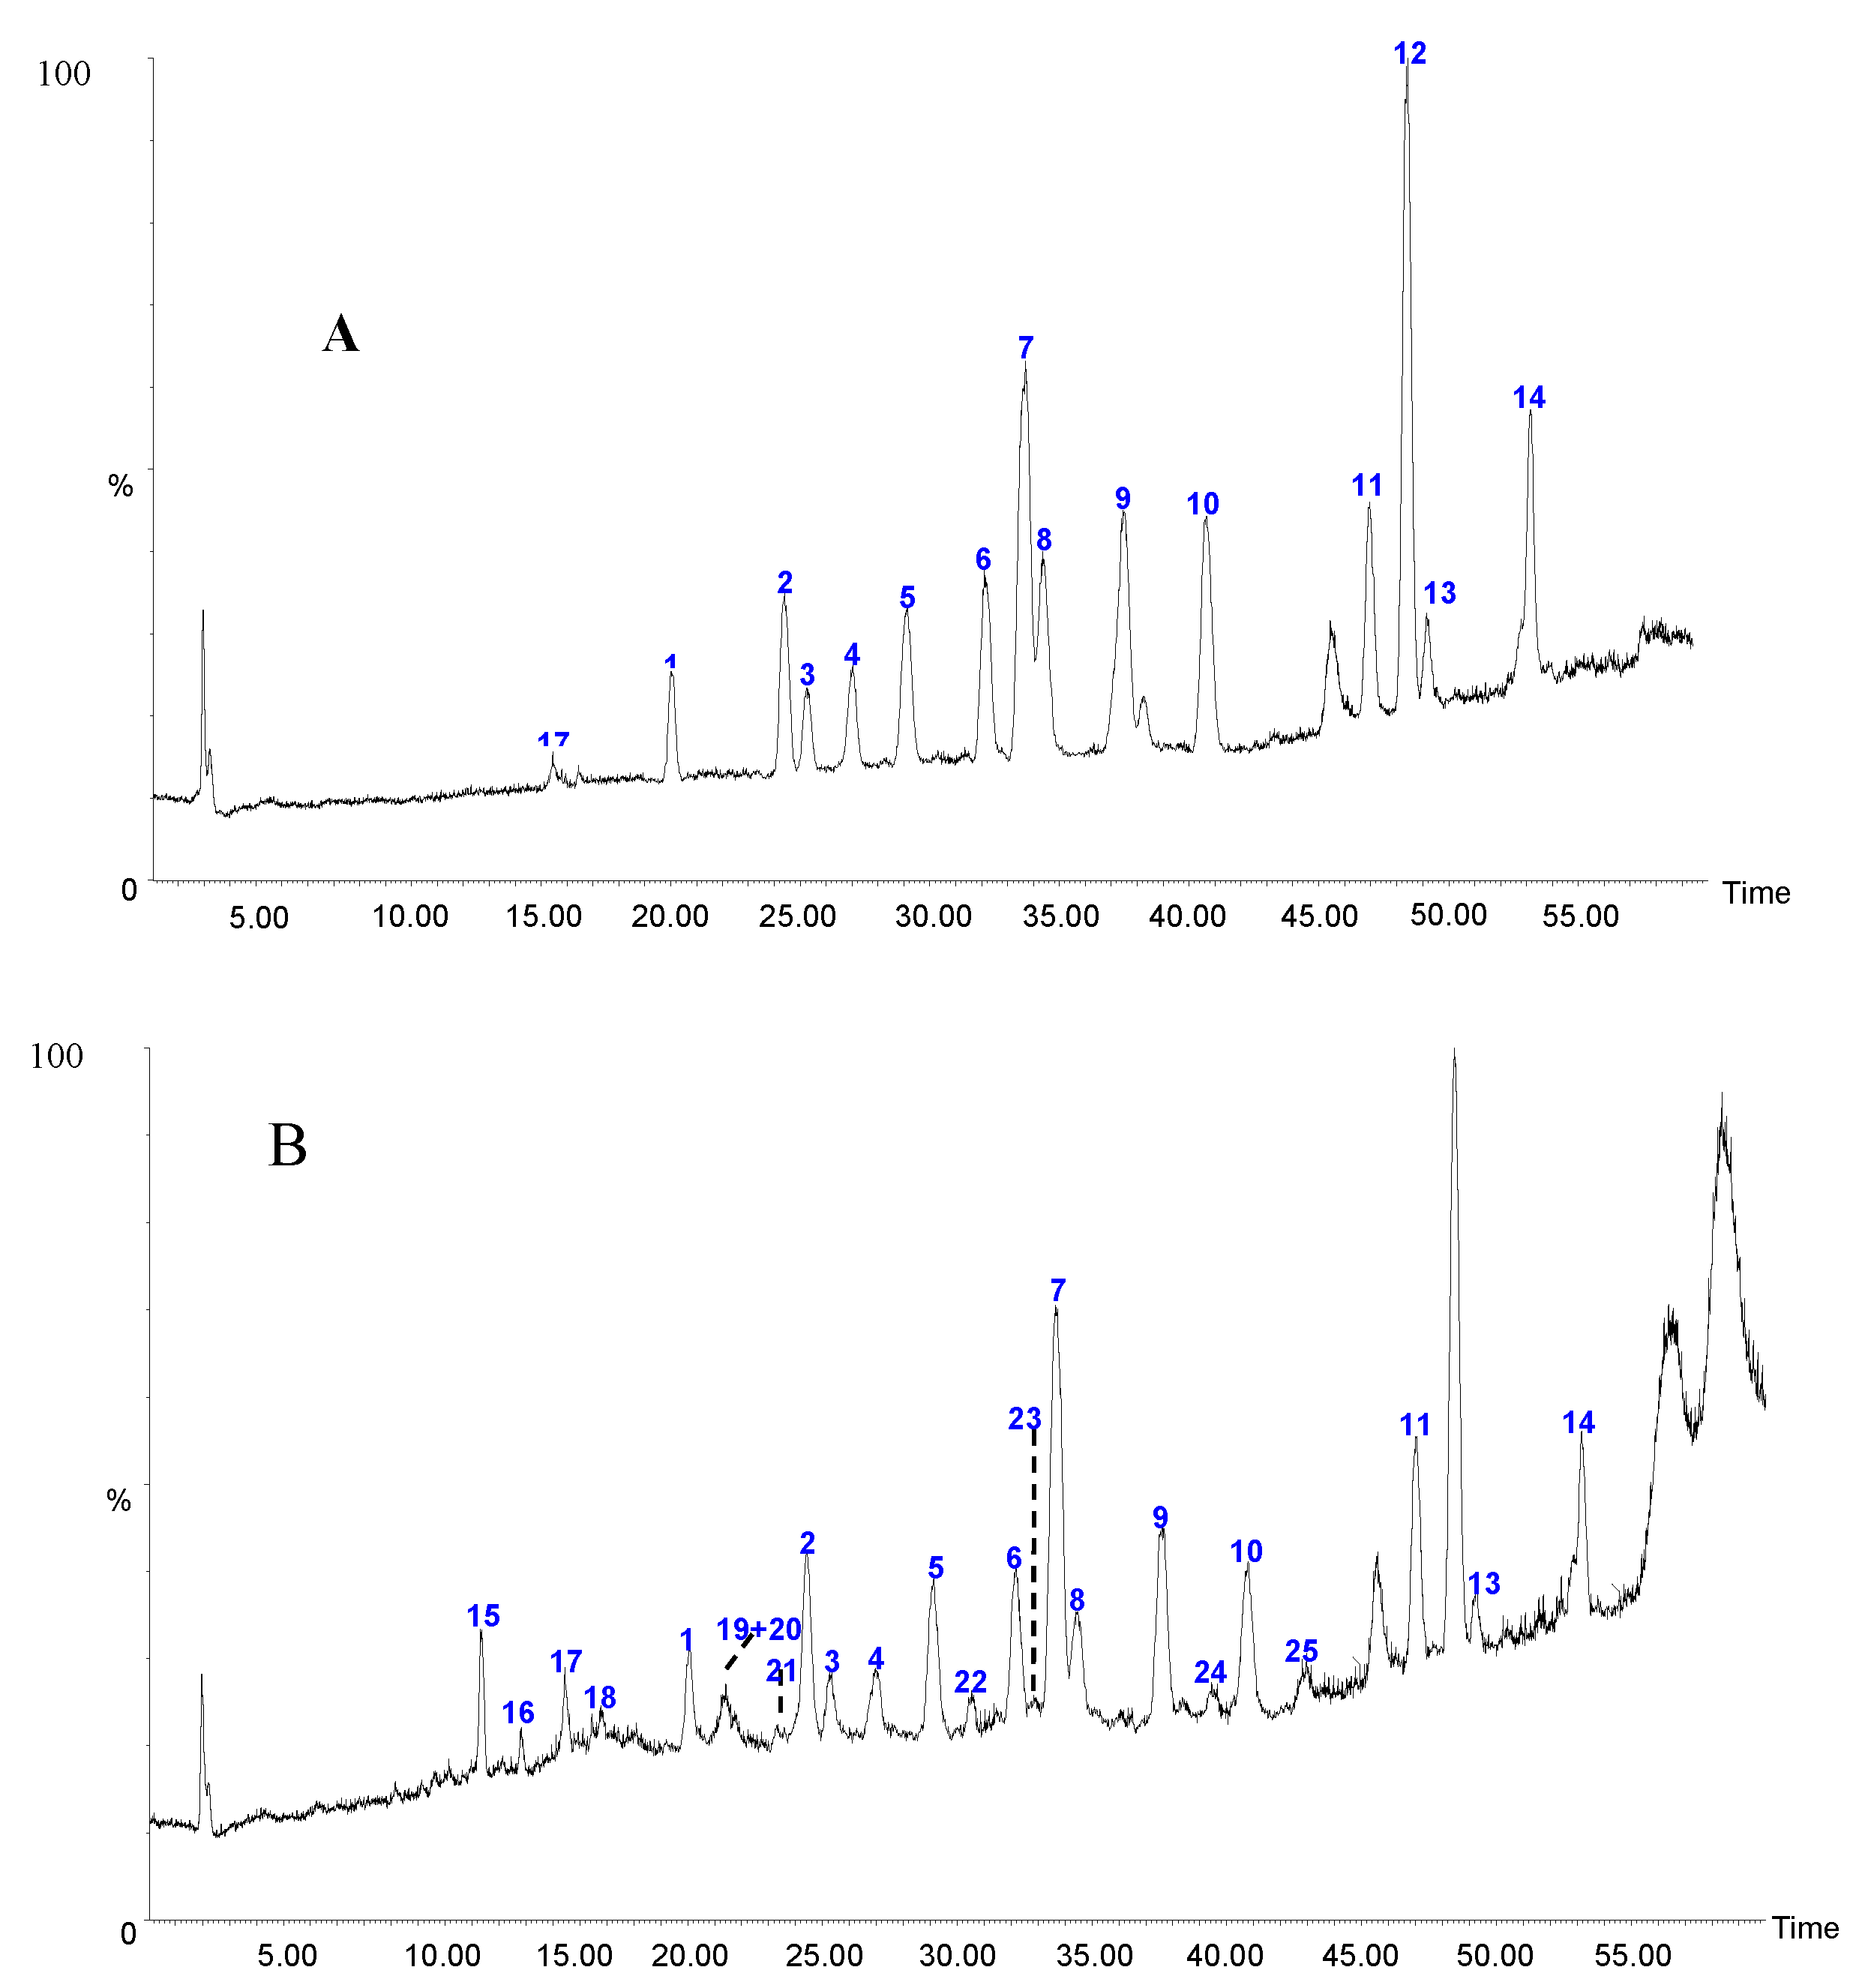
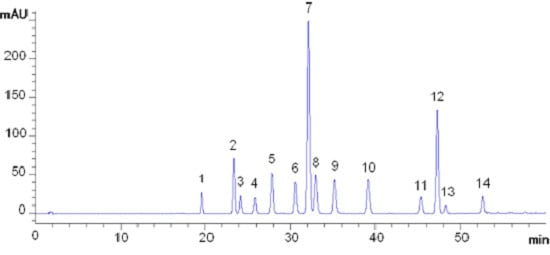
Before qualitative analysis of the constituents in Caulis Trachelospermi by HPLC-QTOF-MS, purification from Caulis Trachelospermi was performed by HP-20 macroporous resin column chromatography to obtain an extract for analysis in order to reduce the matrix interference. As shown in the HPLC-UV chromatogram (Figure 2B), the sample after purification successfully remains the major constituents in Caulis Trachelospermi. Its total ion chromatogram (TIC) from HPLC-QTOF-MS analysis is shown in Figure 4. Under the present chromatographic and MS conditions, in total 25 compounds were detected (as shown in Table 6 and Figure 4). Among them, 15 compounds were unambiguously identified by comparing with the retention time and MS data of reference standards.
Compound 21 showed an accurate mass of [M+Na]+ ion at m/z 559.1808 corresponding to the molecular formula C26H32O12. In the MS/MS spectrum, signals for ion at m/z 397.1328 [M+Na−162]+ via the loss of glucose and the characteristic ion at 159.0415 [A−H+Na]+ implied that it was nortrachelogenin glucoside. According to the different LC retention behaviors from the known isomers nortracheloside (2) and nortrachelogenin 8'-O-β-d-glucoside (3), it was assigned as nortrachelogenin 4-O-β-d-glucoside. Similarly, compound 18, 22 and 24 was deduced to be nortrachelogenin 4, 4'-di-O-β-d-glucoside, 4-demethyltraxillaside and traxillageside, respectively. Their structures were confirmed by NMR techniques after isolaton and purification in our previous research [9,26].
Figure 4. (A) Total ion current (TIC) of mixed standards. (B) Total ion current (TIC) of the sample extracted from Caulis Trachelospermi. The number of peaks marked in Figure 4 is corresponding to Figure 1.
Molecules 20 08107 g004
Table 6. Key MS/MS fragmentation data of other constituents in the sample extraced from Caulis Trachelospermi.
Peak No.tR (min)Precursorion (m/z)Error (ppm)FormulaFragments (m/z)Elem. comp.PathwaysIdentity
1512.349329.0865
[M+H]+
−2.43C14H16O9293.0663
275.0549
263.0555
247.0610
233.0442
C14H13O7+
C14H11O6+
C13H11O6+
C13H11O5+
C12H9O5+
[M+H−2H2O]+
[M+H−3H2O]+
[M+H−2H2O−HCOH]+
[M+H−3H2O−CO]+
[M+H−2H2O−CH3COOH]+
bergenin
1613.795501.1551
[M+Na]+
−5.79C20H30O13411.1230
369.1147
C17H24O10Na+
C15H22O9Na+
[M+Na−3HCOH]+
[M+Na−Api]+
kelampayoside A
1715.450561.1963
[M+Na]+
2.63C26H34O12 381.1310C20H22O6Na+[M+Na−Glc−H2O]+tanegoside A
1816.775721.2315
[M+Na]+
−0.69C32H42O17559.1771
397.1249
159.0419
C26H32O12Na+
C20H22O7Na+
C8H8O2Na+
[M+Na−Glc]+
[M+Na−2Glc]+
[A−H+Na]+/[A'−H+Na]+
nortrachelogenin 4,4'-di- O-β-d-glucoside
1921.416705.2371
[M+Na]+
0C32H42O16543.1870
381.1335
159.0435
C26H32O11Na+
C20H22O6Na+
C8H8O2Na+
[M+Na−Glc]+
[M+Na−2Glc]+
[A−H+Na]+/[A'−H+Na]+
matairesinol 4,4'-di- O-β-d-glucoside
2021.416721.2309
[M+Na]+
−1.53C32H42O17559.1743
397.1295
159.0421
C26H32O12Na+
C20H22O7Na+
C8H8O2Na+
[M+Na−Glc]+
[M+Na−2Glc]+
[A−H+Na]+/[A'−H+Na]+
nortrachelogenin 4'- O-β-gentiobioside
2122.976559.1792
[M+Na]+
0.18C26H32O12397.1328
159.0415
C20H22O7Na+
C8H8O2Na+
[M+Na−Glc]+
[A−H+Na]+/[A'−H+Na]+
nortrachelogenin 4- O-β-d-glucoside
2230.531573.1968
[M+Na]+
3.49C27H34O12411.1426C21H24O7Na+[M+Na−Glc]+4-demethyltraxillaside
2332.928545.1992
[M+Na]+
−1.28C26H34O11383.1596
159.0366
C20H24O6Na+
C8H8O2Na+
[M+Na−Glc]+
[A−H+Na]+
dihydrodehydrodiconiferyl alcohol-9- O-β-d-glucoside
2439.434587.2125
[M+Na]+
3.58C28H36O12425.1583
159.0412
C22H26O7Na+
C8H8O2Na+
[M+Na−Glc] +
[A−H+Na]+
traxillageside
2542.339579.1719
[M+H]+
0.86C27H30O14433.1125
271.0605
C21H21O10+
C15H11O5+
[M+H−Rha]+
[M+H−Rha−Glc]+
apigenin 7- O-β-neospheroside
Compound 20 yielded product ions at 559.1743 [M+Na−162]+ and 397.1295 [M+Na−162−162]+ which correspond to the aglycone form after loss of hexosyl moiety, together with the fragment ion at 159.0421 [A−H+Na]+, sugguesting the aglycone moiety is nortrachelogenin. According to the biogenetic regularity that the sugar residue is mostly glucosyl or gentiobiosyl residue and sugar residue is preferentially connected to C-4', compound 20 was deduced as nortrachelogenin 4, 4'-di-O-β-d-glucoside or nortrachelogenin 4'-O-β-gentiobioside. Since its LC retention time is different from that of the known isomer nortrachelogenin 4, 4'-di-O-β-d-glucoside (18), its structure was assigned as nortrachelogenin 4'-O-β-gentiobioside. Similarly, Compound 19 was deduced as matairesinol 4, 4'-di-O-β-d-glucoside according to its MS data and different LC retention time from that of its known isomer matairesinol 4'-O-β-gentiobioside (4).
Other compounds (15, 16, 23 and 25) were tentatively identified by comparing MS data and LC retention behavior with the literature published by our group [9,26,27].
However, the dibenzylbutyrolatone lignans with low content in sample did not show key information such as the characteristic ions [B]+ and [C+H]+ having critical importance in structural elucidation of dibenzylbutyrolatone lignans. This was probably due to the trace content of these compounds which were easily interfered with by matrix.

3. Experimental Section

3.1. Chemicals, Reagents and Materials

Reference standards (Figure 1), nortrachelogenin 5'-C-β-d-glucoside (1), nortracheloside (2), nortrachelogenin 8'-O-β-d-glucoside (3), matairesinol 4'-O-β-gentiobioside (4), trachelogenin 4'-O-β-gentiobioside (5), matairesinoside (6), tracheloside (7), arctigenin 4'-O-β-gentiobioside (8), nortrachelogenin (9), arctiin (10), matairesinol (11), trachelogenin (12), 5-methoxytrachelogenin (13), arctigenin (14) and tanegoside A (17) were isolated from Caulis Trachelospermi and identified in our previous research [8,26,27,28]. The purities of the standards were determined to be above 95% by normalization of the peak areas detected by HPLC analyses.
HPLC grade methanol was obtained from Fisher Scientific (Fair Lawn, NJ, USA). Purified water was purchased from Wahaha Ltd. (Hangzhou, China). Other reagents, purchased from Sinopharm Chemical Reagent Co. Ltd. (Beijing, China) were of analytical grade. HP-20 macroporous resin was purchased from Mitsubishi Chemical Co. (Tokyo, Japan). 14 batches of Caulis Trachelospermi were acquired from different pharmaceutical companies in China (Table 7). All of the samples were authenticated by senior engineer Qi-yun Ma, Beijing Institute of Pharmacology and Toxicology, Beijing, China. Voucher specimens were deposited in the Department of Natural Products Chemistry, Beijing Institute of Pharmacology and Toxicology, Beijing, China. Batch no. 080130 (purchased from Beijing Qijing Chinese Herbs Factory, Beijing, China in 2008) was selected as the sample for method validation.
Table 7. Sample information for 14 batches Caulis Trachelospermi.
Sample no.Batch no.Source
Y2–1080130Zhejiang (QJ a)
Y2–20511011Zhejiang (CG)
Y2–3060530Anhui (SF)
Y2–4061329Anhui (SL)
Y2–505090101Shandong (PSL)
Y2–605081205Zhejiang (QJ)
Y2–720030928Yunnan (BTS)
Y2–820060415Yunnan (BTS)
Y2–95050028Guangxi (TRT)
Y2–101040804Henan (TRT)
Y2–11060626Jiangsu (LRT)
Y2–12070301Zhejiang (XD)
Y2–13F060290Sichuan (DRT)
Y2–1420070102Jiangsu (QX)
a Abbreviated for different pharmaceutical companies.

3.2. Standard Solutions Preparation

Individual stock solutions of reference standards were prepared by accurately weighing into a 10 mL volumetric flask and dissolving the reference compounds in methanol. A mixed solution used for quantitative analysis was prepared by placing a certain amount of each stock solution in a 10 mL volumetric flask and diluted to volume with 50% methanol aqueous solution at the concentration of 36.18 μg∙mL−1 nortrachelogenin 5'-C-β-d-glucoside (1), 91.80 μg∙mL−1 nortracheloside (2), 39.03 μg∙mL−1 nortrachelogenin 8'-O-β-d-glucoside (3), 46.29 μg∙mL−1 matairesinol 4'-O-β-gentiobioside (4), 86.31 μg∙mL−1 trachelogenin 4'-O-β-gentiobioside (5), 91.60 μg∙mL−1 matairesinoside (6), 280.56 μg∙mL−1 tracheloside (7), 107.38 μg∙mL−1 arctigenin 4'-O-β-gentiobioside (8), 61.56 μg∙mL−1 nortrachelogenin (9), 86.40 μg∙mL−1 arctiin (10), 49.50 μg∙mL−1 matairesinol (11), 125.20 μg∙mL−1 trachelogenin (12), 12.35 μg∙mL−1 5-methoxytrachelogenin (13), 22.76 μg∙mL−1 arctigenin (14). Meanwhile, a mixed solution including above solution and 58.46 μg∙mL−1 tanegoside A (17) was prepared for qualitative analysis. An aliquot of 10 μL was injected for HPLC-UV analysis and 1 μL for HPLC-QTOF-MS analysis. All the solutions were stored at 4 °C and brought to room temperature before use.

3.3. Preparation of Caulis Trachelospermi for HPLC-UV Analysis

Fourteen batches of Caulis Trachelospermi samples were pulverized and passed through a 100 mesh screen. Four hundred milligrams of the obtained fine powder was accurately weighed into a 50 mL capped conical flask, and 20 mL 50% aqueous methanol was accurately added. Sonication was performed at room temperature for 30 min, and then the same solvent was added to compensate for the lost weight during the extraction. The extracts were filtered with a 0.45 μm membrane filter prior to HPLC analysis, discarding the first part of the filtrate. An aliquot of 20 μL was injected for HPLC-UV analysis.

3.4. Preparation of the Sample of Caulis Trachelospermi for HPLC-QTOF-MS Analysis

Caulis Trachelospermi (Batch no. 080130, 160 g) was extracted two times with 80% alcohol at boiling temperature. The extract was concentrated and diluted in 1600 mL 5% alcohol. The solution was first centrifuged to remove the insoluble substance and then was passed through a HP-20 macroporous resin column (100 mL) and eluted by 500 mL water and 500 mL 70% alcohol successively. The 70% alcohol elution was concentrated and dried to produce 5.3 g product. 10.0 mg of the product weighed accurately was dissolved into a 10 mL volumetric flask and adjusted to volume with methanol-water (50:50, v/v) to obtain the sample solution. Prior to injection, the solution was passed through a 0.45 μm membrane filter. An aliquot of 1 μL was injected for HPLC-QTOF-MS analysis.

3.5. HPLC-UV Conditions for Quantitative Analysis

Quantitative analysis was performed on an Agilent 1200 series HPLC-UV system (Agilent Technologies, Santa Clara, CA, USA), compressing a quaternary pump, a vacuum degasser, an autosampler, a thermostatted column compartment and a UV-vis detector. Separation was done on an Agilent Zorbax Eclipse Plus C18 column (4.6 mm × 150 mm, 5 μm) and column temperature was maintained at 30 °C. The mobile phase was water (A) and methanol (B) with a linear gradient program as follows: 0–15 min, 10%–30% B; 15–40 min, 30%–40% B; and 40–60 min, 40%–60% B. Re-equilibration duration was 30 min between individual runs and the flow rate was kept at 0.8 mL∙min-1. The detector wavelength was set at 230 nm [19].

3.6. HPLC-QTOF-MS Conditions for Qualitative Analysis

Chromatography was performed using a Waters ACQUITY UHPLC system (Waters Corporation, Milford, MA, USA), equipped with a binary solvent delivery system and an autosampler. HPLC conditions were the same as those for quantitative analysis.
The Waters ACQUITY XEVO G2 QTOF mass spectrometer (Waters Corporation, Manchester, UK) was interfaced to the UHPLC system via an electrospray ionization (ESI) source. The source was operated in positive ionization mode. The desolvation gas was set to 600 L∙h−1 at temperature of 300 °C, the cone gas set to 50 L∙h−1, and the source temperature set to 100 °C. The capillary voltage and cone voltage were set to 3000 V and 20 V, respectively. The TOF data were collected between m/z 50 and 1200. The MS/MS experiments were performed using variable collision energy (20–30 eV). The accurate mass and composition for the precursor and fragment ions were calculated using Masslynx 4.1 software (Waters Corp., Milford, MA, USA) that was incorporated in the instrument.

3.7. Validation of the Quantitative Method

3.7.1. Calibration Curve, Limits of Detection and Quantification

For the calibration curves, a 1, 2, 3, 5, 10, 15, 20, 25, 35 μL volume of the mixed standard solution was injected respectively, and then the calibration curves were constructed by plotting the peak area versus the concentration (ng) of each analyte. The limit of detection (LOD) and the limit of quantification (LOQ) under the present chromatographic conditions were determined by injecting a series of diluted standard solutions when the signal-to-noise ratio (S/N) of analytes were about 3 and 10, respectively.

3.7.2. Precision and Accuracy

Precision of the developed method was evaluated in six replicates of the mixed standard solutions within one and three consecutive days to determine intra and inter-day precision, respectively. Variations of the peak area were taken as the measures of precision and expressed as relative standard deviation (RSD).
Recovery test was used to evaluate the accuracy of this method. The test was performed by adding accurate amounts of the mixed standard solutions into 200 mg of Caulis Trachelospermi (Batch no. 080130) in sextuplicate. The mixture were then extracted and analyzed as described in Section 3.3 and Section 3.5. The average recovery percentage was calculated by the formula: recovery (%) = (observed amount − original amount)/spiked amount × 100%.

3.7.3. Repeatability and Stability

To confirm the repeatability, six independent samples were prepared and analyzed from the same sample (Batch no. 080130). Stability was assessed through analyzing replicate injections of the same sample at 0 h, 2 h, 4 h, 6 h, 8 h and 24 h, which were stored at 25 °C. The relative standard deviation (RSD) was used to evaluate the results.

4. Conclusions

In the present study, a HPLC-UV method was first developed for the simultaneous determination of 14 dibenzylbutyrolatone lignans in Caulis Trachelospermi. The developed method was validated for all parameters and has been successfully applied to analyze 14 batches Caulis Trachelospermi samples, which could be helpful in quality assessment and standardization of Caulis Trachelospermi and its product. Meanwhile, a HPLC-QTOF-MS method was employed for the identification and structural characterization of major constituents in the sample extracted from Caulis Trachelospermi. The specific fragment ions obtained by MS/MS provide sufficient information for structure elucidation. Moreover, the fragmentation patterns of lignano-8'-hydroxy-9, 9'-lactones were investigated for the first time in this work. This qualitative identification method provide essential data for further chemical or pharmacological studies of Caulis Trachelospermi, and may be applied for the identification of bioactive dibenzylbutyrolatone lignans from other related plants.

Supplementary Materials

Supplementary materials can be accessed at: https://www.mdpi.com/1420-3049/20/05/8107/s1.

Acknowledgments

This work was supported by the National Science and Technology Major Project of China (No. 2013ZX09102-018 and 2012ZX09301003-001-004) and the project of Beijing Municipal Science & Technology Commission (Z131100006513013).

Author Contributions

X.-T.L. conceived the whole experimental work, including acquisition and analysis of data, and prepared the manuscript. N.-J.Y. was the project leader who took charge of the throughout research and accomplished writing of the paper. X.-G.W. performed the HPLC-QTOF-MS experiment. Y.Y., R.X. and F.-H.M. contributed to this work by coaching and assisting Liu’s experiments. Y.-M.Z. participated in revising the manuscript.

Conflicts of Interest

The authors declare no conflict of interest.

References

  1. Committee of pharmacopoeia of the People’s Republic of China, Pharmacopoeia of the People’s Republic of China (First Part); China Medical Science Technology Press: Beijing, China, 2010; p. 252.
  2. Nishibe, S.; Han, Y.M. Chemical constituents from Trachelosperomum jasminoides and its anticancer activity. World Phytomed. 2002, 17, 57–58. [Google Scholar]
  3. Lee, M.H.; Lee, J.M.; Jun, S.H.; Ha, C.G.; Lee, S.-H.; Kim, N.M.; Lee, J.H.; Ko, N.Y.; Mun, S.H.; Park, S.H.; et al. In vitro and in vivo anti-inflammatory action of the ethanol extract of Trachelospermi Caulis. J. Pharm. Pharmacol. 2007, 59, 123–130. [Google Scholar] [CrossRef] [PubMed]
  4. Tan, X.Q.; Chen, H.S.; Liu, R.H.; Tan, C.H.; Xu, C.L.; Xuan, W.D.; Zhang, W.D. Lignans from Trachelospermum jasminoides. Planta Med. 2005, 71, 93–95. [Google Scholar] [CrossRef] [PubMed]
  5. Tan, X.Q.; Chen, H.S.; Zhou, M.; Zhang, Y. Triterpenoids from canes with leaves of Trachelospermum jasminoides. Chin. Tradit. Herb. Drugs 2006, 37, 171–174. [Google Scholar]
  6. Tan, X.Q.; Guo, L.J.; Chen, H.S.; Wu, L.S.; Kong, F.F. Study on the flavonoids constituents of Trachelospermum jasminoides. J. Chin. Med. Mater. 2010, 33, 58–60. [Google Scholar]
  7. Jing, L.; Yu, N.J.; Li, Y.S.; Fu, L.; Zhao, Y.M. Novel lignans from the stems and leaves of Trachelospermum jasminoides. Chin. Chem. Lett. 2011, 22, 1075–1077. [Google Scholar] [CrossRef]
  8. Zhu, C.C.; Jing, L.; Yu, N.J.; Yang, X.D.; Zhao, Y.M. A new lignan and active compounds inhibiting NF-κB signaling pathway from Caulis Trachelospermi. Acta Pharm. Sin. B 2013, 3, 109–112. [Google Scholar] [CrossRef]
  9. Liu, X.T.; Wang, Z.X.; Yang, Y.; Wang, L.; Sun, R.F.; Zhao, Y.M.; Yu, N.J. Active components with inhibitory activities on IFN-γ/STAT1 and IL-6/STAT3 signaling pathways from Caulis Trachelospermi. Molecules 2014, 19, 11560–11571. [Google Scholar] [CrossRef] [PubMed]
  10. Li, X.X.; Wan, L.L.; Zhu, J.H.; Li, Y.; Zhang, J.P.; Guo, C. Determination of flavonoid aglycones in Trachelospermum jasminoides (Lindl.) Lem by HPLC. China Pharm. 2008, 19, 436–437. [Google Scholar]
  11. Tan, X.Q.; Guo, L.J.; Kong, F.F. Determination of trachelogenin in Trachelospermum jasminoides (Lindl.) Lem. by HPLC. Anhui Med. Pharm. J. 2011, 15, 308–309. [Google Scholar]
  12. Guo, L.; Tan, X.; Lu, P.; Wu, L.; Kong, F. Determination of salicylic acid in Trachelospermum jasminoides (Lindl.) Lem. by HPLC. China Pharm. 2009, 12, 1779–1781. [Google Scholar]
  13. Kong, M.; Zhang, J.; Yao, N.; Li, Y.; Jiang, C.H.; Gao, M.; Fang, Z.J.; Liang, J.Y. Simultaneous determination of five compounds in Trachelospermum jasminodes by HPLC. Chin. J. Exp. Tradit. Med. Formulae 2013, 19, 93–96. [Google Scholar]
  14. Zhu, S.; Tan, X.; Chen, H.; Lei, Y. Determination the content of tracheloside in Trachelospermum jasminoides (Lindl.) Lem. by RP-HPLC. China Pharm. 2005, 8, 1008–1009. [Google Scholar]
  15. Fujimoto, T.; Nose, M.; Takeda, T.; Ogihara, Y.; Nishibe, S. Quantitative analysis of lignan components in Chinese crude drugs “Zihualuoshi” and “Luoshiteng”. Jpn. J. Pharmacogn. 1993, 47, 218–221. [Google Scholar]
  16. Li, Q.; Wang, Z.M.; Fu, X.T. Study on quality standards of trachelospermum jasminoides. Northwest Pharm. J. 2010, 25, 431–432. [Google Scholar]
  17. Liu, M.P.; Yu, N.J.; Zhao, J.; Xu, B.; Zhao, Y.M. Quantitative Analysis of Total Lignans in the Lignan Extract from Trachelospermum jasminoides by Ultraviolet Spectrophotomey. Med. Pharm. J. Chin. PLA 2010, 26, 162–164. [Google Scholar]
  18. Zhou, Q.; Fu, H.Y.; Bai, J.W.; Li, L. Determination of the Total Flavonoids in Chinese Starjasmine Stem by Spectrophotometry. Lishizhen Med. Mater. Med. Res. 2007, 18, 351–352. [Google Scholar]
  19. Liu, Y.Q.; Yu, N.J.; Yang, X.D.; Zhao, Y.M. Study on HPLC fingerprint of Trachelospermum jasminoides. China J. Chin. Mater. Med. 2009, 34, 727–730. [Google Scholar]
  20. Ferrer, I.; García-Reyes, J.F.; Mezcua, M.; Thurman, E.M.; Fernández-Alba, A.R. Multi-residue pesticide analysis in fruits and vegetables by liquid chromatography-time-of-flight mass spectrometry. J. Chromatogr. A 2005, 1082, 81–90. [Google Scholar] [CrossRef] [PubMed]
  21. Xu, S.Y.; Ye, M.L.; Xu, D.K.; Li, X.; Pan, C.S.; Zou, H.F. Matrix with high salt tolerance for the analysis of peptide and protein samples by desorption/ionization time-of-flight mass spectrometry. Anal. Chem. 2006, 78, 2593–2599. [Google Scholar] [CrossRef] [PubMed]
  22. Zhang, J.L.; Li, P.; Li, H.J.; Jiang, Y.; Ren, M.T.; Liu, Y. Development and validation of a liquid chromatography/electrospray ionization time-of-flight mass spectrometry method for relative and absolute quantification of steroidal alkaloids in Fritillaria species. J. Chromatogr. A 2008, 1177, 126–137. [Google Scholar] [CrossRef] [PubMed]
  23. Wu, H.; Guo, J.; Chen, S.; Liu, X.; Zhou, Y.; Zhang, X.; Xu, X. Recent developments in qualitative and quantitative analysis of phytochemical constituents and their metabolites using liquid chromatography-mass spectrometry. J. Pharm. Biomed. Anal. 2013, 72, 267–291. [Google Scholar] [CrossRef] [PubMed]
  24. Schmidt, T.J.; Alfermann, A.W.; Fuss, E. High-performance liquid chromatography/mass spectrometric identification of dibenzylbutyrolactone type lignans: insights into electrospray ionization tandem mass spectrometric fragmentation of lign-7-eno-9,9'-lactones and application to the lignans of Linum usitatissimum L. (Common Flax). Rapid Commun. Mass Spectrom. 2008, 22, 3642–3650. [Google Scholar] [CrossRef] [PubMed]
  25. Schmidt, T.J.; Hemmati, S.; Fuss, E.; Alfermann, A.W. A combined HPLC-UV and HPLC-MS method for the identification of lignans and its application to the lignans of Linum usitatissimum L. and L. bienne mill. Phytochem. Anal. 2006, 17, 299–311. [Google Scholar] [CrossRef] [PubMed]
  26. Jing, L.; Yu, N.J.; Zhao, Y.M.; Li, Y.S. Trace chemical constituents contained in Trachelospermum jasminoides and structure identification. China J. Chin. Mater. Med. 2012, 37, 1581–1585. [Google Scholar]
  27. Yuan, Q.S.; Yu, N.J.; Zhao, Y.M.; Xu, B.; Yao, Z.W. Chemical constituents from Trachelospermum jasminoides. Chin. Tradit. Herb. Drugs 2010, 41, 179–181. [Google Scholar]
  28. Yu, N.J.; Zhao, Y.M.; Ren, F.X. Total Lignans Extract from Caulis Trachelospermi, Its Extraction Method, and the Medicinal Usage of the Extract and Its Active Constituents. CN 200510093357.X, 26 August 2005. [Google Scholar]
  • Sample Availability: Not available.