Regulated Deficit Irrigation Alters Anthocyanins, Tannins and Sensory Properties of Cabernet Sauvignon Grapes and Wines
Abstract
:1. Introduction
2. Results and Discussion
2.1. Weather, Irrigation and Vine Canopy

| RDI Treatment | Leaf Layer Number | Sun-Exposed Clusters (%) | Shoot Number (/m) | Pruning Weight (kg/m) | Cane Weight (g) |
|---|---|---|---|---|---|
| IS † | 2.5 ± 0.2 ‡ | 45 ± 7.2 | 20 ± 0.7 a | 0.39 ± 0.02 a | 20 ± 0.8 a |
| ED | 2.6 ± 0.3 | 50 ± 9.2 | 21 ± 0.8 a | 0.38 ± 0.03 a | 18 ± 1.1 ab |
| LD | 2.7 ± 0.2 | 60 ± 6.9 | 20 ± 0.8 a | 0.41 ± 0.03 a | 20 ± 0.9 a |
| FD | 2.2 ± 0.1 | 46 ± 7.0 | 18 ± 0.7 b | 0.31 ± 0.02 b | 17 ± 0.9 b |
| Season | |||||
| 2008 | 2.6 ± 0.1 a | 51 ± 5.7 | 18 ± 0.4 b | 0.36 ± 0.01 b | 20 ± 0.5 a |
| 2009 | 2.1 ± 0.2 b | 54 ± 7.0 | 17 ± 0.7 b | 0.31 ± 0.03 b | 17 ± 1.1 b |
| 2010 | 2.6 ± 0.2 a | 46 ± 6.9 | 23 ± 0.7 a | 0.44 ± 0.03 a | 19 ± 0.9 ab |
| RDI × Season interaction | ns | ns | ns | ns | ns |
2.2. Yield Components
| RDI Treatment | Clusters/Vine | Cluster Weight (g/Cluster) | Berries/Cluster | Berry Weight (g) | Yield (t/ha) |
|---|---|---|---|---|---|
| IS † | 71 ± 3.3 | 82.1 ± 2.2 a ‡ | 87 ± 10 a | 0.94 ± 0.03 a | 8.71 ± 0.38 a |
| ED | 69 ± 3.3 | 73.2 ± 3.1 b | 87 ± 7 a | 0.83 ± 0.03 b | 7.11 ± 0.26 b |
| LD | 72 ± 3.1 | 78.6 ± 2.3 a | 85 ± 3 a | 0.91 ± 0.02 a | 8.50 ± 0.40 a |
| FD | 63 ± 3.3 | 59.8 ± 2.3 c | 74 ± 7 a | 0.80 ± 0.03 b | 5.51 ± 0.32 c |
| Season | |||||
| 2008 | 75 ± 2.2 b | 71.6 ± 1.5 b | 87 ± 2 a | 0.82 ± 0.02 b | 8.18 ± 0.25 a |
| 2009 | 82 ± 2.7 a | 58.7 ± 1.8 c | 70 ± 4 b | 0.83 ± 0.03 b | 7.47 ± 0.36 a |
| 2010 | 49 ± 2.1 c | 89.1 ± 2.2 a | 92 ± 5 a | 0.96 ± 0.02 a | 6.69 ± 0.32 b |
| RDI × Season interaction | 0.0411 | 0.0352 | 0.0064 | 0.0358 | 0.0481 |
2.3. Fruit Composition
| RDI Treatment | Soluble Solids (Brix) | Titratable Acidity (g/L) | pH |
|---|---|---|---|
| IS † | 27.4 ± 0.2 a ‡ | 5.60 ± 0.11 b | 3.74 ± 0.03 |
| ED | 26.4 ± 0.4 b | 5.34 ± 0.11 b | 3.75 ± 0.02 |
| LD | 26.4 ± 0.4 b | 5.99 ± 0.18 a | 3.68 ± 0.03 |
| FD | 26.3 ± 0.3 b | 5.36 ± 0.13 b | 3.70 ± 0.02 |
| Season | |||
| 2008 | 27.2 ± 0.2 a | 5.54 ± 0.08 | 3.74 ± 0.02 a |
| 2009 | 26.0 ± 0.4 b | 5.71 ± 0.12 | 3.76 ± 0.02 a |
| 2010 | 26.5 ± 0.2 b | 5.47 ± 0.19 | 3.64 ± 0.02 b |
| RDI × Season interaction | 0.0157 | <0.0001 | 0.0213 |
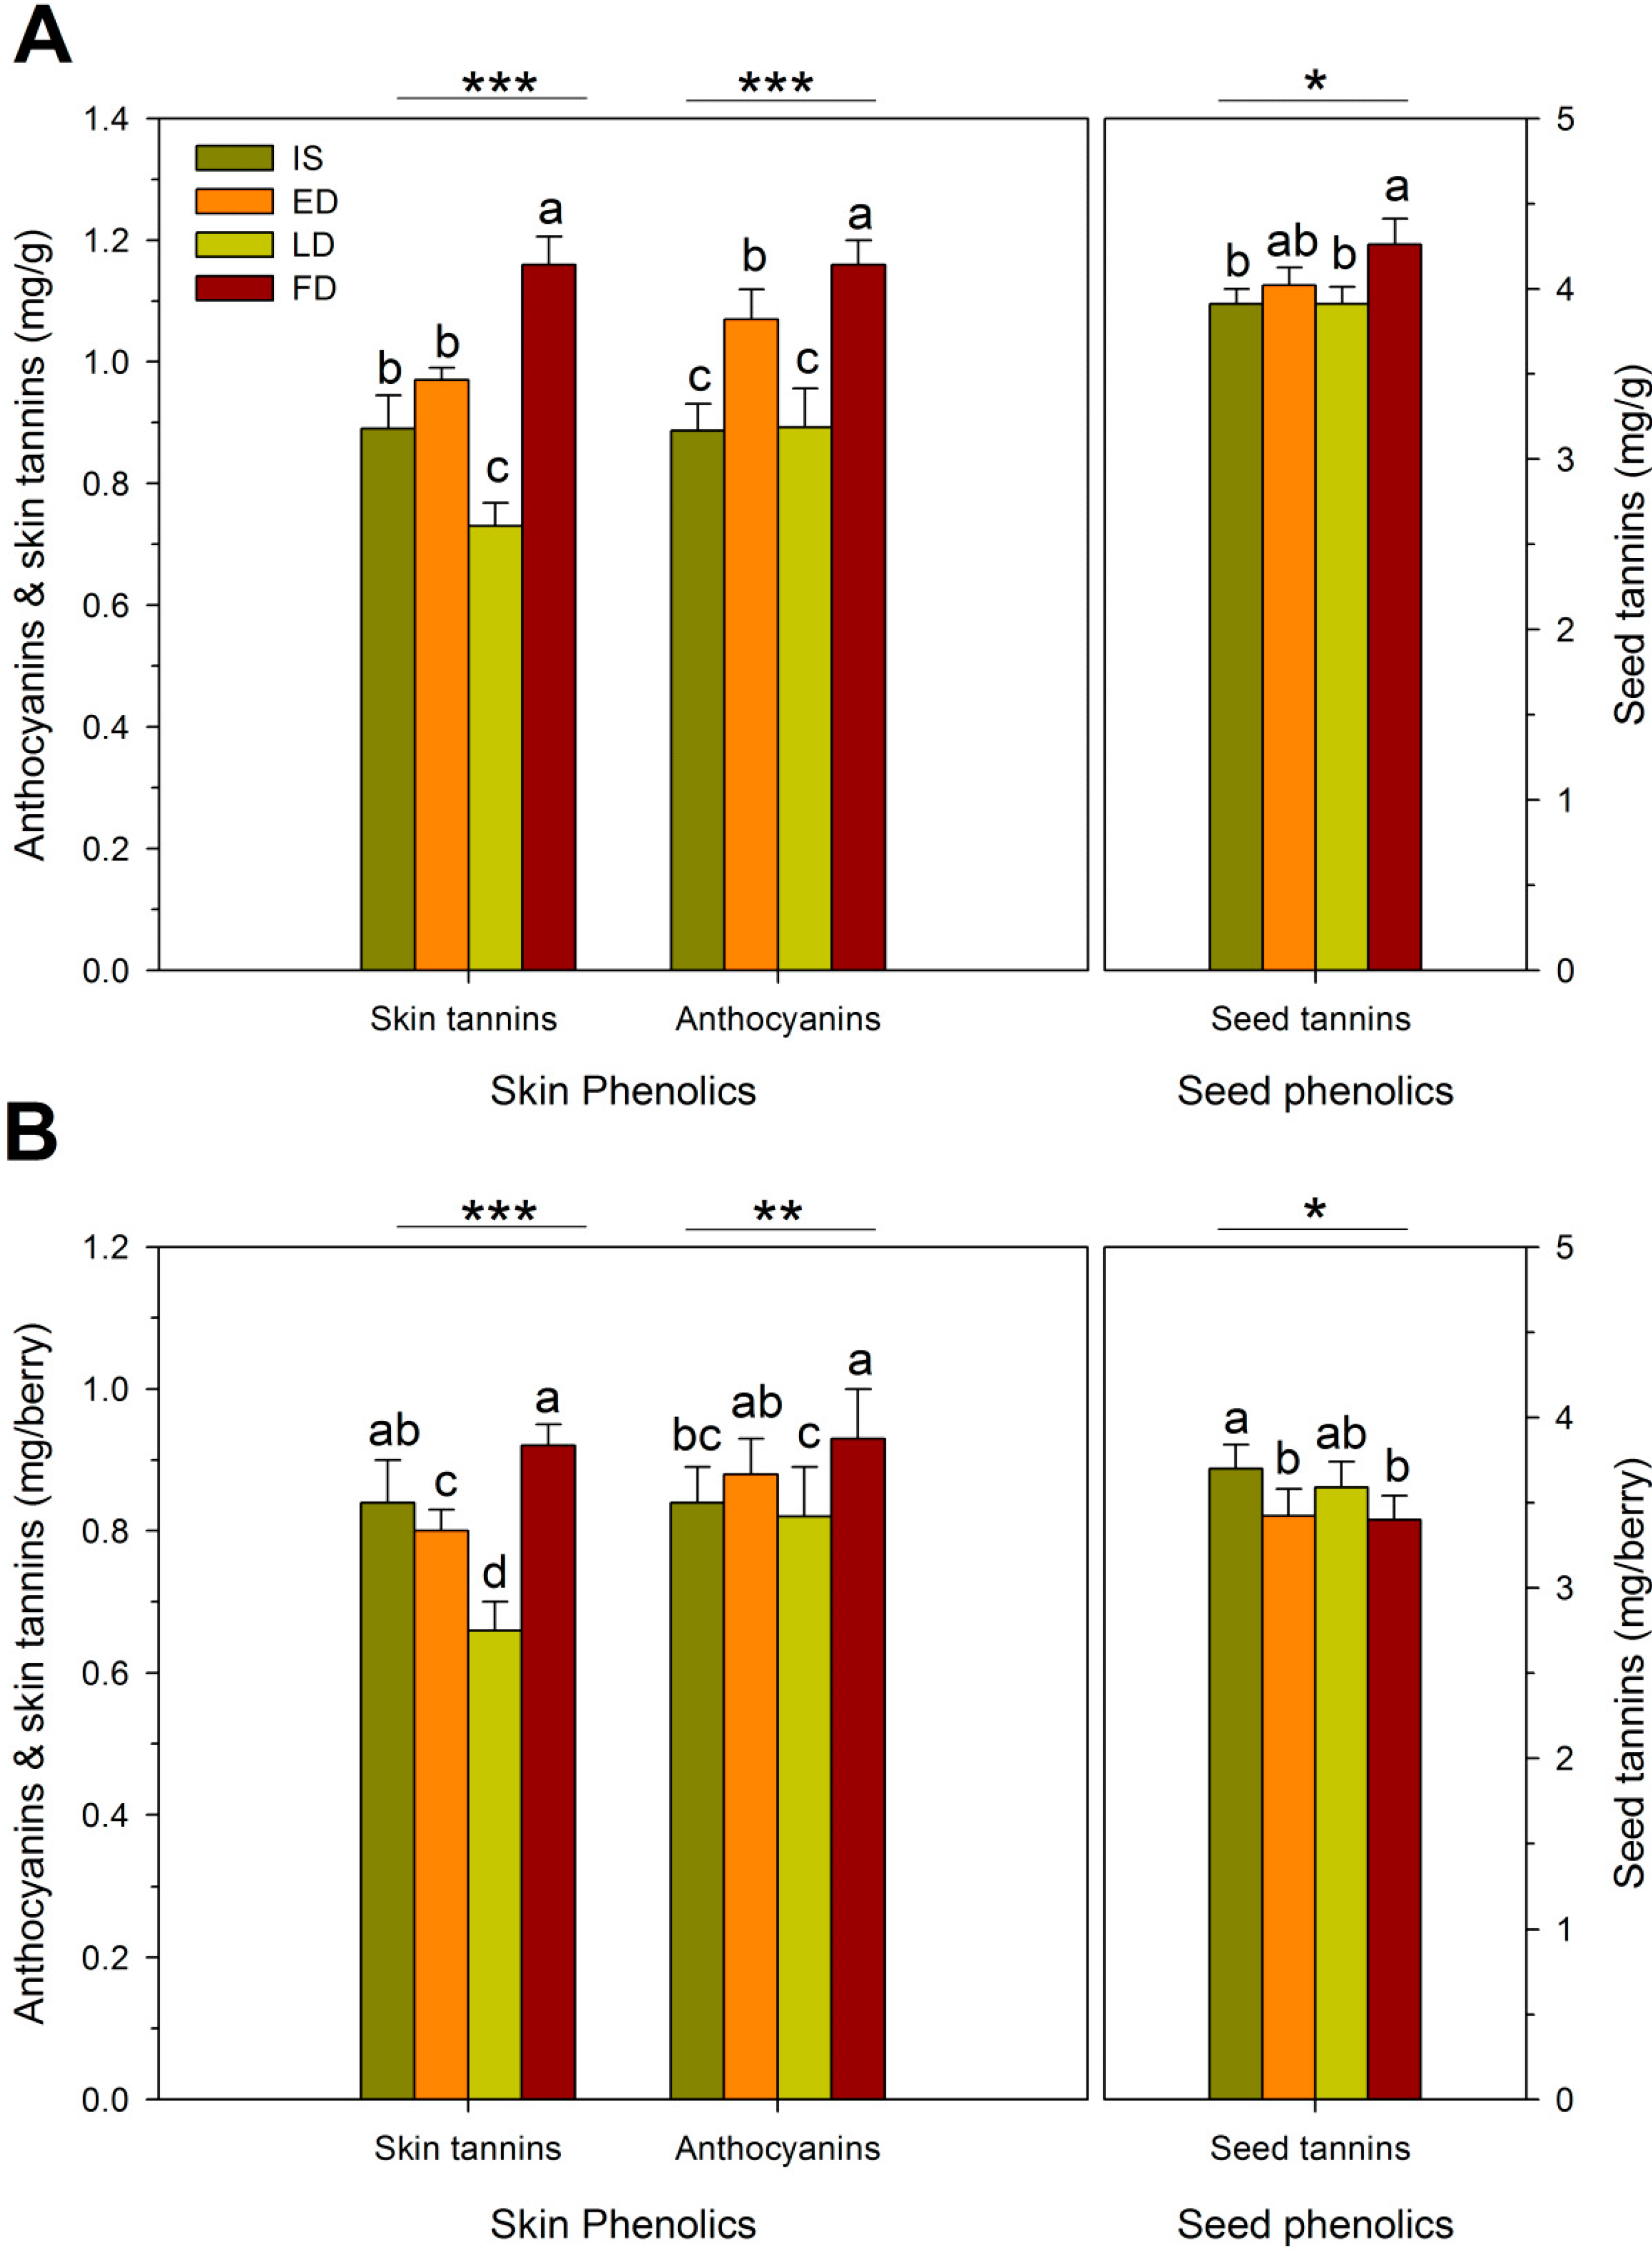

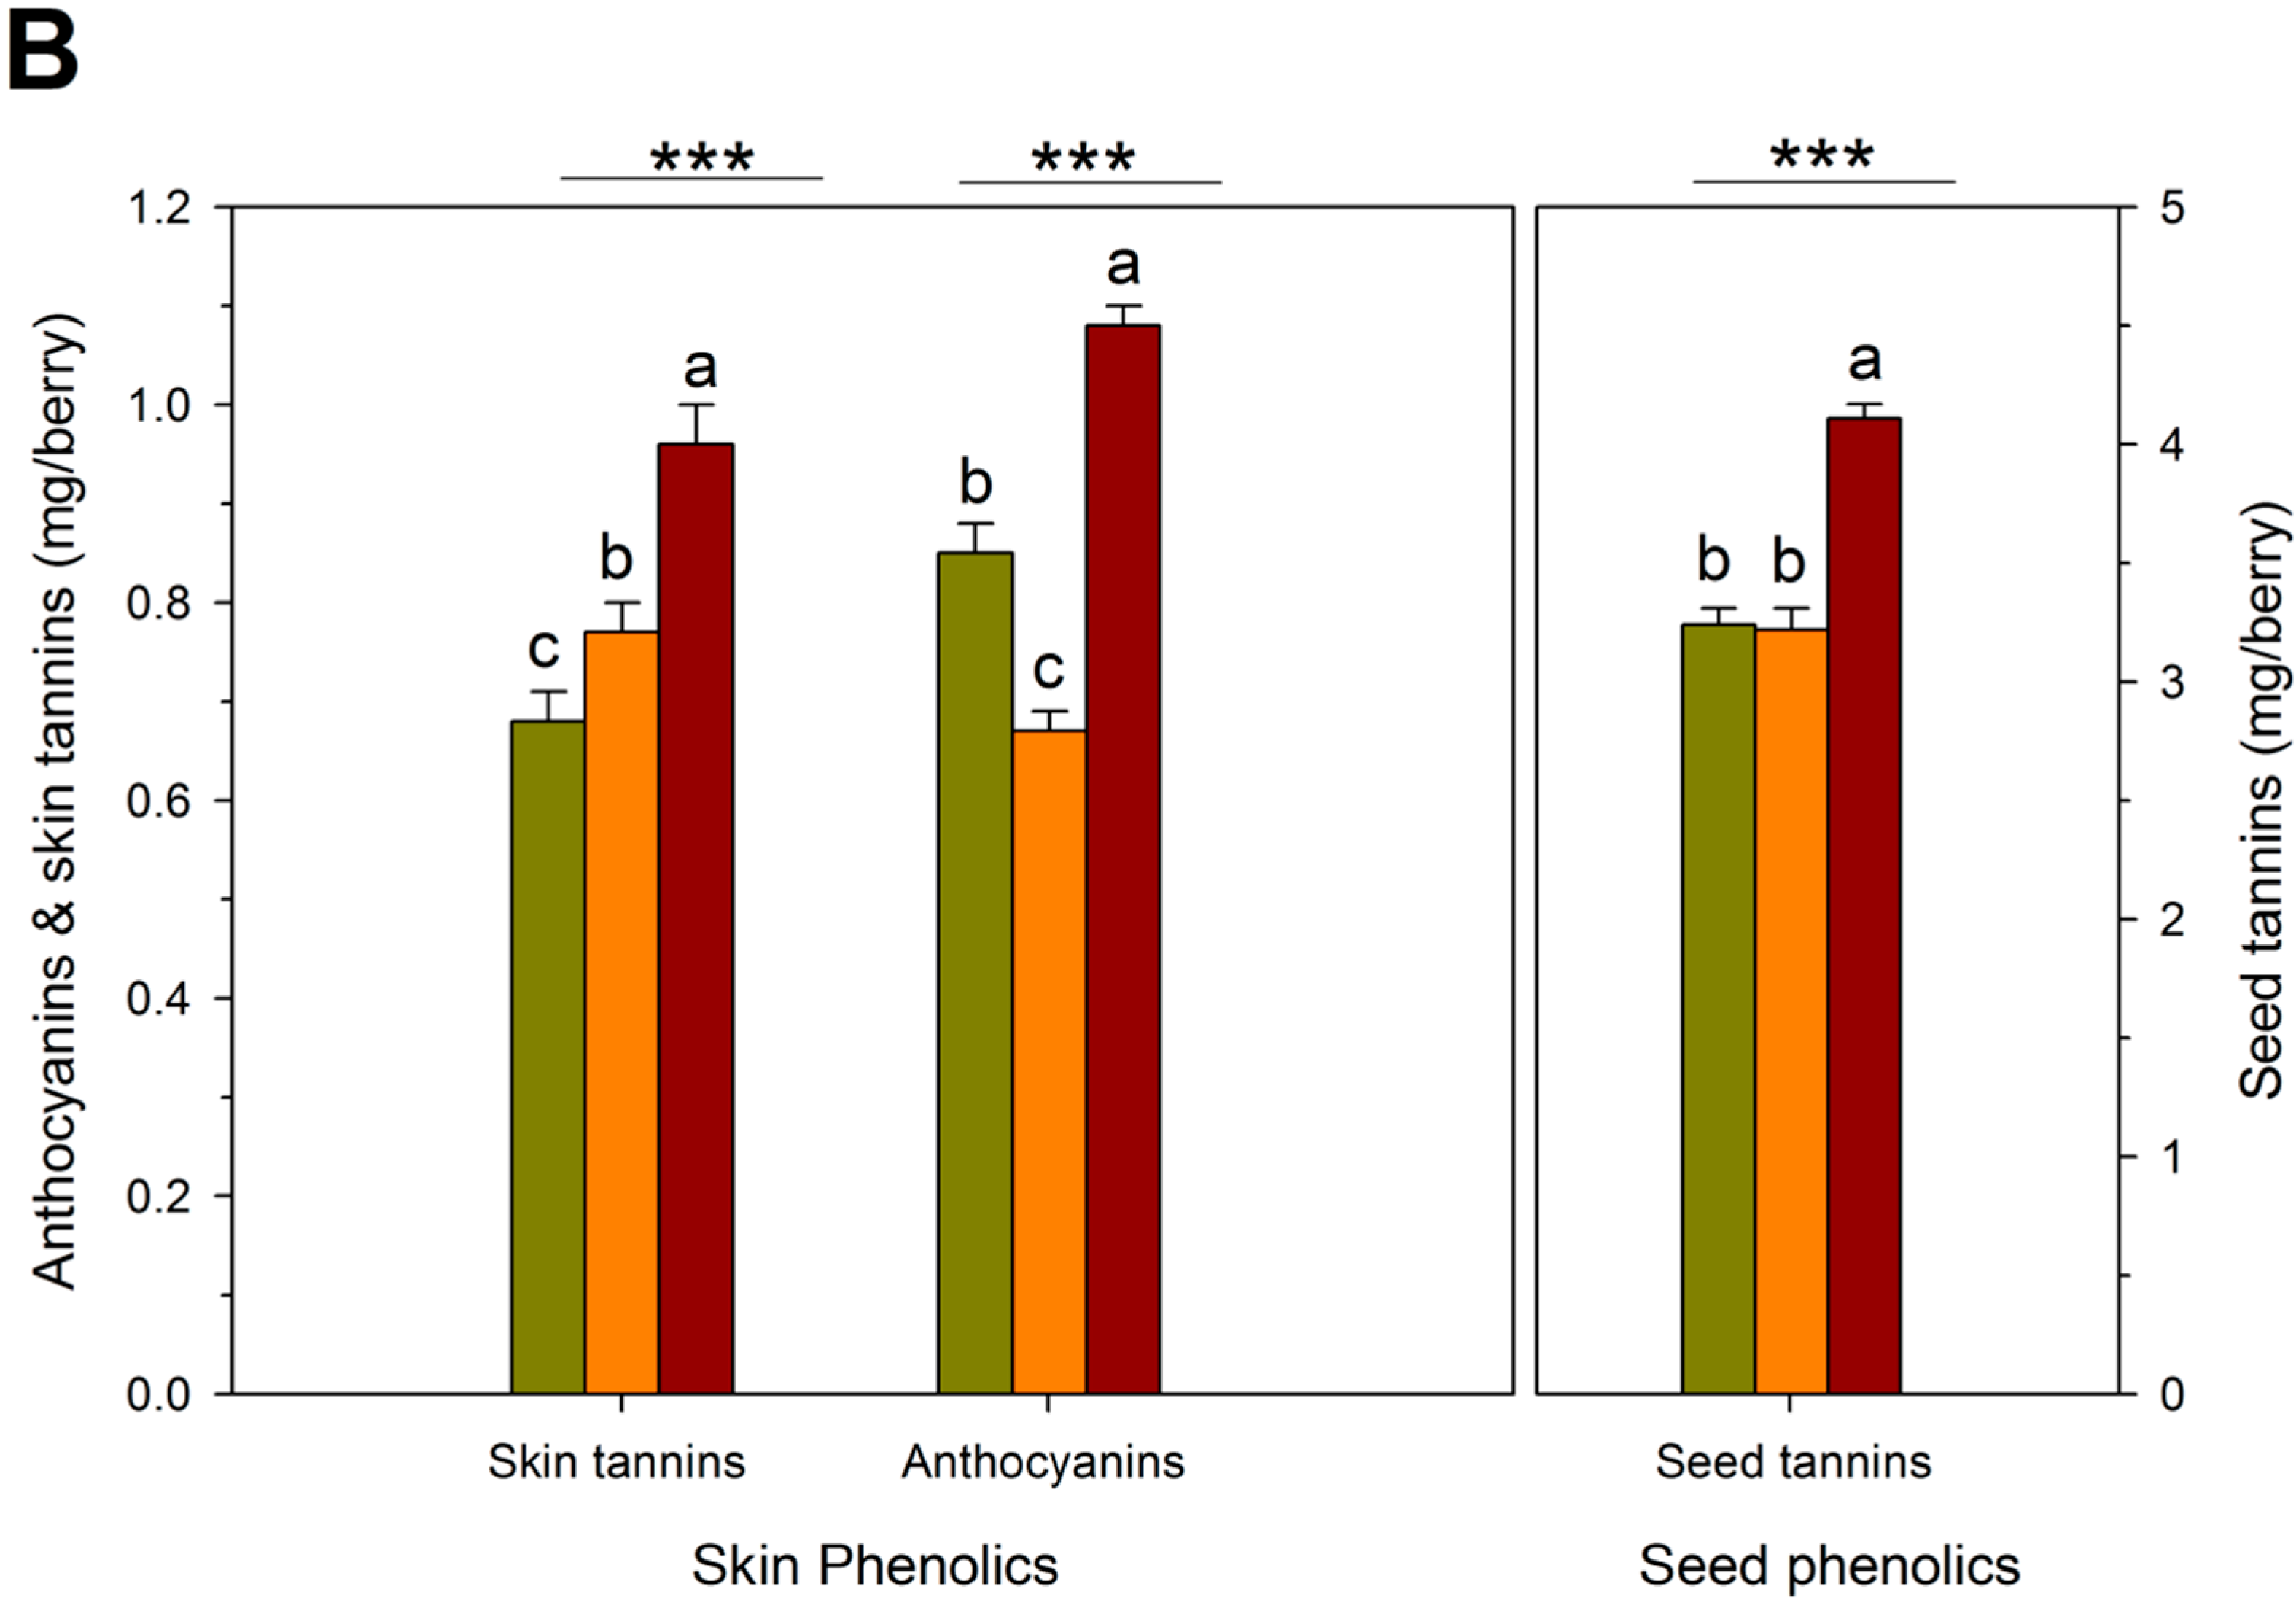
2.4. Wine Composition
| RDI Treatment | Ethanol % (v/v) | Titratable Acidity (g/L) | pH |
|---|---|---|---|
| IS † | 14.0 ± 0.2 | 5.51 ± 0.21 b | 3.82 ± 0.08 a ‡ |
| ED | 13.9 ± 0.1 | 5.67 ± 0.19 a | 3.74 ± 0.07 b |
| LD | 14.1 ± 0.1 | 5.51 ± 0.21 b | 3.76 ± 0.07 ab |
| FD | 13.9 ± 0.1 | 5.71 ± 0.18 a | 3.72 ± 0.06 b |
| Season | |||
| 2008 | 14.2 ± 0.1 a | 5.38 ± 0.04 | 3.78 ± 0.02 b |
| 2009 | 14.0 ± 0.1 a | 5.22 ± 0.09 | 3.94 ± 0.21 a |
| 2010 | 13.7 ± 0.1 b | 5.19 ± 0.03 | 3.56 ± 0.01 c |
| RDI × Season interaction | ns | ns | ns |
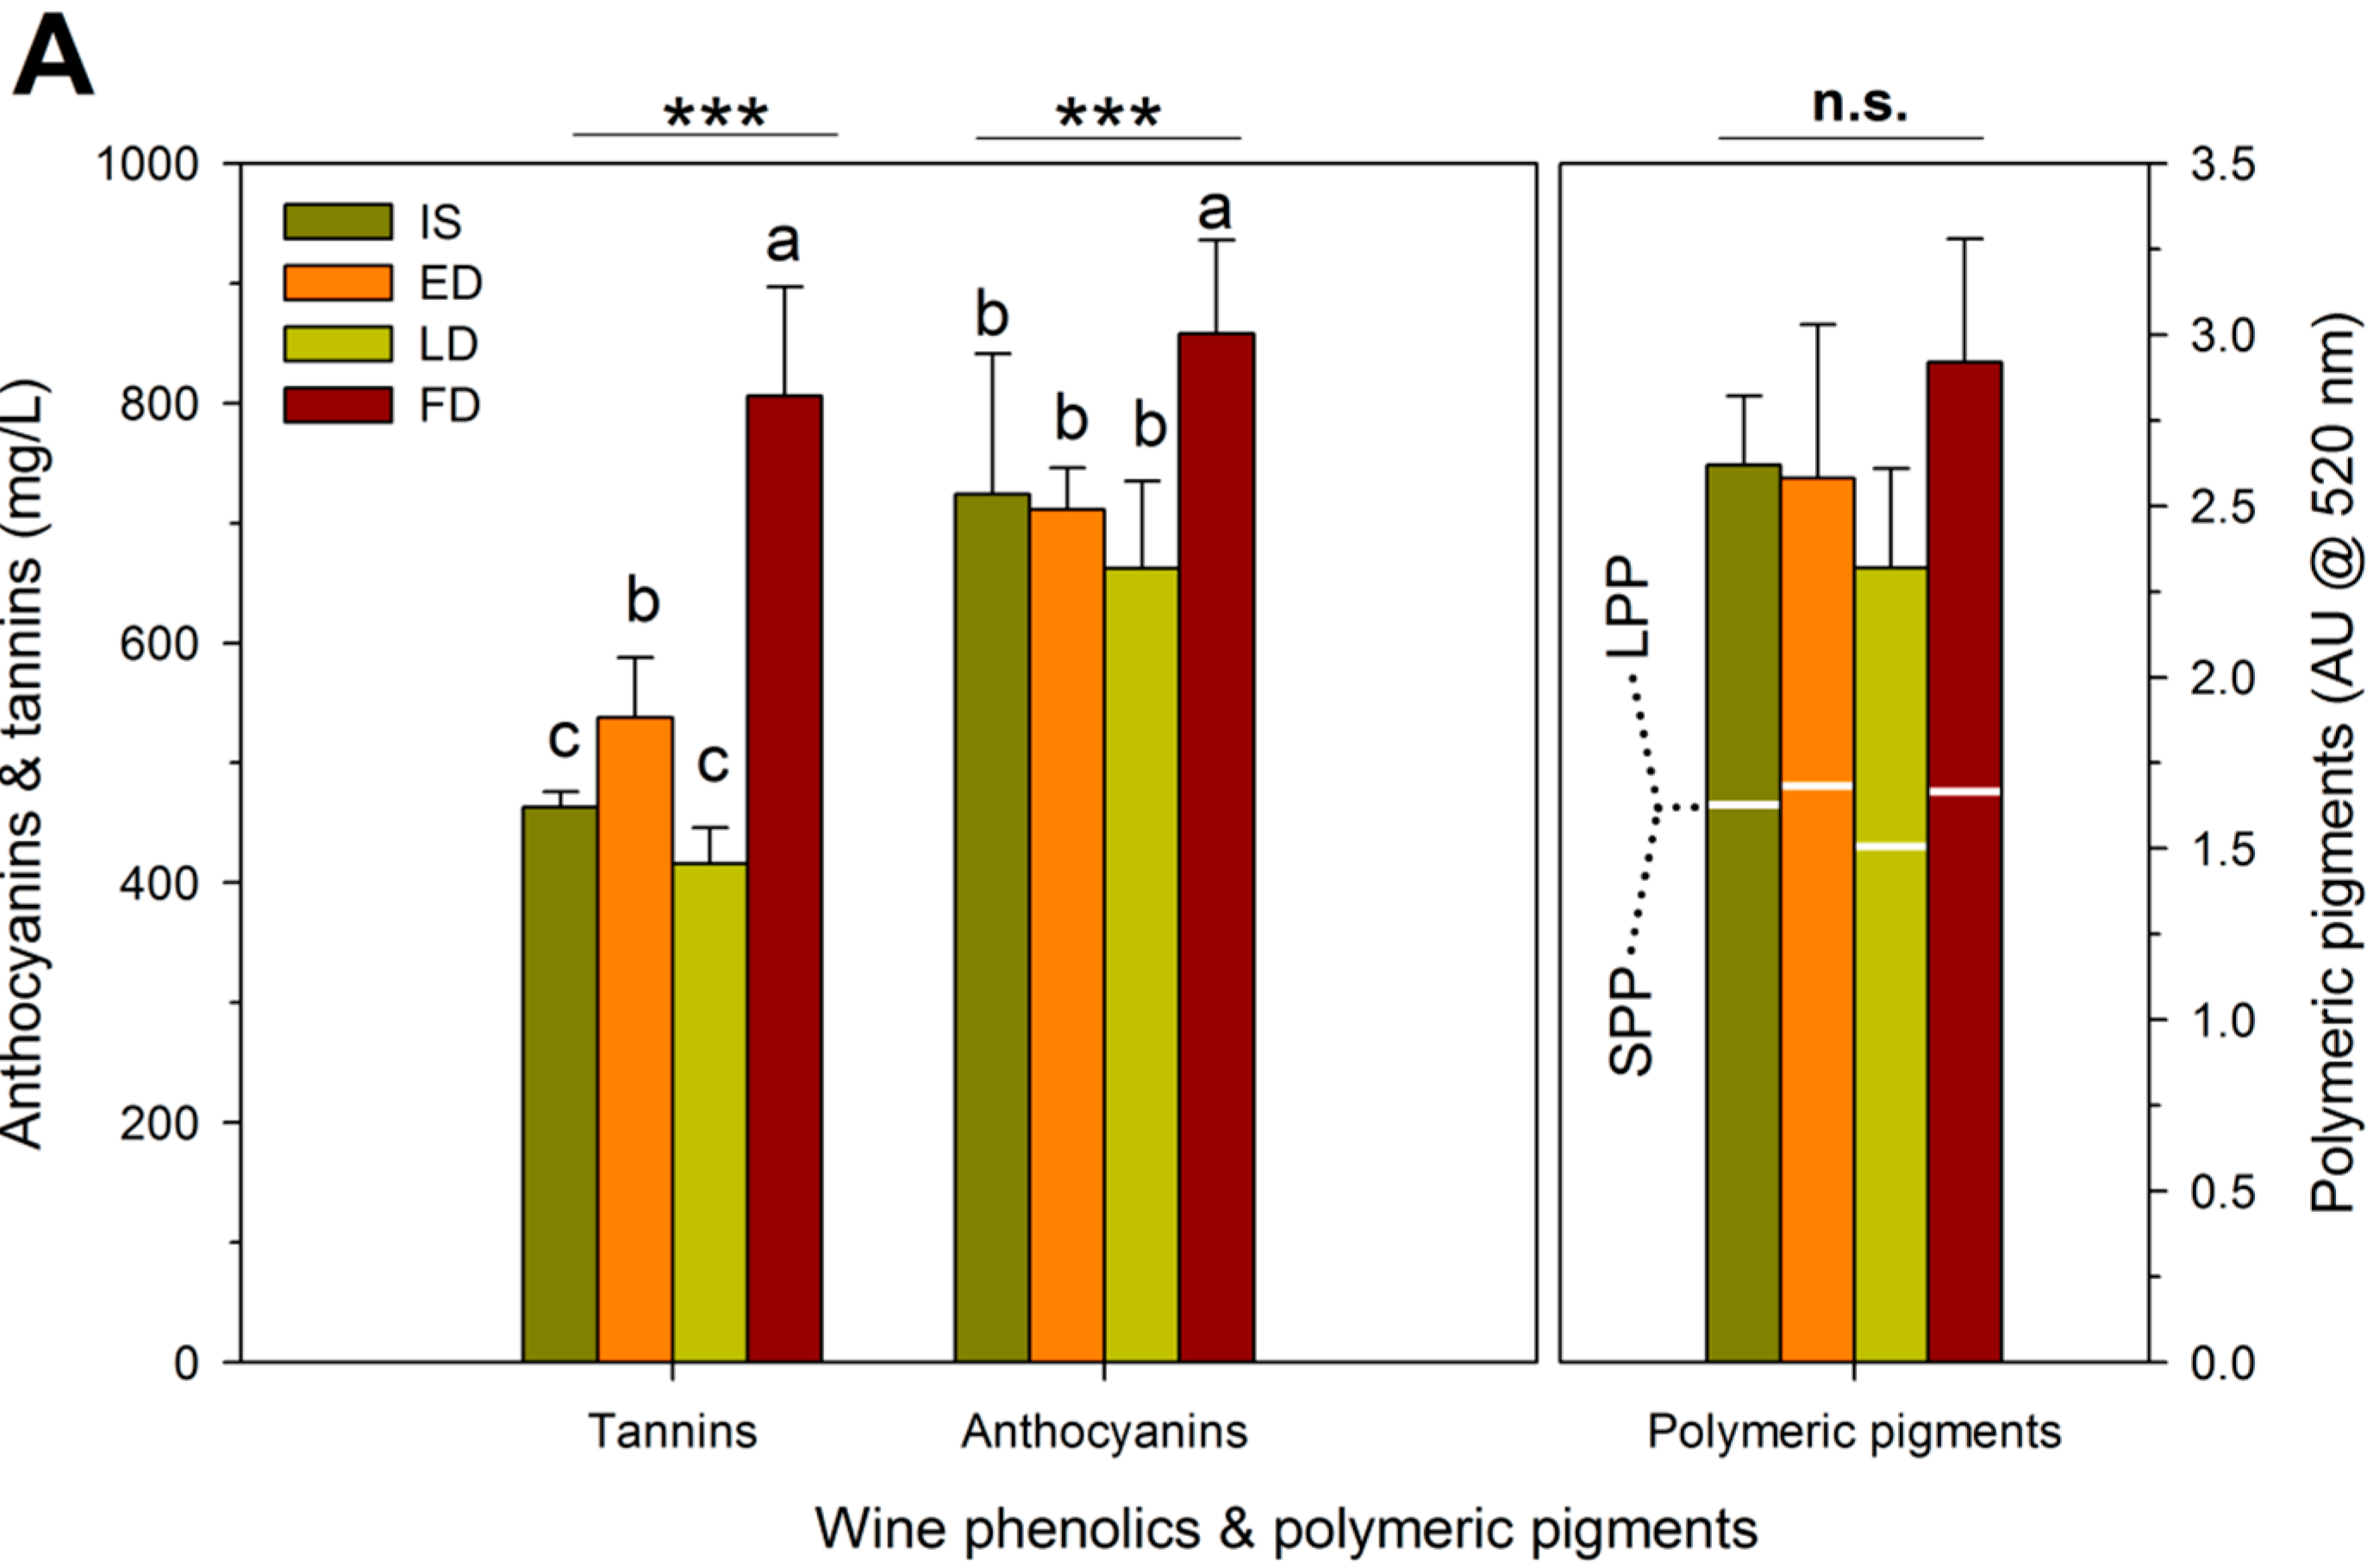
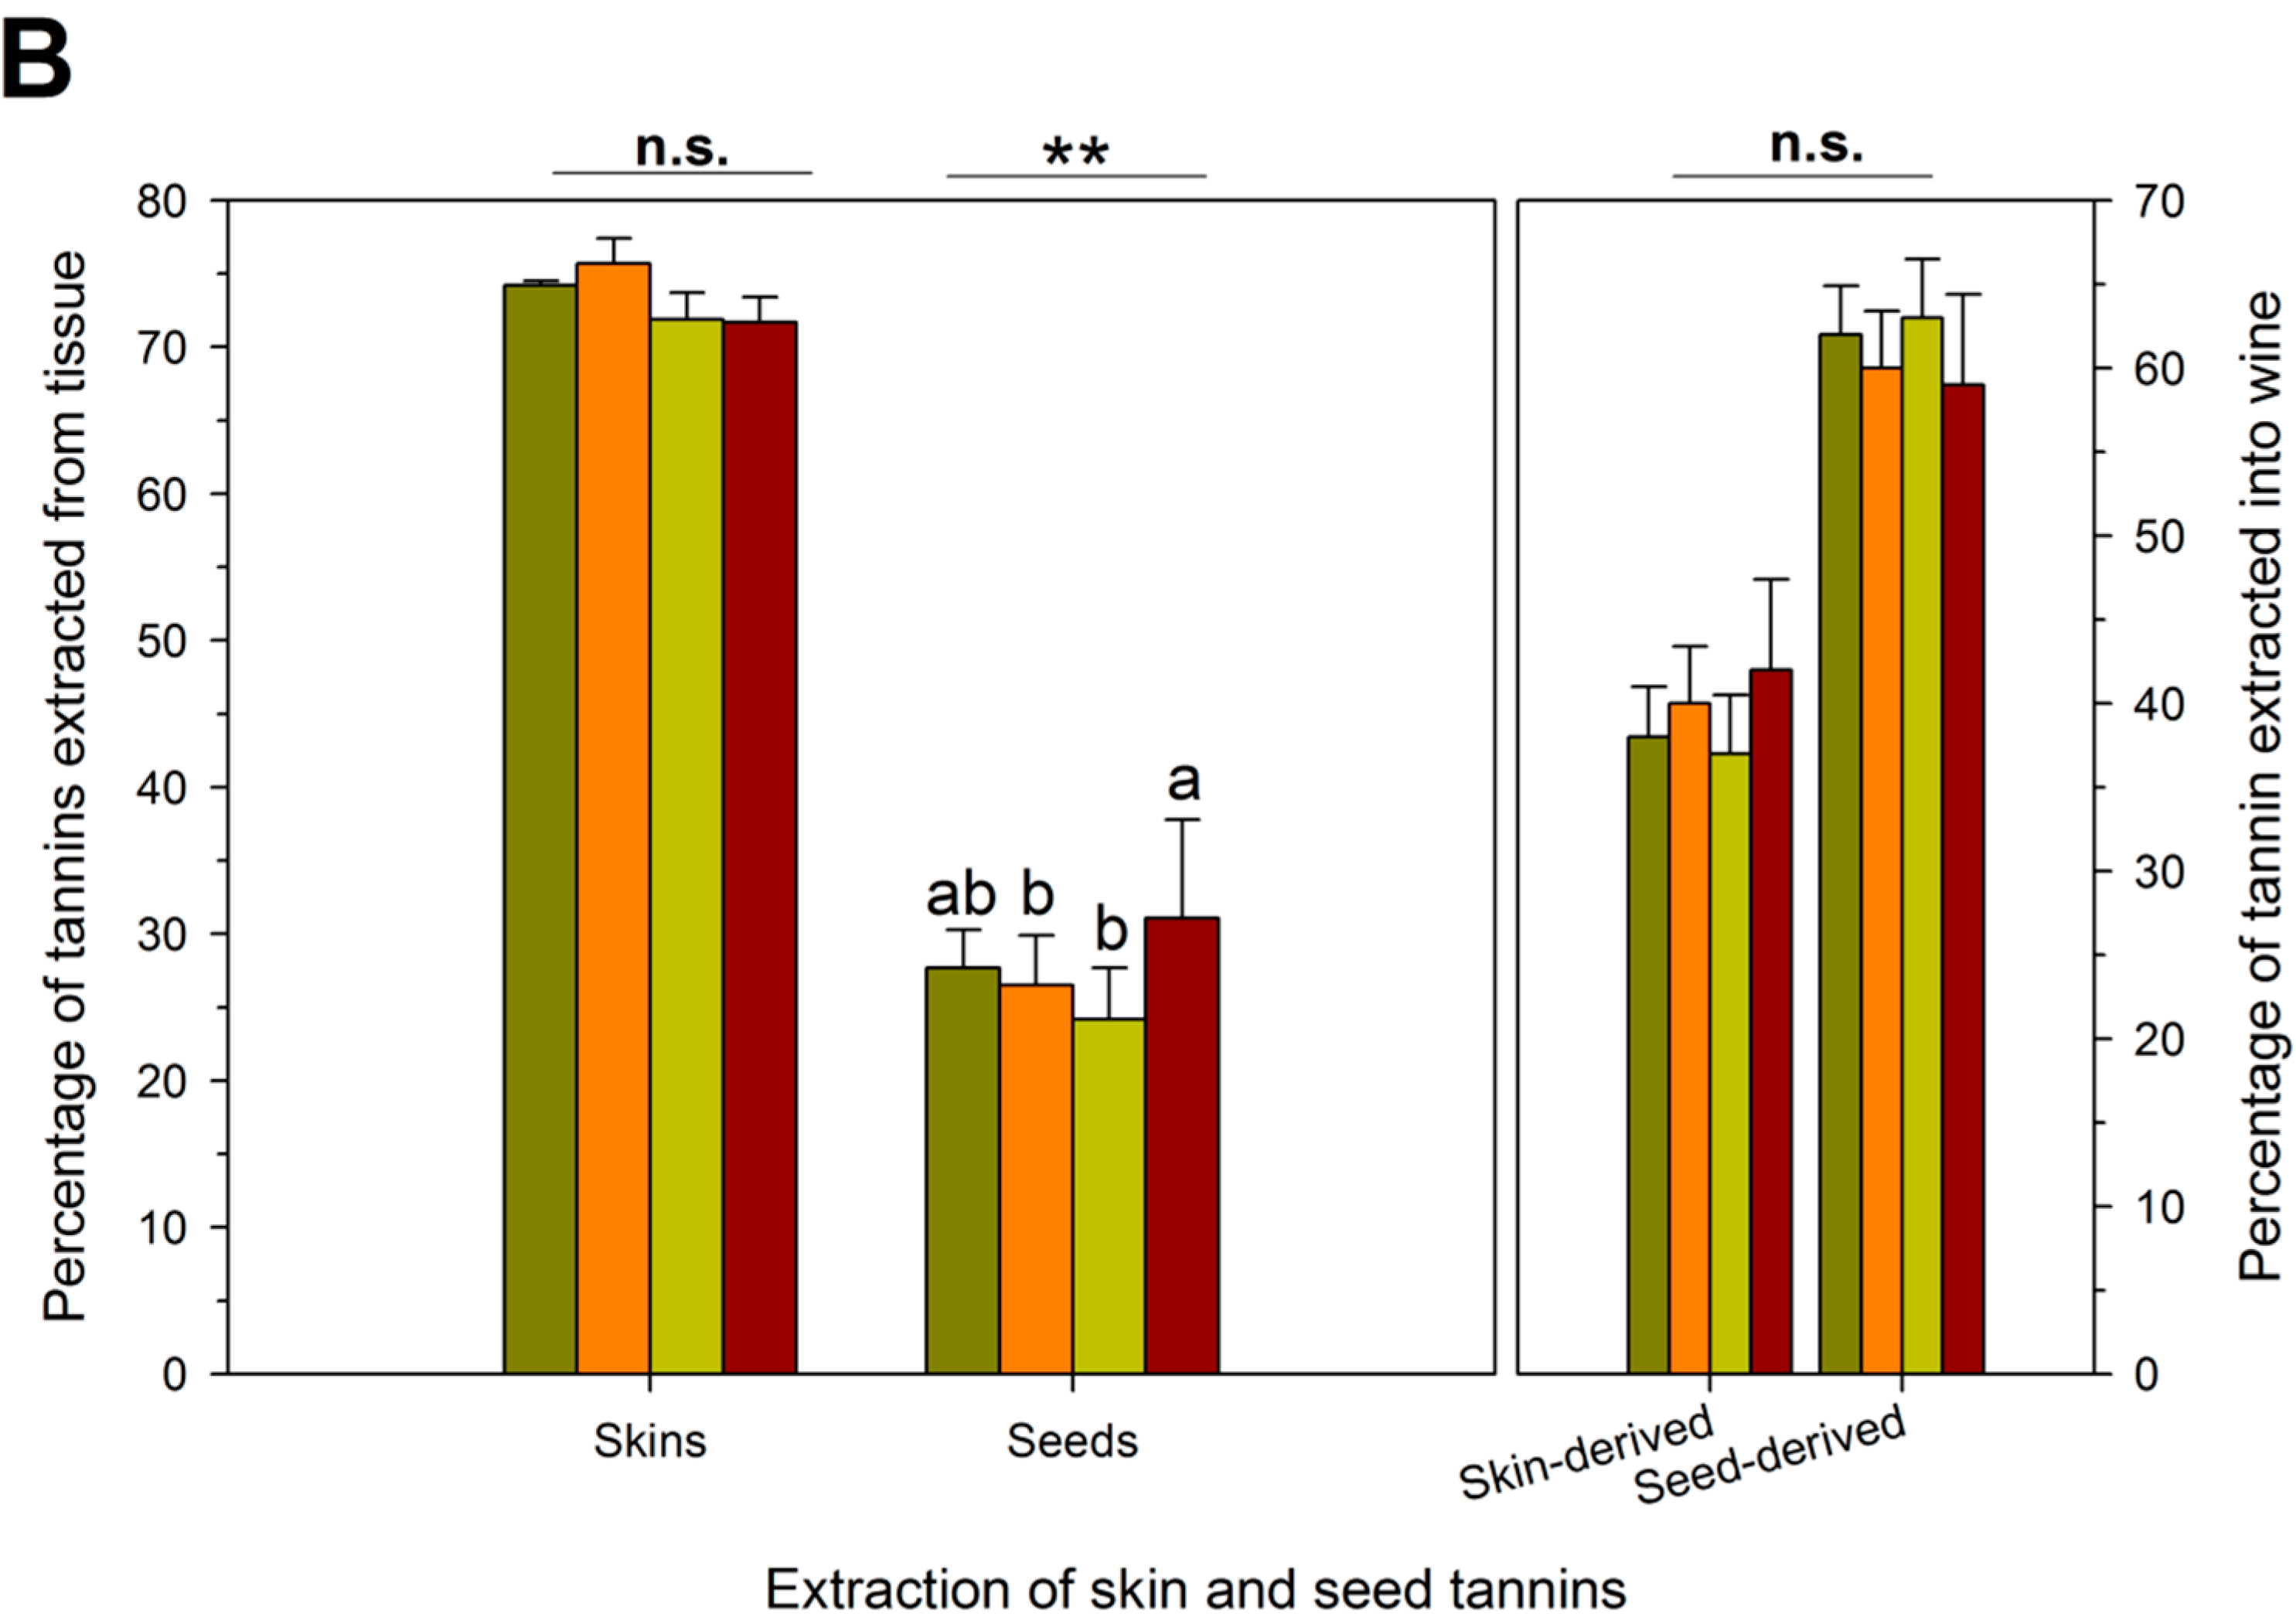
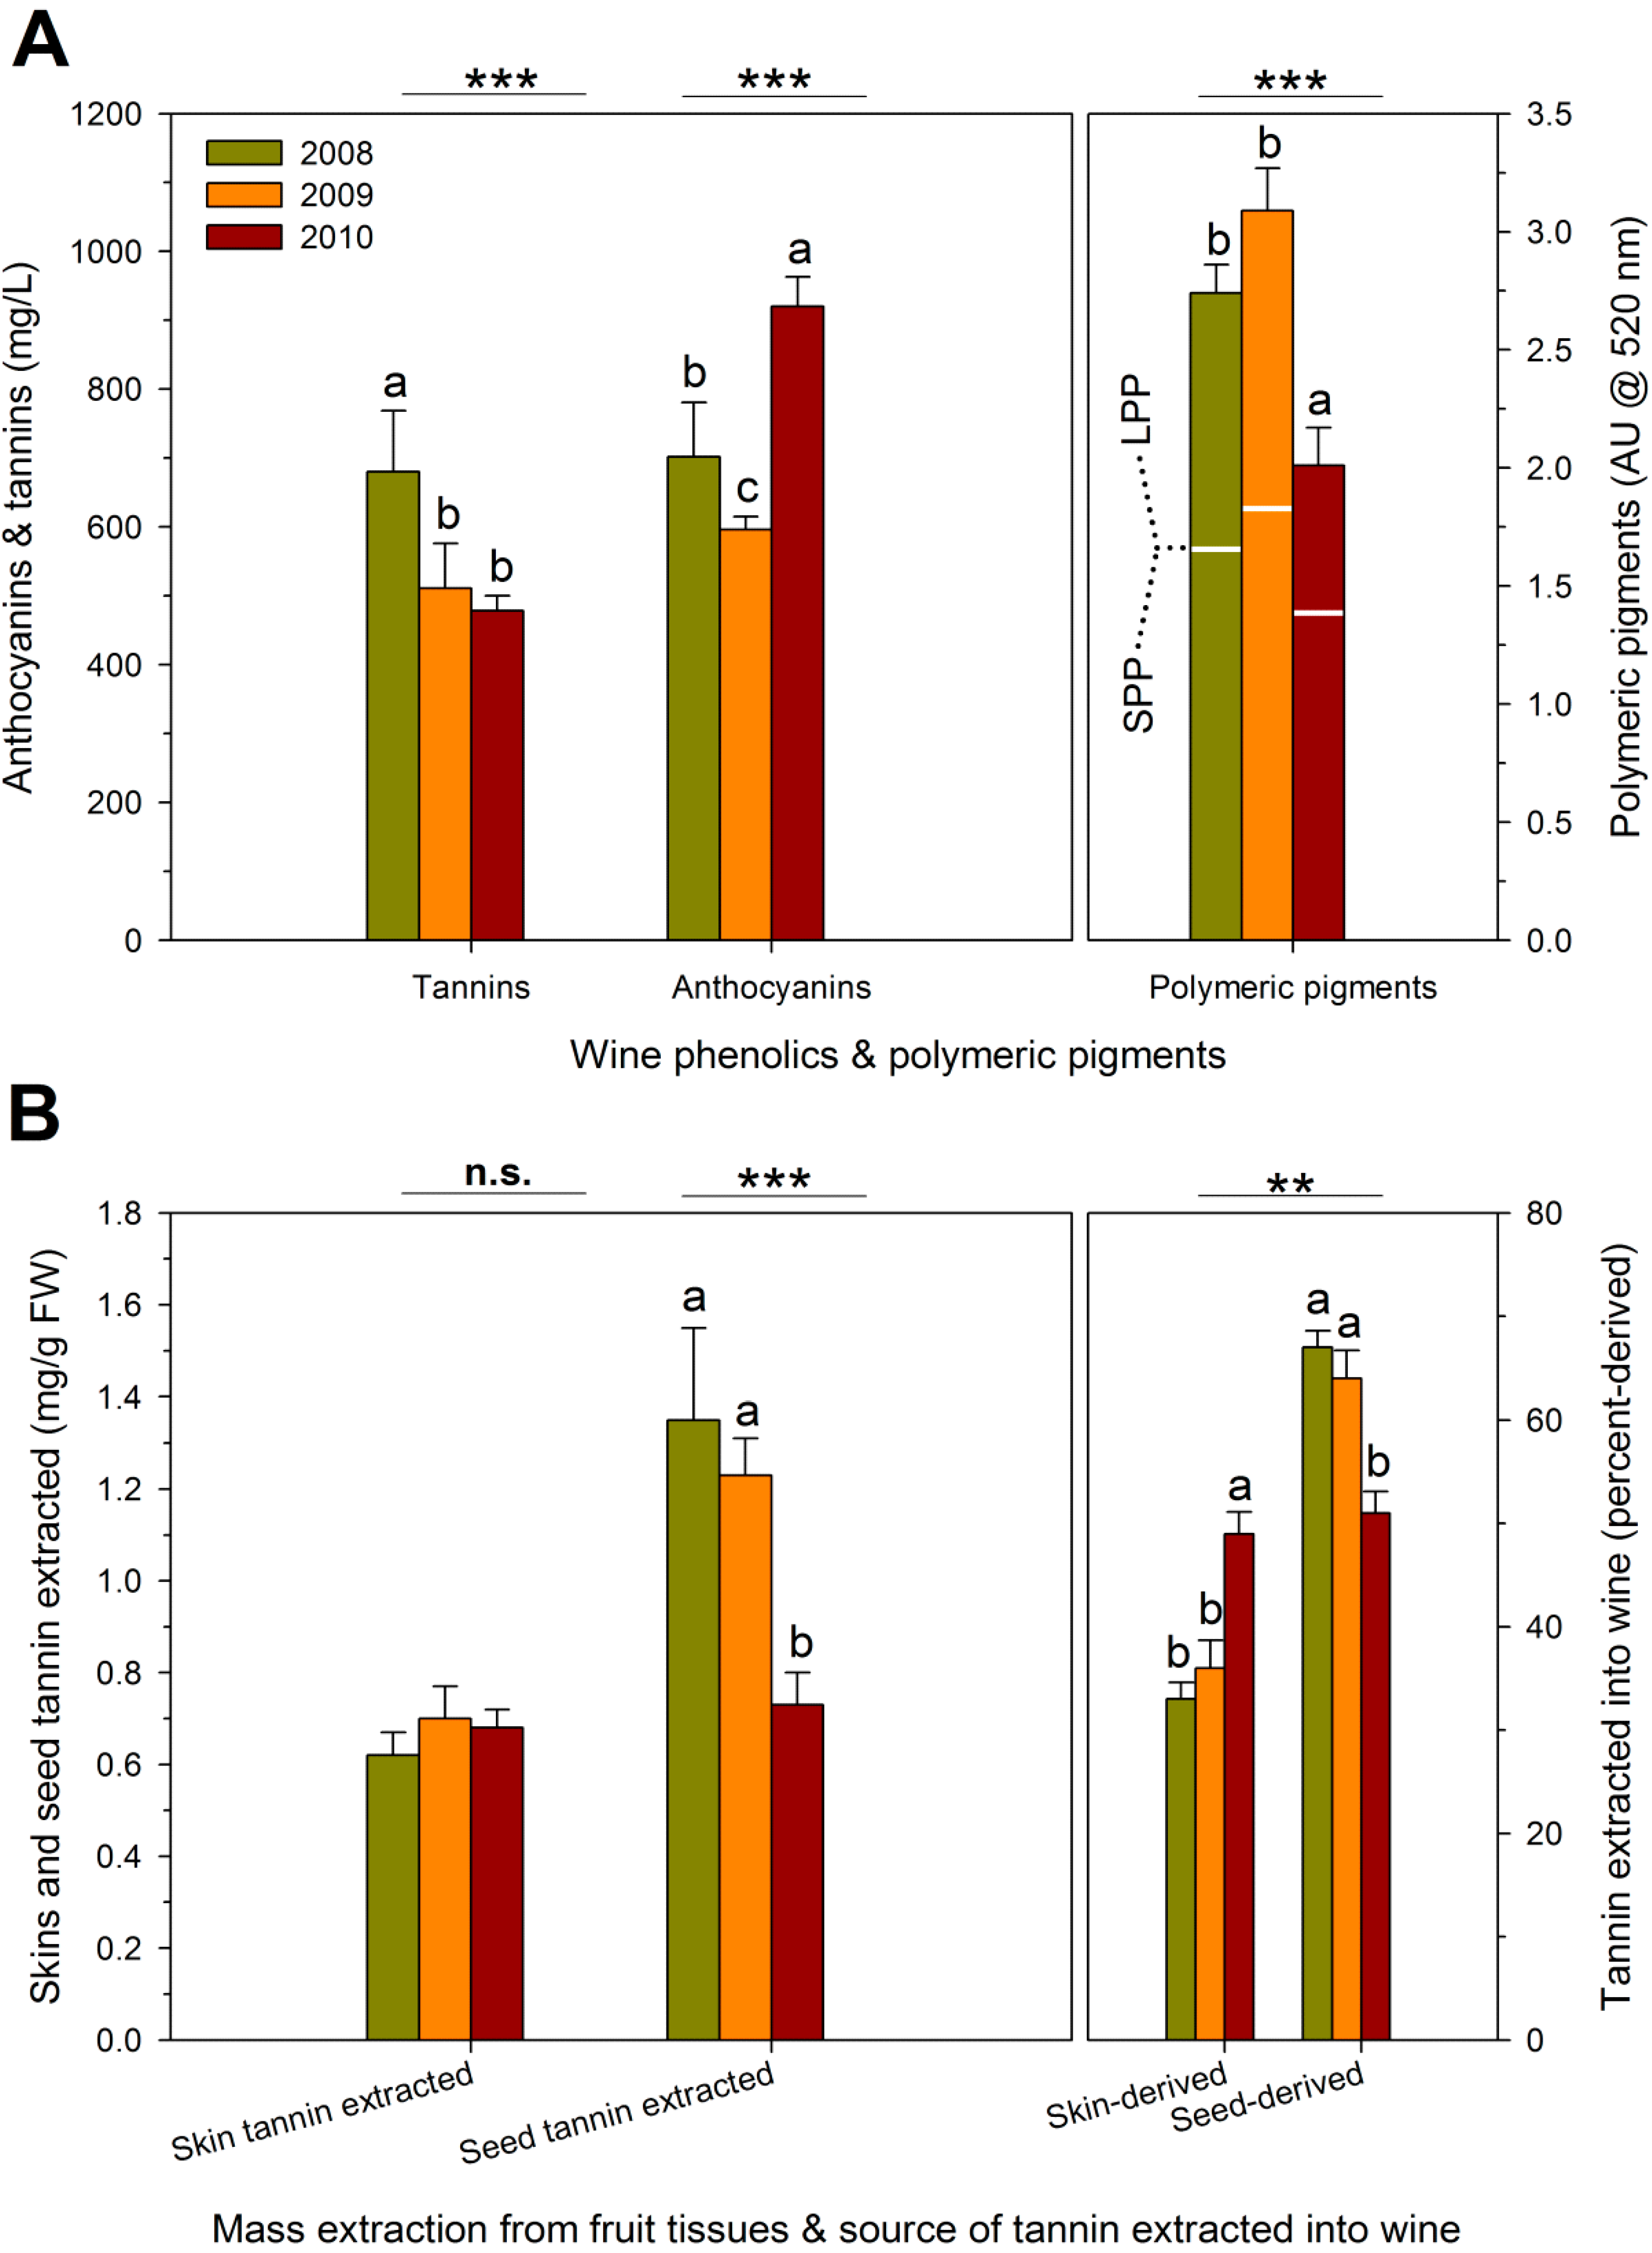
| RDI Treatment | Theoretical Extraction (mg/L) | Observed Extraction (mg/L) | Unaccounted Tannins (mg/L) | Proportion Bound Tannins (%) # |
|---|---|---|---|---|
| IS † | 1743 ± 261 b,‡ | 464 ± 15 c | 1279 ± 73 a | 27 ± 2 a |
| ED | 1747 ± 262 b | 538 ± 76 b | 1208 ± 192 a | 24 ± 4 a |
| LD | 1470 ± 222 c | 426 ± 37 c | 1044 ± 253 a | 22 ± 5 a |
| FD | 2136 ± 454 a | 806 ± 140 a | 1330 ± 318 a | 24 ± 7 a |
| Season | ||||
| 2008 | 1972 ± 356 a | 680 ± 134 a | 1292 ± 236 ab | 26 ± 4 a |
| 2009 | 1935 ± 131 a | 517 ± 94 b | 1417 ± 72 a | 29 ± 1 a |
| 2010 | 1415 ± 108 a | 478 ± 34 b | 936 ± 115 b | 17 ± 3 b |
| RDI × Season interaction | ns | ns | ns | ns |
2.5. Sensory Analysis
| RDI Treatment | Wine Attributes | ||||||
|---|---|---|---|---|---|---|---|
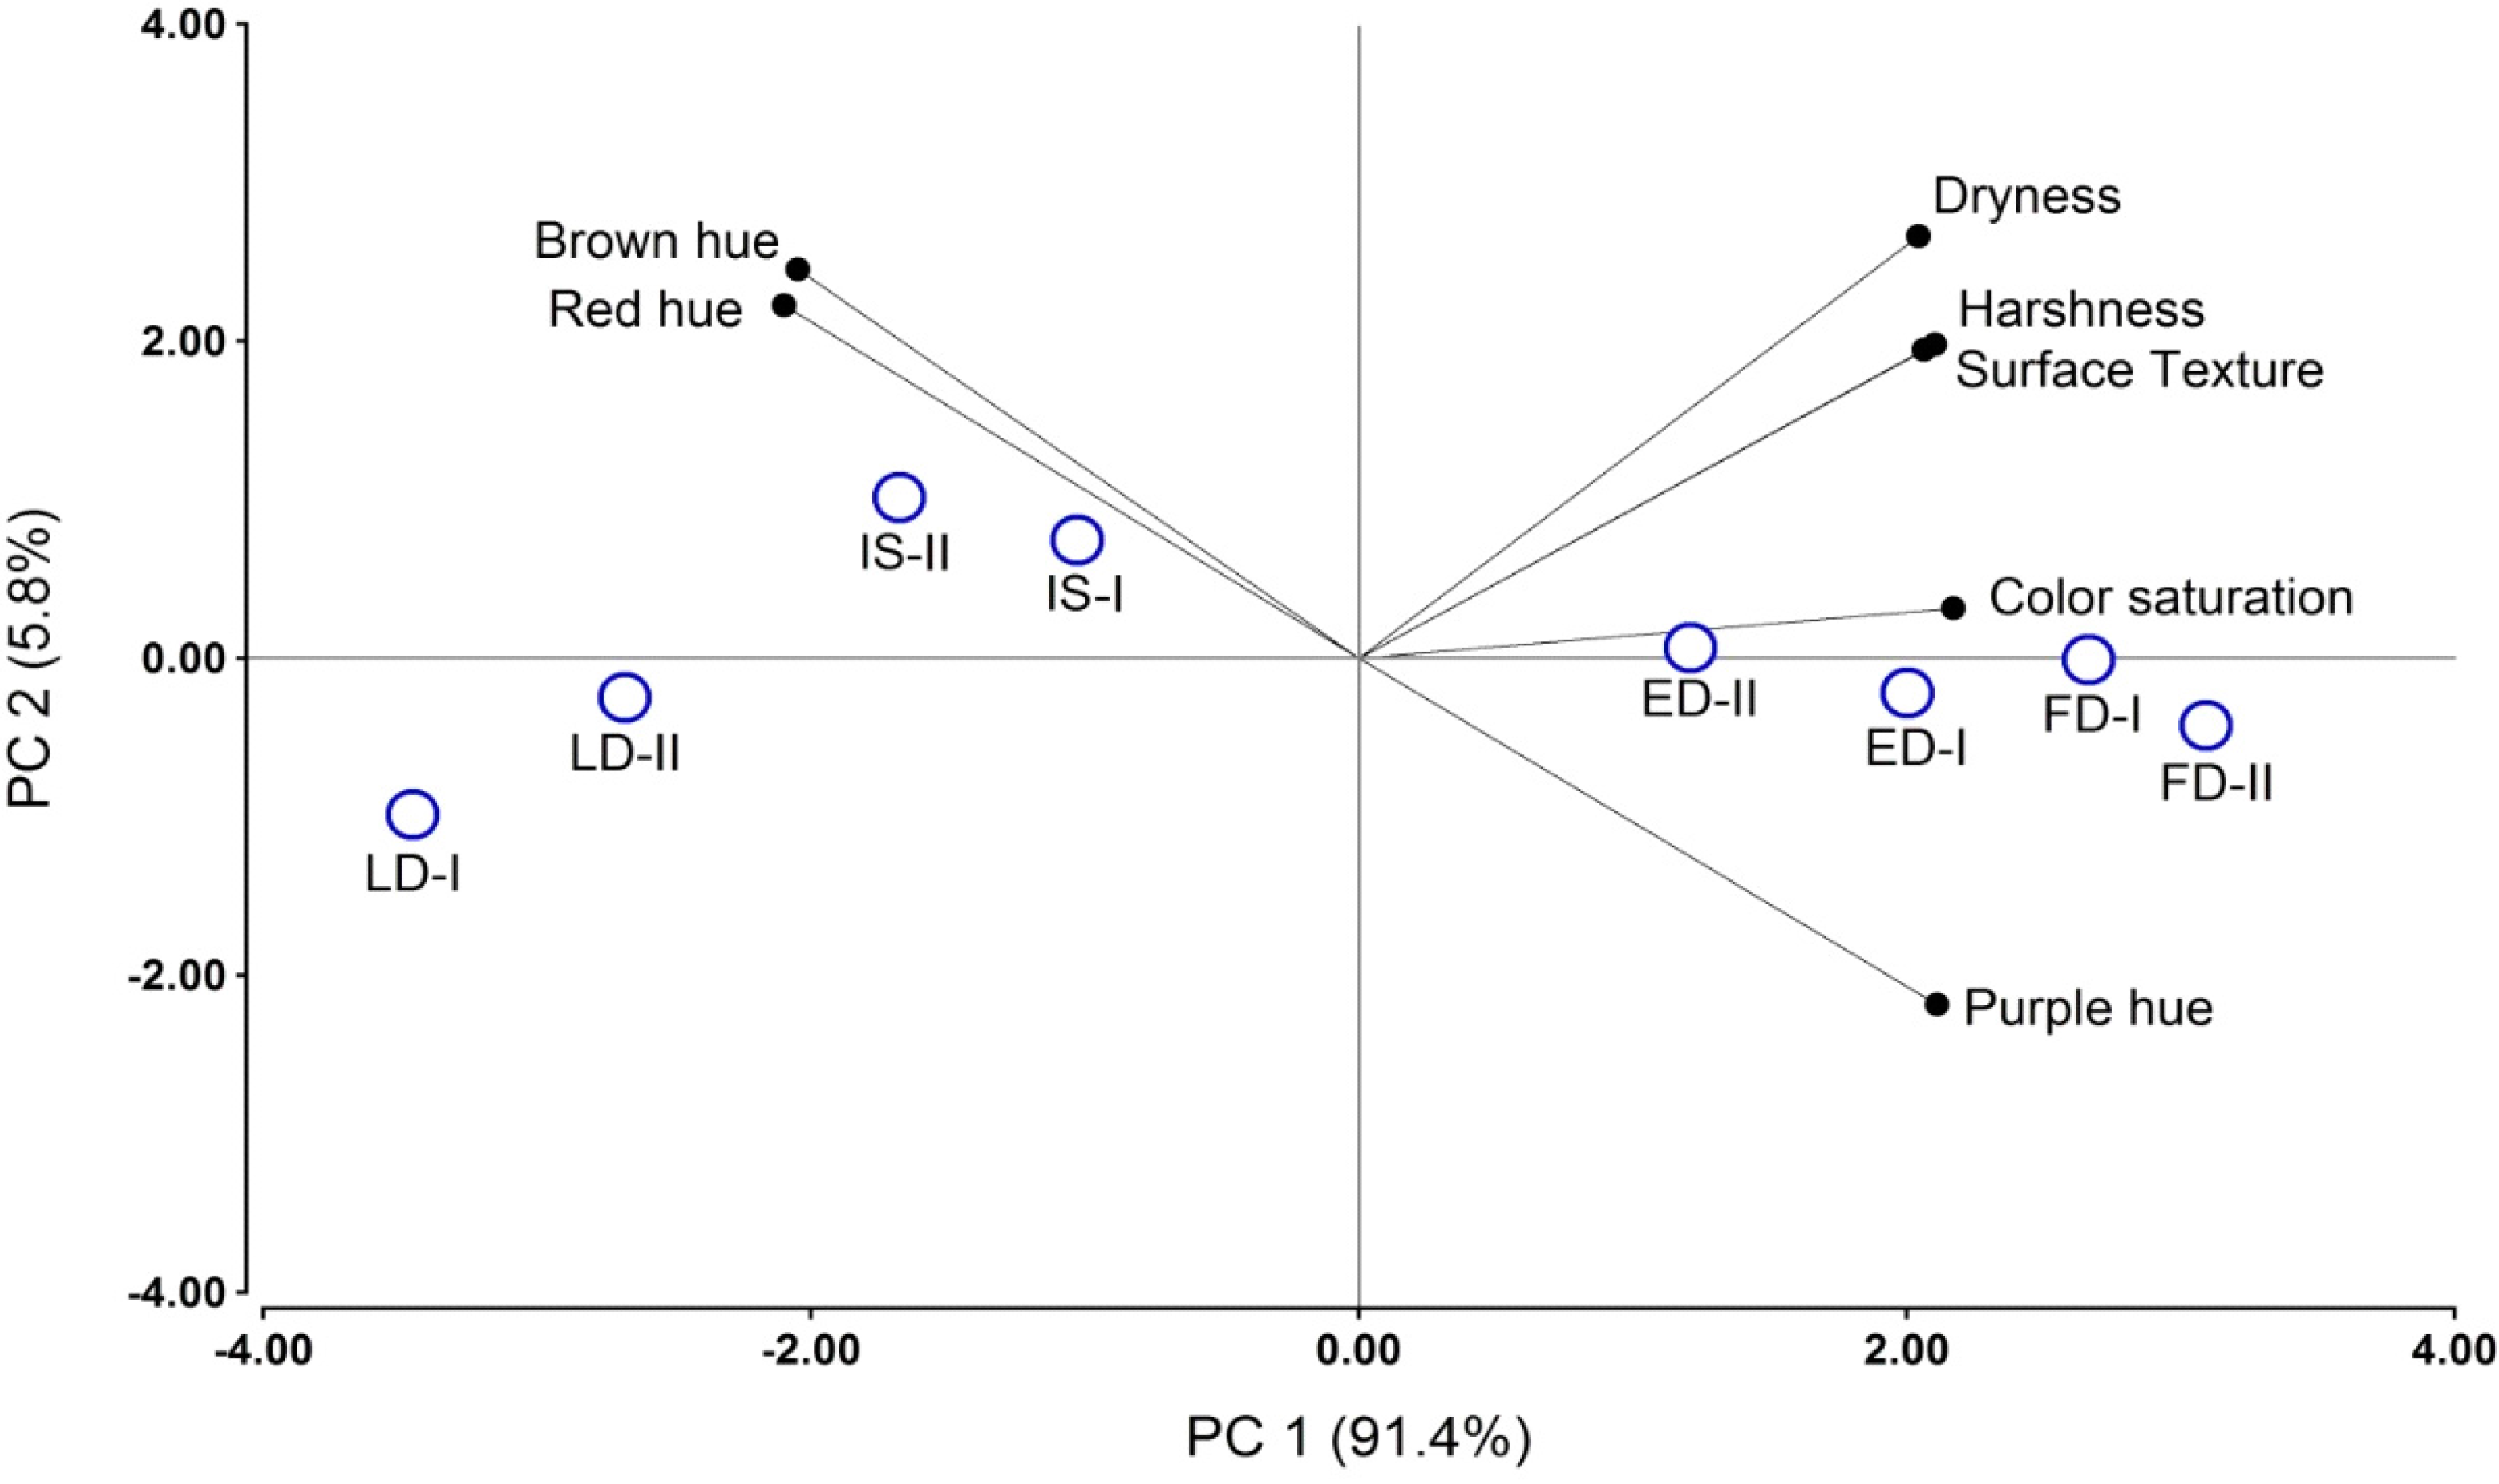
| Roughness | Dryness | Harshness | Saturation | Brown Hue | Purple Hue | Red Hue | |
| IS † | 9.6 b ‡ | 9.7 b | 9.2 b | 10.2 b | 2.2 b | 2.5 a | 11.1 b |
| ED | 10.5 bc | 10.8 bc | 10.3 bc | 11.7 c | 1.3 a | 6.6 b | 7.9 a |
| LD | 8.1 a | 7.9 a | 7.4 a | 9.1 a | 2.3 b | 2.5 a | 10.9 b |
| FD | 11.1 c | 11.1 c | 11.1 c | 12.8 d | 1.1 a | 8.2 b | 6.8 a |
3. Experimental Section
3.1. Vineyard Site and Experimental Design
3.2. Weather Data and Field Measurements
3.3. Winemaking
3.4. Chemical Analysis Reagents
3.5. Fruit, Wine and Pomace Analyses
3.6. Sensory Analysis
3.6.1. Materials
3.6.2. Selection and Training of Sensory Panelists
3.6.3. Formal Evaluation Sessions
3.7. Data Analysis
4. Conclusions
Supplementary Materials
Acknowledgments
Author Contributions
Conflicts of Interest
References
- Dry, P.R.; Loveys, B.R. Factors influencing grapevine vigour and the potential for control with partial rootzone drying. Aust. J. Grape Wine Res. 1998, 4, 140–148. [Google Scholar] [CrossRef]
- Chaves, M.M.; Zarrouk, O.; Francisco, R.; Costa, J.M.; Santos, T.; Regalado, A.P.; Rodrigues, M.L.; Lopes, C.M. Grapevine under deficit irrigation: Hints from physiological and molecular data. Ann. Bot. 2010, 105, 661–676. [Google Scholar] [CrossRef] [PubMed]
- Keller, M.; Smithyman, R.P.; Mills, L.J. Interactive effects of deficit irrigation and crop load on Cabernet Sauvignon in an arid climate. Am. J. Enol. Vitic. 2008, 59, 221–234. [Google Scholar]
- Evans, R.G.; Spayd, S.E.; Wample, R.L.; Kroeger, M.W.; Mahan, M.O. Water use of Vitis vinifera grapes in Washington. Agric. Water Manag. 1993, 23, 109–124. [Google Scholar] [CrossRef]
- Acevedo-Opazo, C.; Ortega-Farias, S.; Fuentes, S. Effects of grapevine (Vitis vinifera L.) water status on water consumption, vegetative growth and grape quality: An irrigation scheduling application to achieve regulated deficit irrigation. Agric. Water Manag. 2010, 97, 956–964. [Google Scholar] [CrossRef]
- Casassa, L.F.; Larsen, R.C.; Beaver, C.W.; Mireles, M.S.; Keller, M.; Riley, W.R.; Smithyman, R.; Harbertson, J.F. Impact of extended maceration and Regulated Deficit Irrigation (RDI) in Cabernet Sauvignon wines: Characterization of proanthocyanidin distribution, anthocyanin extraction, and chromatic properties. J. Agric. Food Chem. 2013, 61, 6446–6457. [Google Scholar] [CrossRef] [PubMed]
- Zarrouk, O.; Francisco, R.; Pinto-Marijuan, M.; Brossa, R.; Santos, R.R.; Pinheiro, C.; Costa, J.M.; Lopes, C.; Chaves, M.M. Impact of irrigation regime on berry development and flavonoids composition in Aragonez (syn. Tempranillo) grapevine. Agric. Water Manag. 2012, 114, 18–29. [Google Scholar] [CrossRef]
- Bindon, K.; Myburgh, P.; Oberholster, A.; Roux, K.; Du Toit, C. Response of grape and wine phenolic composition in Vitis vinifera L. cv. Merlot to variation in grapevine water status. S. Afr. J. Enol. Vitic. 2011, 32, 74–88. [Google Scholar]
- Kennedy, J.A.; Matthews, M.A.; Waterhouse, A.L. Effect of maturity and vine water status on grape skin and wine flavonoids. Am. J. Enol. Vitic. 2002, 53, 268–274. [Google Scholar]
- Casassa, L.F.; Larsen, R.C.; Beaver, C.W.; Mireles, M.S.; Keller, M.; Riley, W.R.; Smithyman, R.; Harbertson, J.F. Sensory impact of extended maceration and Regulated Deficit Irrigation on Washington state Cabernet Sauvignon wines. Am. J. Enol. Vitic. 2013, 64, 505–514. [Google Scholar] [CrossRef]
- Chassy, A.W.; Adams, D.O.; Laurie, V.F.; Waterhouse, A.L. Tracing phenolic biosynthesis in Vitis vinifera via in situ C-13 labeling and liquid chromatography–diode-array detector–mass spectrometer/mass spectrometer detection. Anal. Chim. Acta 2012, 747, 51–57. [Google Scholar] [CrossRef] [PubMed]
- Cohen, S.D.; Kennedy, J.A. Plant metabolism and the environment: Implications for managing phenolics. Crit. Rev. Food Sci. Nutr. 2010, 50, 620–643. [Google Scholar] [CrossRef] [PubMed]
- Castellarin, S.D.; Di Gaspero, G. Transcriptional control of anthocyanin biosynthetic genes in extreme phenotypes for berry pigmentation of naturally occurring grapevines. BMC Plant Biol. 2007, 7, 46. [Google Scholar] [CrossRef] [PubMed]
- Genebra, T.; Santos, RR.; Francisco, R.; Pinto-Marijuan, M.; Brossa, R.; Serra, A.T.; Duarte, C.M.M.; Chaves, M.M.; Zarrouk, O. Proanthocyanidin accumulation and biosynthesis are modulated by the irrigation regime in Tempranillo seeds. Int. J. Mol. Sci. 2014, 15, 11862–11877. [Google Scholar] [CrossRef] [PubMed]
- Vidal, S.; Francis, L.; Noble, A.; Kwiatkowski, M.; Cheynier, V.; Waters, E. Taste and mouth-feel properties of different types of tannin-like polyphenolic compounds and anthocyanins in wine. Anal. Chim. Acta 2004, 513, 57–65. [Google Scholar] [CrossRef]
- Kennedy, J.A.; Jones, G.P. Analysis of proanthocyanidin cleavage products following acid-catalysis in the presence of excess phloroglucinol. J. Agric. Food Chem. 2001, 49, 1740–1746. [Google Scholar] [CrossRef] [PubMed]
- Haslam, E.; Lilley, T.H.; Butler, L.G. Natural astringency in foodstuffs—A molecular interpretation. Crit. Rev. Food Sci. Nutr. 1988, 27, 1–40. [Google Scholar] [CrossRef] [PubMed]
- Arnold, R.A.; Noble, A.C. Bitterness and astringency of grape seed phenolics in a model wine solution. Am. J. Enol. Vitic. 1978, 29, 150–152. [Google Scholar]
- Somers, T.C. The polymeric nature of wine pigments. Phytochemistry 1971, 10, 2175–2186. [Google Scholar] [CrossRef]
- Santesteban, L.G.; Miranda, C.; Royo, J.B. Regulated Deficit Irrigation effects on growth, yield, grape quality and individual anthocyanin composition in Vitis vinifera L. cv. ‘Tempranillo’. Agric. Water Manag. 2011, 98, 1171–1179. [Google Scholar] [CrossRef]
- Casassa, L.F. Phenolic Management in Red Wines: Investigation of the Timing and Severity of Regulated Deficit Irrigation (RDI),Grape Maturity and Selected Maceration Conditions by HPLC-MS and Sensory Techniques. Available online: http://hdl.handle.net/2376/4793 (accessed on 10 March 2015).
- Roby, G.; Harbertson, J.F.; Adams, D.A.; Matthews, M.A. Berry size and vine water deficits as factors in winegrape composition: Anthocyanins and tannins. Aust. J. Grape Wine Res. 2004, 10, 100–107. [Google Scholar] [CrossRef]
- De Souza, C.R.; Maroco, J.P.; dos Santos, T.P.; Rodrigues, M.L.; Lopes, C.; Pereira, J.S.; Chaves, M.M. Control of stomatal aperture and carbon uptake by deficit irrigation in two grapevine cultivars. Agric. Ecosyst. Environ. 2005, 106, 261–274. [Google Scholar] [CrossRef]
- Shellie, K.C. Vine and berry response of merlot (Vitis vinifera L.) to differential water stress. Am. J. Enol. Vitic. 2006, 57, 514–518. [Google Scholar]
- Terry, D.B.; Kurtural, S.K. Achieving vine balance of Syrah with mechanical canopy management and Regulated Deficit Irrigation. Am. J. Enol. Vitic. 2011, 62, 426–437. [Google Scholar] [CrossRef]
- Keller, M. Chapter 7—Environmental constraints and stress physiology. In The Science of Grapevines; Keller, M., Ed.; Academic Press: San Diego, CA, USA, 2010; pp. 227–310. [Google Scholar]
- Matthews, M.A.; Anderson, M.M. Reproductive development in grape (Vitis vinifera L.): Responses to seasonal water deficits. Am. J. Enol. Vitic. 1989, 40, 52–60. [Google Scholar]
- Matthews, M.A.; Anderson, M.M.; Schultz, H.R. Phenologic and growth responses to early and late season water deficits in Cabernet Franc. Vitis 1987, 26, 147–160. [Google Scholar]
- Keller, M.; Mills, L.J.; Wample, R.L.; Spayd, S.E. Cluster thinning effects on three deficit-irrigated Vitis vinifera cultivars. Am. J. Enol. Vitic. 2005, 56, 91–103. [Google Scholar]
- Nuzzo, V.; Matthews, M.A. Response of fruit growth and ripening to crop level in dry-farmed Cabernet Sauvignon on four rootstocks. Am. J. Enol. Vitic. 2006, 57, 314–324. [Google Scholar]
- Shellie, K.C. Interactive effects of deficit irrigation and berry exposure aspect on Merlot and Cabernet Sauvignon in an arid climate. Am. J. Enol. Vitic. 2011, 62, 462–470. [Google Scholar] [CrossRef]
- Petrie, P.R.; Cooley, N.M.; Clingeleffer, P.R. The effect of post-veraison water deficit on yield components and maturation of irrigated Shiraz (Vitis vinifera L.) in the current and following season. Aust. J. Grape Wine Res. 2004, 10, 203–215. [Google Scholar] [CrossRef]
- Matthews, M.A.; Kriedemann, P.E. Water deficit, yield, and berry size as factors for composition and sensory attributes of red wine. In Proceedings of the Australian Society of Viticulture and Oenology ‘Finishing the Job’—Optimal Ripening of Cabernet Sauvignon and Shiraz, Adelaide, Australia, 21 July 2006; pp. 46–54.
- Matthews, M.A.; Nuzzo, V. Berry size and yield paradigms on grapes and wines quality. Acta Hortic. (ISHS) 2007, 754, 423–436. [Google Scholar]
- Koundouras, S.; Hatzidimitriou, E.; Karamolegkou, M.; Dimopoulou, E.; Kallithraka, S.; Tsialtas, J.T.; Zioziou, E.; Nikolaou, N.; Kotseridis, Y. Irrigation and rootstock effects on the phenolic concentration and aroma potential of Vitis vinifera L. cv. Cabernet Sauvignon grapes. J. Agric. Food Chem. 2009, 57, 7805–7813. [Google Scholar] [CrossRef] [PubMed]
- Holt, H.E.; Birchmore, W.; Herderich, M.J.; Iland, P.G. Berry phenolics in Cabernet Sauvignon (Vitis vinifera L.) during late-stage ripening. Am. J. Enol. Vitic. 2010, 61, 285–299. [Google Scholar]
- Bucchetti, B.; Matthews, M.A.; Falginella, L.; Peterlunger, E.; Castellarin, S.D. Effect of water deficit on Merlot grape tannins and anthocyanins across four seasons. Sci. Hortic. 2011, 128, 297–305. [Google Scholar] [CrossRef]
- Pastor del Rio, J.L.; Kennedy, J.A. Development of proanthocyanidins in Vitis vinifera L. cv. Pinot Noir grapes and extraction into wine. Am. J. Enol. Vitic. 2006, 57, 125–132. [Google Scholar]
- Roby, G.; Matthews, M.A. Relative proportions of seed, skin and flesh, in ripe berries from Cabernet Sauvignon grapevines grown in a vineyard either well irrigated or under water deficit. Aust. J. Grape Wine Res. 2004, 10, 74–82. [Google Scholar] [CrossRef]
- Castellarin, S.D.; Pfeiffer, A.; Sivilotti, P.; Degan, M.; Peterlunger, E.; Di Gaspero, G. Transcriptional regulation of anthocyanin biosynthesis in ripening fruits of grapevine under seasonal water deficit. Plant Cell Environ. 2007, 30, 1381–1399. [Google Scholar] [CrossRef] [PubMed]
- Deluc, L.; Quilici, D.; Decendit, A.; Grimplet, J.; Wheatley, M.; Schlauch, K.; Merillon, J.-M.; Cushman, J.; Cramer, G. Water deficit alters differentially metabolic pathways affecting important flavor and quality traits in grape berries of cabernet sauvignon and chardonnay. BMC Genomics 2009, 10, 212. [Google Scholar] [CrossRef] [PubMed]
- Gambetta, G.A.; Matthews, M.A.; Shaghasi, T.H.; McElrone, A.J.; Castellarin, S.D. Sugar and abscisic acid signaling orthologs are activated at the onset of ripening in grape. Planta 2010, 232, 219–234. [Google Scholar] [CrossRef] [PubMed]
- Grimplet, J.; Deluc, L.; Tillett, R.; Wheatley, M.; Schlauch, K.; Cramer, G.; Cushman, J. Tissue-specific mrna expression profiling in grape berry tissues. BMC Genomics 2007, 8, 187. [Google Scholar] [CrossRef] [PubMed]
- Mori, K.; Sugaya, S.; Gemma, H. Decreased anthocyanin biosynthesis in grape berries grown under elevated night temperature condition. Sci. Hortic. 2005, 105, 319–330. [Google Scholar] [CrossRef]
- Cohen, S.D.; Tarara, J.M.; Kennedy, J.A. Assessing the impact of temperature on grape phenolic metabolism. Anal. Chim. Acta 2008, 621, 57–67. [Google Scholar] [CrossRef] [PubMed]
- Harbertson, J.F.; Mireles, M.S.; Harwood, E.D.; Weller, K.M.; Ross, C.F. Chemical and sensory effects of saignée, water addition, and extended maceration on high brix must. Am. J. Enol. Vitic. 2009, 60, 450–460. [Google Scholar]
- Adams, D.O.; Harbertson, J.F.; Picciotto, E.A. Fractionation of red wine polymeric pigments by protein precipitation and bisulfite bleaching. In Red Wine Color; American Chemical Society: New York, NY, USA, 2004; Volume 886, pp. 275–288. [Google Scholar]
- Casassa, L.F.; Beaver, C.W.; Mireles, M.S.; Harbertson, J.F. Effect of extended maceration and ethanol concentration on the extraction and evolution of phenolics, colour components and sensory attributes of Merlot wines. Aust. J. Grape Wine Res. 2013, 19, 25–39. [Google Scholar] [CrossRef]
- Kennedy James, A.; Robinson, S.P.; Walker, M. Grape and wine tannins: Production, perfection, perception. Pract. Winery Vineyard 2007, 57–67. [Google Scholar]
- Adams, D.O.; Scholz, R.C. Tannins—The Problem of Extraction. In Proceedings of the 13th Australian Wine Industry Technical Conference, Adelaide, SA, Australia, 28 July–2 August 2007; Blair, R.J., Williams, P., Pretorius, S., Eds.; Australian Society for Viticulture and Oenology: Adelaide, SA, Australia, 2008; pp. 160–164. [Google Scholar]
- Casassa, L.F.; Beaver, C.W.; Mireles, M.; Larsen, R.C.; Hopfer, H.; Heymann, H.; Harbertson, J.F. Influence of fruit maturity, maceration length, and ethanol amount on chemical and sensory properties of Merlot wines. Am. J. Enol. Vitic. 2013, 64, 437–449. [Google Scholar] [CrossRef]
- Bindon, K.A.; Smith, P.A.; Holt, H.; Kennedy, J.A. Interaction between grape-derived proanthocyanidins and cell wall material. 2. Implications for vinification. J. Agric. Food Chem. 2010, 58, 10736–10746. [Google Scholar] [CrossRef] [PubMed]
- Le Bourvellec, C.; Bouchet, B.; Renard, C.M.G.C. Non-covalent interaction between procyanidins and apple cell wall material. Part III: Study on model polysaccharides. Biochim. Biophys. Acta (BBA) Gen. Subj. 2005, 1725, 10–18. [Google Scholar] [CrossRef]
- Casassa, L.F.; Harbertson, J.F. Extraction, evolution, and sensory impact of phenolic compounds during red wine maceration. Annu. Rev. Food Sci. Technol. 2014, 5, 83–109. [Google Scholar] [CrossRef] [PubMed]
- Hazak, J.C.; Harbertson, J.F.; Adams, D.O.; Lin, C.H.; Ro, B.H. The phenolic components of grape berries in relation to wine composition. Acta Hortic. 2005, 689, 189–196. [Google Scholar]
- Gawel, R.; Oberholster, A.; Francis, I.L. A ‘mouth-feel wheel’: Terminology for communicating the mouth-feel characteristics of red wine. Aust. J. Grape Wine Res. 2000, 6, 203–207. [Google Scholar] [CrossRef]
- Ou, C.; Du, X.; Shellie, K.; Ross, C.; Qian, M.C. Volatile compounds and sensory attributes of wine from cv. Merlot (Vitis vinifera L.) grown under differential levels of water deficit with or without a kaolin-based, foliar reflectant particle film. J. Agric. Food Chem. 2010, 58, 12890–12898. [Google Scholar] [CrossRef] [PubMed]
- Gamero, E.; Moreno, D.; Vilanova, M.; Uriarte, D.; Prieto, M.H.; Valdés, M.E. Effect of bunch thinning and water stress on chemical and sensory characteristics of Tempranillo wines. Aust. J. Grape Wine Res. 2014, 20, 394–400. [Google Scholar] [CrossRef]
- Coombe, B.G. Growth stages of the grapevine: Adoption of a system for identifying grapevine growth stages. Aust. J. Grape Wine Res. 1995, 1, 104–110. [Google Scholar] [CrossRef]
- Smart, R.; Robinson, M. Sunlight into Wine: A Handbook for Winegrape Canopy Management; Winetitles: Adelaide, SA, Australia, 1991. [Google Scholar]
- Harbertson, J.F.; Picciotto, E.A.; Adams, D.O. Measurement of polymeric pigments in grape berry extracts and wines using a protein precipitation assay combined with bisulfite bleaching. Am. J. Enol. Vitic. 2003, 54, 301–306. [Google Scholar]
- Harbertson, J.F.; Kennedy, J.A.; Adams, D.O. Tannin in skins and seeds of Cabernet Sauvignon, syrah, and Pinot Noir berries during ripening. Am. J. Enol. Vitic. 2002, 53, 54–59. [Google Scholar]
- Heredia, T.M.; Adams, D.O.; Fields, K.C.; Held, P.G.; Harbertson, J.F. Evaluation of a comprehensive red wine phenolics assay using a microplate reader. Am. J. Enol. Vitic. 2006, 57, 497–502. [Google Scholar]
- Lawless, H.T.; Heymann, H. Sensory Evaluation of Food—Principles and Practices; Springer: New York, NY, USA, 2010; p. 596. [Google Scholar]
- Tepper, B.J.; Christensen, C.M.; Cao, J. Development of brief methods to classify individuals by prop taster status. Physiol. Behav. 2001, 73, 571–577. [Google Scholar] [CrossRef] [PubMed]
- Hardy, L.H.; Rand, G.; Rittler, M.C. Tests for the detection and analysis of color-blindness. J. Opt. Soc. Am. 1945, 35, 268–271. [Google Scholar] [CrossRef]
- Tomic, O.; Luciano, G.; Nilsen, A.; Hyldig, G.; Lorensen, K.; Næs, T. Analysing sensory panel performance in a proficiency test using the panelcheck software. Eur. Food Res. Technol. 2010, 230, 497–511. [Google Scholar] [CrossRef]
- Samples Availability: Samples of the compounds are not available from the authors.
© 2015 by the authors. Licensee MDPI, Basel, Switzerland. This article is an open access article distributed under the terms and conditions of the Creative Commons Attribution license ( http://creativecommons.org/licenses/by/4.0/).
Share and Cite
Casassa, L.F.; Keller, M.; Harbertson, J.F. Regulated Deficit Irrigation Alters Anthocyanins, Tannins and Sensory Properties of Cabernet Sauvignon Grapes and Wines. Molecules 2015, 20, 7820-7844. https://doi.org/10.3390/molecules20057820
Casassa LF, Keller M, Harbertson JF. Regulated Deficit Irrigation Alters Anthocyanins, Tannins and Sensory Properties of Cabernet Sauvignon Grapes and Wines. Molecules. 2015; 20(5):7820-7844. https://doi.org/10.3390/molecules20057820
Chicago/Turabian StyleCasassa, Luis Federico, Markus Keller, and James F. Harbertson. 2015. "Regulated Deficit Irrigation Alters Anthocyanins, Tannins and Sensory Properties of Cabernet Sauvignon Grapes and Wines" Molecules 20, no. 5: 7820-7844. https://doi.org/10.3390/molecules20057820
APA StyleCasassa, L. F., Keller, M., & Harbertson, J. F. (2015). Regulated Deficit Irrigation Alters Anthocyanins, Tannins and Sensory Properties of Cabernet Sauvignon Grapes and Wines. Molecules, 20(5), 7820-7844. https://doi.org/10.3390/molecules20057820


