
Proteomic Analysis of Polysaccharide-Milk Protein Interactions Induced by Chitosan


Abstract
:1. Introduction
2. Results and Discussion
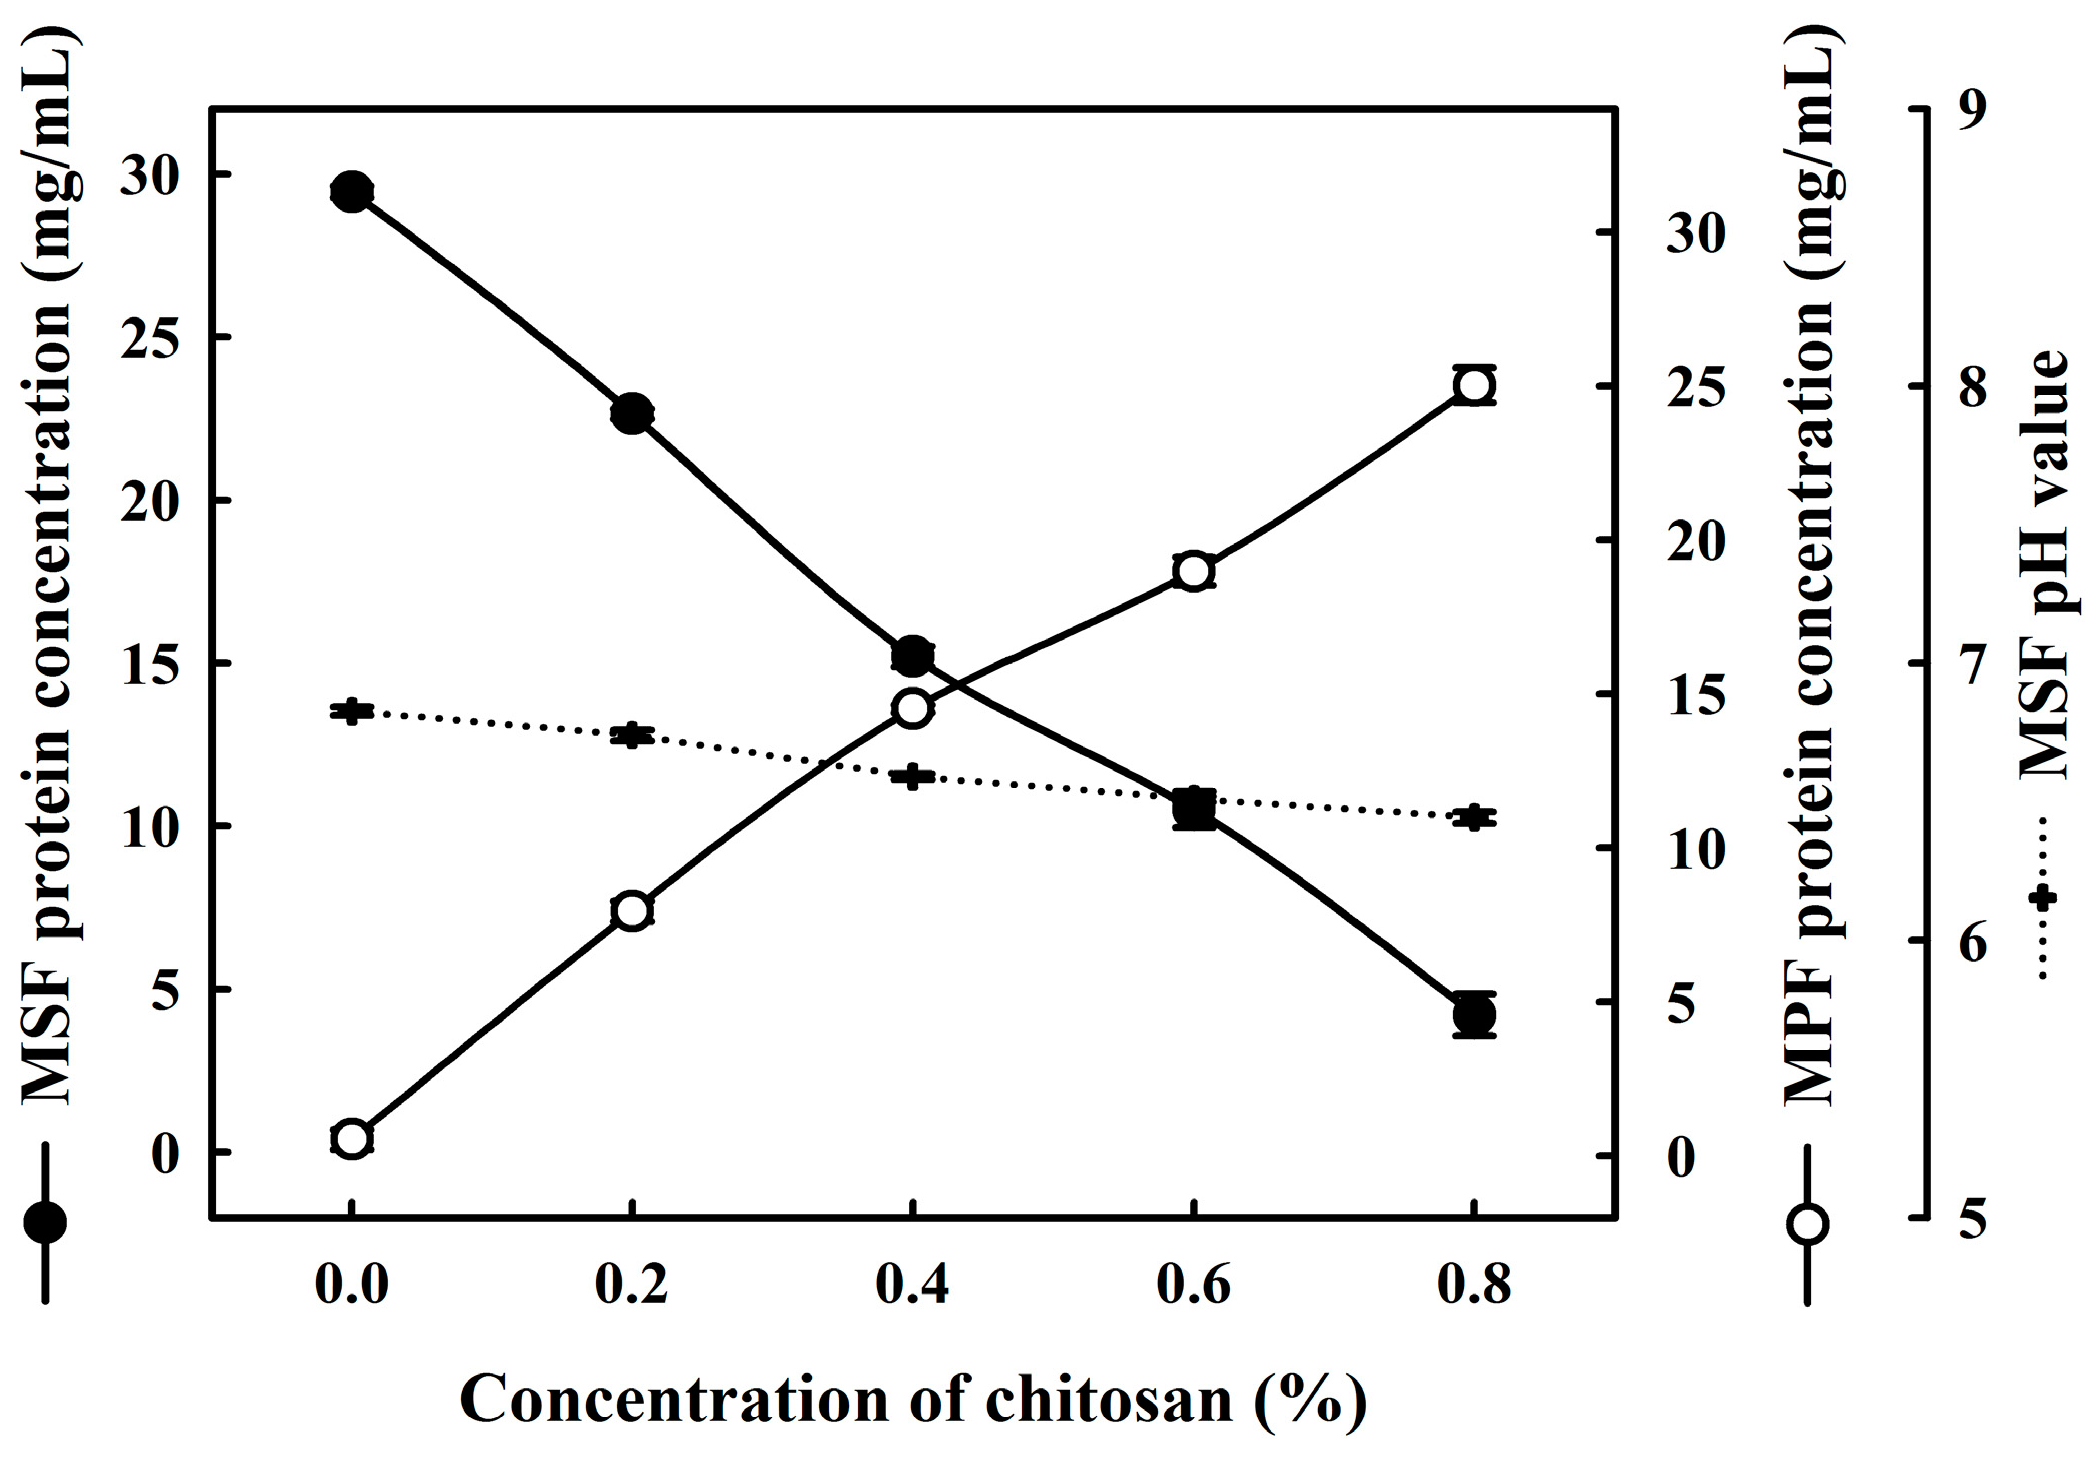
2.1. Effects of Chitosan on the Coacervation of Milk Proteins
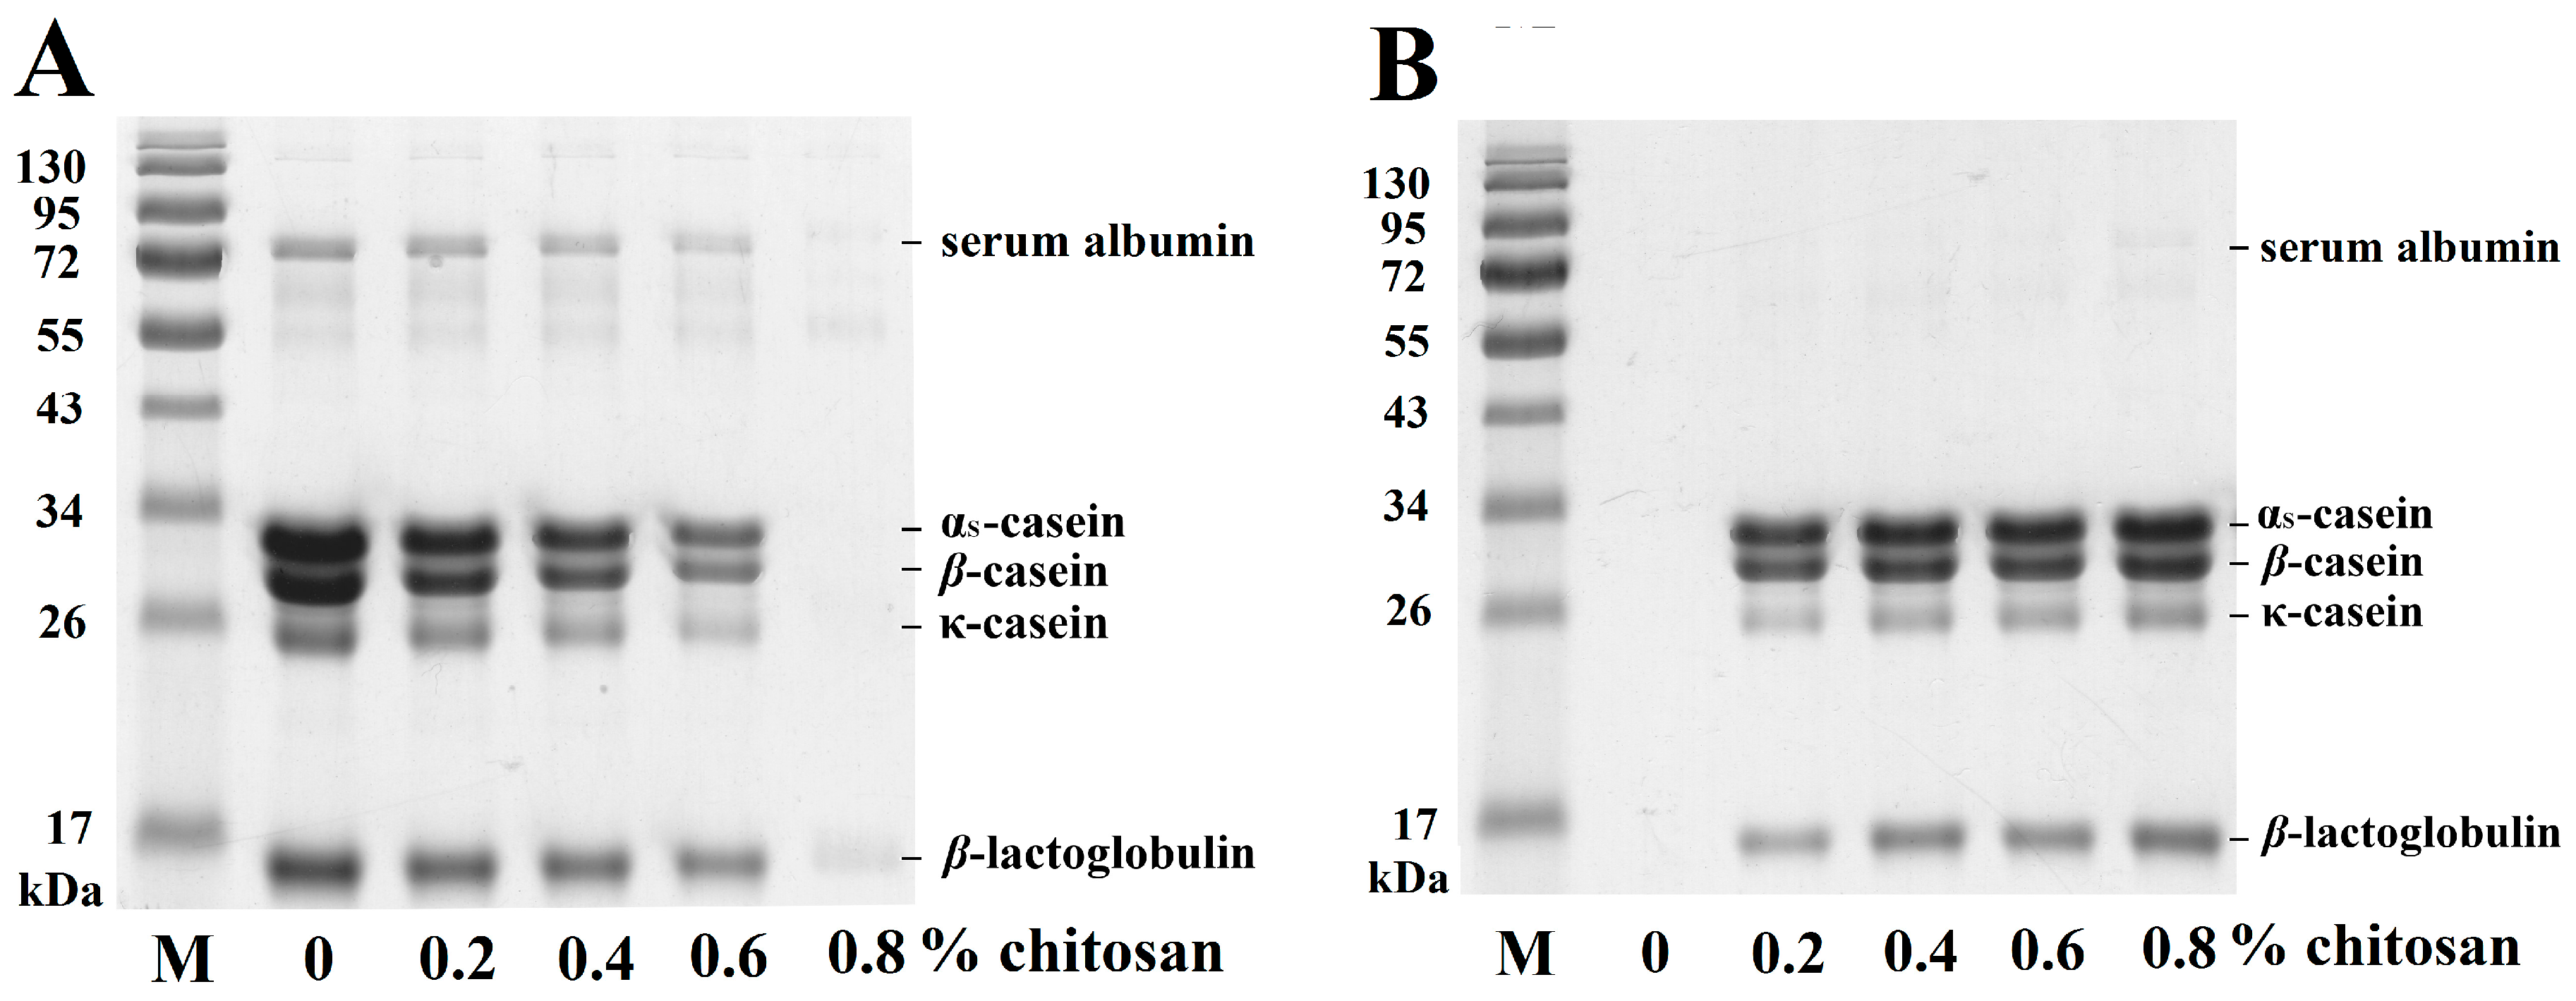
2.2. Use of SDS-PAGE to Analyze the Effects of Chitosan on Casein and Whey Proteins
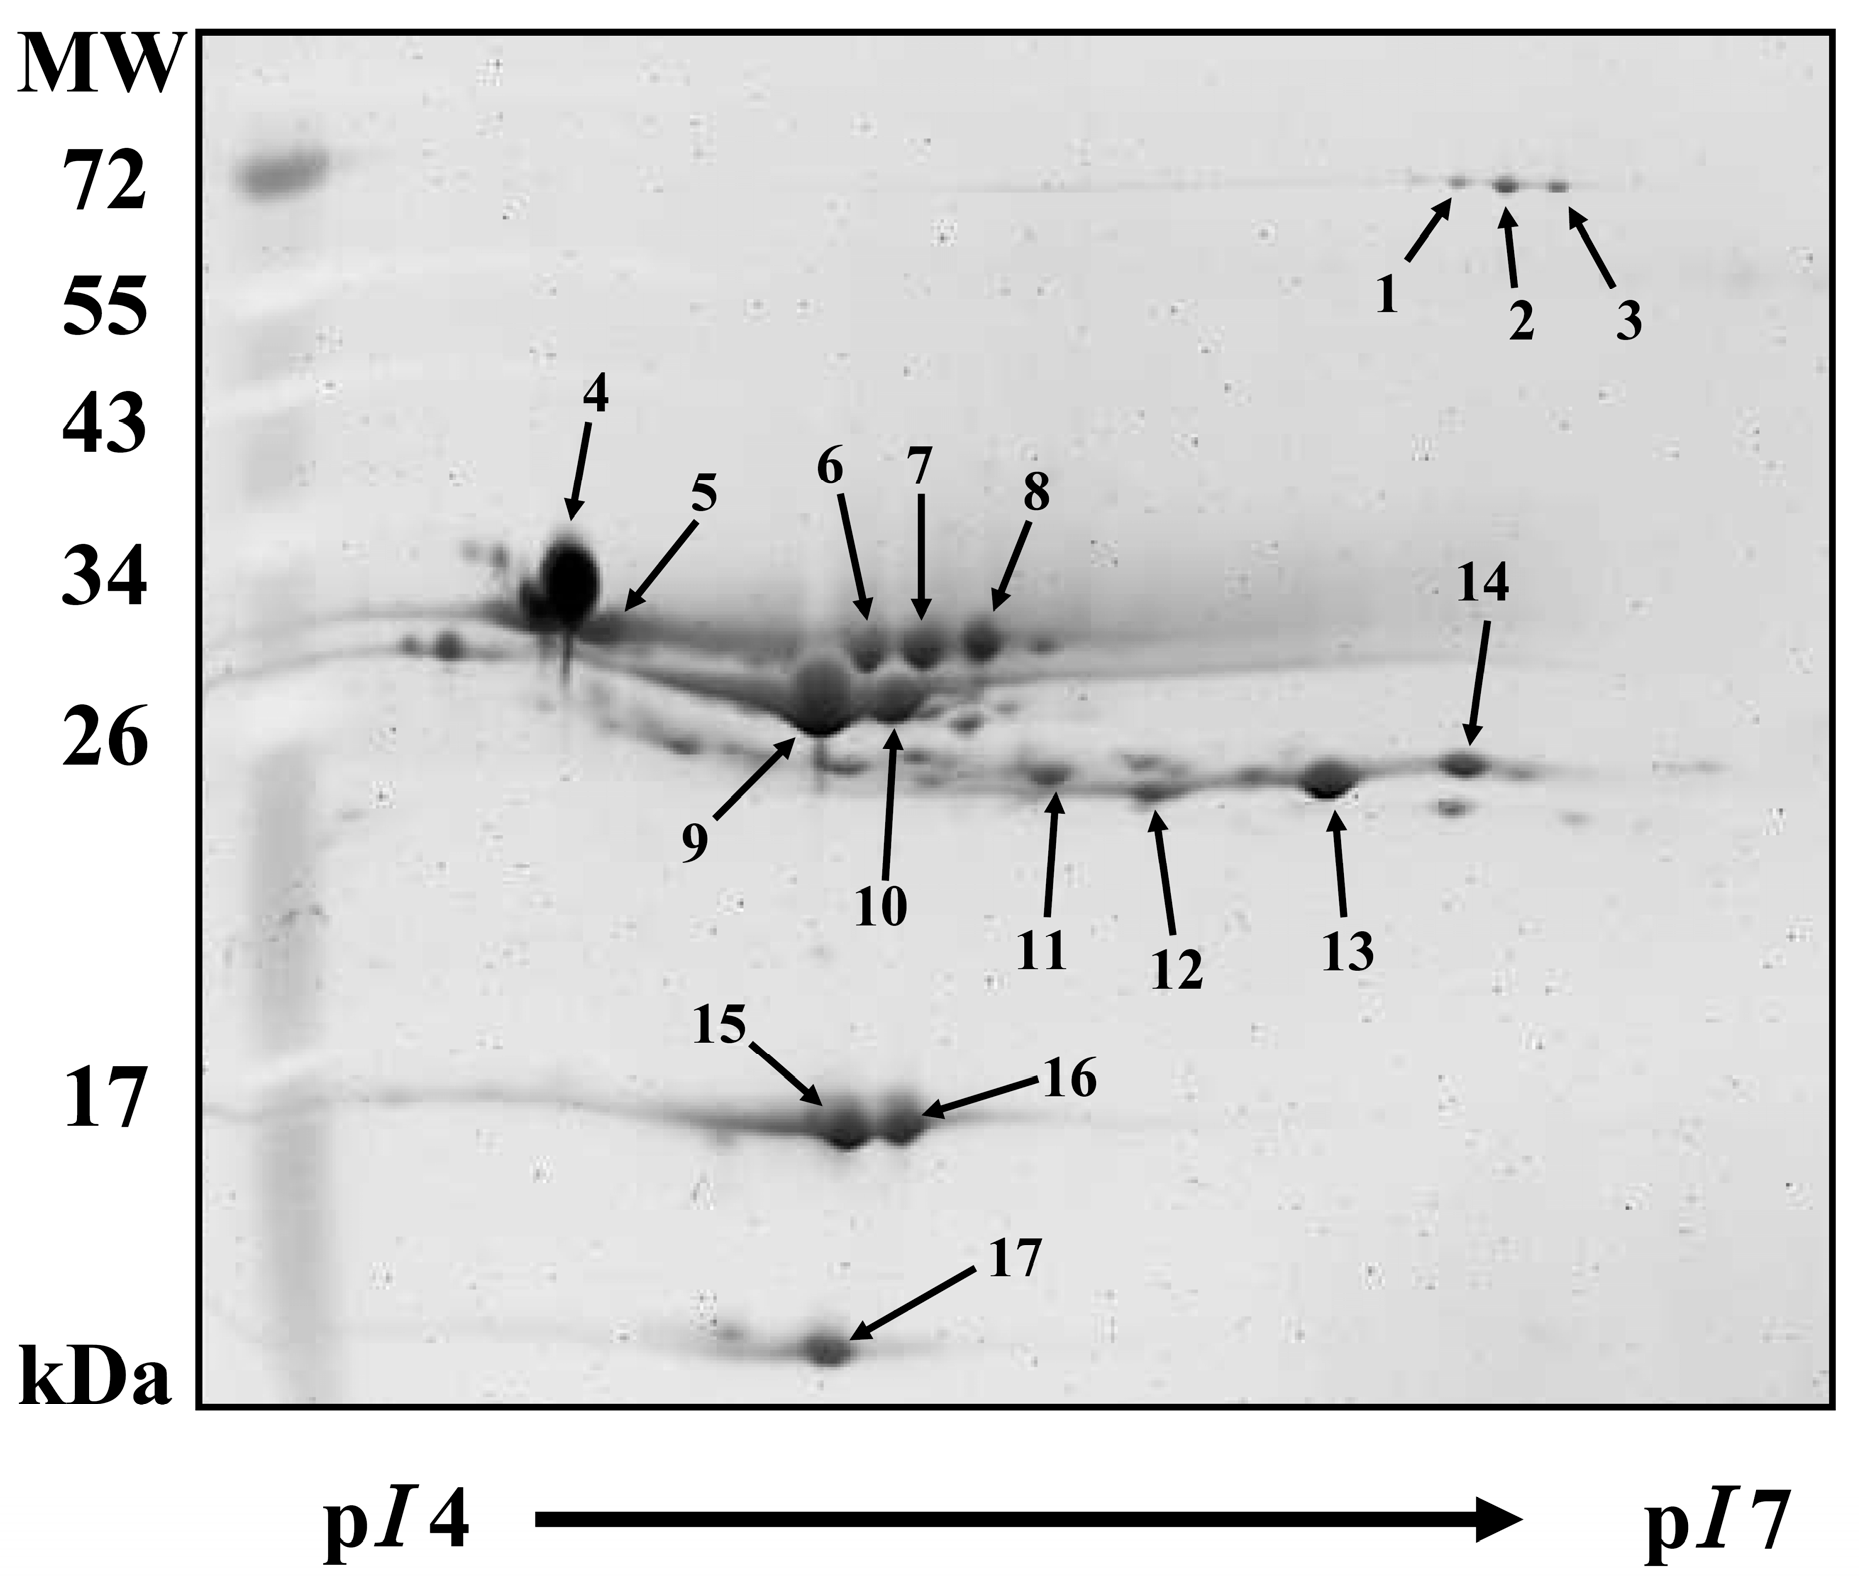
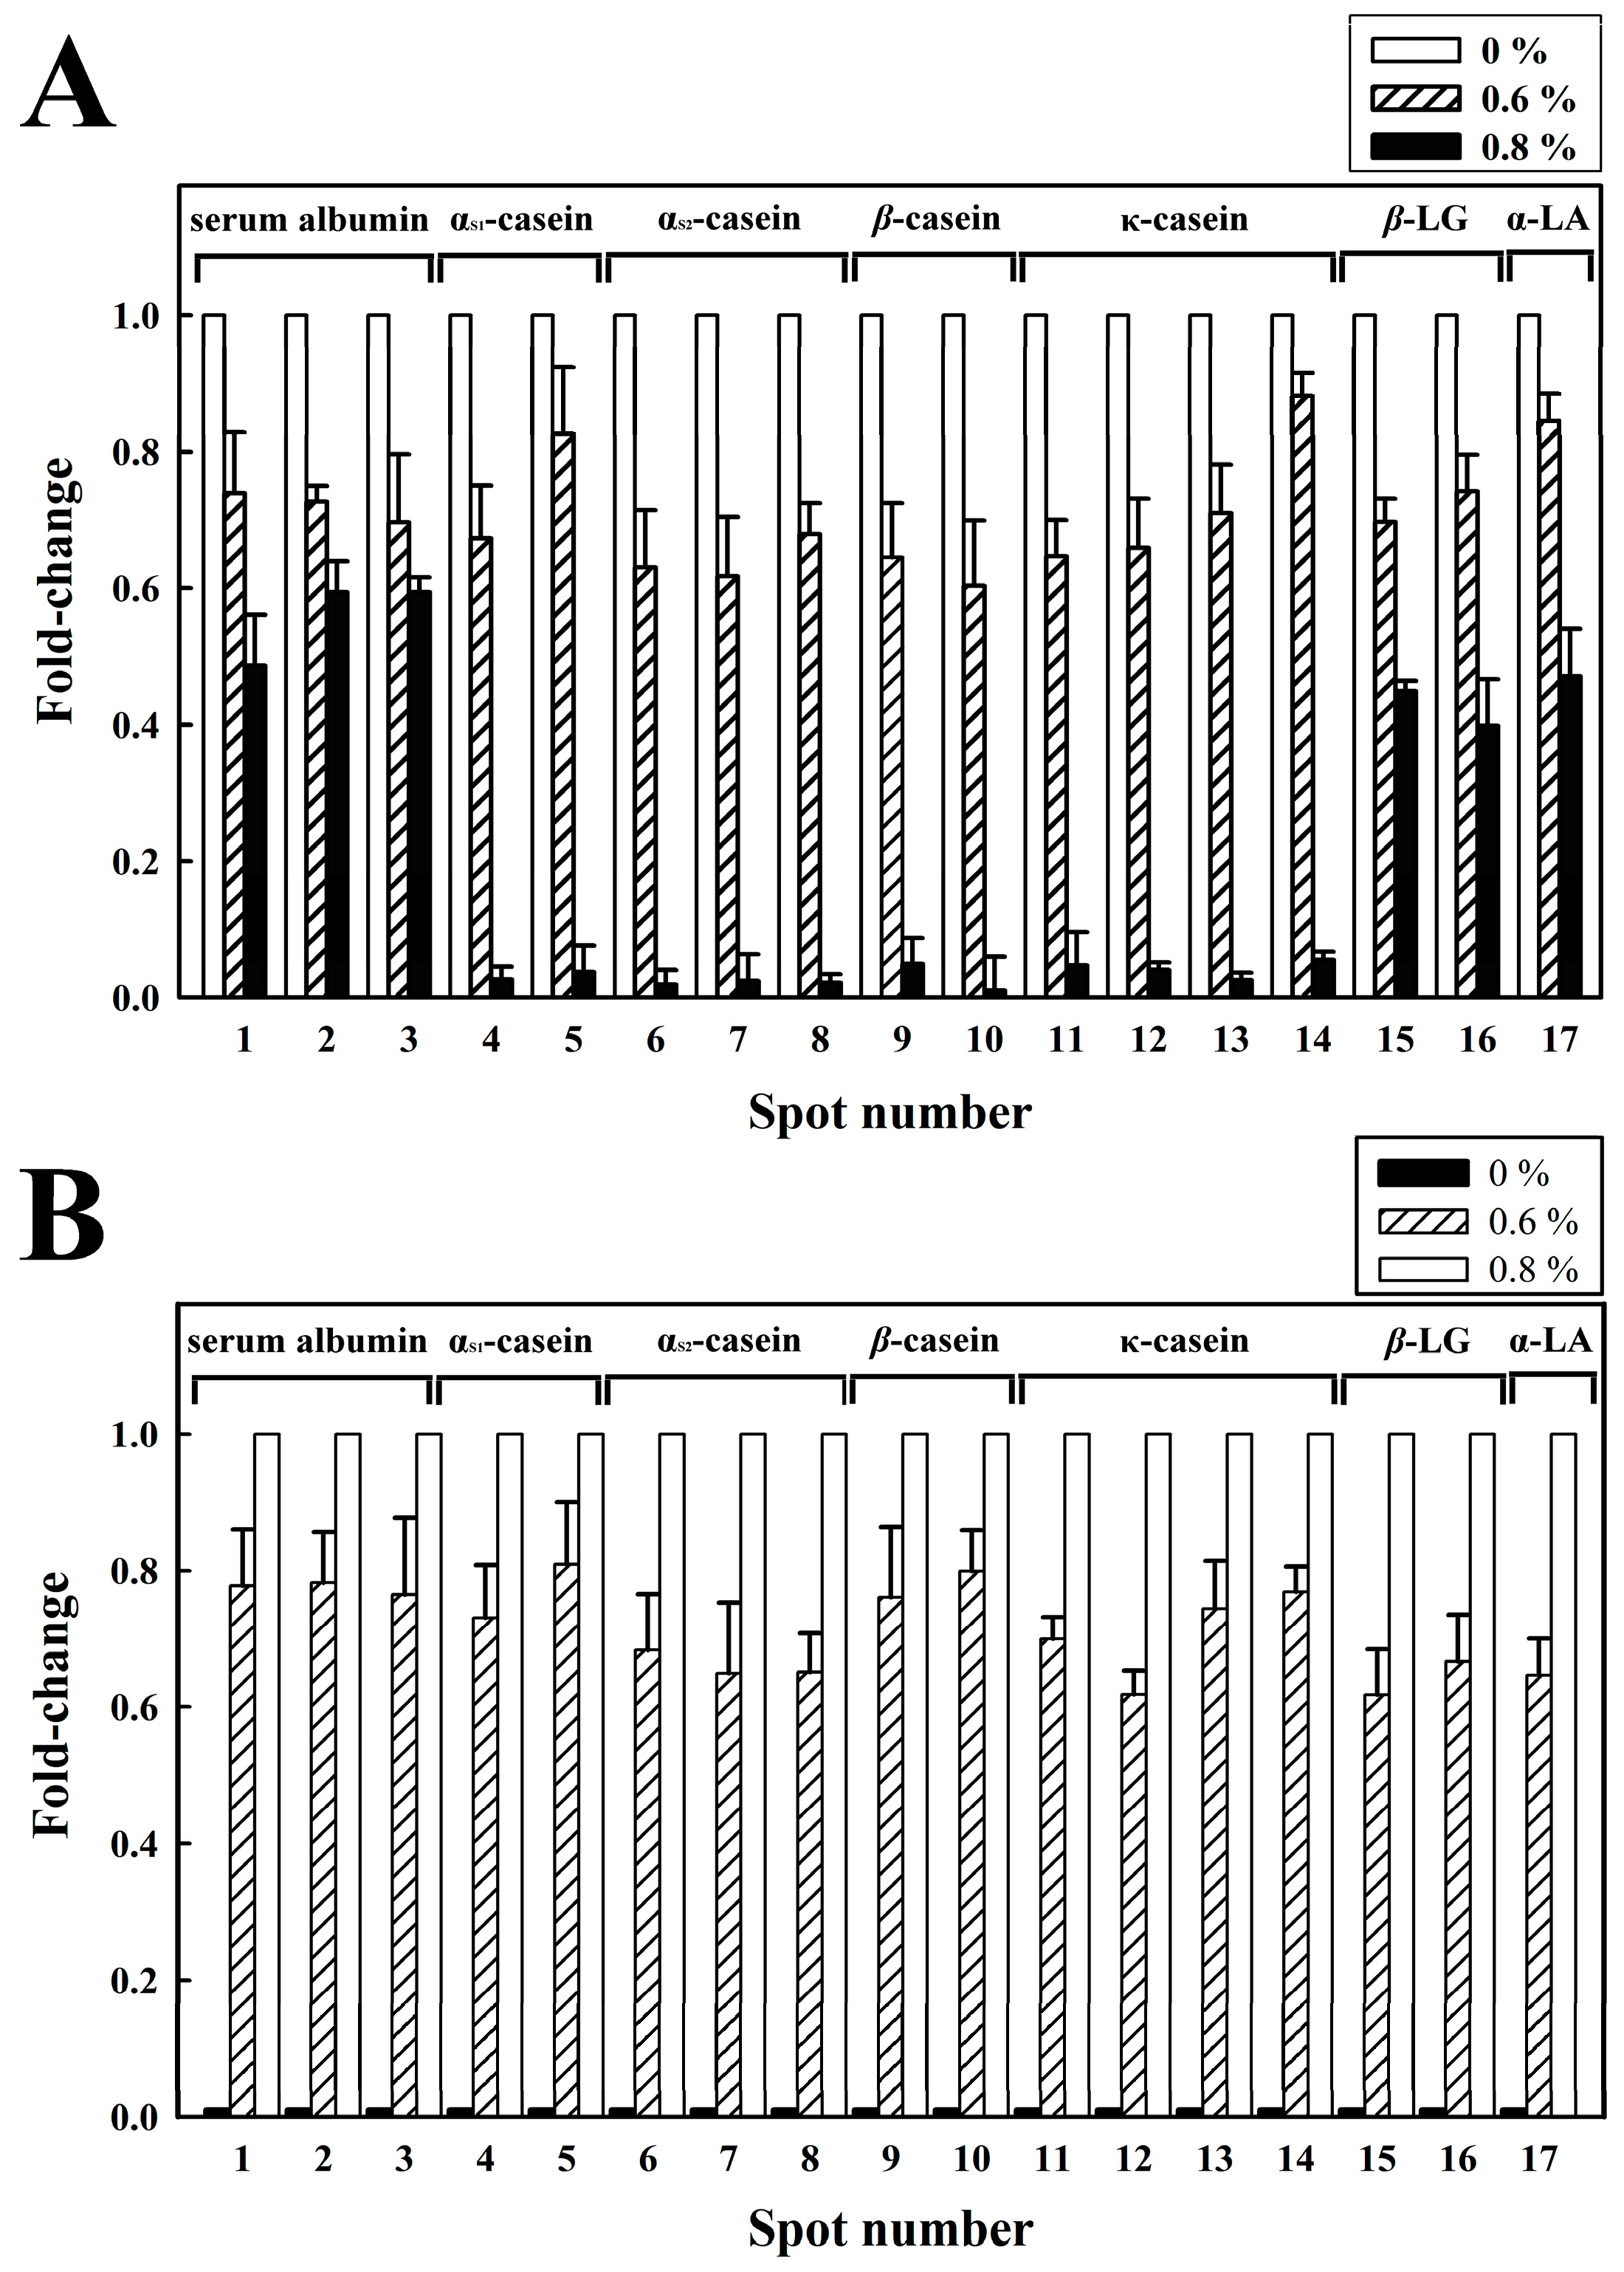
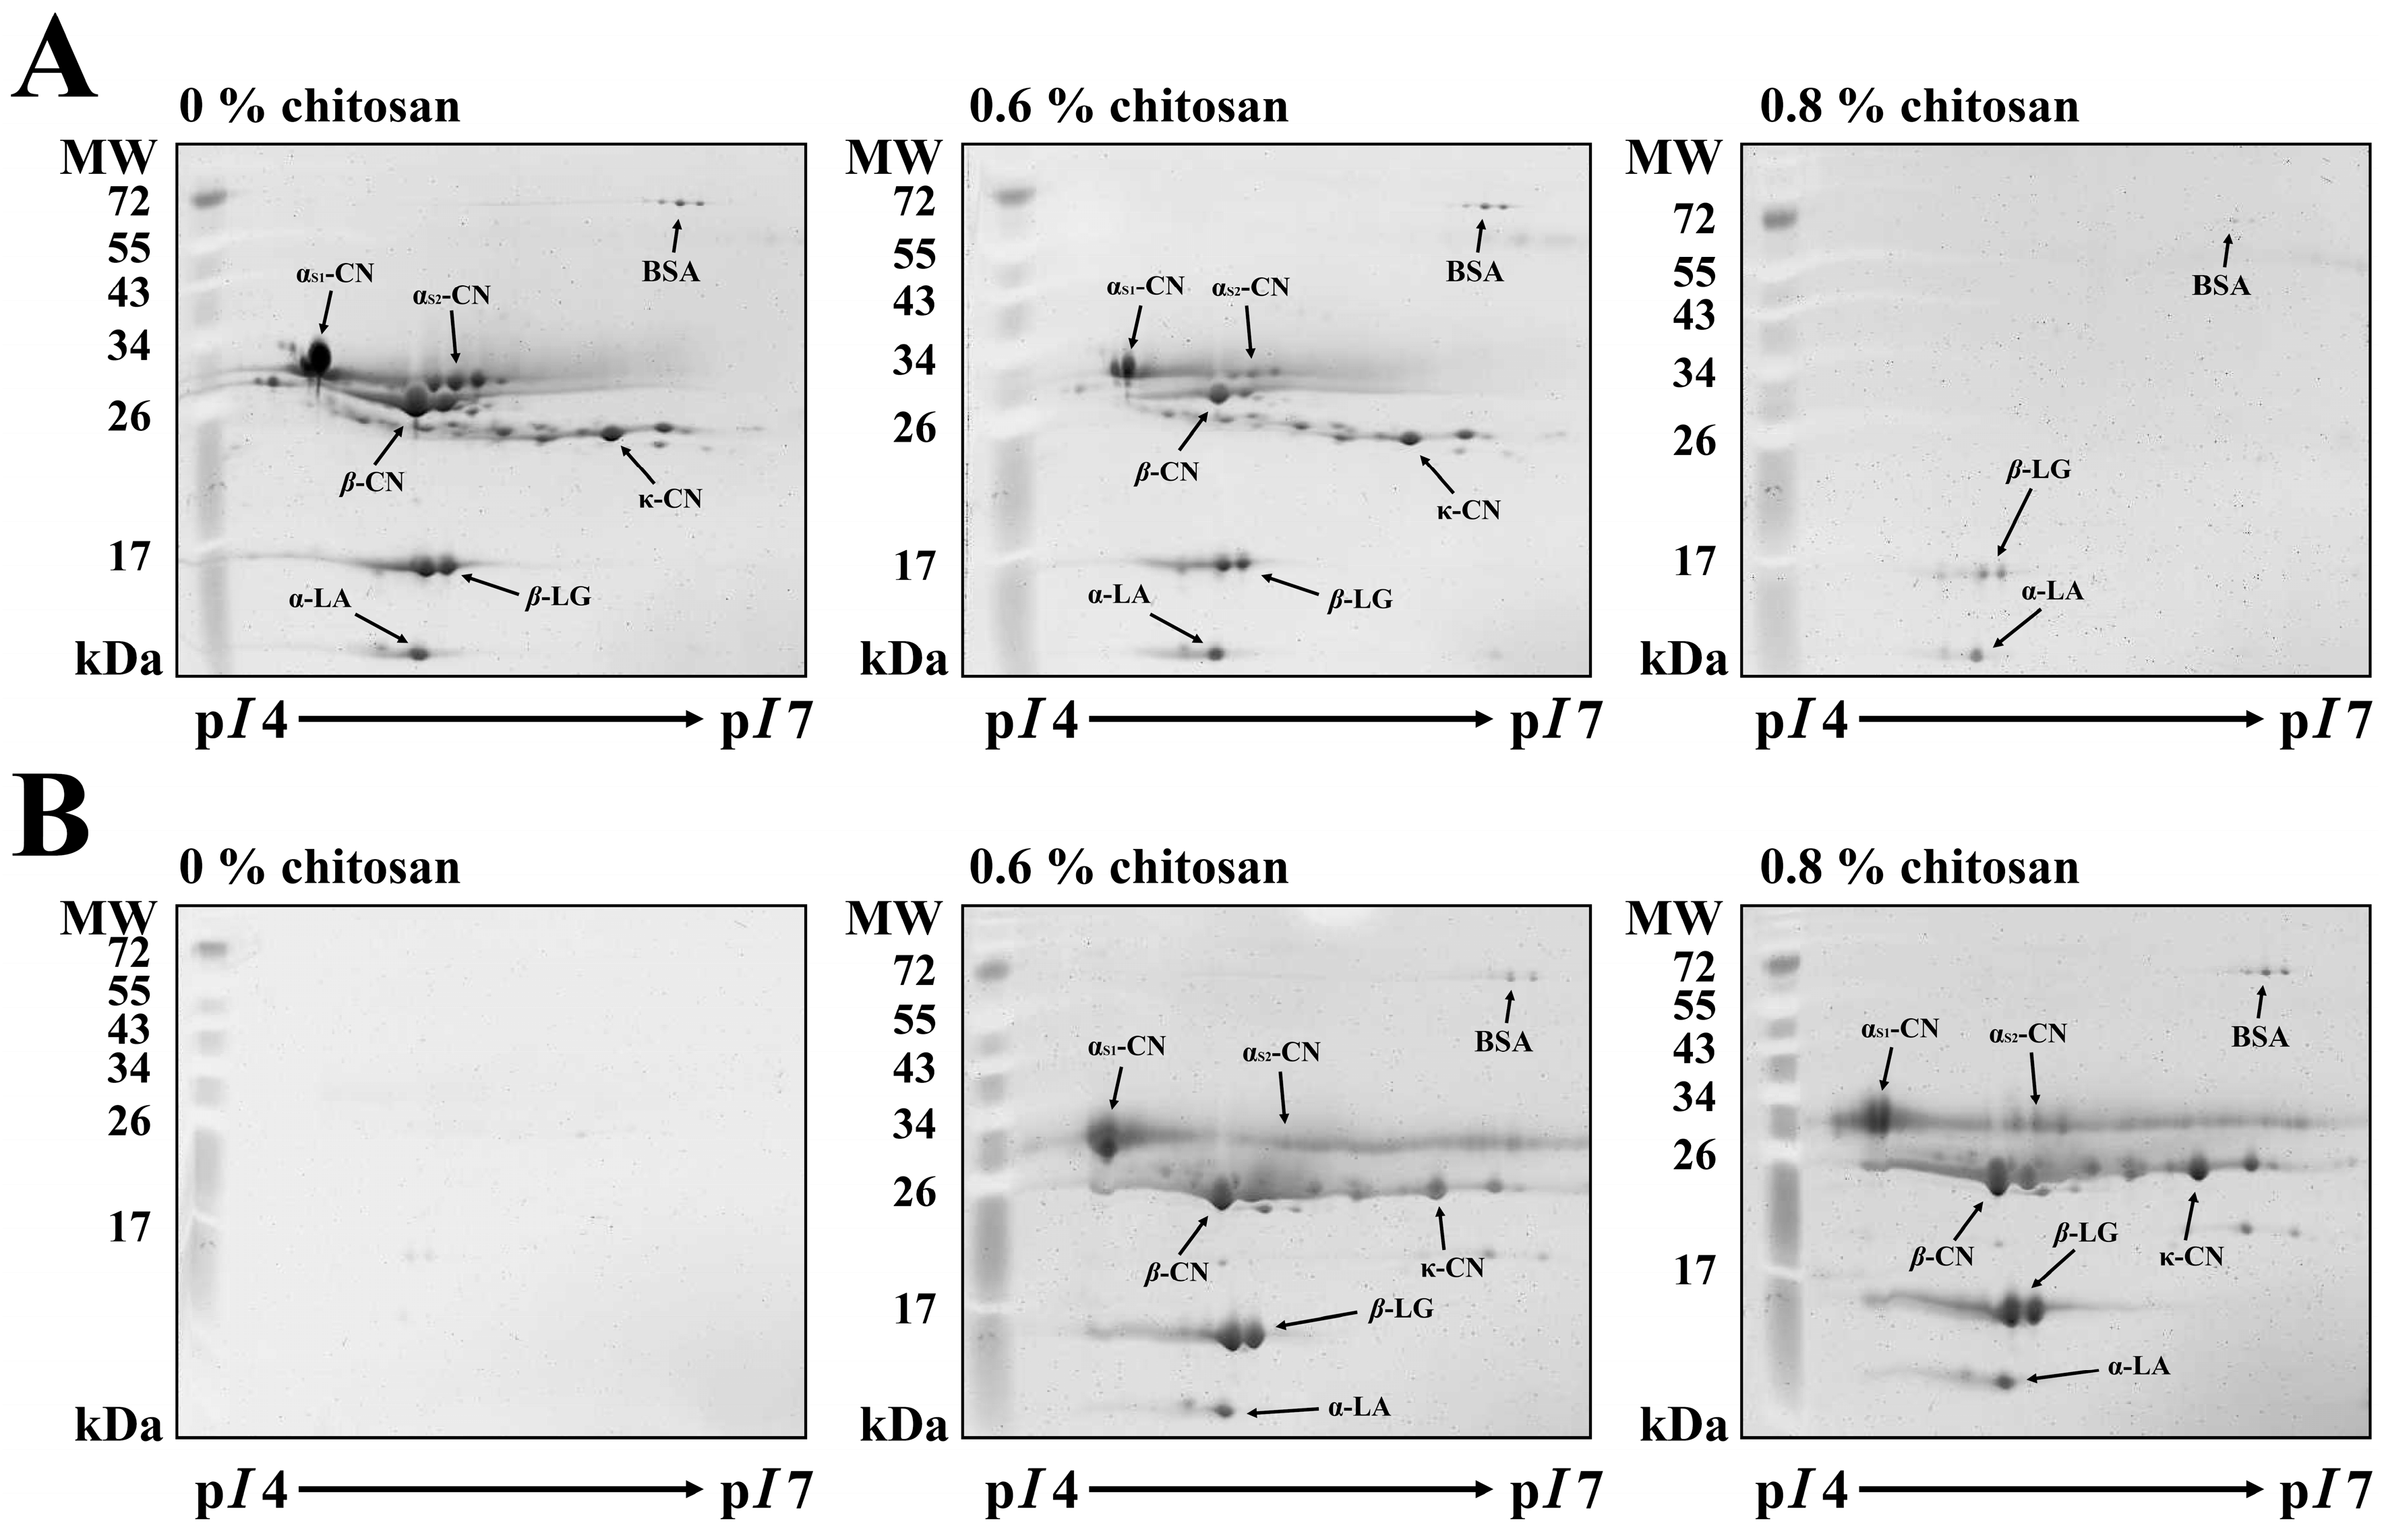
2.3. Milk Proteins by 2-DE Analysis

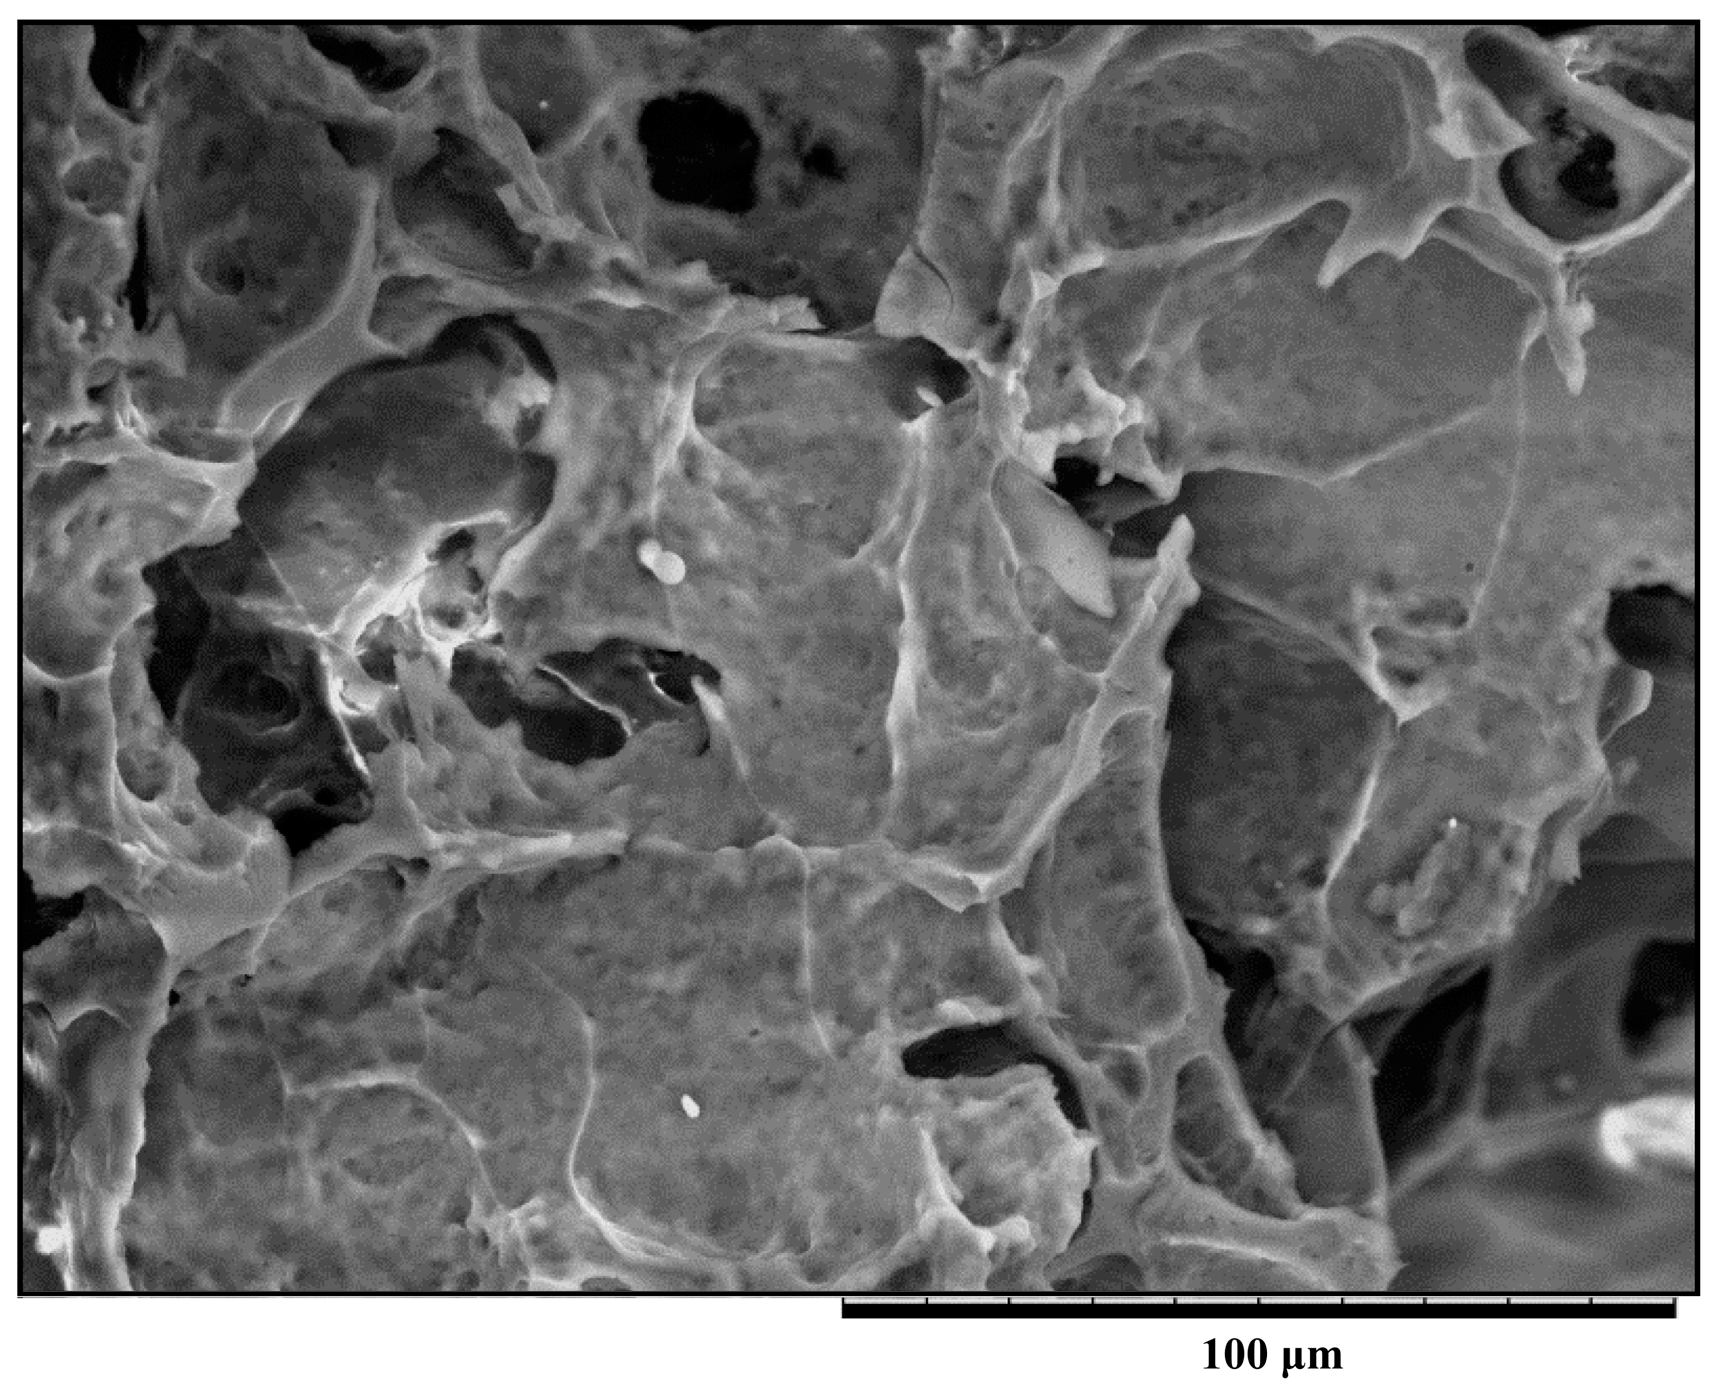
2.4. Microstructure of the Milk Samples with Chitosan

2.5. Milk Proteins-Chitosan Interactions Studied by ITC Measurements

| Compound | Structure | ΔH (cal/mol) | Ka |
|---|---|---|---|
| Chitosan | 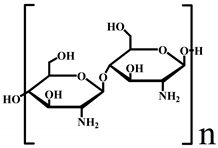 | −7.85 × 10⁴ | 1.06 × 10⁵ |
3. Experimental Section
3.1. Preparation of Milk Samples
3.2. Determination of Protein Concentration
3.3. SDS-PAGE Analysis
3.4. Two-Dimensional Polyacrylamide Gel Electrophoresis (2D-PAGE)
3.5. Microstructure Analysis
3.6. Milk Protein-Chitosan Interactions Studied by ITC Measurements
3.7. Statistical Analysis
4. Conclusions
Acknowledgments
Author Contributions
Conflicts of Interest
References
- Huang, G.Q.; Sun, Y.T.; Xiao, J.X.; Yang, J. Complex coacervation of soybean protein isolate and chitosan. Food Chem. 2012, 135, 534–539. [Google Scholar] [CrossRef] [PubMed]
- Corredig, M.; Sharafbafi, N.; Kristo, E. Polysaccharide-protein interactions in dairy matrices, control and design of structures. Food Hydrocoll. 2013, 25, 1833–1841. [Google Scholar] [CrossRef]
- Turgeon, S.L.; Schmitt, C.; Sanchez, C. Protein-polysaccharide complexes and coacervates. Curr. Opin. Coll. Interf. Sci. 2007, 12, 166–178. [Google Scholar] [CrossRef]
- Montilla, E.; Casal, E.; Moreno, F.J.; Belloque, J.; Olano, A.; Corzo, N. Isolation of bovine β-lactoglobulin from complexes with chitosan. Food Hydrocoll. 2007, 17, 459–464. [Google Scholar]
- Narambuena, C.F.; Ausar, F.S.; Bianco, I.D.; Beltramo, D.M.; Leiva, P.M. Aggregation of casein micelles by interactions with chitosans: A study by monte carlo simulations. J. Agric. Food Chem. 2005, 53, 459–463. [Google Scholar] [CrossRef] [PubMed]
- Dutta, P.K.; Dutta, J.; Tripathi, V.S. Chitin and chitosan: Chemistry, properties and applications. J. Sci. Ind. Res. 2004, 63, 20–31. [Google Scholar]
- Kean, T.; Thanou, M. Biodegradation, biodistribution and toxicity of chitosan. Adv. Drug Deliv. Rev. 2010, 62, 3–11. [Google Scholar] [CrossRef] [PubMed]
- Xia, W.; Liu, P.; Zhang, J.; Chen, J. Biological activities of chitosan and chitooligosaccharides. Food Hydrocoll. 2011, 25, 170–179. [Google Scholar] [CrossRef]
- Pierro, P.D.; Sorrentino, A.; Mariniello, L.; Giosafatto, C.V.L.; Porta, R. Chitosan/whey protein film as active coating to extend Ricotta cheese shelf-life. LWT-Food Sci. Technol. 2011, 44, 2324–2327. [Google Scholar] [CrossRef]
- Arancibia, M.Y.; Alemán, A.; Calvo, M.M.; López-Caballero, M.E.; Montero, P.; Gómez-Guillén, M.C. Antimicrobial and antioxidant chitosan solutions enriched with active shrimp (Litopenaeus vannamei) waste materials. Food Hydrocoll. 2014, 35, 710–717. [Google Scholar] [CrossRef]
- Dash, M.; Chiellini, F.; Ottenbrite, R.M.; Chiellini, E. Chitosan-A versatile semi-synthetic polymer in biomedical applications. Prog. Polym. Sci. 2011, 36, 981–1014. [Google Scholar] [CrossRef]
- Ausar, S.F.; Landa, C.A.; Bianco, I.D.; Castagna, L.F.; Beltramo, D.M. Hydrolysis of a chitosan-induced milk aggregate by pepsin, trypsin and pancreatic lipase. Biosci. Biotechnol. Biochem. 2001, 65, 2412–2418. [Google Scholar] [CrossRef] [PubMed]
- Smolenski, G.; Haines, S.; Kwan, F.Y.S.; Bond, J.; Farr, V.; Davis, S.R.; Stelwagen, K.; Wheeler, T.T. Characterisation of host defence proteins in milk using a proteomic approach. J. Proteome Res. 2007, 6, 207–215. [Google Scholar] [CrossRef] [PubMed]
- Bönisch, M.; Heidebach, T.; Kulozik, U. Influence of transglutaminase protein cross-linking on the rennet coagulation of casein. Food Hydrocoll. 2007, 22, 288–297. [Google Scholar] [CrossRef]
- Gagnaire, V.; Jardin, J.; Jan, G.; Lortal, S. Proteomics of milk and bacteria used in fermented dairy products: From qualitative to quantitative advances. J. Dairy Sci. 2009, 92, 811–825. [Google Scholar] [CrossRef] [PubMed]
- Hsieh, J.F.; Pan, P.H. Proteomic profiling of the coagulation of milk proteins induced by chymosin. J. Agric. Food Chem. 2012, 60, 2039–2045. [Google Scholar] [CrossRef] [PubMed]
- Yang, L.; Tian, D.; Luo, Y.; Zhang, R.; Ren, C.; Zhou, X. Proteomics-based identification of storage, metabolic, and allergenic proteins in wheat seed from 2-DE gels. Afr. J. Agric. Res. 2011, 6, 808–818. [Google Scholar]
- Holland, J.W.; Gupta, R.; Deeth, H.C.; Alewood, P.F. Proteomic analysis of temperature-dependent changes in stored UHT milk. J. Agric. Food Chem. 2011, 59, 1837–1846. [Google Scholar] [CrossRef] [PubMed]
- Bahrman, N.; Egroni, L.N.; Jaminon, O.; Gouis, J.L. Wheat leaf proteome analysis using sequence data of proteins separated by two-dimensional electrophoresis. Proteomics 2004, 4, 2672–2684. [Google Scholar] [CrossRef] [PubMed]
- Bianchi, L.; Puglia, M.; Landi, C.; Matteoni, S.; Perini, D.; Armini, A.; Verani, M.; Trombetta, C.; Soldani, P.; Roncada, P.; et al. Solubilization methods and reference 2-DE map of cow milk fat globules. J. Proteomics 2009, 72, 853–864. [Google Scholar]
- Dickinson, E. Stability and rheological implications of electrostatic milk protein-polysaccharide interactions. Trends Food Sci. Technol. 1998, 9, 347–354. [Google Scholar] [CrossRef]
- Yuan, Y.; Wan, Z.L.; Yin, S.W.; Yang, X.Q.; Qi, J.R.; Liu, G.Q.; Zhang, Y. Characterization of complexes of soy protein and chitosan heated at low pH. LWT-Food Sci. Technol. 2013, 50, 657–664. [Google Scholar] [CrossRef]
- Ausar, S.F.; Bianco, J.D.; Badini, R.G.; Castagna, L.F.; Modesti, N.M.; Landa, C.A.; Beltramo, D.M. Characterization of casein micelle precipitation by chitosans. J. Dairy Sci. 2001, 84, 361–369. [Google Scholar] [CrossRef] [PubMed]
- Hoven, V.P.; Tangpasuthadol, V.; Angkitpaiboon, Y.; Vallapa, N.; Kiatkamjornwong, S. Surface-charged chitosan: Preparation and protein adsorption. Carbohydr. Polym. 2007, 68, 44–53. [Google Scholar] [CrossRef]
- Larsen, L.B.; Wedholm, A.; Møller, H.S.; Andren, A.; Lindmark-Månsson, H. Proteomic study of correlations between milk yield and whey protein composition. J. Anim. Feed Sci. 2007, 16, 200–206. [Google Scholar]
- Rodríguez Patino, J.M.; Pilosof, A.M.R. Proteine-polysaccharide interactions at fluid interfaces. Food Hydrocoll. 2011, 25, 1925–1937. [Google Scholar] [CrossRef]
- Lee, A.C.; Hong, Y.H. Coacervate formation of α-lactalbumin-chitosan and β--lactoglobulin-chitosan complexes. Food Res. Int. 2009, 42, 733–738. [Google Scholar] [CrossRef]
- Hassan, A.N.; Frank, J.F.; Elsoda, M. Observation of bacterial exopolysaccharide in dairy products using cryo-scanning electron microscopy. Int. Dairy J. 2003, 13, 755–762. [Google Scholar] [CrossRef]
- Hsieh, J.F.; Chen, S.T. A functional proteomic approach to the identification and characterization of protein composition in wheat leaf. Curr. Proteomics 2008, 5, 253–266. [Google Scholar] [CrossRef]
- Lopez, M.F.; Berggren, K.; Chernokalskaya, E.; Lazarev, A.; Robinson, M.; Patton, W.F. A comparison of silver stain and SYPRO Ruby Protein Gel Stain with respect to protein detection in two-dimensional gels and identification by peptide mass profiling. Electrophoresis 2000, 21, 3673–3683. [Google Scholar] [CrossRef] [PubMed]
- Lee, C.Y.; Kuo, M.I. Effect of γ-polyglutamate on the rheological properties and microstructure of tofu. Food Hydrocoll. 2011, 25, 1034–1040. [Google Scholar] [CrossRef]
- Sample Availability: Samples of the compounds are commercially available.
© 2015 by the authors. Licensee MDPI, Basel, Switzerland. This article is an open access article distributed under the terms and conditions of the Creative Commons Attribution license ( http://creativecommons.org/licenses/by/4.0/).
Share and Cite
Chen, C.-C.; Chen, S.-T.; Hsieh, J.-F. Proteomic Analysis of Polysaccharide-Milk Protein Interactions Induced by Chitosan. Molecules 2015, 20, 7737-7749. https://doi.org/10.3390/molecules20057737
Chen C-C, Chen S-T, Hsieh J-F. Proteomic Analysis of Polysaccharide-Milk Protein Interactions Induced by Chitosan. Molecules. 2015; 20(5):7737-7749. https://doi.org/10.3390/molecules20057737
Chicago/Turabian StyleChen, Chun-Chi, Shui-Tein Chen, and Jung-Feng Hsieh. 2015. "Proteomic Analysis of Polysaccharide-Milk Protein Interactions Induced by Chitosan" Molecules 20, no. 5: 7737-7749. https://doi.org/10.3390/molecules20057737
APA StyleChen, C.-C., Chen, S.-T., & Hsieh, J.-F. (2015). Proteomic Analysis of Polysaccharide-Milk Protein Interactions Induced by Chitosan. Molecules, 20(5), 7737-7749. https://doi.org/10.3390/molecules20057737