
Effect of Pulsed Electric Fields on the Flavour Profile of Red-Fleshed Sweet Cherries (Prunus avium var. Stella)


Abstract
:
1. Introduction
2. Results and Discussion
2.1. Identification of Volatile Compounds

| No. | Volatile Compounds | RI α | Identification β | Treatment * | |||||||||||||||
|---|---|---|---|---|---|---|---|---|---|---|---|---|---|---|---|---|---|---|---|
| S1 (Control) | S2P1 | S2P2 | S2P3 | S2P4 | S2P5 | S2P6 | S2P7 | S3P0 | S3P1 | S3P2 | S3P3 | S3P4 | S3P5 | S3P6 | S3P7 | ||||
| Aldehydes | |||||||||||||||||||
| 1 | Butanal | <653 | MS | 0.08 b | ND | 0.40 ab | 0.23 ab | 0.34 ab | 0.30 ab | 0.30 ab | ND | ND | ND | 0.34 ab | 0.32 ab | 1.00 a | 1.00 a | ND | 0.09 b |
| 2 | Pentanal | 666 | MS+RI | 0.86 abc | ND | 1.14 abc | 0.52 abc | 0.71 abc | 0.46 bc | 0.73 abc | 1.69 a | 0.30 c | 1.48 ab | ND | 0.21 c | ND | 0.02 c | ND | ND |
| 3 | 2-Pentenal, (E)- | 756 | MS+RI | ND | ND | ND | 0.04 b | 0.01 b | 0.14 ab | ND | ND | ND | 0.06 b | 0.05 b | ND | ND | 0.20 a | 0.06 b | ND |
| 4 | Hexanal | 804 | MS 85% | 50.91 b | 87.29 b | 134.60 ab | 73.97 b | 149.37 ab | 119.94 ab | 83.04 b | 81.91 b | 36.65 b | 85.12 b | 123.48 ab | 55.51 b | 209.69 a | 74.75 b | 104.66 ab | 117.46 ab |
| 5 | 2-Hexenal, (E)- | 858 | MS 85% | 310.92 bc | 243.13 bc | 613.11 abc | 253.49 bc | 1109.53 a | 585.49 abc | 321.77 bc | 282.74 bc | 129.91 c | 402.29 bc | 646.29 abc | 176.06 bc | 672.14 ab | 295.66 bc | 593.69 abc | 521.42 bc |
| 6 | Heptanal | 906 | MS+RI | 0.19 c | 0.59 bc | 1.24 bc | 0.50 bc | 0.77 bc | 1.02 bc | 2.73 a | 1.23 bc | 0.51 bc | 0.82 bc | 1.26 bc | 0.99 bc | 1.32 bc | 1.55 ab | 1.31 bc | 1.59 ab |
| 7 | 2,4-Hexadienal, (E,E)- | 927 | MS 85% | 3.29 abc | 2.32 abc | 4.35 abc | 2.95 abc | 6.20 a | 5.61 ab | 0.53 c | 2.89 abc | 1.78 bc | ND | 5.53 ab | 3.72 abc | 5.71 a | 3.50 abc | 5.97 a | 4.42 abc |
| 8 | 2-Heptenal, (Z)- | 963 | MS+RI | 0.07 b | ND | ND | 0.18 b | 0.01 b | 0.04 b | ND | 0.17 b | ND | ND | ND | ND | 0.47 b | 0.28 b | 1.90 a | 0.17 b |
| 9 | Benzaldehyde | 968 | MS 85% | 166.78 bc | 125.02 bc | 153.17 bc | 108.97 bc | 179.31 bc | 154.14 bc | 363.65 b | 882.79 a | 49.33 c | 102.60 bc | 140.80 bc | 65.86 c | 192.09 bc | 66.73 c | 184.00 bc | 114.72 bc |
| 10 | 2,4-Nonadienal, (E,E)- | 992 | MS 85% | ND | ND | ND | 0.19 b | ND | ND | ND | ND | 0.11 b | ND | ND | ND | 1.25 b | 3.28 a | ND | 0.24 b |
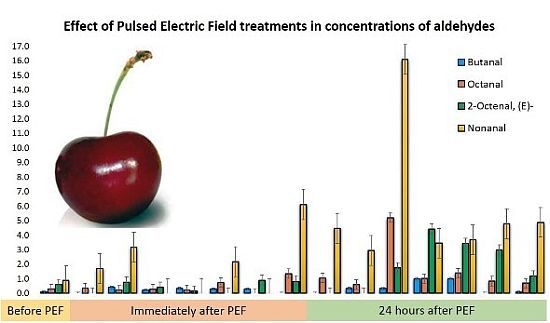
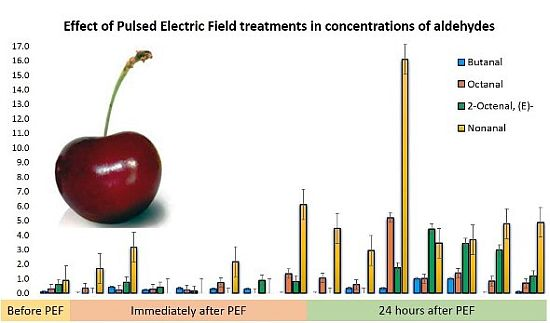
| 11 | Octanal | 1007 | MS 85% | 0.30 b | 0.37 b | 0.22 b | 0.29 b | 0.23 b | 0.74 b | ND | 1.36 b | 0.68 b | 1.06 b | 0.60 b | 5.20 a | 1.02 b | 1.39 b | 0.84 b | 0.70 b |
| 12 | 2-Octenal, (E)- | 1034 | MS 85% | 0.61 c | ND | 0.75 bc | 0.41 c | 0.14 c | ND | 0.90 bc | 0.81 bc | 1.33 bc | ND | ND | 1.76 abc | 4.41 a | 3.43 ab | 2.97 abc | 1.18 bc |
| 13 | Nonanal | 1109 | MS 85% | 0.88 b | 1.69 b | 3.17 b | ND | ND | 2.18 b | ND | 6.10 b | 3.32 b | 4.47 b | 2.95 b | 16.10 a | 3.45 b | 3.70 b | 4.79 b | 4.88 b |
| 14 | 2-Nonenal, (E)- | 1166 | MS+RI | 0.39 b | ND | 0.02 b | ND | ND | 0.88 a | ND | ND | 0.31 b | ND | 0.29 b | 0.24 b | ND | 0.02 b | 1.25 a | ND |
| 15 | Decanal | 1211 | MS 85% | 0.22 c | 0.41 bc | 1.50 ab | 0.16 c | 0.29 bc | 0.56 abc | ND | 1.28 abc | 0.42 bc | 1.83 a | 0.34 bc | 0.37 bc | 0.74 abc | 0.94 abc | 0.60 abc | 0.66 abc |
| Alcohols | |||||||||||||||||||
| 16 | 3-Pentanol | <653 | MS | 3.56 a | ND | ND | ND | ND | ND | ND | ND | 0.27 b | ND | ND | ND | ND | ND | ND | ND |
| 17 | 1-Penten-3-ol | 661 | MS+RI | 0.34 b | ND | ND | ND | ND | ND | 0.82 b | ND | ND | ND | ND | 0.23 b | ND | 2.24 a | 0.48 b | 0.45 b |
| 18 | 2-Hepten-1-ol, (Z)- | 701 | MS+RI | 0.05 d | 0.24 c | 0.99 ab | 0.36 bc | 0.18 c | 0.60 bc | 0.77 bc | 1.52 a | ND | 0.17 c | ND | 0.32 bc | ND | 0.16 c | 0.16 c | 0.42 bc |
| 19 | 3-Buten-1-ol, 3-methyl- | 733 | MS+RI | 0.64 b | 0.67 b | 1.51 ab | 0.65 a | 1.22 ab | 1.05 b | 0.66 b | 2.45 a | 0.44 b | ND | 0.48 b | 0.34 b | 0.69 b | 0.75 b | 1.00 b | 0.75 b |
| 20 | 2-Hexen-1-ol, (Z)- | 871 | MS+RI | 2.69 d | 11.45 bcd | 11.68 abcd | 16.72 abcd | 26.09 a | ND | 7.58 cd | 22.62 abc | 12.27 a | 11.05 bcd | 20.57 a | 15.17 a | 22.52 a | 13.26 d | 24.49 ab | 11.47 bcd |
| 21 | 2-Buten-1-ol, 3-methyl- | 781 | MS+RI | 0.69 abc | 0.56 abc | 0.92 abc | 0.65 abc | 1.29 a | 1.05 ab | 0.89 abc | 0.60 abc | 0.50 bc | ND | 0.76 abc | 0.34 ab | 0.69 ab | 0.31 c | 1.23 ab | 0.73 abc |
| 22 | 2-Nonen-1-ol, (E)- | 947 | MS+RI | 0.01 b | ND | ND | ND | ND | ND | 2.77 a | ND | ND | ND | ND | 0.16 b | ND | ND | ND | ND |
| 23 | 3-Heptanol | 957 | MS+RI | 0.15 b | 0.68 b | 0.67 b | 0.37 b | 0.52 b | 1.08 b | ND | 2.55 a | 0.16 b | 0.20 b | 0.42 b | 1.16 b | 0.51 b | ND | ND | 0.41 b |
| 24 | Benzyl Alcohol | 1044 | MS 85% | 59.17 bc | 46.17 bc | 32.94 bc | 27.03 bc | 95.72 ab | 72.82 abc | 52.02 bc | 129.45 a | 22.74 c | 46.22 bc | 43.67 bc | 17.46 c | 65.15 abc | 25.94 c | 78.42 abc | 44.50 bc |
| 25 | 2-Hexadecanol | 1401 | MS+RI | 0.07 b | 0.19 ab | 0.74 ab | 0.18 ab | 0.02 b | 0.18 ab | 1.46 ab | 0.79 ab | 1.18 ab | 0.15 ab | ND | ND | 0.55 ab | 1.08 ab | 0.20 ab | 1.75 a |
| Esters | |||||||||||||||||||
| 26 | Butanoic acid, methyl ester | 723 | MS+RI | 0.03 b | 0.06 b | 0.30 b | 0.20 b | 0.20 b | 0.14 b | ND | ND | 0.14 b | 2.99 a | 0.19 b | 0.08 b | 1.28 b | 0.25 b | 1.29 b | 0.16 b |
| 27 | Acetic acid, 2-phenylethyl ester | 916 | MS+RI | ND | ND | 0.91 a | ND | ND | 0.68 a | ND | ND | ND | 0.67 a | ND | ND | ND | ND | ND | ND |
| 28 | Benzoic acid, 2-hydroxy-, methyl ester | 1201 | MS+RI | 0.46 b | ND | 0.74 b | 0.72 b | 2.52 b | ND | ND | ND | 0.56 b | ND | 1.25 b | 22.25 a | 1.82 b | ND | 1.62 b | ND |
| 29 | Decanoic acid, methyl ester | 1326 | MS+RI | 3.31 b | ND | ND | ND | ND | ND | ND | ND | ND | ND | ND | 15.58 a | ND | ND | ND | ND |
| Terpenes | |||||||||||||||||||
| 30 | Menthol | 1186 | MS 85% | 0.05 b | ND | ND | ND | ND | ND | 11.26 a | ND | ND | ND | ND | ND | ND | 0.21 b | 0.19 b | 0.13 b |
| 31 | Geranyl vinyl ether | 1259 | MS 85% | 0.25 ab | 0.36 ab | 0.80 ab | 0.34 ab | 0.75 ab | 0.67 ab | 0.12 b | 0.45 ab | 0.29 ab | ND | 0.74 ab | ND | 0.90 a | ND | 0.66 ab | 0.60 b |
| Acids | |||||||||||||||||||
| 32 | n-Decanoic acid | 1312 | MS 85% | 0.02 b | ND | ND | ND | ND | 0.30 ab | ND | 0.04 b | 0.10 b | ND | ND | ND | 0.58 a | ND | 0.25 b | 0.13 b |
| Alkanes | |||||||||||||||||||
| 33 | Undecane | 1101 | MS 85% | 4.69 ab | 2.90 b | 6.13 ab | 4.90 ab | 6.86 ab | 5.81 ab | ND | 4.65 ab | ND | ND | 6.57 ab | 10.72 ab | 6.18 ab | 13.10 a | 7.49 ab | 5.02 ab |
2.2. Volatile Analysis of Cherry Samples Untreated and Treated with Different PEF Energy Intensities
Headspace Volatile Compounds of PEF-Treated Cherries
3. Experimental Section
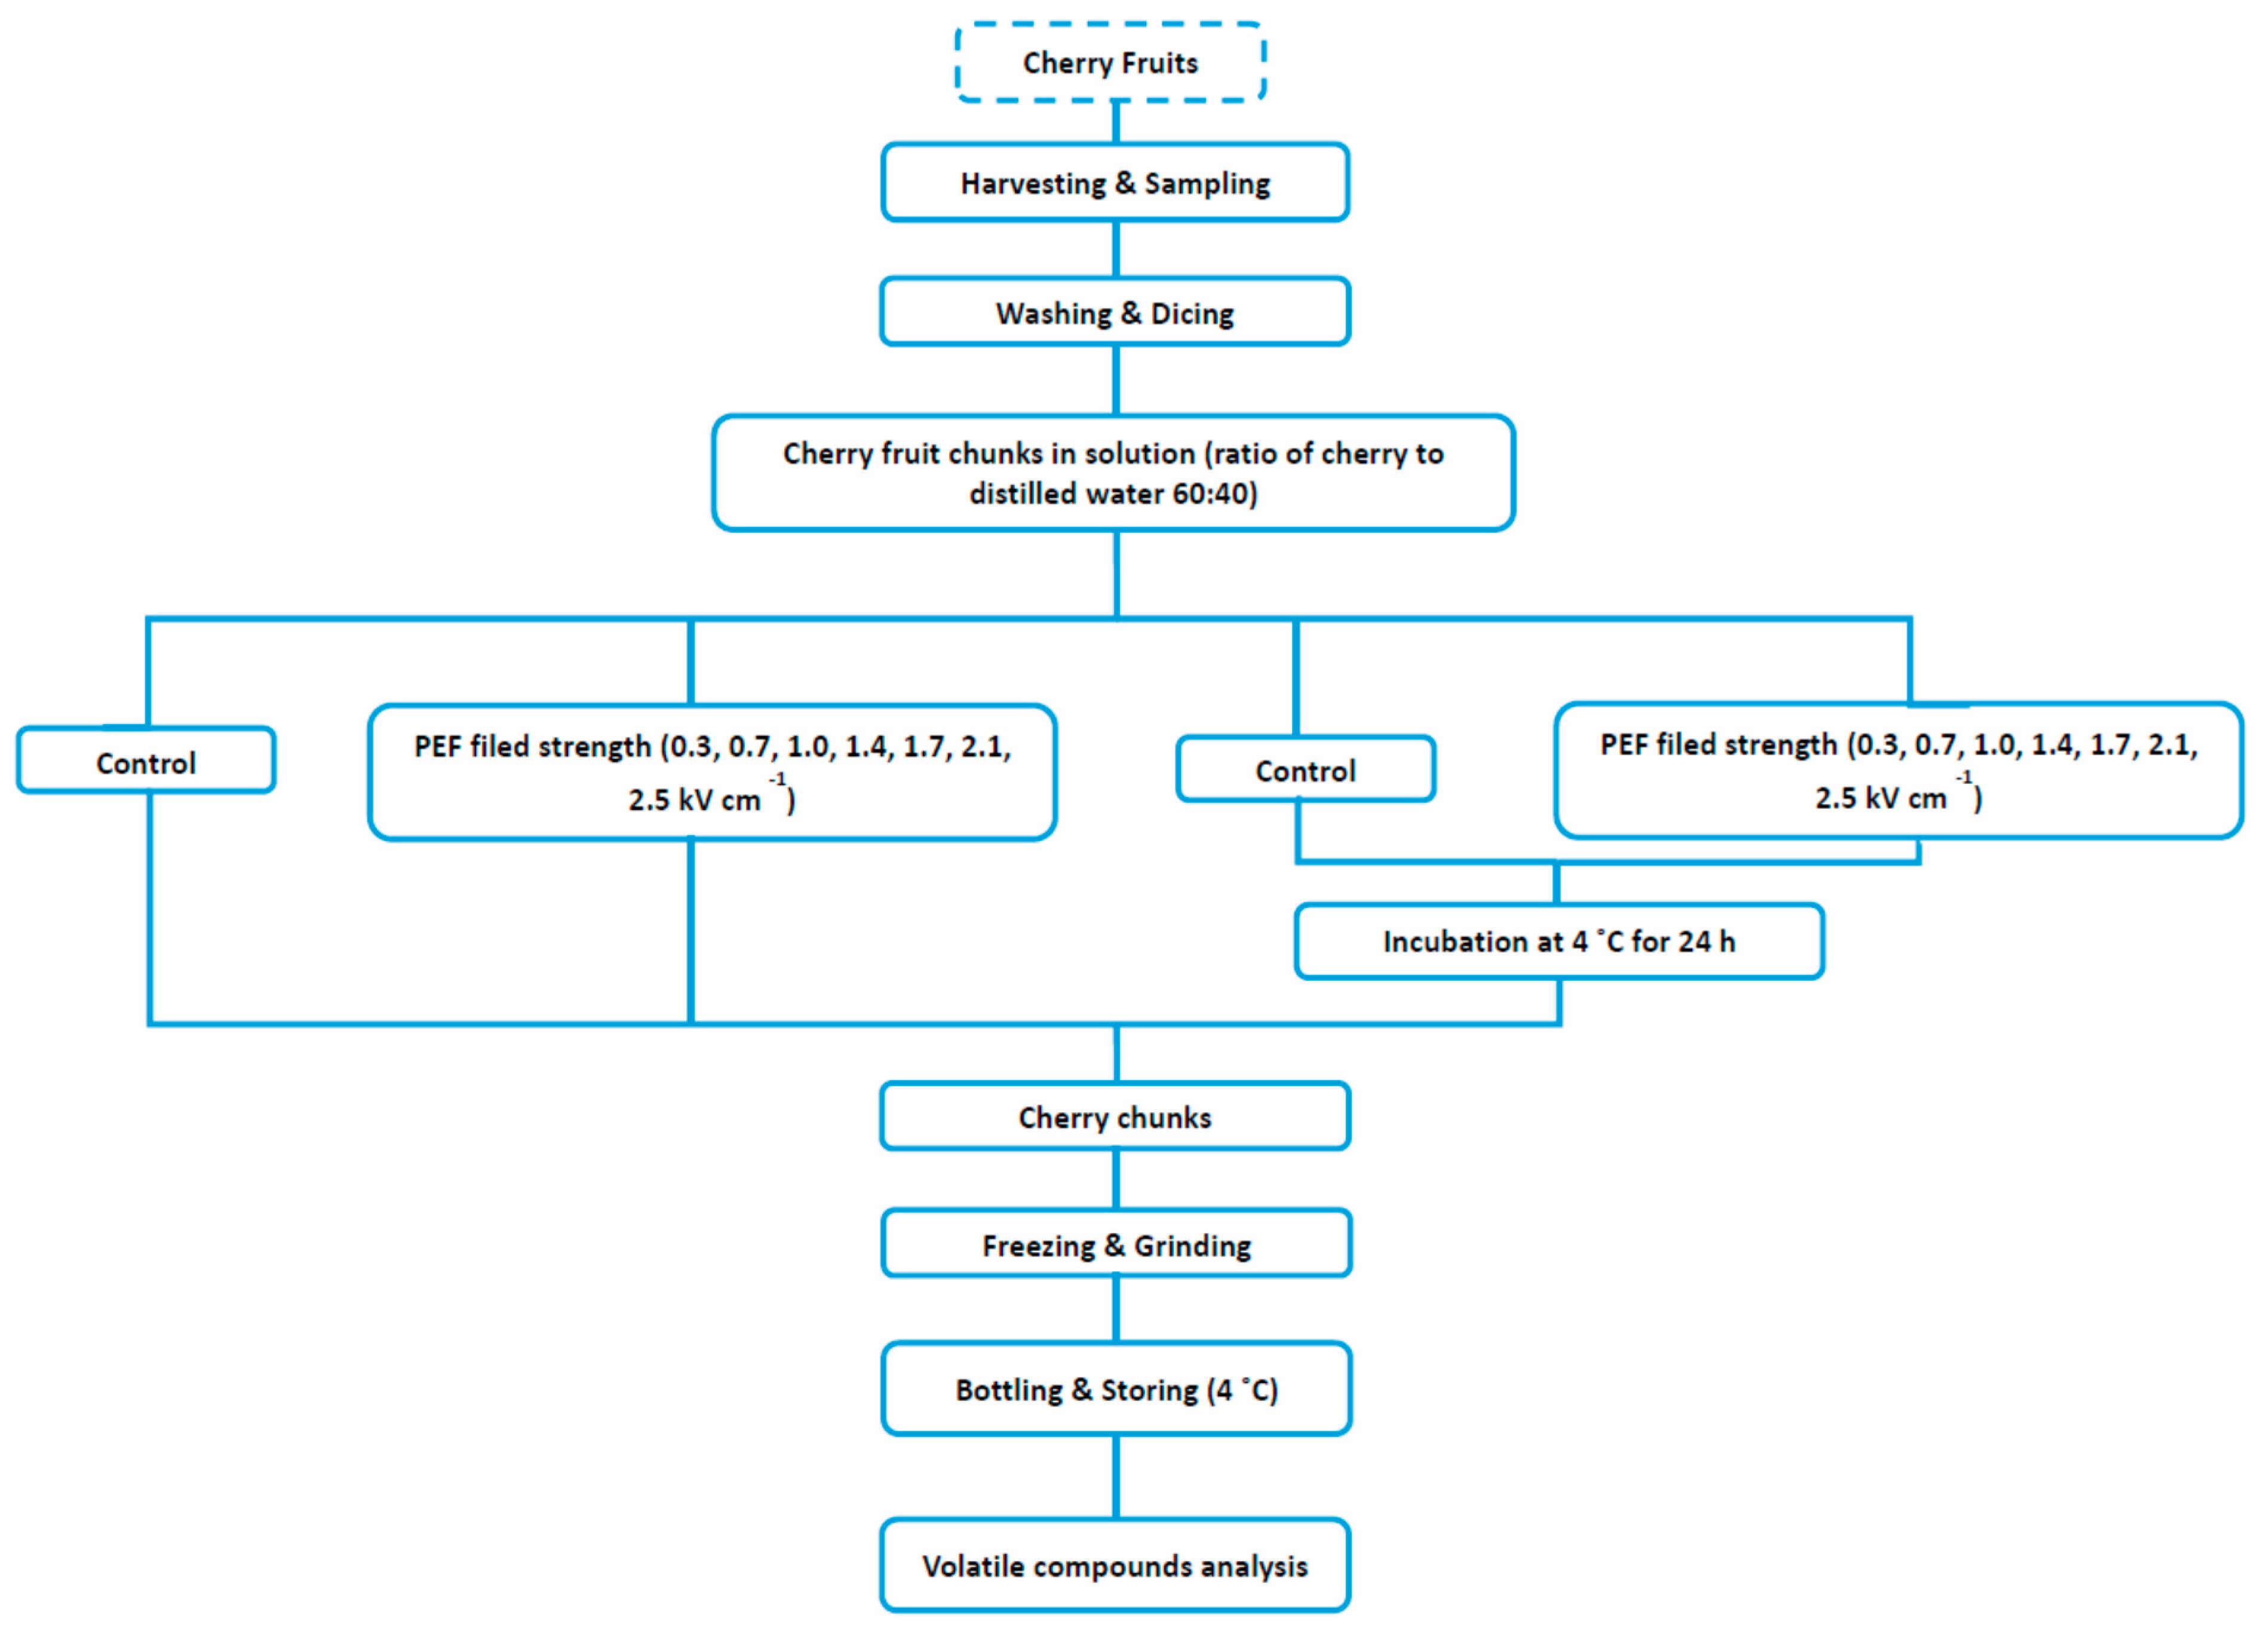
3.1. Cherry Fruits
3.2. Pulsed Electric Field Treatment

| Sample Codes | Electric Field Strength (kV/cm) | Pulse Voltage (kV) | Pulse Number | Calculated Energy (kJ/kg) | Change in Temperature A ΔT (°C) | Change in Conductivity of Chunks in Solution |
|---|---|---|---|---|---|---|
| Samples Immediately after PEF Treatment | ||||||
| S2-P1 | 0.30 ± 0.06 | 2.83 ± 0.06 | 10000 | 39.92 ± 0.10 | 1.90 ± 0.82 a | 1.51 ± 1.03 ab |
| S2-P2 | 0.70 ± 0.00 | 5.50 ± 0.10 | 6100 | 54.75 ± 6.16 | 4.10 ± 1.04 a | 1.60 ± 0.51 ab |
| S2-P3 | 1.00 ± 0.06 | 8.33 ± 0.06 | 2350 | 48.31 ± 1.37 | 0.73 ± 0.42 a | 0.46 ± 3.30 ab |
| S2-P4 | 1.40 ± 0.00 | 11.10 ± 0.10 | 900 | 34.63 ± 1.41 | 0.47 ± 0.87 a | 0.68 ± 1.27 b |
| S2-P5 | 1.70 ± 0.06 | 13.97 ± 0.06 | 720 | 43.22 ± 1.06 | 0.60 ± 1.70 a | 0.77 ± 0.74 b |
| S2-P6 | 2.10 ± 0.00 | 13.63 ± 5.92 | 520 | 41.86 ± 2.16 | 0.10 ± 0.52 a | 0.12 ± 0.46 b |
| S2-P7 | 2.50 ± 0.06 | 19.60 ± 0.10 | 385 | 45.30 ± 1.71 | 0.33 ± 1.92 a | 1.02 ± 1.23 b |
| Samples 24 h after PEF Treatment | ||||||
| S3-P0 | - | - | - | - | Nd | Nd |
| S3-P1 | 0.30 ± 0.06 | 2.77 ± 0.06 | 10000 | 29.80 ± 0.09 | 1.30 ± 1.25 a | 3.59 ± 0.53 a |
| S3-P2 | 0.70 ± 0.00 | 5.43 ± 0.06 | 6100 | 34.43 ± 3.51 | 0.87 ± 1.46 a | 0.81 ± 0.43 b |
| S3-P3 | 1.00 ± 0.06 | 8.30 ± 0.26 | 2350 | 34.26 ± 4.87 | 0.40 ± 4.35 a | 0.26 ± 1.55 b |
| S3-P4 | 1.40 ± 0.06 | 11.47 ± 0.21 | 900 | 30.82 ± 2.26 | 2.10 ± 2.81 a | 1.63 ± 0.60 b |
| S3-P5 | 1.70 ± 0.06 | 14.00 ± 0.17 | 720 | 42.91 ± 2.13 | 0.17 ± 1.10 a | 1.85 ± 0.49 ab |
| S3-P6 | 2.10 ± 0.00 | 16.73 ± 0.15 | 520 | 47.52 ± 2.57 | 1.23 ± 0.68 a | 1.93 ± 0.24 ab |
| S3-P7 | 2.50 ± 0.06 | 19.70 ± 0.30 | 385 | 45.46 ± 4.70 | 1.47 ± 2.90 a | 0.76 ± 0.24 b |
| Control | ||||||
| S1 | - | - | - | - | Nd | Nd |
3.3. GC-MS Coupled with Automated SPME Analysis of Flavour Volatiles
3.3.1. Extraction of Volatiles using Headspace Solid-Phase Microextraction (HS-SPME)
3.3.2. GC-MS Analysis
3.3.3. Multi-Purpose Sampler (MPS)
3.4. Identification of Volatile Compounds
3.5. Statistical Analysis
4. Conclusions
Acknowledgments
Author Contributions
Conflicts of Interest
References
- Di Cagno, R.; Surico, R.F.; Minervini, G.; Rizzello, C.G.; Lovino, R.; Servili, M.; Taticchi, A.; Urbani, S.; Gobbetti, M. Exploitation of sweet cherry (Prunus avium L.) puree added of stem infusion through fermentation by selected autochthonous lactic acid bacteria. Food Microbiol. 2011, 28, 900–909. [Google Scholar]
- Paterson, M. Cherries: An Analysis of Traditional and Dwarf Varieties and Methods, for the Teviot Valley, Central Otago. Available online: http://researcharchive.lincoln.ac.nz/handle/10182/4249 (accessed on 20 March 2015).
- Patras, A.; Brunton, N.P.; da Pieve, S.; Butler, F. Impact of high pressure processing on total antioxidant activity, phenolic, ascorbic acid, anthocyanin content and colour of strawberry and blackberry purées. Innov. Food Sci. Emerg. Technol. 2009, 10, 308–313. [Google Scholar] [CrossRef]
- Serra, A.T.; Seabra, I.J.; Braga, M.E.M.; Bronze, M.R.; de Sousa, H.C.; Duarte, C.M.M. Processing cherries (Prunus avium) using supercritical fluid technology. Part 1: Recovery of extract fractions rich in bioactive compounds. J. Supercrit. Fluids 2010, 55, 184–191. [Google Scholar] [CrossRef]
- Schmid, W.; Grosch, W. Quantitative-analysis of the volatile flavor compounds having high aroma values from sour (prunus-cerasus l) and sweet (prunus-avium l) cherry juices and jams. Z. Lebensm. Unters. Forsch. 1986, 183, 39–44. [Google Scholar] [CrossRef]
- Mattheis, J. Identification of headspace volatile compounds from “bing” sweet cherry fruit. Phytochemistry 1992, 31, 775–777. [Google Scholar] [CrossRef]
- Girard, B.; Kopp, T.G. Physicochemical characteristics of selected sweet cherry cultivars. J. Agric. Food Chem. 1998, 46, 471–476. [Google Scholar] [CrossRef] [PubMed]
- Bernalte, J.M.; Hernandez, T.M.; Vidal, C.M.; Sabio, E. Physical, chemical, flavor and sensory characteristics of two sweet cherry varieties grown in valle del jerte (spain). J. Food Qual. 1999, 22, 403–416. [Google Scholar] [CrossRef]
- Zhang, X.; Jiang, Y.; Peng, F.; He, N.; Li, Y.; Zhao, D. Changes of aroma components in hongdeng sweet cherry during fruit development. Agric. Sci. China 2007, 6, 1376–1382. [Google Scholar] [CrossRef]
- Toepfl, S.; Heinz, V.; Knorr, D. 4—Overview of pulsed electric field processing for food. In Emerging Technologies for Food Processing; Sun, D.-W., Ed.; Academic Press: London, UK, 2005; pp. 69–97. [Google Scholar]
- Zeuthen, P.; Bogh-Sorensen, L. Food Preservation Techniques; Woodhead Publishing Limited and CRC Press LLC: Cambridge, UK, 2003. [Google Scholar]
- Asavasanti, S.; Ristenpart, W.; Stroeve, P.; Barrett, D.M. Permeabilization of plant tissues by monopolar pulsed electric fields: Effect of frequency. J. Food Sci. 2011, 76, E98–E111. [Google Scholar] [CrossRef] [PubMed]
- Toepfl, S. Pulsed Electric Fields (PEF) for Permeabilization of Cell Membranes in Food-and Bioprocessing-Applications, Process and Equipment Design and Cost Analysis. Ph.D. Thesis, Berlin University of Technology, Berlin, Germany, 2006; pp. 59–67. [Google Scholar]
- Tedjo, W.; Eshtiaghi, M.N.; Knorr, D. Einsatz, nicht-thermischer verfahren zur zell-permeabilisierung von weintrauben ung gewinnung von inhaltsstoffen. Fluessiges Obst. 2002, 9, 578–583. [Google Scholar]
- Vallverdú-Queralt, A.; Odriozola-Serrano, I.; Oms-Oliu, G.; Lamuela-Raventós, R.M.; Elez-Martínez, P.; Martín-Belloso, O. Changes in the polyphenol profile of tomato juices processed by pulsed electric fields. J. Agric. Food Chem. 2012, 60, 9667–9672. [Google Scholar] [CrossRef] [PubMed]
- Balasa, A.; Toepfl, S.; Knorr, D. Pulsed Electric Field Treatment of Grapes; Food Factory of the Future 3: Gothenburg, Sweden, 2006. [Google Scholar]
- Guderjan, M.; Töpfl, S.; Angersbach, A.; Knorr, D. Impact of pulsed electric field treatment on the recovery and quality of plant oils. J. Food Eng. 2005, 67, 281–287. [Google Scholar] [CrossRef]
- Vallverdú-Queralt, A.; Bendini, A.; Barbieri, S.; di Lecce, G.; Martin-Belloso, O.; Toschi, T.G. Volatile profile and sensory evaluation of tomato juices treated with pulsed electric fields. J. Agric. Food Chem. 2013, 61, 1977–1984. [Google Scholar] [CrossRef] [PubMed]
- Aguiló-Aguayo, I.; Montero-Calderón, M.; Soliva-Fortuny, R.; Martín-Belloso, O. Changes on flavor compounds throughout cold storage of watermelon juice processed by high-intensity pulsed electric fields or heat. J. Food Eng. 2010, 100, 43–49. [Google Scholar] [CrossRef]
- Aguiló-Aguayo, I.; Oms-Oliu, G.; Soliva-Fortuny, R.; Martín-Belloso, O. Flavour retention and related enzyme activities during storage of strawberry juices processed by high-intensity pulsed electric fields or heat. Food Chem. 2009, 116, 59–65. [Google Scholar] [CrossRef]
- Cserhalmi, Z.; Sass-Kiss, Á.; Tóth-Markus, M.; Lechner, N. Study of pulsed electric field treated citrus juices. Innov. Food Sci. Emerg. Technol. 2006, 7, 49–54. [Google Scholar] [CrossRef]
- Aguilar-Rosas, S.F.; Ballinas-Casarrubias, M.L.; Nevarez-Moorillon, G.V.; Martin-Belloso, O.; Ortega-Rivas, E. Thermal and pulsed electric fields pasteurization of apple juice: Effects on physicochemical properties and flavour compounds. J. Food Eng. 2007, 83, 41–46. [Google Scholar] [CrossRef]
- Zhang, Y.I.; Gao, B.E.I.; Zhang, M.; Shi, J.; Xu, Y. Pulsed electric field processing effects on physicochemical properties, flavor compounds and microorganisms of longan juice. J. Food Process. Preserv. 2010, 34, 1121–1138. [Google Scholar] [CrossRef]
- Yeom, H.W.; Streaker, C.B.; Zhang, Q.H.; Min, D.B. Effects of pulsed electric fields on the quality of orange juice and comparison with heat pasteurization. J. Agric. Food Chem. 2000, 48, 4597–4605. [Google Scholar] [CrossRef] [PubMed]
- Ayhan, Z.; Yeom, H.W.; Zhang, Q.H.; Min, D.B. Flavor, color, and vitamin c retention of pulsed electric field processed orange juice in different packaging materials. J. Agric. Food Chem. 2001, 49, 669–674. [Google Scholar] [CrossRef] [PubMed]
- Min, S.; Jin, Z.T.; Min, S.K.; Yeom, H.; Zhang, Q.H. Commercial-scale pulsed electric field processing of orange juice. J. Food Sci. 2003, 68, 1265–1271. [Google Scholar] [CrossRef]
- Jia, M.; Howard Zhang, Q.; Min, D.B. Pulsed electric field processing effects on flavor compounds and microorganisms of orange juice. Food Chem. 1999, 65, 445–451. [Google Scholar] [CrossRef]
- Mattheis, J.P.; Buchanan, D.A.; Fellman, J.K. Volatile constituents of bing sweet cherry fruit following controlled atmosphere storage. J. Agric. Food Chem. 1997, 45, 212–216. [Google Scholar] [CrossRef]
- Sun, S.Y.; Jiang, W.G.; Zhao, Y.P. Characterization of the aroma-active compounds in five sweet cherry cultivars grown in Yantai (China). Flavour Fragr. J. 2010, 25, 206–213. [Google Scholar] [CrossRef]
- Salinas, M.; Zalacain, A.; Pardo, F.; Alonso, G.L. Stir bar sorptive extraction applied to volatile constituents evolution during vitis vinifera ripening. J. Agric. Food Chem. 2004, 52, 4821–4827. [Google Scholar] [CrossRef] [PubMed]
- Paillard, N.M.M.; Rouri, O. Production des aldehydes en C6, hexanal et 2-hexenal, par des tissus de pommes broyes. Lebensm. Wiss. Technol. 1984, 17, 345–350. [Google Scholar]
- Toepfl, S.; Mathys, A.; Heinz, V.; Knorr, D. Review: Potential of high hydrostatic pressure and pulsed electric fields for energy efficient and environmentally friendly food processing. Food Rev. Int. 2006, 22, 405–423. [Google Scholar] [CrossRef]
- Serradilla, M.J.; Martín, A.; Hernandez, A.; López-Corrales, M.; Lozano, M.; Córdoba, M.D.G. Effect of the commercial ripening stage and postharvest storage on microbial and aroma changes of “ambrunés” sweet cherries. J. Agric. Food Chem. 2010, 58, 9157–9163. [Google Scholar] [CrossRef] [PubMed]
- Wen, Y.-Q.; He, F.; Zhu, B.-Q.; Lan, Y.-B.; Pan, Q.-H.; Li, C.-Y.; Reeves, M.J.; Wang, J. Free and glycosidically bound aroma compounds in cherry (Prunus avium L.). Food Chem. 2014, 152, 29–36. [Google Scholar] [CrossRef] [PubMed]
- Zhang, Q.; Barbosa-Cánovas, G.V.; Swanson, B.G. Engineering aspects of pulsed electric field pasteurization. J. Food Eng. 1995, 25, 261–281. [Google Scholar] [CrossRef]
- Morris, A.S. Measurement and Instrumentation Principles, 3rd ed.; Butterworth-Heinemann: Oxford, UK, 2001; pp. 16–37. [Google Scholar]
- NIST Chemistry WebBook. NIST Standard Reference Database Number 69. Available online: http://webbook.nist.gov/chemistry/ (accessed on 5 September 2014).
- Sample Availability: Not available.
© 2015 by the authors. Licensee MDPI, Basel, Switzerland. This article is an open access article distributed under the terms and conditions of the Creative Commons Attribution license ( http://creativecommons.org/licenses/by/4.0/).
Share and Cite
Sotelo, K.A.G.; Hamid, N.; Oey, I.; Gutierrez-Maddox, N.; Ma, Q.; Leong, S.Y. Effect of Pulsed Electric Fields on the Flavour Profile of Red-Fleshed Sweet Cherries (Prunus avium var. Stella). Molecules 2015, 20, 5223-5238. https://doi.org/10.3390/molecules20035223
Sotelo KAG, Hamid N, Oey I, Gutierrez-Maddox N, Ma Q, Leong SY. Effect of Pulsed Electric Fields on the Flavour Profile of Red-Fleshed Sweet Cherries (Prunus avium var. Stella). Molecules. 2015; 20(3):5223-5238. https://doi.org/10.3390/molecules20035223
Chicago/Turabian StyleSotelo, Kristine Ann Gualberto, Nazimah Hamid, Indrawati Oey, Noemi Gutierrez-Maddox, Qianli Ma, and Sze Ying Leong. 2015. "Effect of Pulsed Electric Fields on the Flavour Profile of Red-Fleshed Sweet Cherries (Prunus avium var. Stella)" Molecules 20, no. 3: 5223-5238. https://doi.org/10.3390/molecules20035223
APA StyleSotelo, K. A. G., Hamid, N., Oey, I., Gutierrez-Maddox, N., Ma, Q., & Leong, S. Y. (2015). Effect of Pulsed Electric Fields on the Flavour Profile of Red-Fleshed Sweet Cherries (Prunus avium var. Stella). Molecules, 20(3), 5223-5238. https://doi.org/10.3390/molecules20035223