
Helleborus purpurascens—Amino Acid and Peptide Analysis Linked to the Chemical and Antiproliferative Properties of the Extracted Compounds


Abstract
:
1. Introduction
2. Results and Discussion
2.1. HPLC Analysis

| Hellebore Fraction | Amino Acids | Retention Time (Tr) (min) | Peak Area (mAu·min) | Peak High (mAu) | Relative Area |
|---|---|---|---|---|---|
| S1 (ethanolic) | Cys | 6.319 | 19.7050 | 48.247 | 12.79 |
| His | 7.21 | 0.6849 | 13.520 | 5.00 | |
| Phe | 7.978 | 9.4757 | 15.515 | 6.15 | |
| Thr | 8.923 | 0.9001 | 3.720 | 5.95 | |
| Glu | 9.958 | 6.4976 | 10.478 | 4.22 | |
| Asn | 22.301 | 108.2632 | 130.637 | 88.89 | |
| Ala | 32.290 | 117.4534 | 110.475 | 76.25 | |
| S4 (CH2Cl2) | Gly | 6.987 | 0.7801 | 3.567 | 2.39 |
| His | 7.21 | 0.85 | 14.359 | 4.23 | |
| Phe | 7.89 | 7.854 | 21.464 | 6.43 | |
| Glu | 9.958 | 6.891 | 11.872 | 5.27 | |
| Ser | 12.892 | 1.5890 | 9.671 | 13.561 | |
| Asn | 22.301 | 9.376 | 5.701 | 8.429 | |
| Pro | 29.862 | 1.8539 | 2.257 | 23.13 | |
| Ala | 32.290 | 0.9369 | 1.457 | 9.22 | |
| Lys | 35.802 | 3.2473 | 3.401 | 19.28 | |
| Tyr | 39.347 | 0.5518 | 0.743 | 8.37 | |
| S5 (n-butanol) | Gly | 6.987 | 8.627 | 8.672 | 10.391 |
| His | 7.21 | 0.9138 | 12.188 | 14.57 | |
| Phe | 7.978 | 5.624 | 9.297 | 4.61 | |
| Glu | 9.958 | 0.5390 | 0.948 | 7.94 | |
| Arg | 13.680 | 0.5313 | 0.860 | 17.19 | |
| Val | 25.068 | 0.7673 | 0.754 | 14.83 | |
| Ala | 32.523 | 0.3391 | 0.382 | 9.97 | |
| Lys | 35.802 | 3.287 | 11.720 | 8.134 | |
| Tyr | 39.347 | 10.346 | 23.581 | 12.365 | |
| S6 (aqueous) | C-C | 6.198 | 12.0542 | 59.209 | 6.52 |
| Phe | 7.978 | 27.659 | 56.375 | 29.991 | |
| Asp | 23.546 | 15.7821 | 121.368 | 8.53 | |
| Ala | 32.523 | 157.0749 | 139.018 | 54.95 |
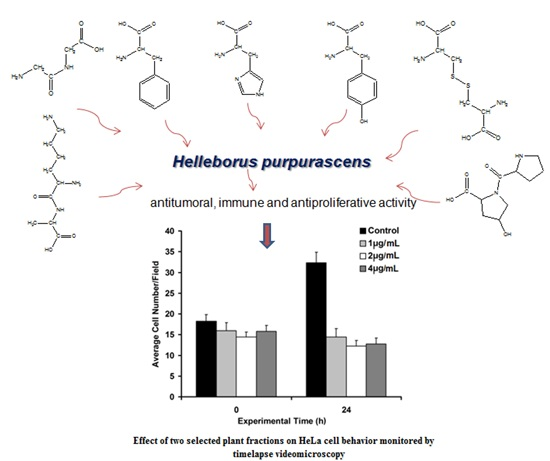
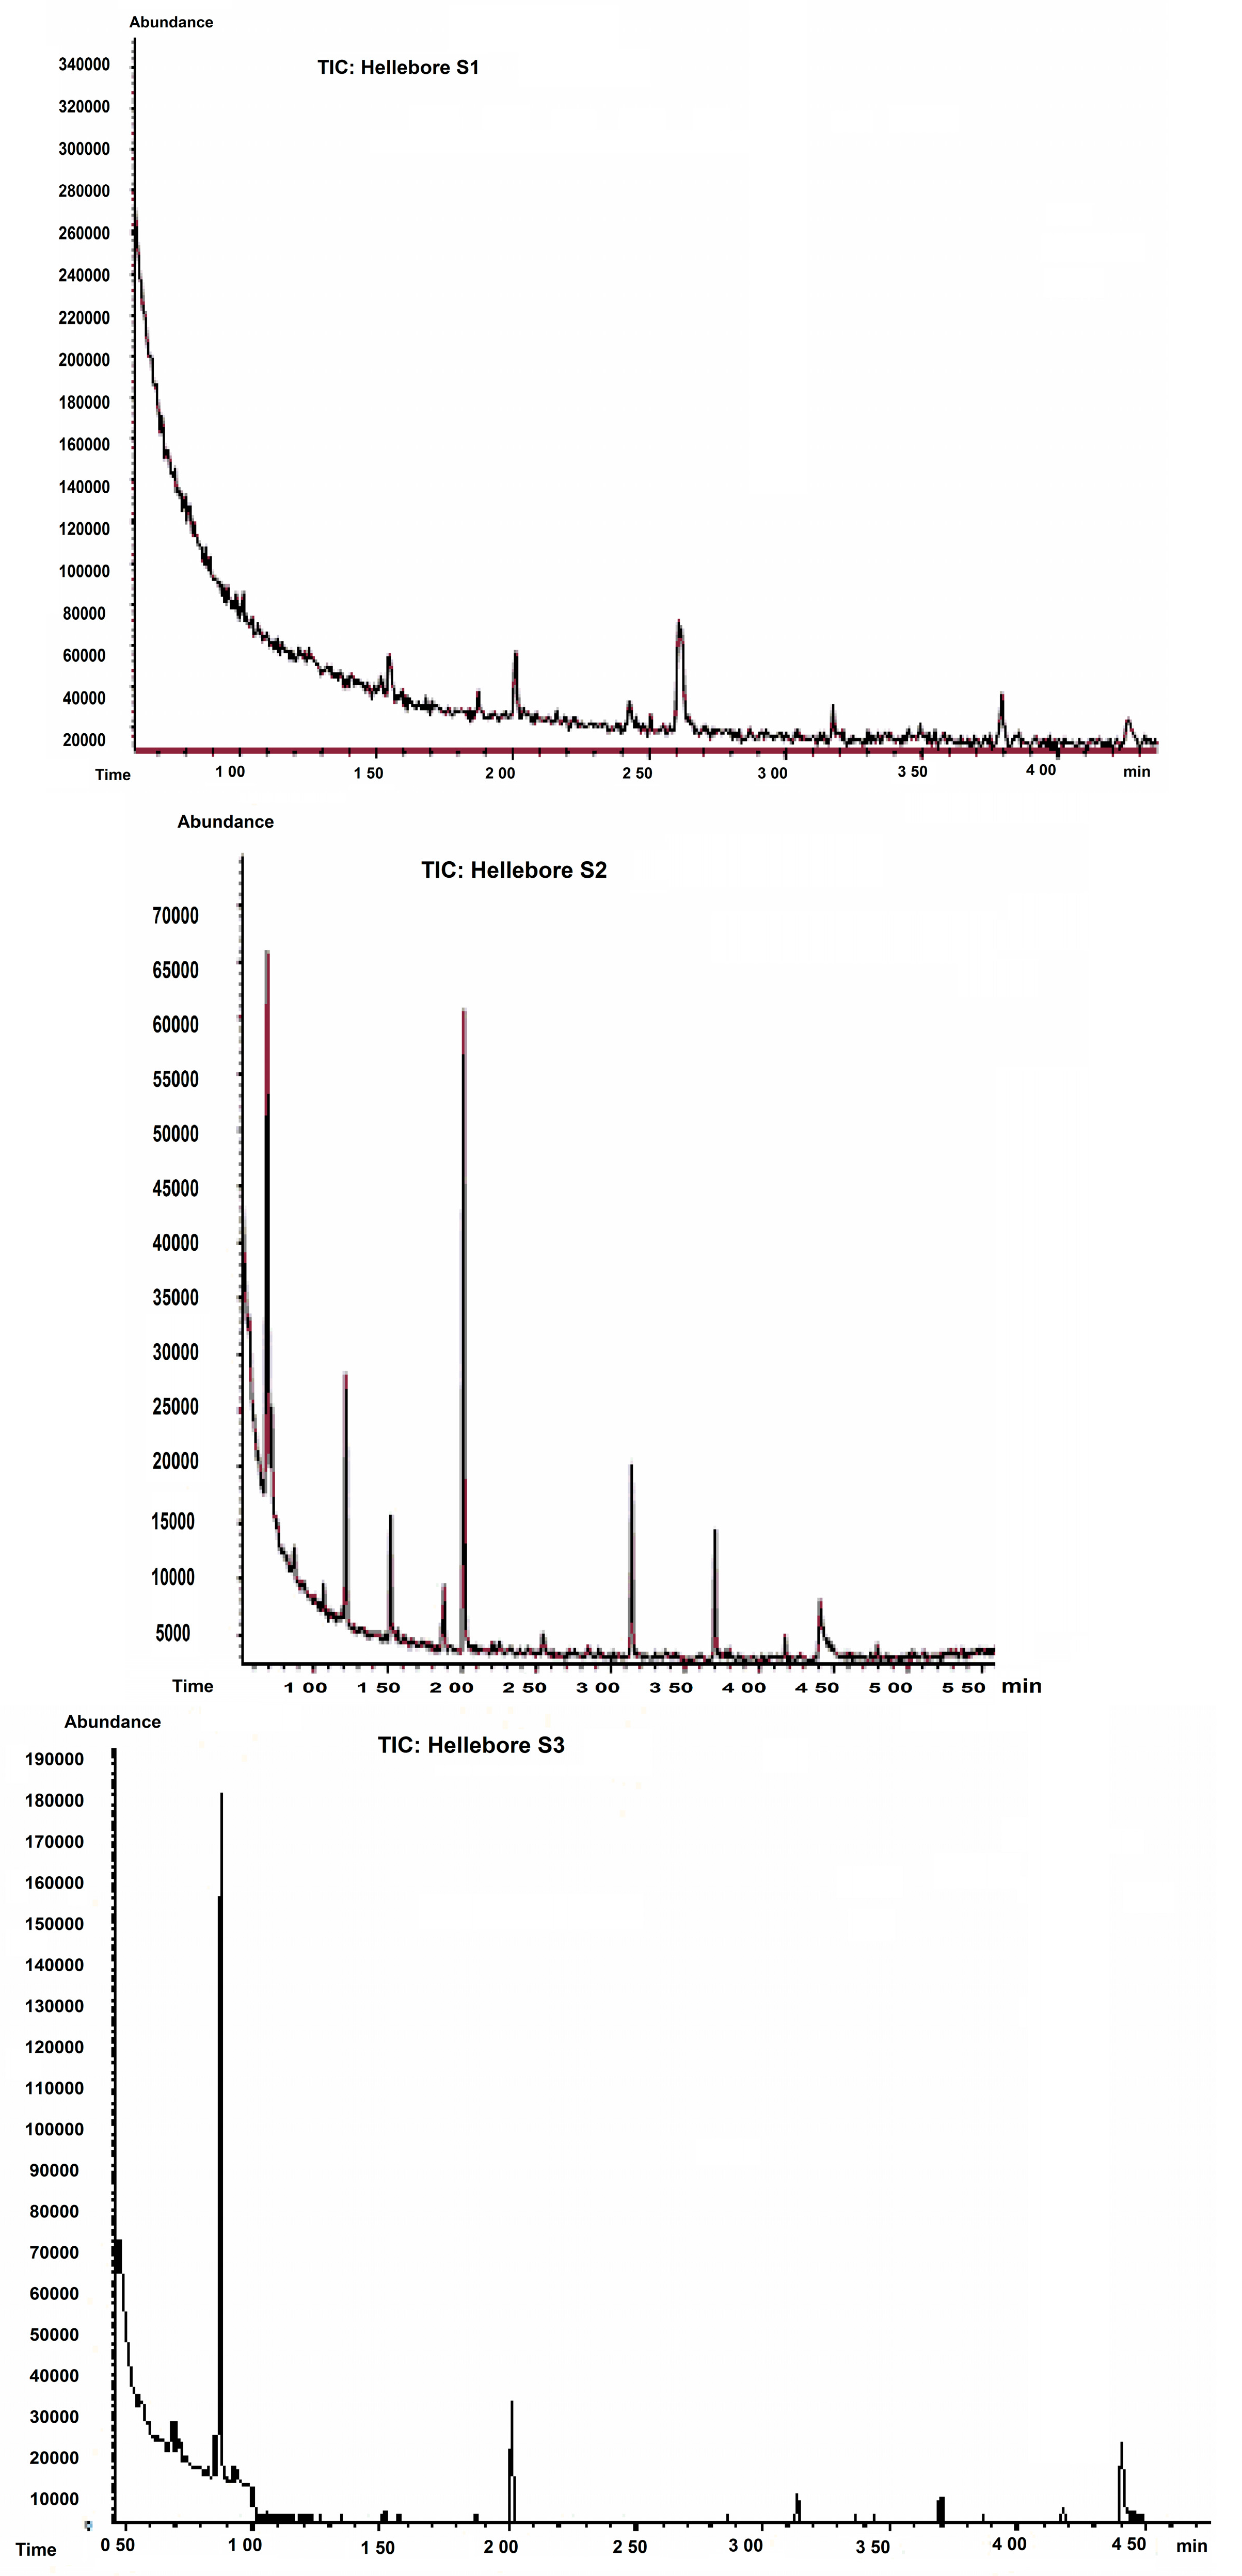
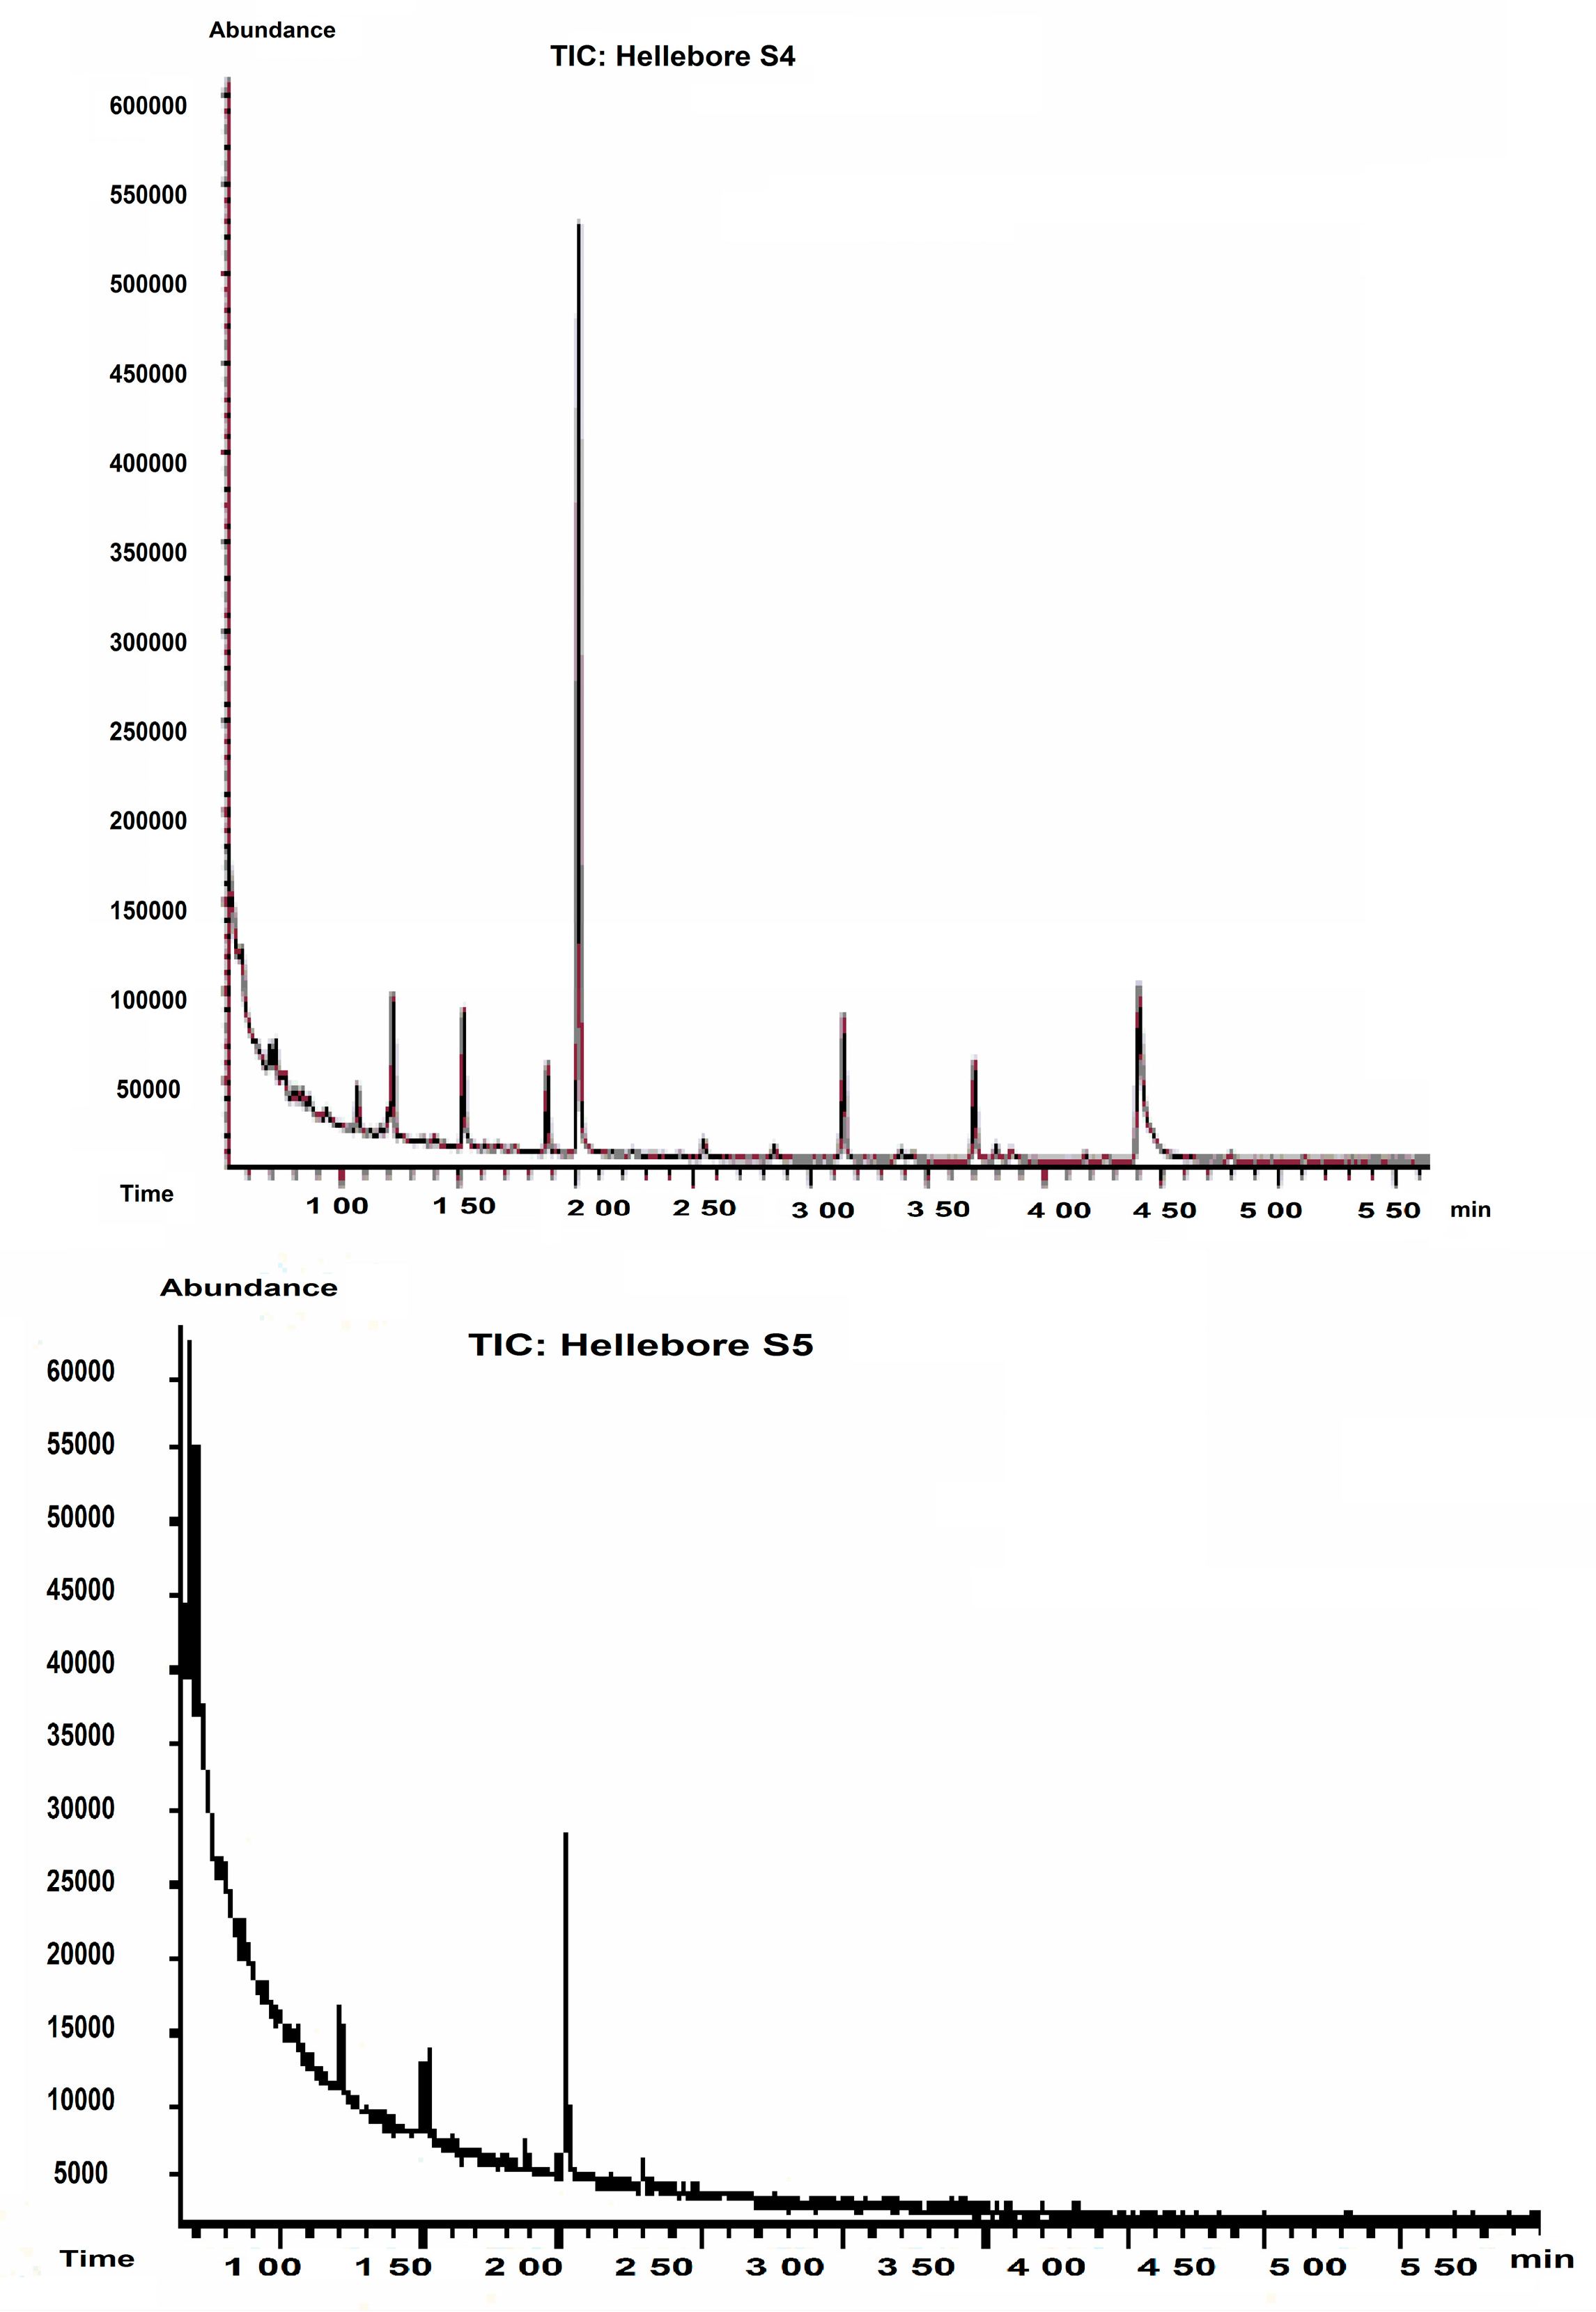
2.2. GC-MS Analysis
| Hellebore Fraction | Proposed Structure | Abbreviation | SIM (Selected-Ion Monitoring) |
|---|---|---|---|
| S1 (ethanol) | cystine | C-C | 41, 42 |
| glutamic acid | Glu | 38, 40 | |
| phenylalanine | Phe | 56, 57 | |
| hystidine | Hys | 84 | |
| asparagine | Asn | 155, 69 | |
| isoleucine | Ile | 170, 130 | |
| threonine | Thr | 180 | |
| β-alanine | β-Ala | 216, 129 | |
| S2 (hexane) | glutamic acid | Glu | 38, 40 |
| cystine | C-C | 41, 42 | |
| ornitine | Orn | 59, 60, 61 | |
| isoleucine | Ile | 170, 130 | |
| hystidine | Hys | 84 | |
| proline | Pro | 211 | |
| valine | Val | 158, 72 | |
| β-alanine | β-Ala | 216, 129 | |
| threonine | Thr | 180 | |
| homoserine | HSER | 102, 128, 143 | |
| asparagine | Asn | 155, 69 | |
| α-aminopimelic acid | APA | 198, 258, 286 | |
| arginino-succinic acid | ARG-SUC | 326 | |
| S3 (CCl4) | asparagine | Asn | 155, 69 |
| alanine | Ala | 130, 70 | |
| glutamic acid | Glu | 38, 40 | |
| phenylalanine | Phe | 59, 60 | |
| homoserine | HSER | 102, 128, 143 | |
| threonine | Thr | 180 | |
| lysine | Lys | 170, 129 | |
| glicine | Gly | 116, 74 | |
| glycyl-glycine (dipeptide) | Gly-Gly | 117, 144, 201 | |
| proline-hydroxyproline (dipeptide) | PHP | 156, 186 | |
| lysine-alanine (dipeptide) | Lys-Ala | 170, 224, 153 | |
| hystidine | Hys | 84 | |
| 2,4-diamino-n-butyric acid | DABA | 203, 142, 245 | |
| 1-methylhistidine | 1MHIS | 298 | |
| arginino-succinic acid | ARG-SUC | 326 | |
| α-aminopimelic acid | APA | 198, 258, 286 | |
| S4 (CH2Cl2) | valine | Val | 158, 72 |
| β-alanine | β-Ala | 216, 129 | |
| isoleucine | Ile | 170, 130 | |
| glutamic acid | Glu | 38, 40 | |
| phenylalanine | Phe | 59, 60 | |
| serine | Ser | 146,9 | |
| tyrosine | Tyr | 61, 63 | |
| proline-hydroxyproline (dipeptide) | PHP | 156, 186 | |
| lysine | Lys | 170, 129 | |
| glycine | Gly | 116, 74 | |
| glutamine | Gln | 83, 186 | |
| hystidine | His | 84 | |
| asparagine | Asn | 155, 69 | |
| S5 (n-butanol) | glutamic acid | Glu | 38, 40 |
| phenylalanine | Phe | 59, 60, 76 | |
| tyrosine | Tyr | 61, 63, 94 | |
| hystidine | His | 84, 115 | |
| glycine | Gly | 116, 74 | |
| lysine | Lys | 170, 129 | |
| valine | Val | 158, 72 |


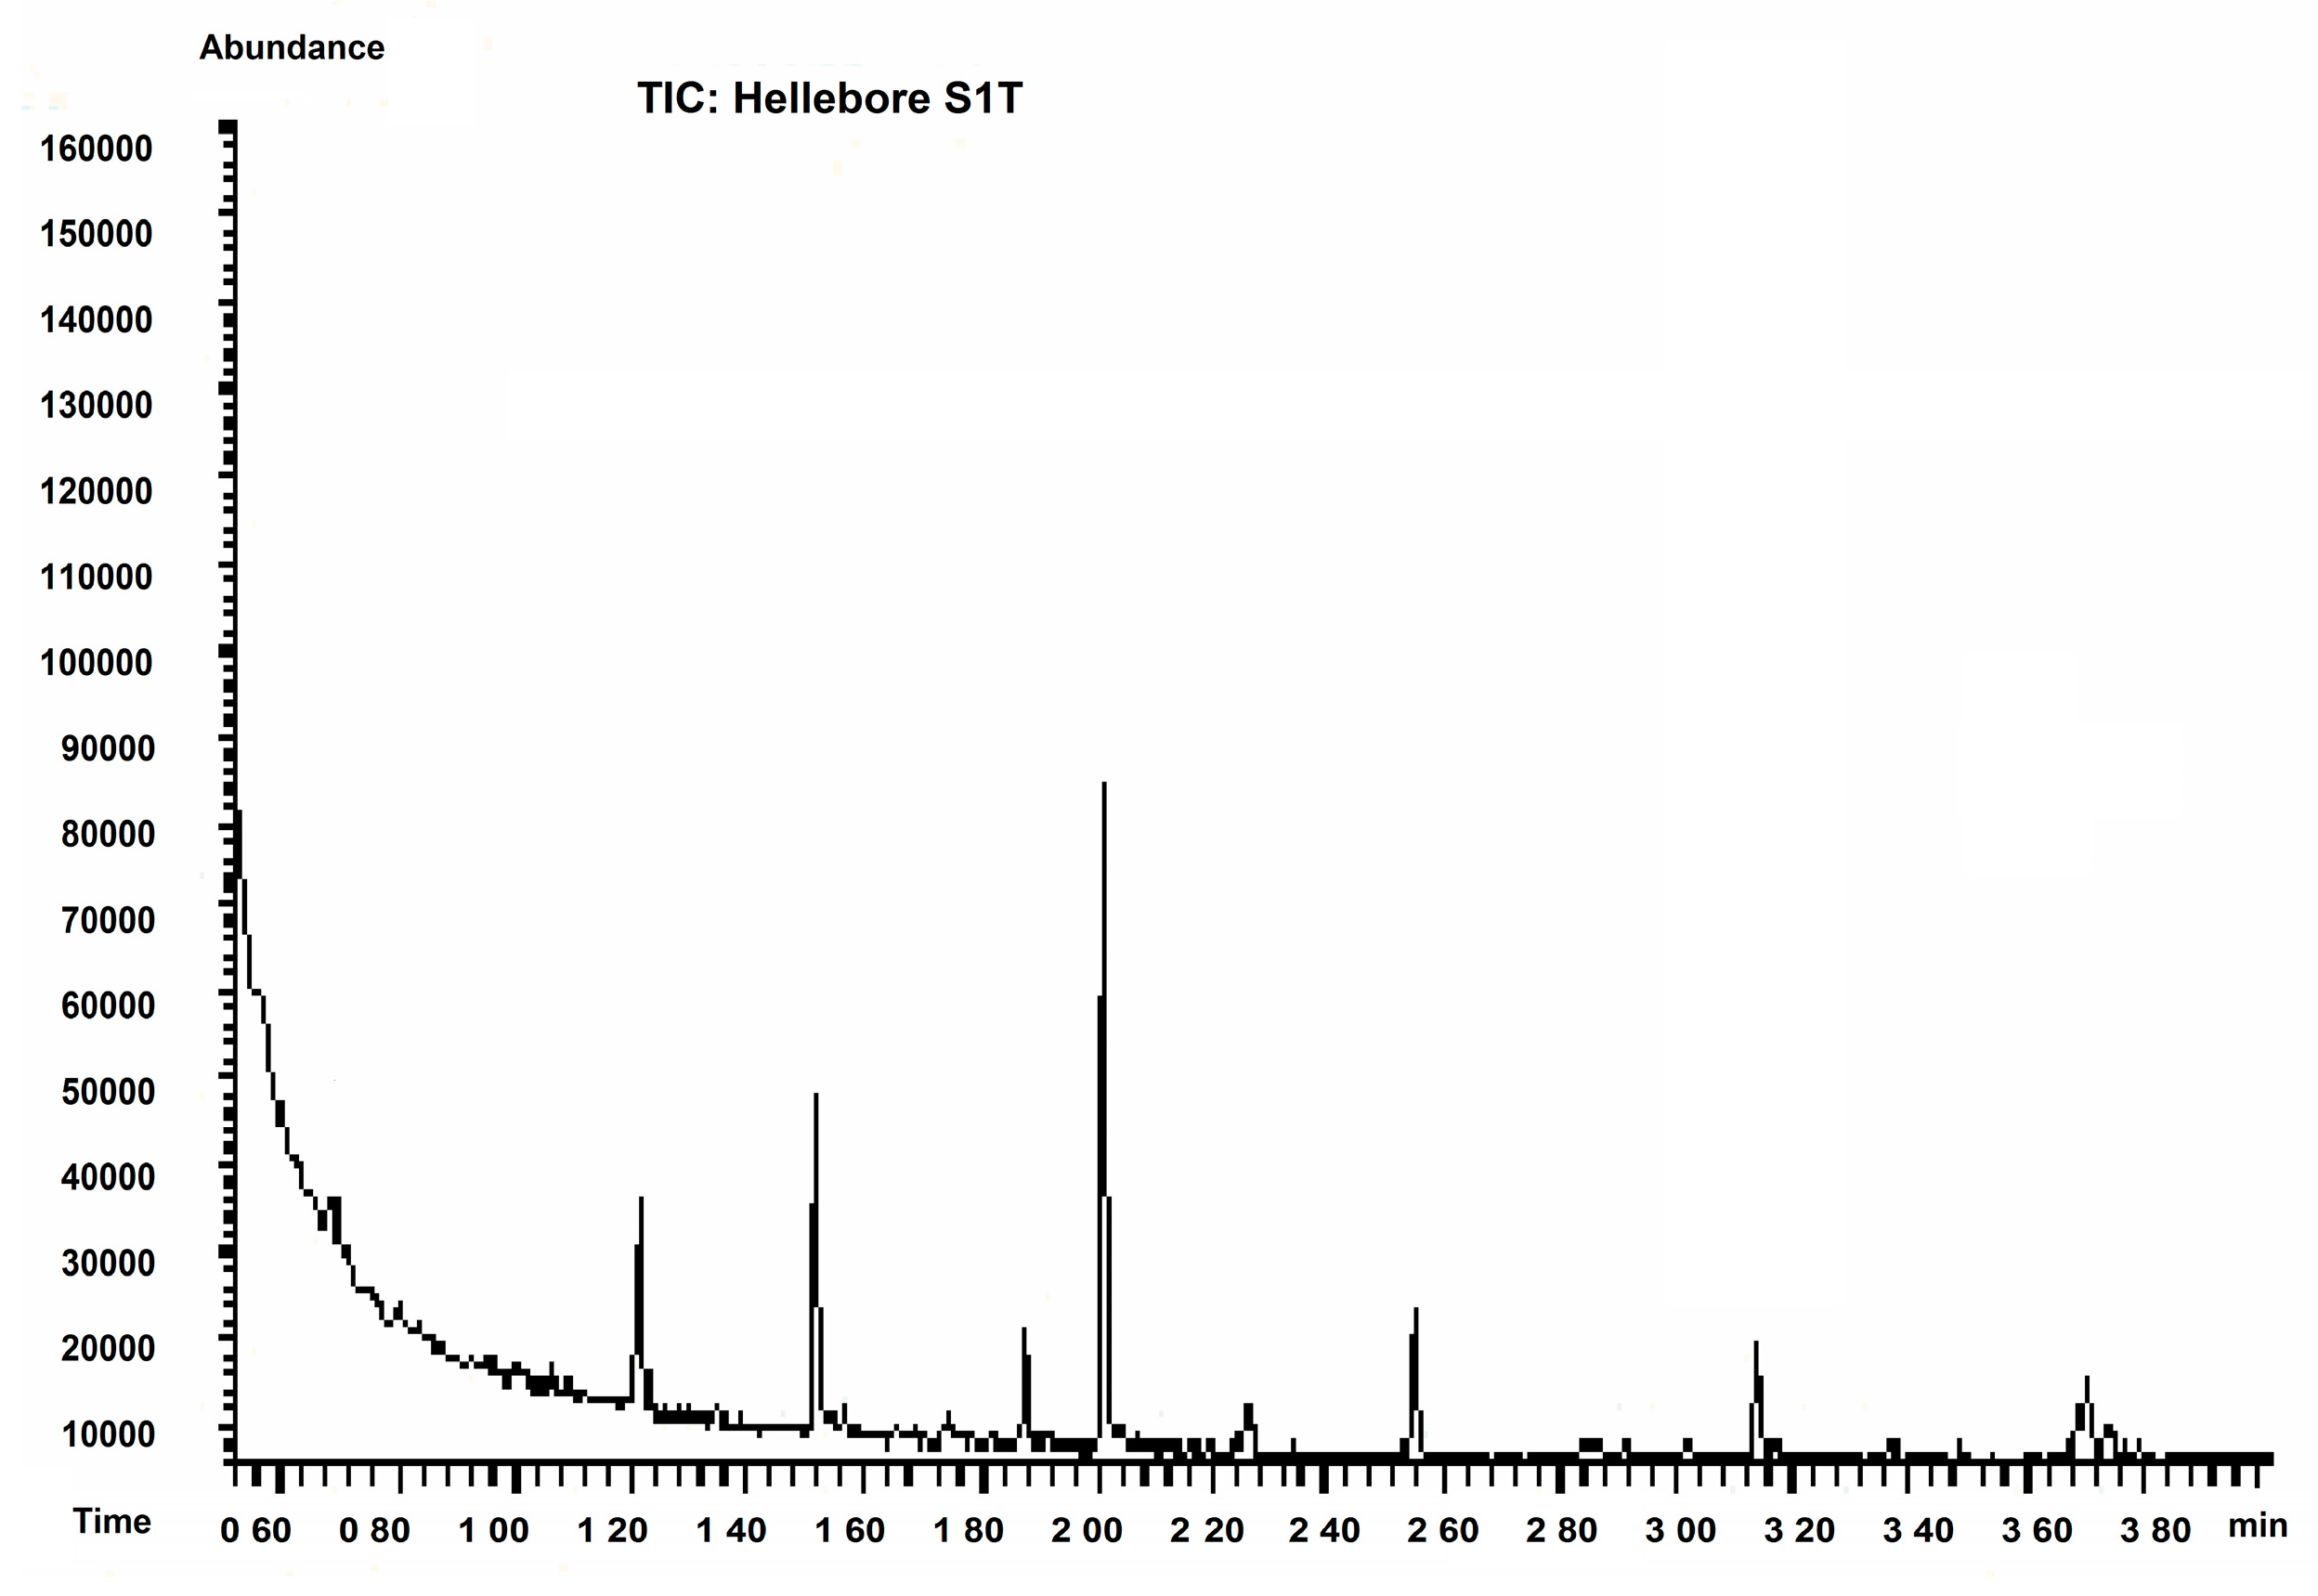
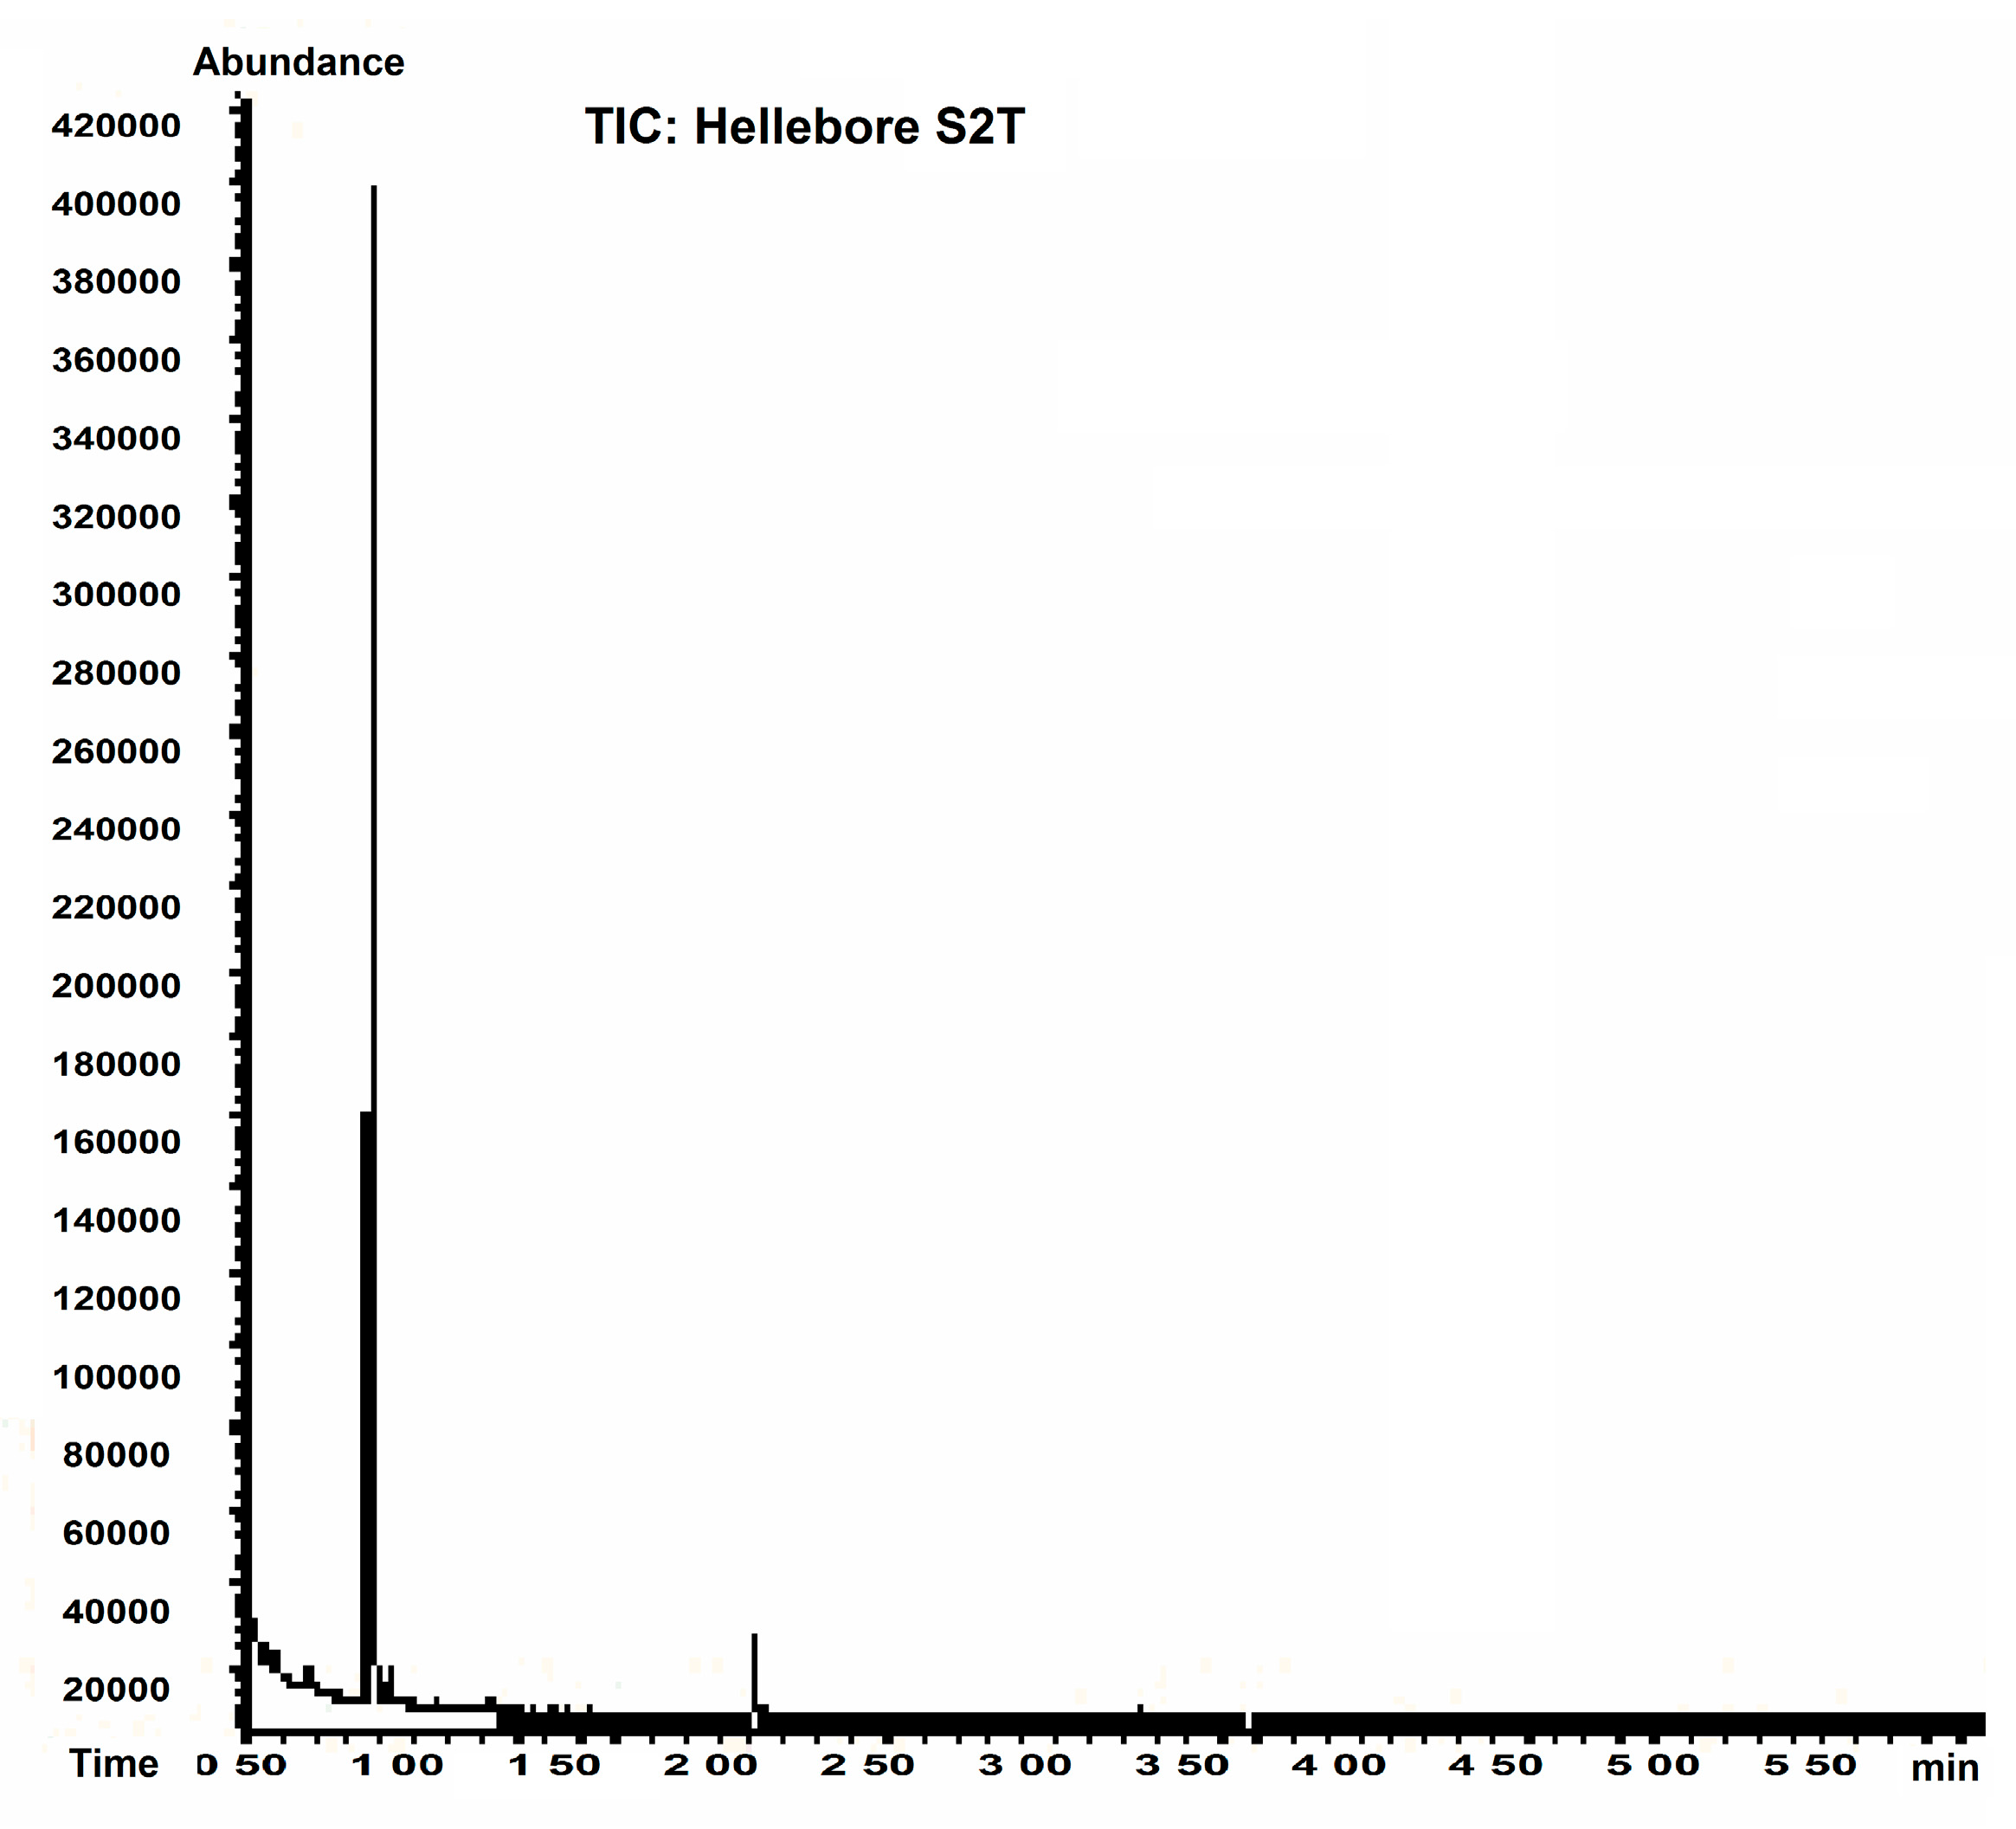
2.3. Hellebore Thionins Characterized by GC-MS


| Hellebore Fraction | Proposed Structure | Abbreviation | SIM |
|---|---|---|---|
| S1T (petroleum ether) | cystine | C-C | 41, 42 |
| histidine | His | 84, 115 | |
| tyrosine | Tyr | 61, 63, 94 | |
| lysine | Lys | 170, 129 | |
| homoserine | HSER | 102, 128, 143 | |
| β-alanine | β-Ala | 216, 129 | |
| leucine | Leu | 172, 86 | |
| phenylalanine | Phe | 59, 60, 76 | |
| glutamic acid | Glu | 38, 40 | |
| glycine | Gly | 116, 74 | |
| 3-methylcysteine | - | 172, 259, 130 | |
| proline-hydroxyproline (dipeptide) | PHP | 156, 186 | |
| S2T (acetone) | cystine | C-C | 41, 42 |
| glutamic acid | Glu | 38, 40 | |
| tyrosine | Tyr | 61, 63, 94 | |
| valine | Val | 158, 72 | |
| β-alanine | β-Ala | 216, 129 | |
| phenylalanine | Phe | 59, 60, 76 |
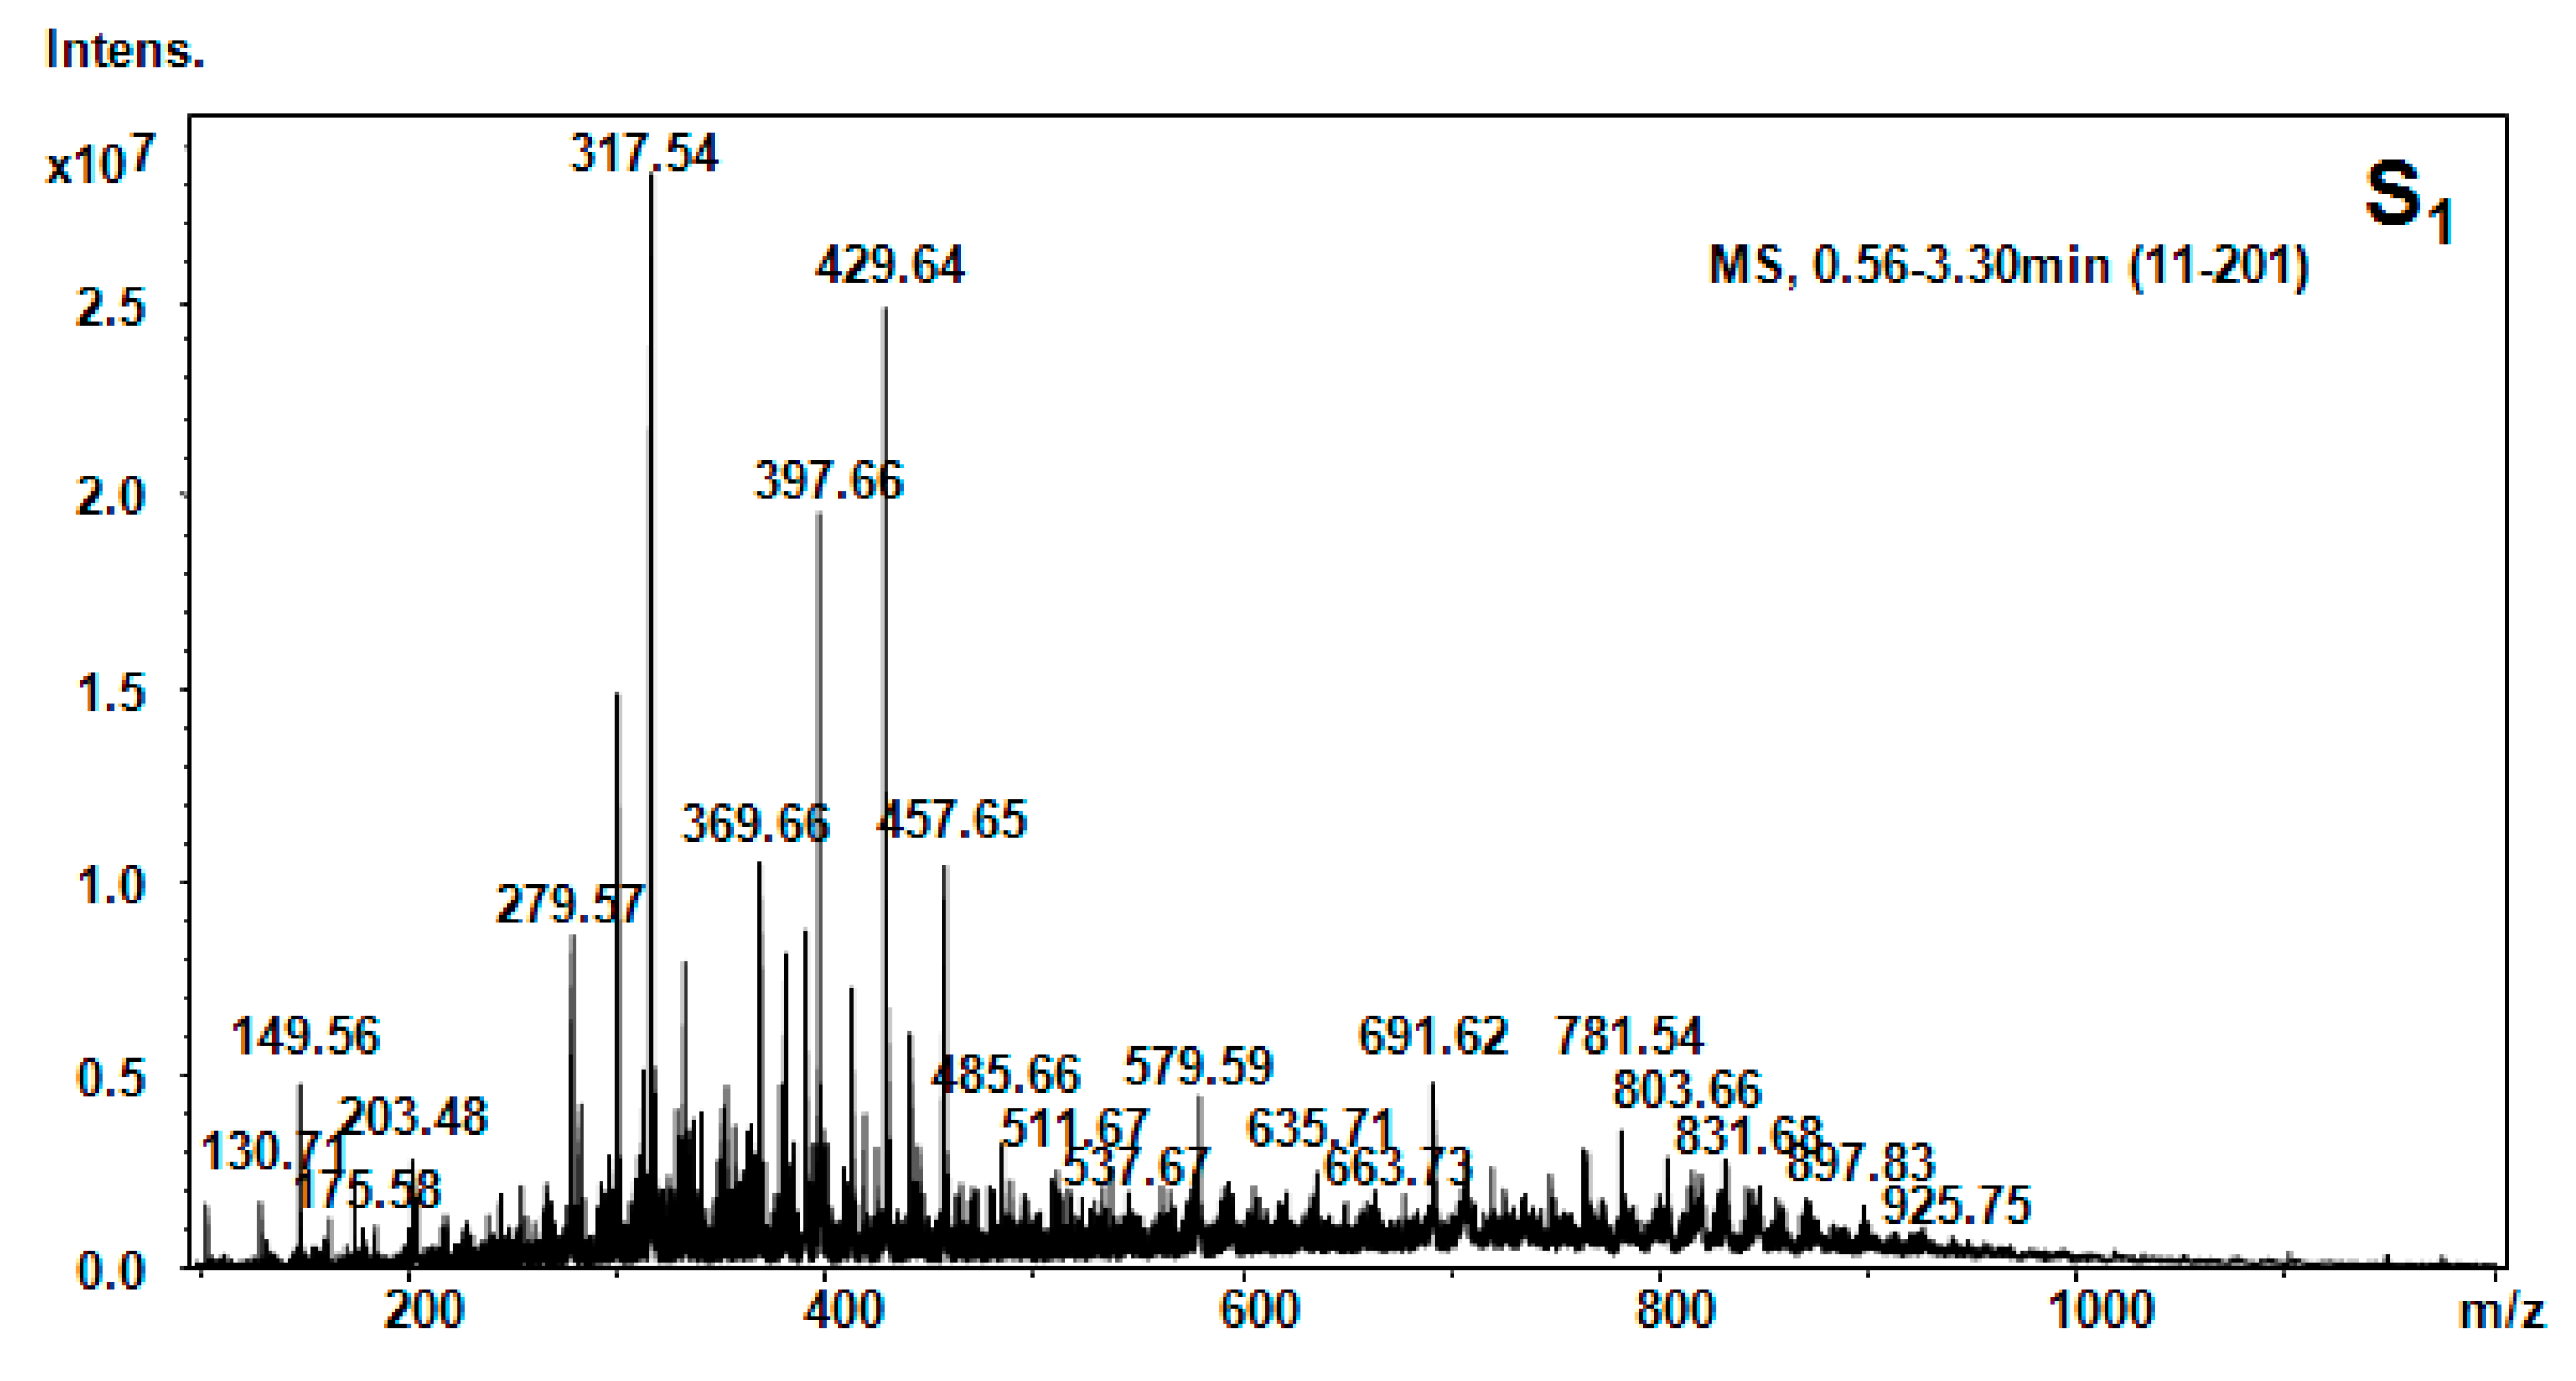
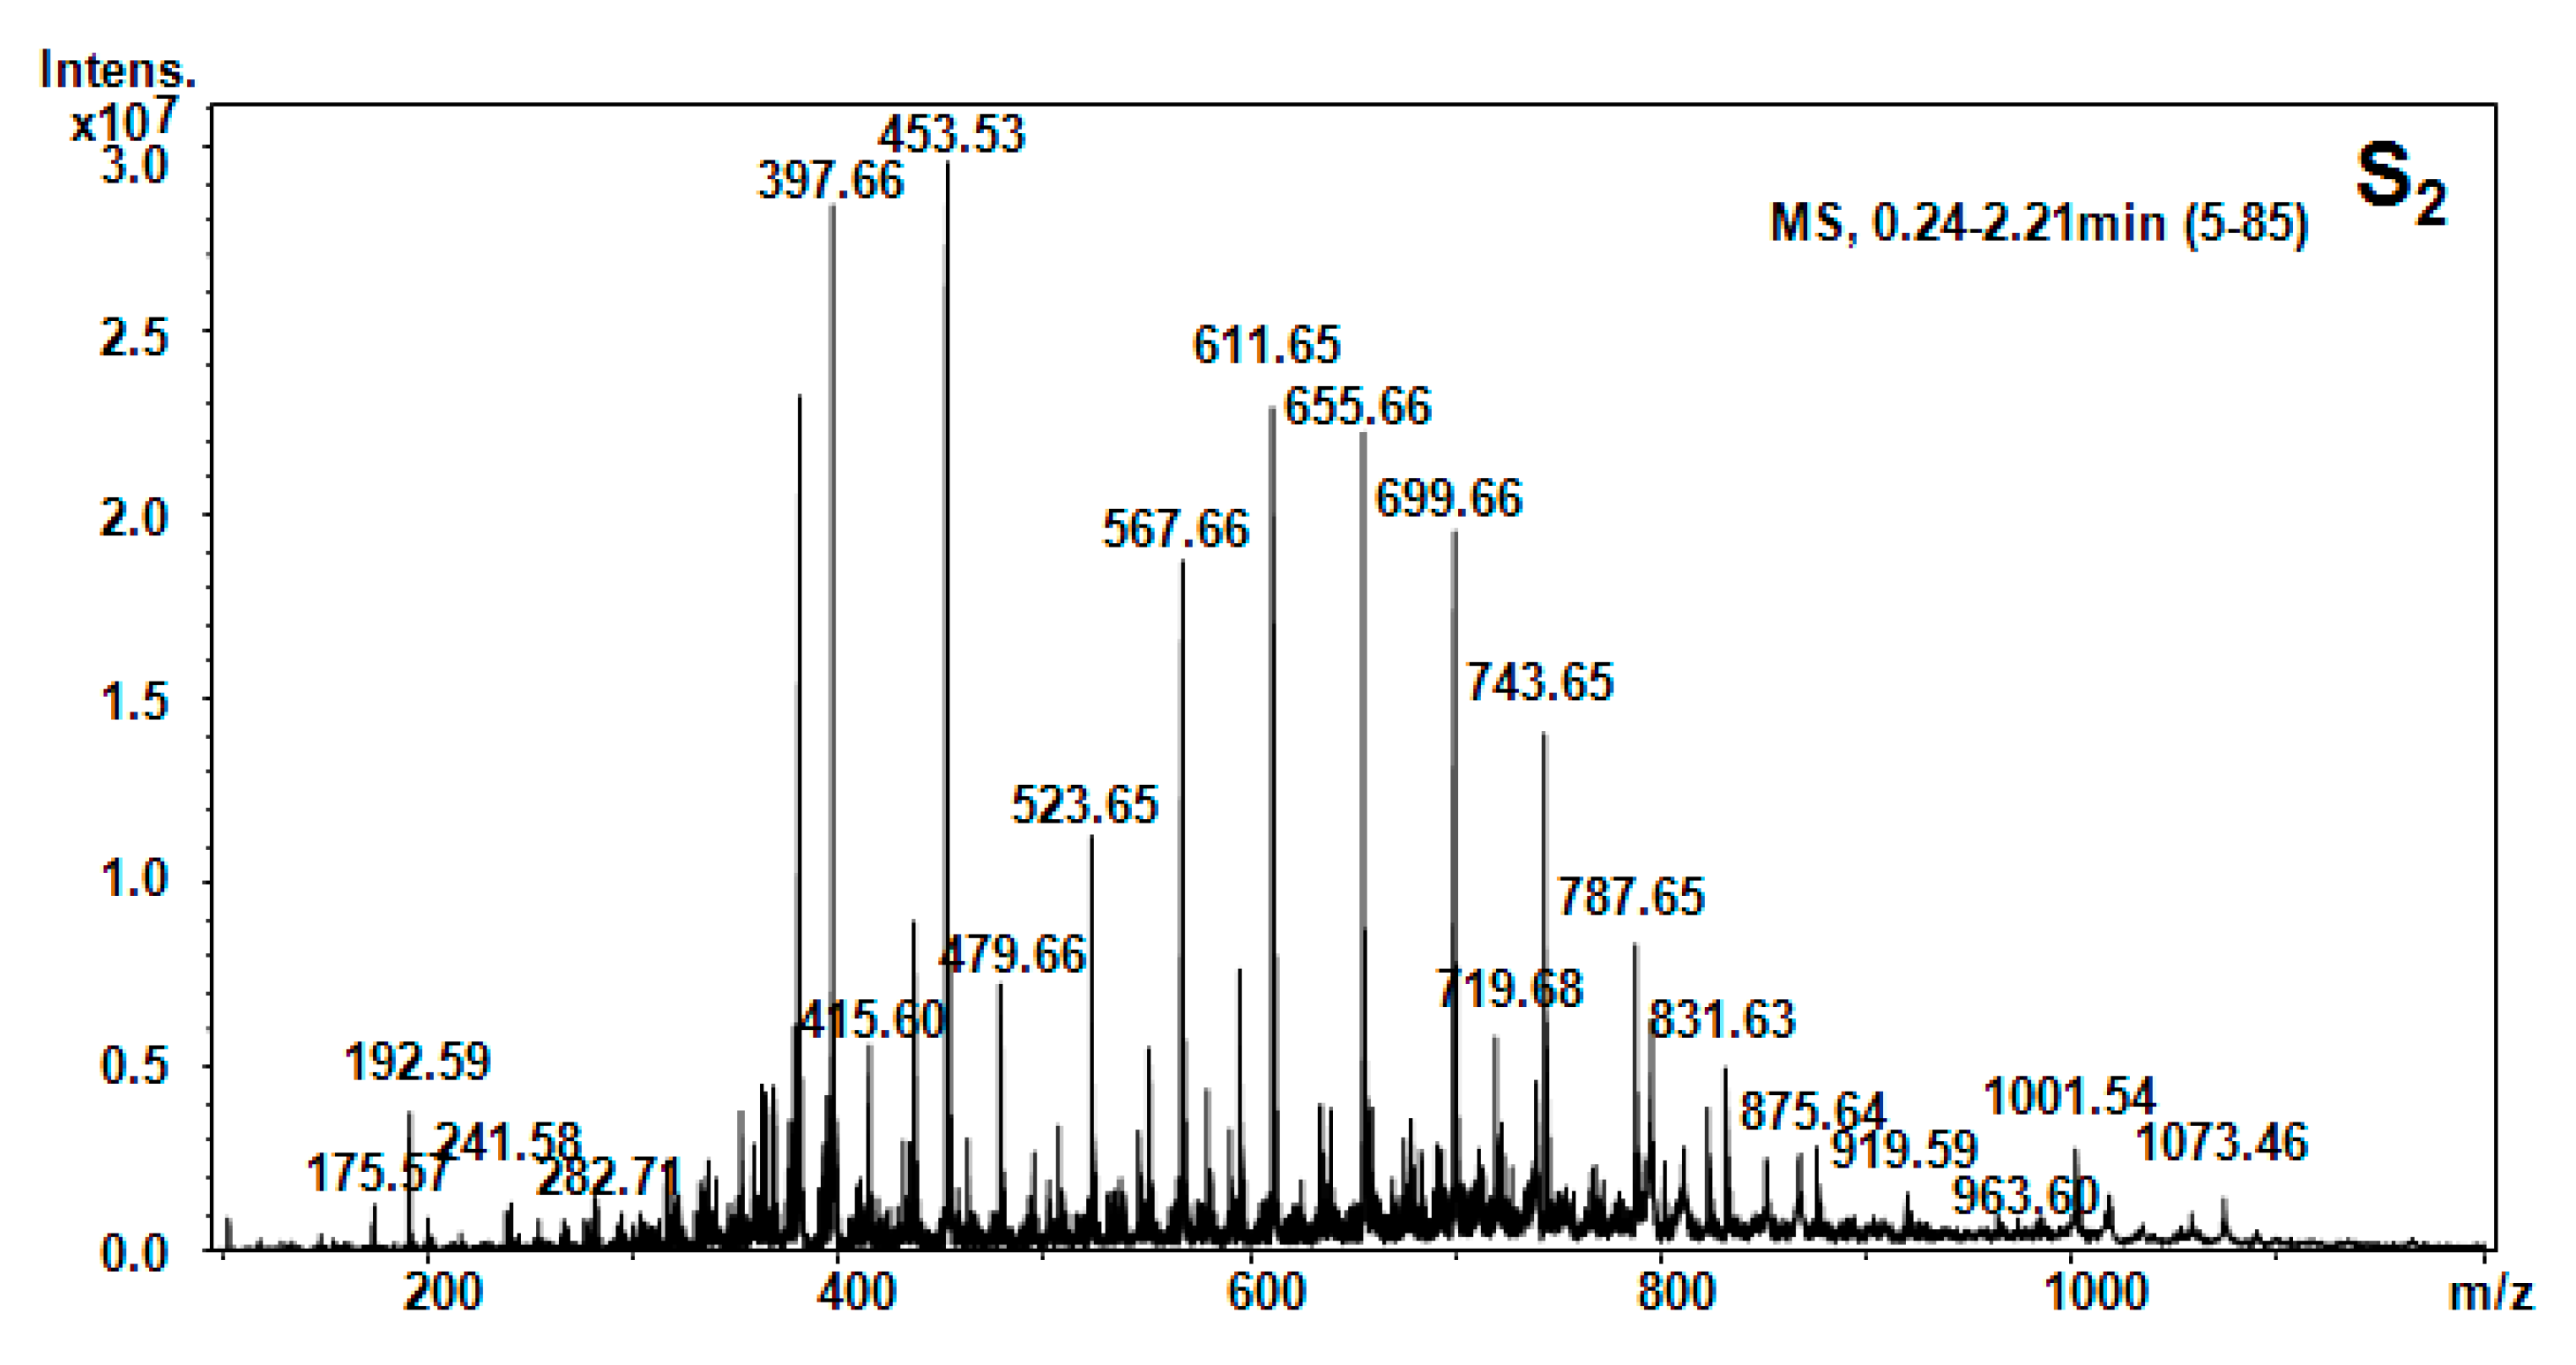
2.4. Nano-ESI-Chip-MS Analysis


| Hellebore Fraction | Type of Molecular Ion | m/z Detected | m/z Calculated | Proposed Structure |
|---|---|---|---|---|
| S1 (ethanol) | [M + 2H]2+ | 149.56 | 147.18 | Phe |
| [M + 2H]2+ | 130.71 | 128.14 | Gln | |
| [M + 2H]2+ | 175.58 | 173.4 | Arg | |
| [M + NH3]+ | 203.48 | 203.14 | Tryptophan | |
| [M + H2O + 2H]2+ | 279.57 | 279.34 | Cys-Arg | |
| [M + 2H]2+ | 317.54 | 317.3 | Asp-Glu-β-Ala | |
| [M + 2H]2+ | 369.66 | 369.37 | His-Glu-Thr | |
| [M + H2O + 2H]2+ | 397.66 | 397.44 | C-C-His | |
| [M + H]+ | 429.64 | 429.46 | Asn-β-Ala-Ile-Glu | |
| [M + H]+ | 457.65 | 457.52 | Phe-His-Thr-β-Ala | |
| [M + H2O] | 579.59 | 579.67 | Thr-Phe-Ile-Glu-β-Ala | |
| [M + H2O + H+ | 691.62 | 691.8 | Arg-C-C-Phe-Glu | |
| S2 (hexane) | [M + 2H]2+ | 175.58 | 173.4 | Arg |
| [M + H2O + 2H]2+ | 192.59 | 192.39 | β-Ala-Thr | |
| [M + H2O + 2H]2+ | 397.66 | 397.44 | C-C-His | |
| [M + H2O + H]+ | 415.6 | 415.48 | Glu-Pro-Val-β-Ala | |
| [M + H2O + H]+ | 453.53 | 453.5 | Ser-His-Ile-Pro | |
| [M + H2O + H]+ | 479.66 | 479.54 | Apa-Ile-Thr-β-Ala | |
| [M + H2O + 2H]2+ | 523.65 | 523.5 | Hser-Orn-His-Asn | |
| [M + NH3]+ | 611.65 | 611.72 | Arg-C-C-Thr-Pro | |
| [M + 2H]2+ | 655.66 | 655.6 | Arg-Suc-Asn-HSer-Glu | |
| [M + H2O + H]+ | 743.65 | 743.68 | Arg-Succ-Asn-HSer-Glu-β-Ala | |
| [M + H2O + H]+ | 729.57 | 729.39 | Gly-Cystine-Met-Tyr-Hser | |
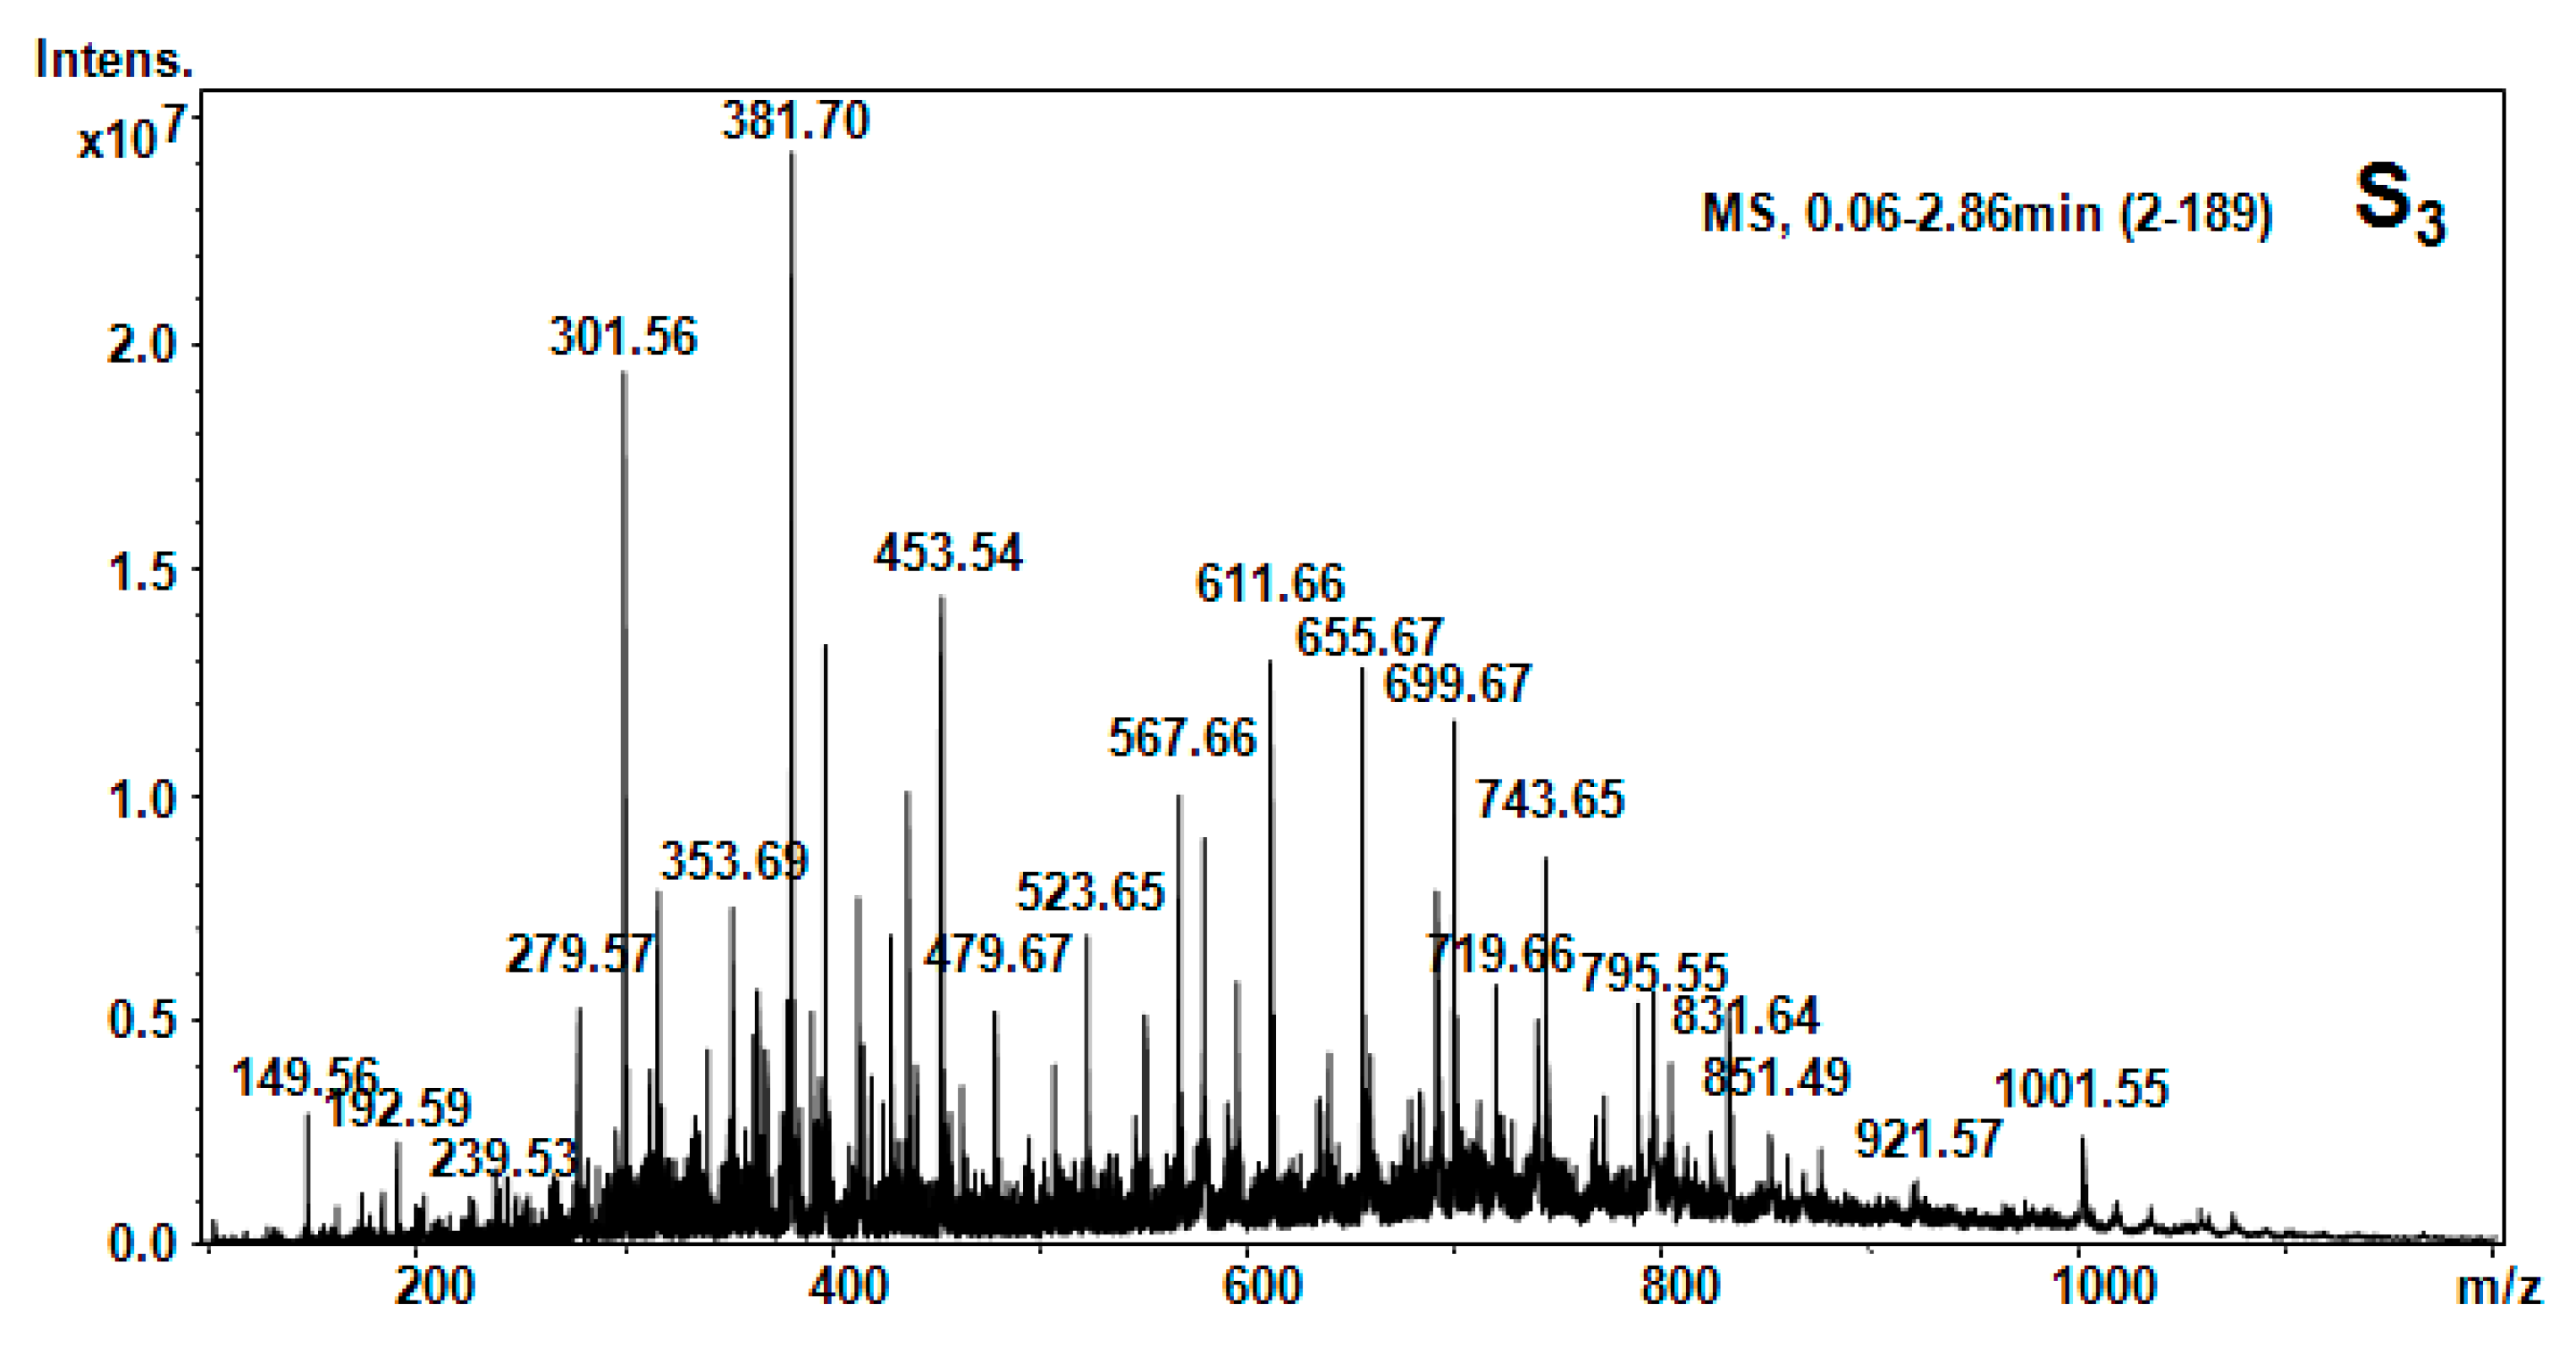
| S3 (CCl4) | [M + 2H]2+ | 149.56 | 147.18 | Phe |
| [M + H2O + 2H]2+ | 192.59 | 192.39 | β-Ala-Thr | |
| [M + H2O + 2H]2+ | 279.57 | 279.34 | Cys-Arg | |
| [M + H]+ | 301.56 | 301.56 | 1MHis-Gly-Gly | |
| [M + NH3]+ | 381.70 | 381.32 | Lys-Ala-Phe | |
| [M + H]+ | 453.54 | 453.44 | His-Glu-Asn-β-Ala | |
| [M + H2O + H]+ | 479.66 | 479.54 | APA-Ile-Thr-β-Ala | |
| [M + H2O + 2H]2+ | 523.65 | 523.5 | HSer-Orn-His-Asn | |
| [M + H2O + H]+ | 552.98 | 552.62 | Pro-Hyp-Phe-Thr-Gly | |
| [M + NH3]+ | 611.65 | 611.72 | Arg-C-C-Thr-Pro | |
| [M + 2H]2+ | 655.67 | 655.6 | Arg-Suc-Asn-HSer-Glu | |
| [M + H2O + H]+ | 743.65 | 743.68 | Arg-Suc-Asn-HSer-Glu-β-Ala | |
| [M + H2O + H]+ | 729.57 | 729.39 | Gly-Cystine-Met-Tyr-Hser | |
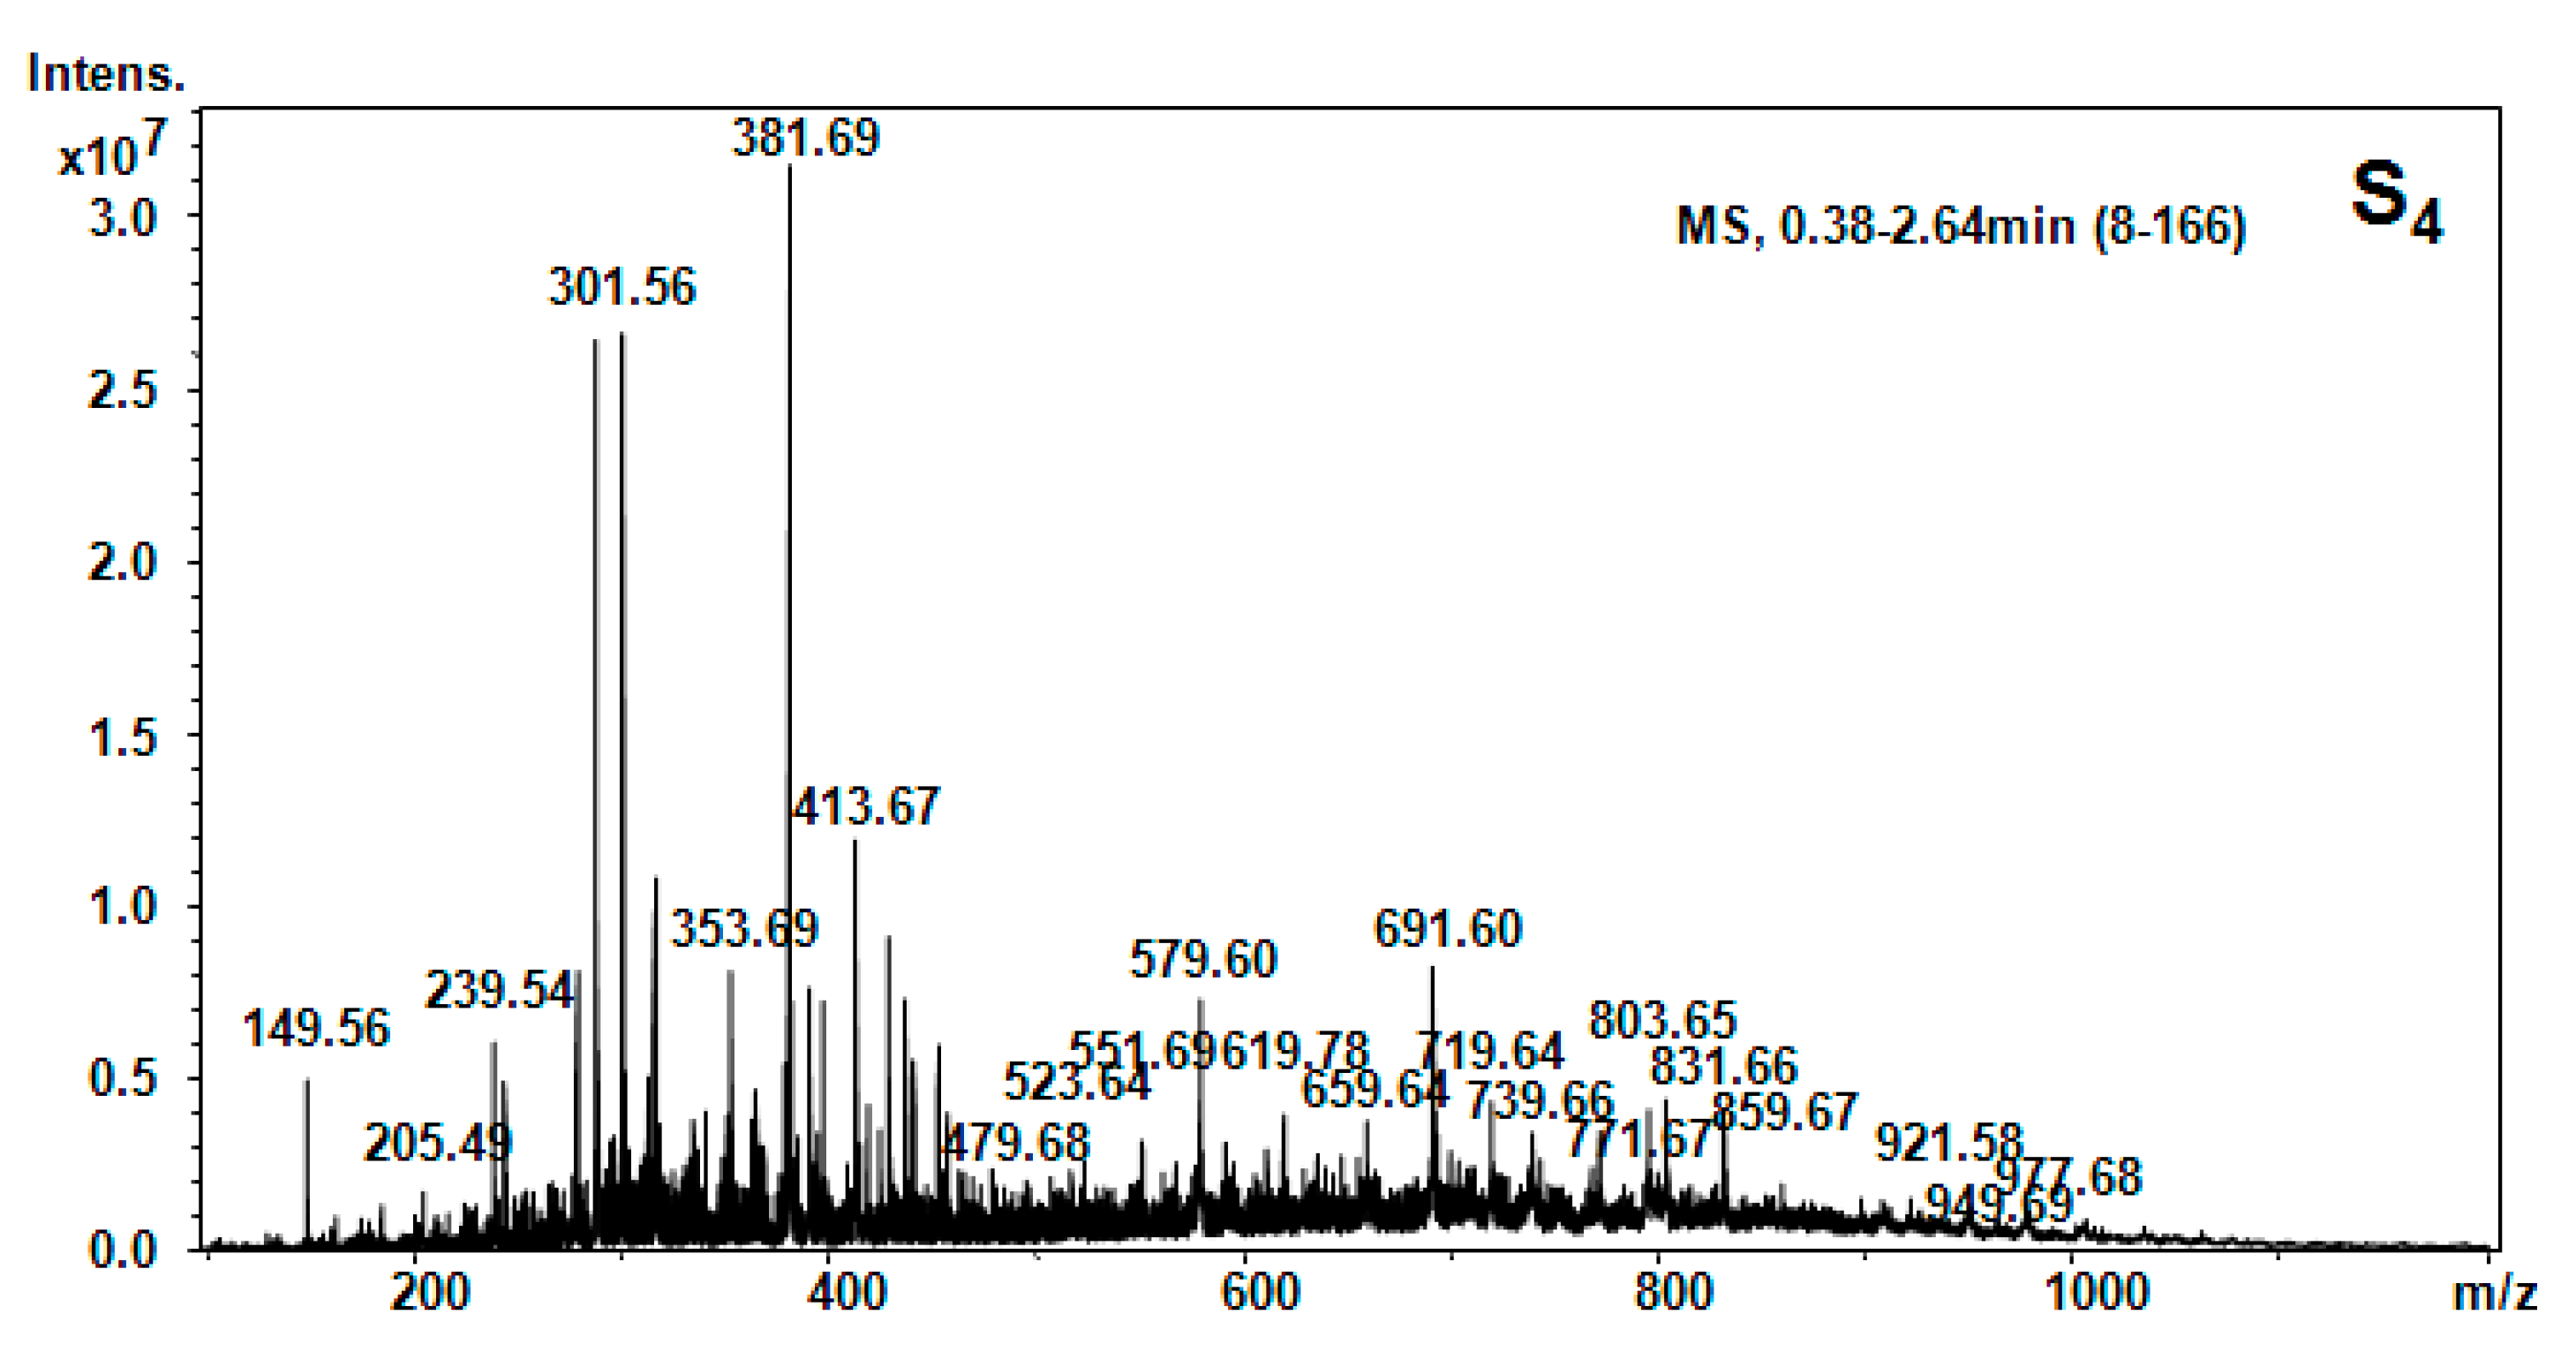
| S4 (CH2Cl2) | [M + 2H]2+ | 149.56 | 147.18 | Phe |
| [M + H2O + H]+ | 205.49 | 205.42 | Val-Ser | |
| [M + H2O + H]+ | 239.54 | 239.27 | Gly-Tyr | |
| [M + H2O + 2H]2+ | 279.57 | 279.34 | Cys-Arg | |
| [M + H]+ | 301.56 | 301.56 | 1MHis-Gly-Gly | |
| [M + H2O + 2H]2+ | 353.69 | 353.39 | Gly-Tyr-Ile | |
| [M + NH3]+ | 381.69 | 381.32 | Lys-Ala-Phe | |
| [M + NH3]+ | 413.67 | 413.46 | Hyp-Lys-His | |
| [M + H2O + H]+ | 415.6 | 415.48 | Glu-Pro-Val-β-Ala | |
| [M + H2O + H]+ | 479.66 | 479.54 | Apa-Ile-Thr-β-Ala | |
| [M + H2O + H]+ | 552.98 | 552.62 | Pro-Hyp-Phe-Thr-Gly | |
| [M + H2O + H]+ | 579.59 | 579.67 | Thr-Phe-Ile-Lys-β-Ala | |
| [M + H2O + 2H]2+ | 619.78 | 619.80 | His-Ser-Val-Tyr-Ile | |
| [M + H2O + H]+ | 691.62 | 691.8 | Arg-C-C-Phe-Glu | |
| [M + H2O + H]+ | 719.64 | 719.80 | His -Ser-Val-Tyr-Ile-Thr | |
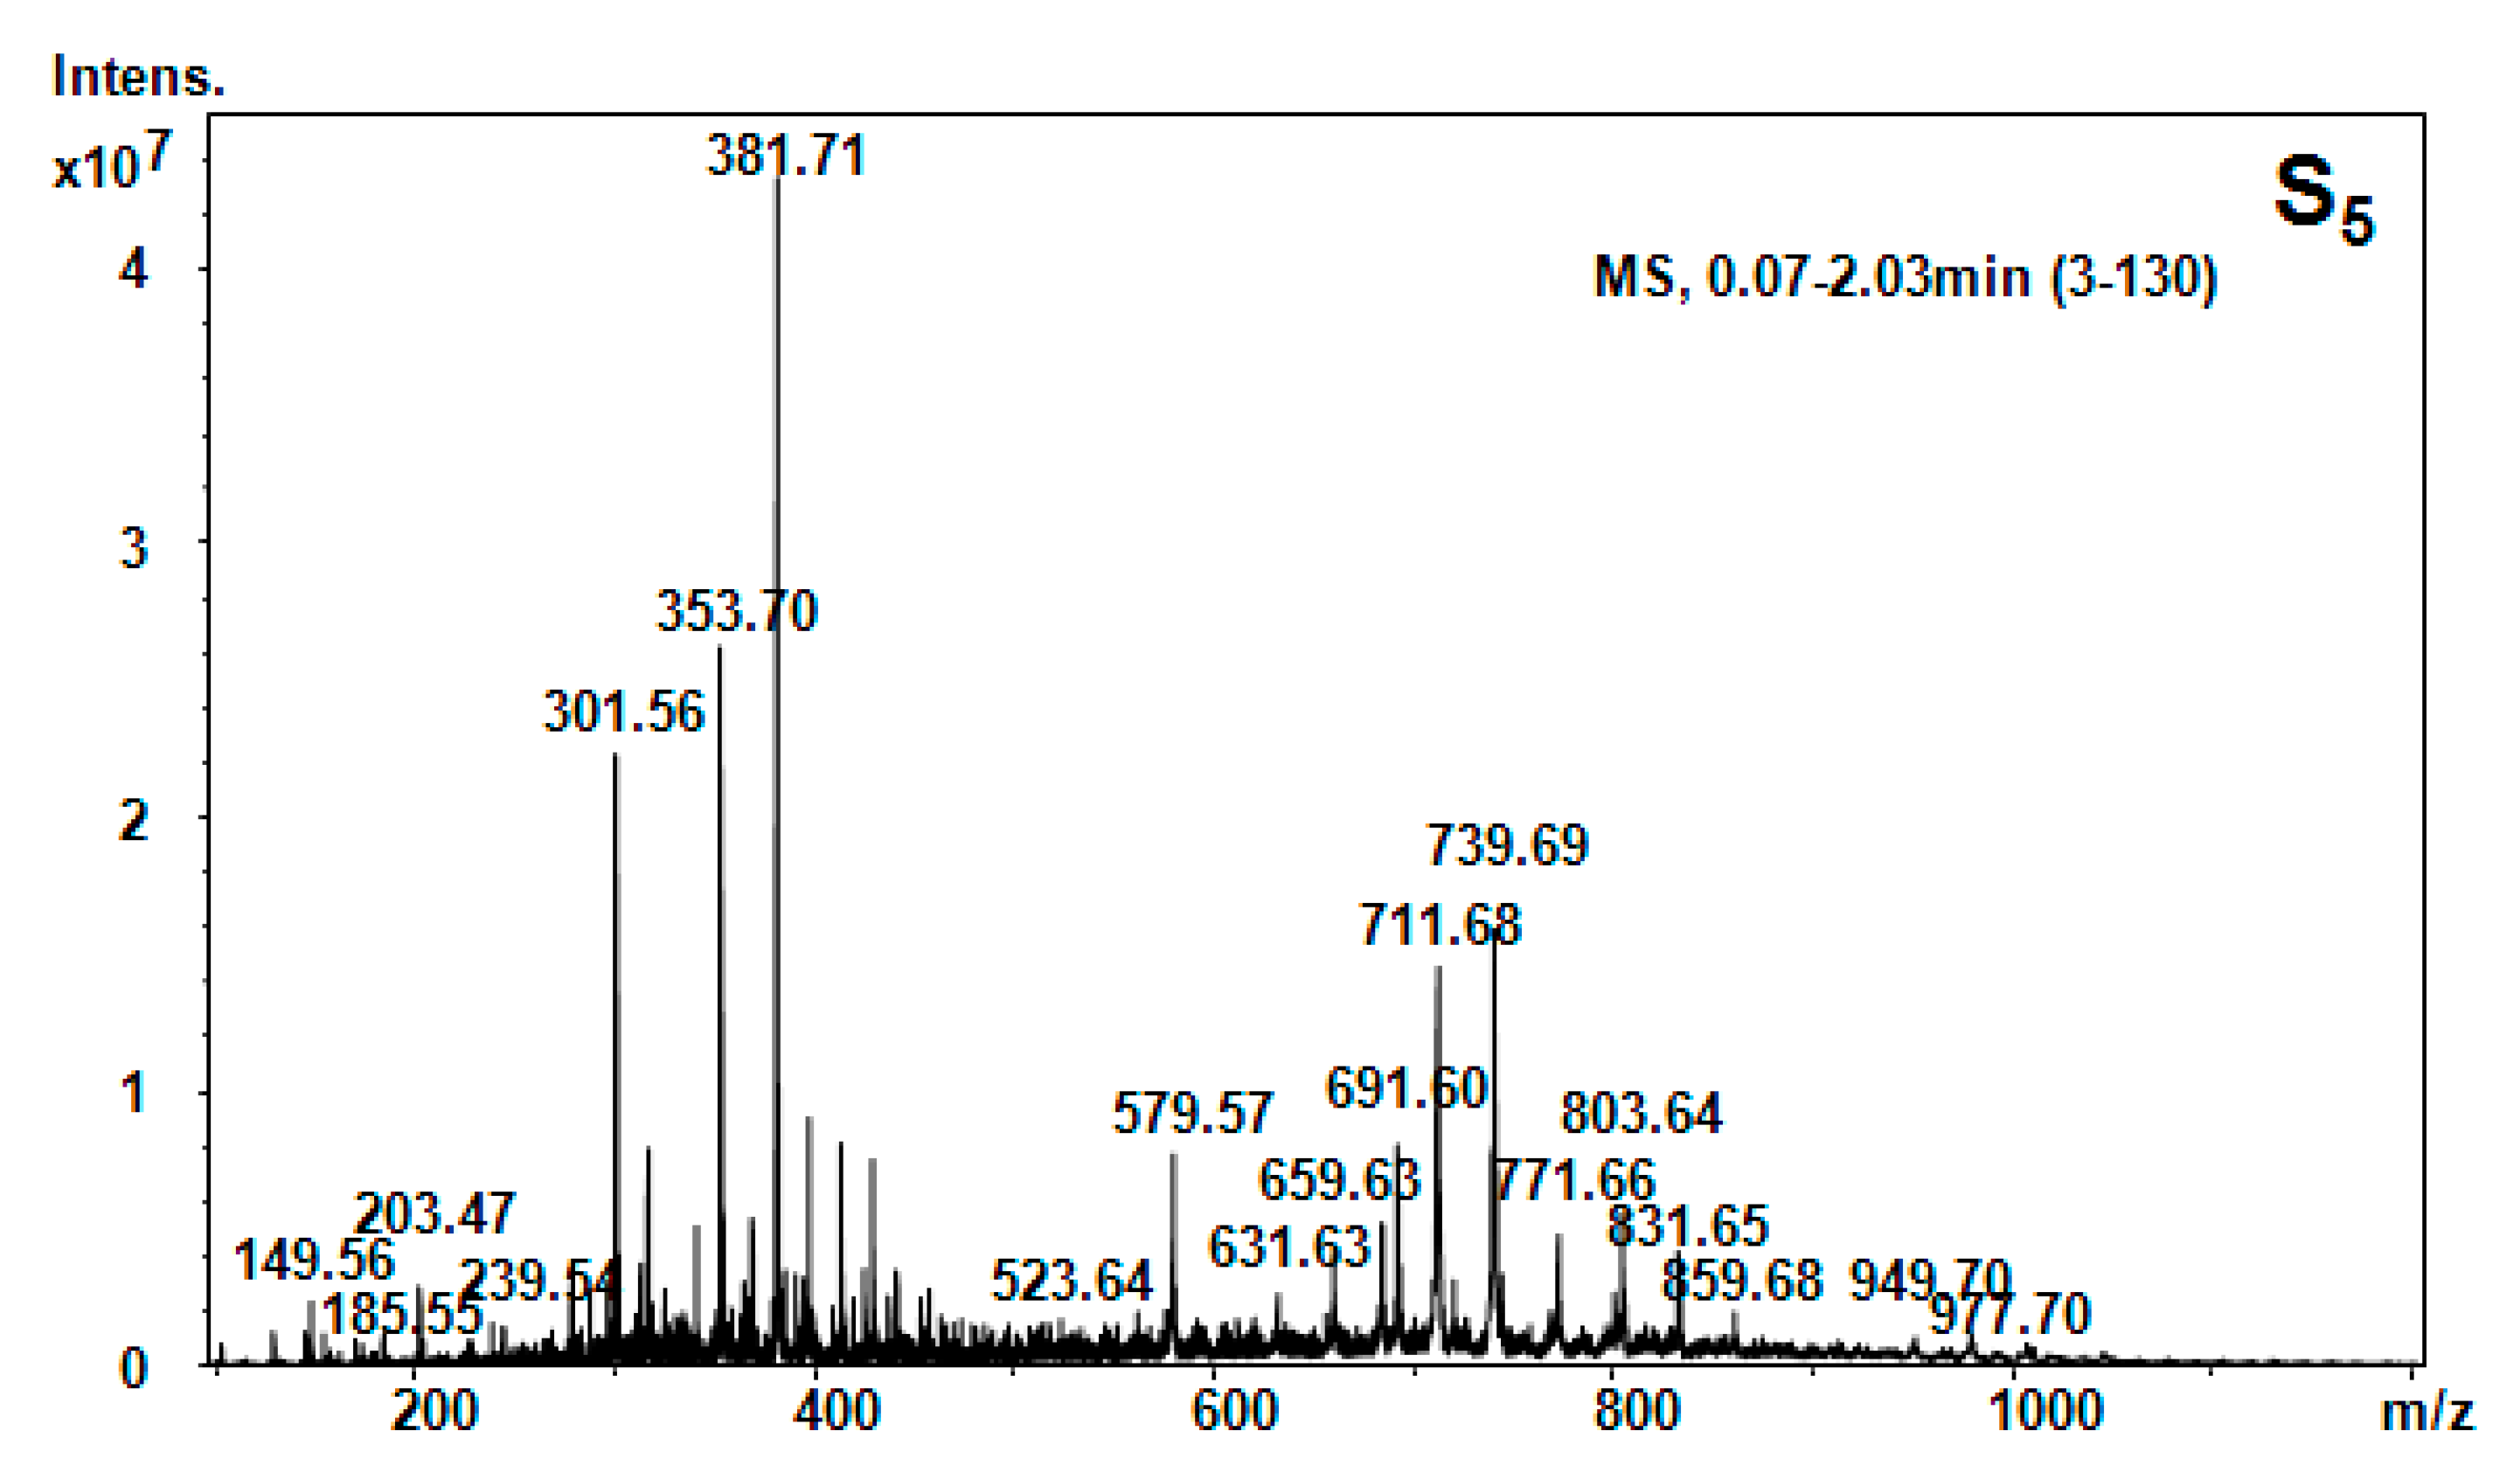
| S5 (n-butanol) | [M + 2H]2+ | 149.56 | 147.18 | Phe |
| [M + NH3]+ | 203.48 | 203.14 | Trn | |
| [M + H]+ | 301.56 | 301.56 | 1MHis-Gly-Gly | |
| [M + H2O + 2H]2+ | 353.69 | 353.39 | Gly-Tyr-Ile | |
| [M + NH3]+ | 381.69 | 381.32 | Lys-Ala-Phe | |
| [M + H2O + 2H]2+ | 523.65 | 523.5 | HSer-Orn-His-Asn | |
| [M + H2O + H]+ | 579.59 | 579.67 | Thr-Phe-Ile-Lys-β-Ala | |
| [M + H2O + 2H]2+ | 619.78 | 619.80 | His-Ser-Val-Tyr-Ile | |
| [M + H2O + H]+ | 691.62 | 691.8 | Arg-C-C-Phe-Glu | |
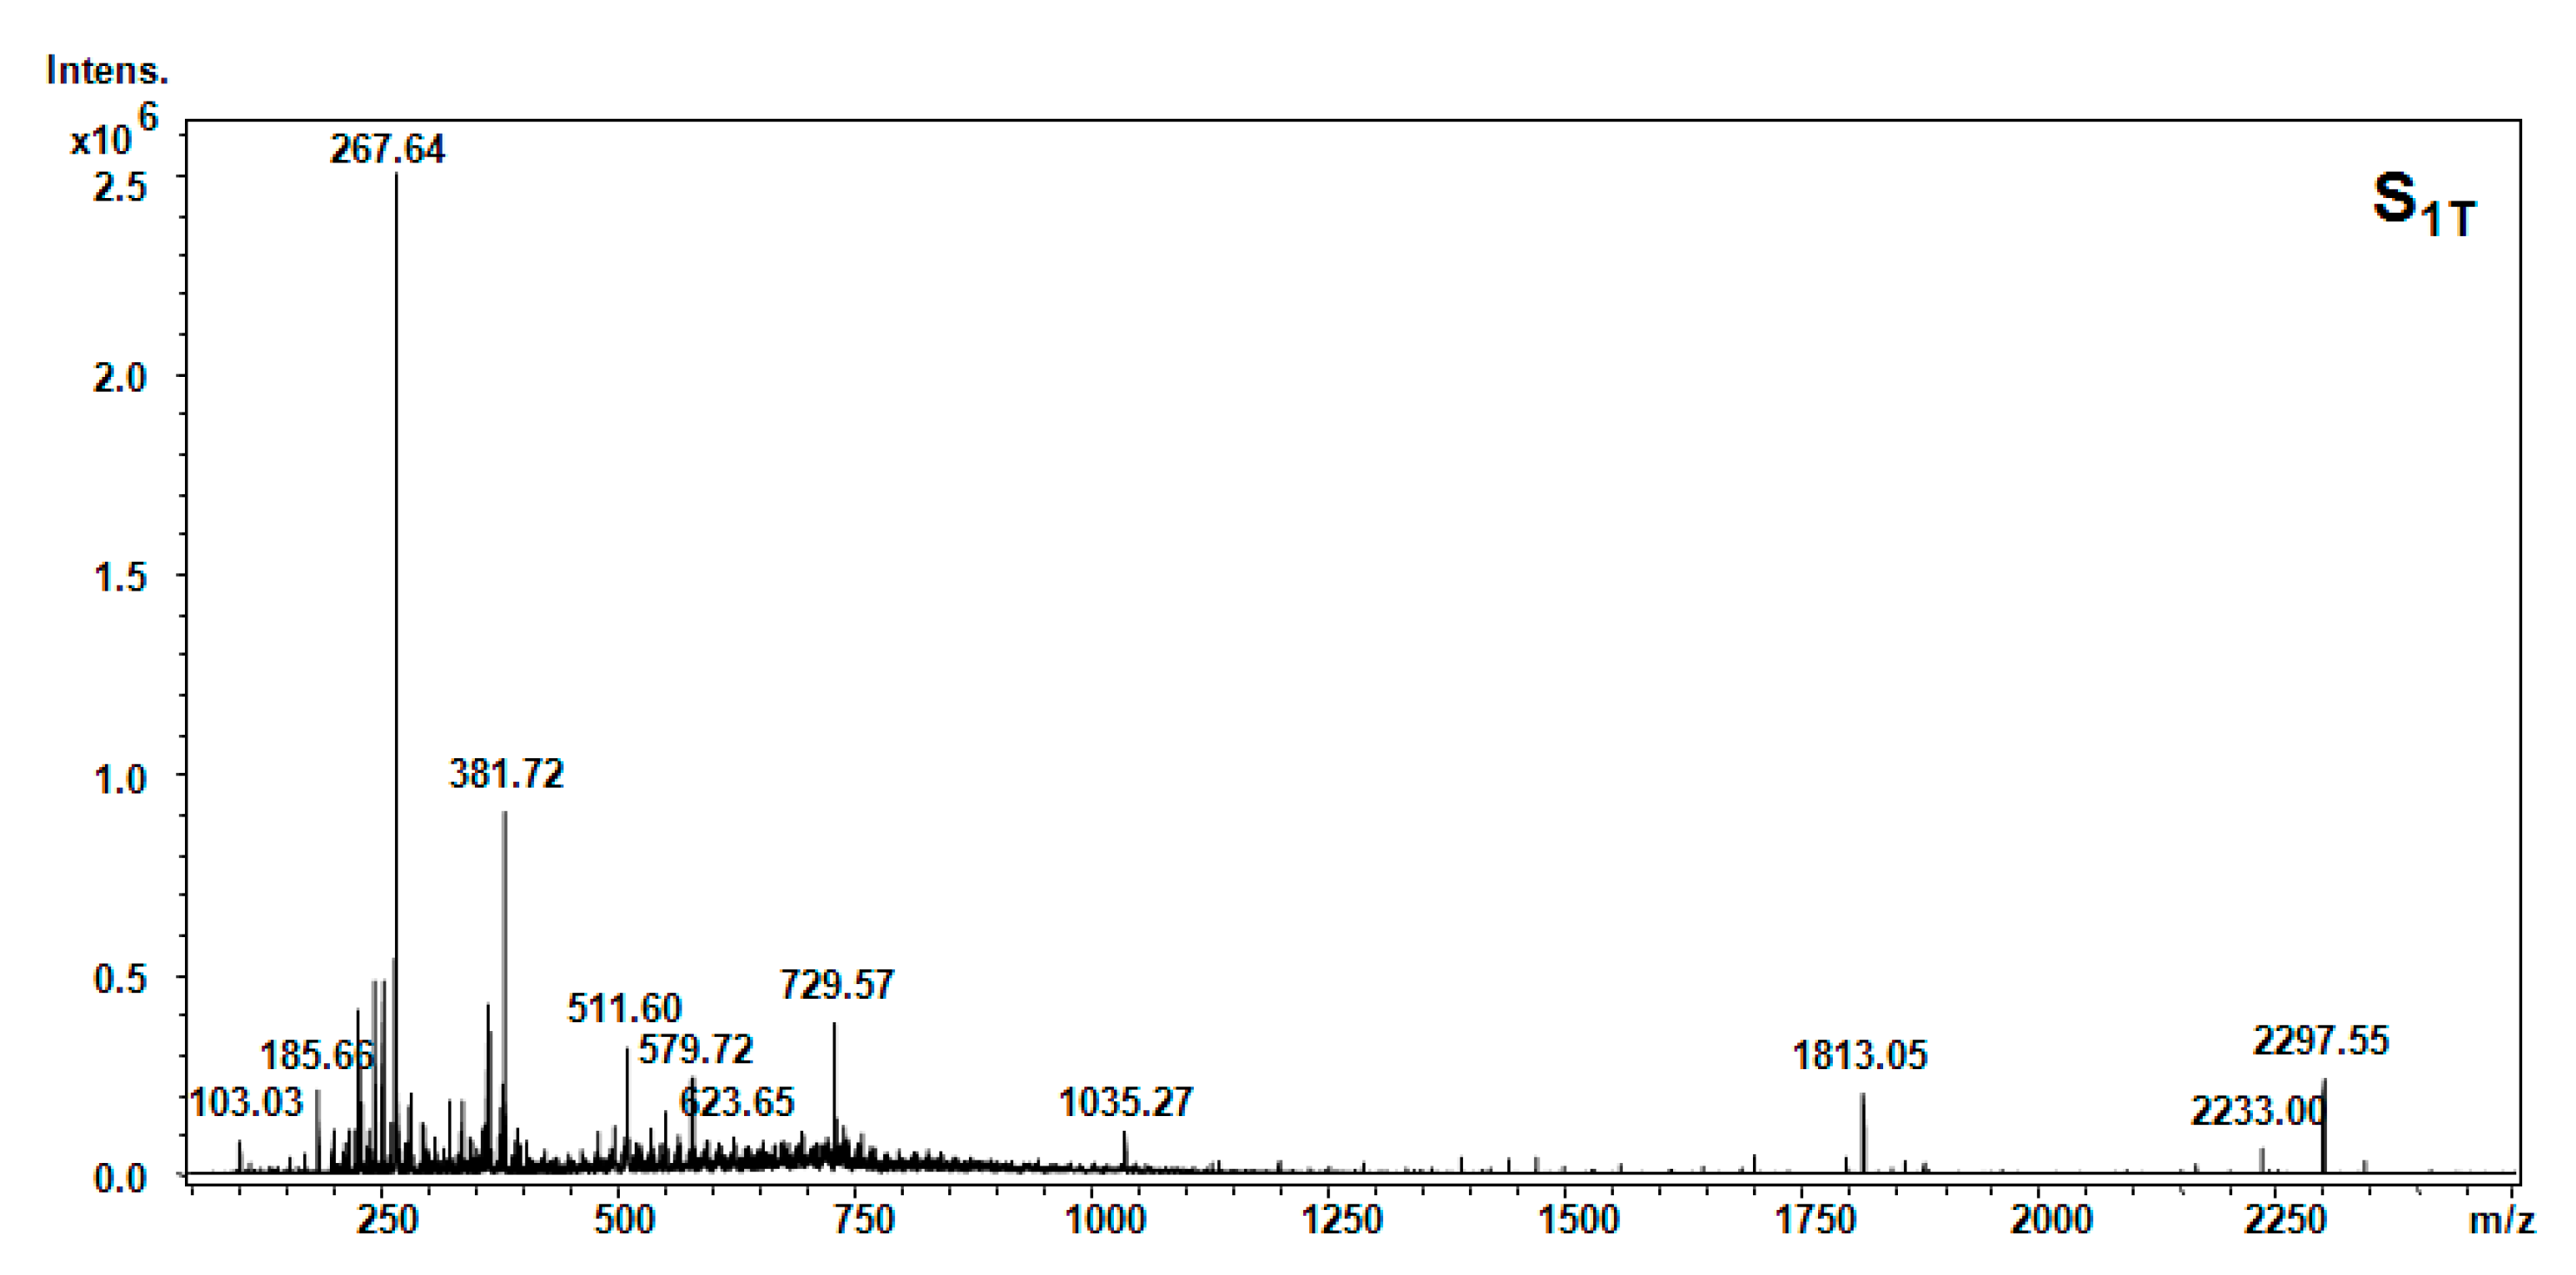
| S1T (petroleum ether) | [M + 2H]2+ | 103.03 | 103.11 | Thr |
| [M + H]+ | 104.3 | 104.15 | Cys | |
| [M + H]+ | 185.66 | 185.25 | β-Ala-Ile | |
| [M + NH3]+ | 203.48 | 203.14 | Trn | |
| [M + NH3]+ | 267.64 | 267.34 | Phe-Cys | |
| [M + NH3]+ | 381.69 | 381.32 | Lys-Ala-Phe | |
| [M + H2O + 2H]2+ | 511.60 | 511.35 | 3-methyl-Cys-Hyp-Pro-Gln | |
| [M + H2O + H]+ | 552.98 | 552.62 | Pro-Hyp-Phe-Thr-Gly | |
| [M + H2O + H]+ | 579.59 | 579.67 | Thr-Phe-Ile-Glu-β-Ala | |
| [M + H2O + H]+ | 691.62 | 691.8 | Arg-C-C-Phe-Glu | |
| [M + H2O + H]+ | 729.57 | 729.39 | Gly-C-C-Met-Tyr-HSer | |
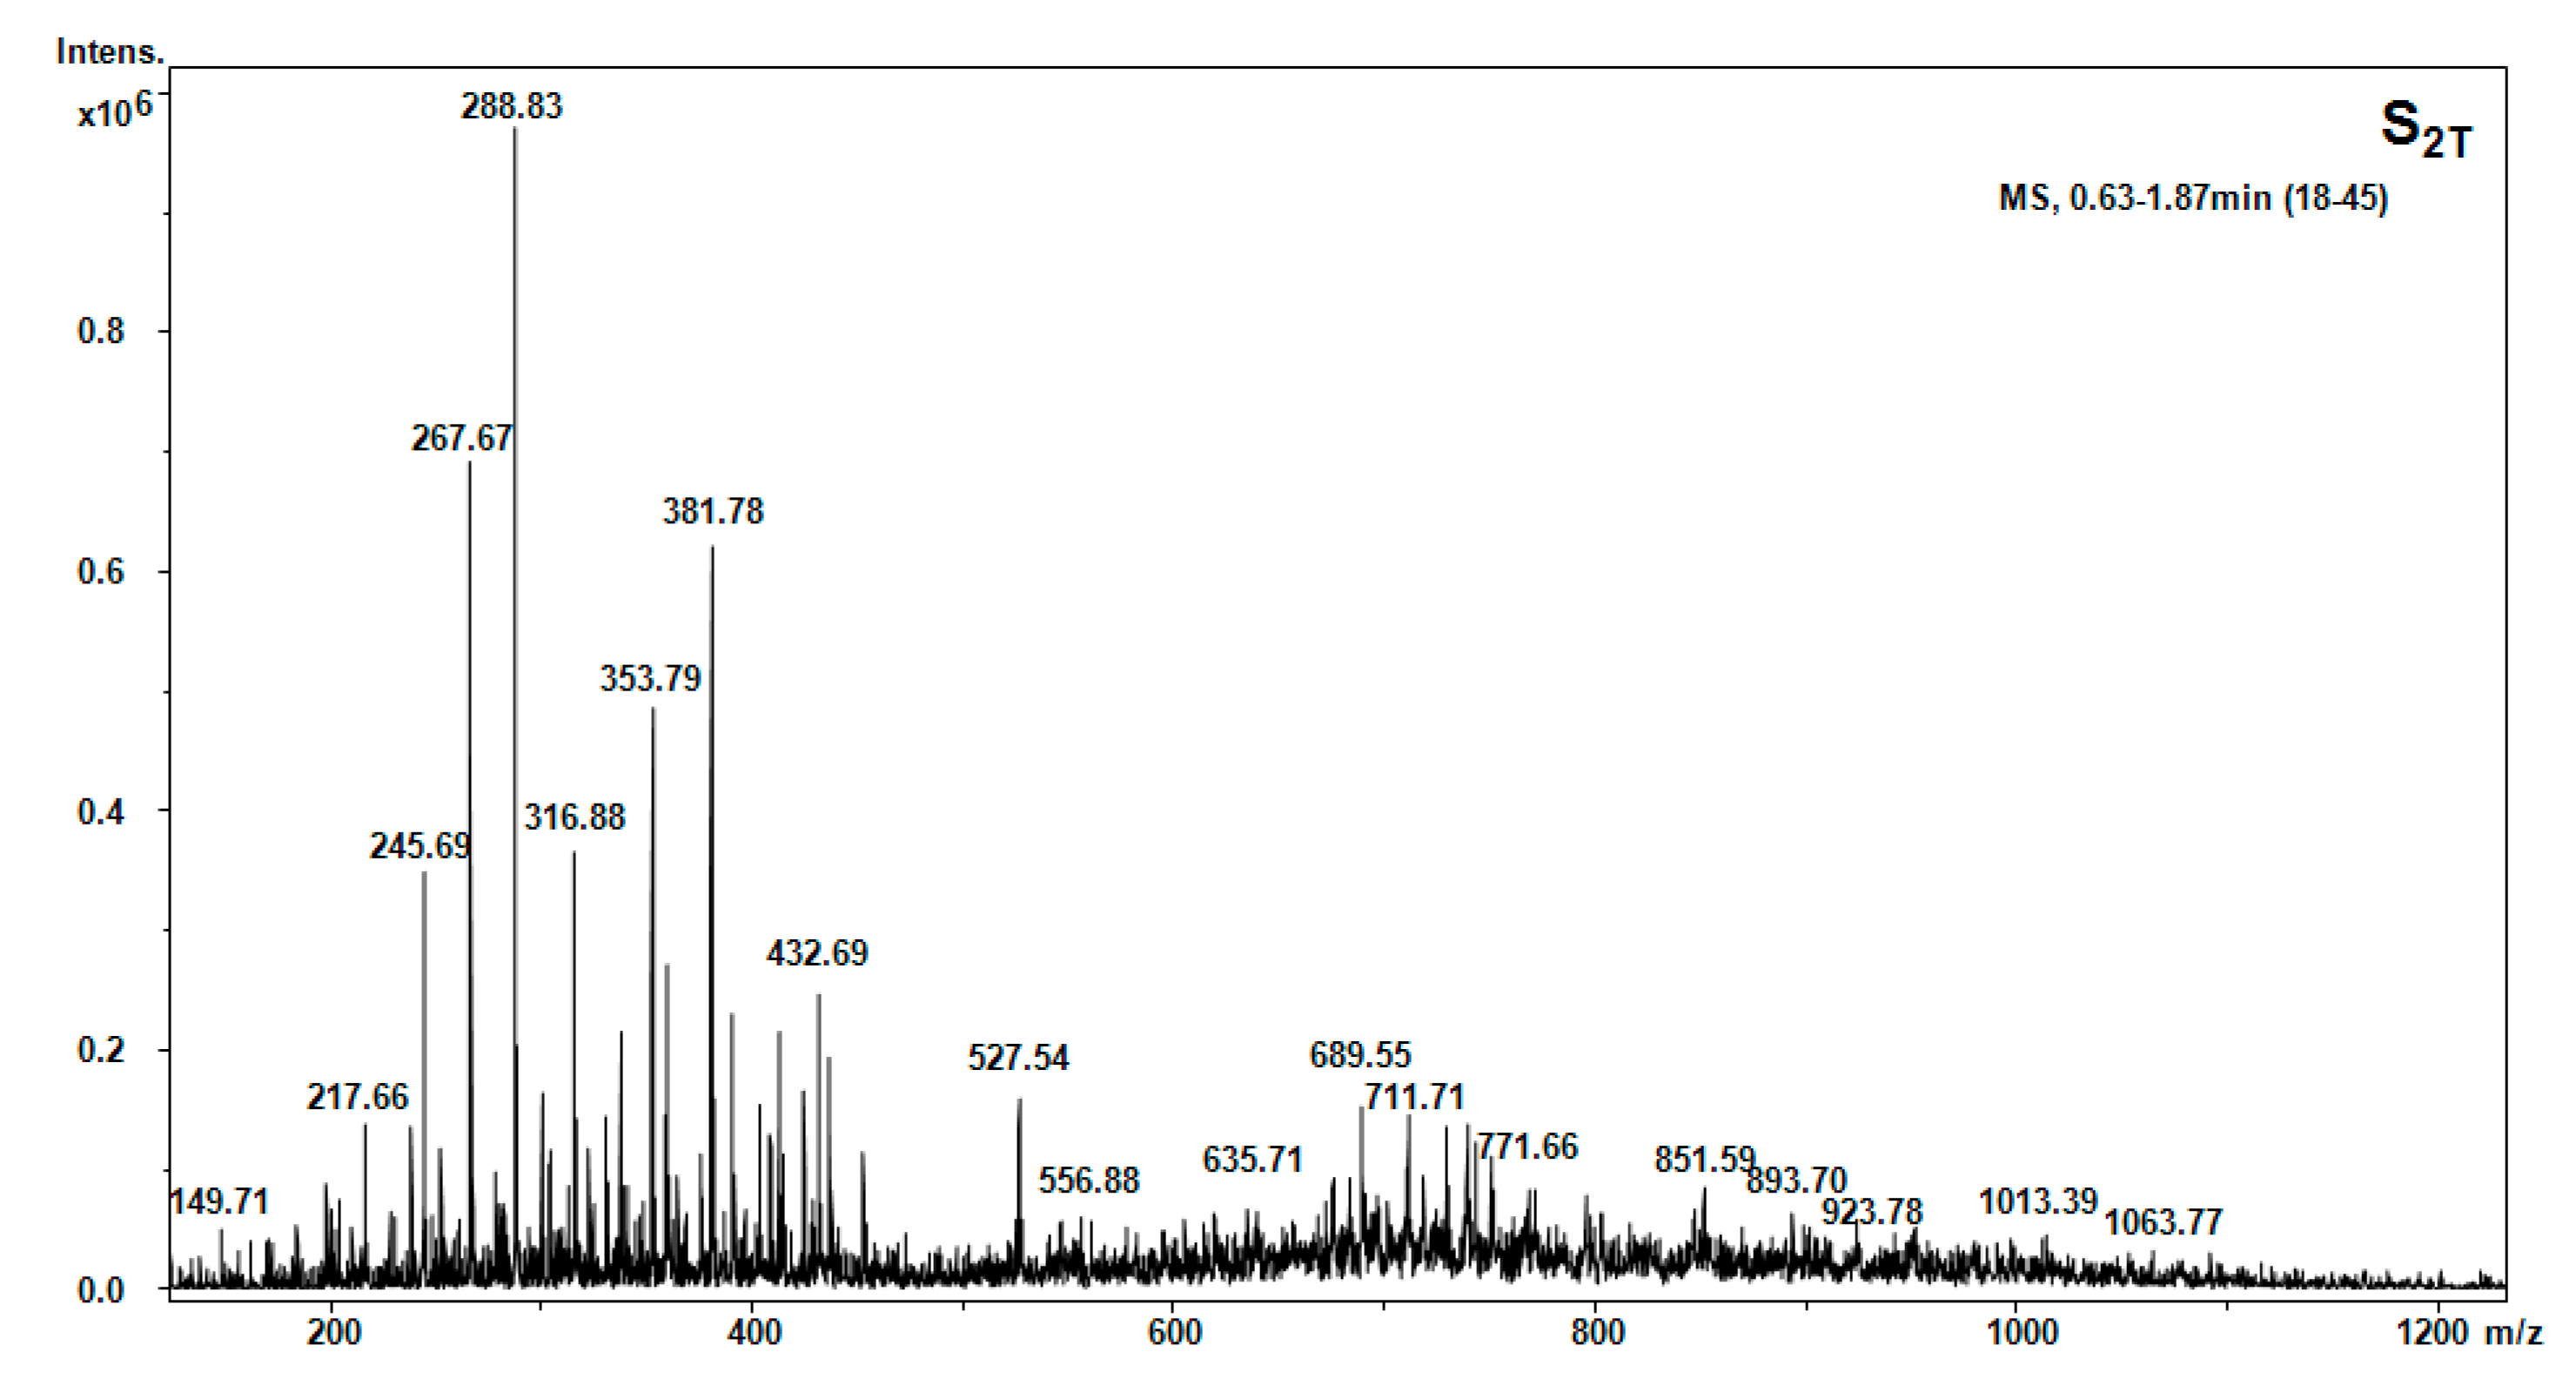
| S2T (acetone) | [M + 2H]2+ | 103.03 | 103.11 | Thr |
| [M + H]+ | 104.3 | 104.15 | Cys | |
| [M + H]+ | 185.66 | 185.25 | β-Ala-Ile | |
| [M + NH3]+ | 203.48 | 203.14 | Trn | |
| [M + NH3]+ | 267.64 | 267.34 | Phe-Cys | |
| [M + H2O + 2H]2+ | 288.83 | 288.33 | Met-His | |
| [M + H]+ | 301.56 | 301.56 | 1MHis-Gly-Gly | |
| [M + H2O + 2H]2+ | 353.69 | 353.39 | Gly-Tyr-Ile | |
| [M + NH3]+ | 381.69 | 381.32 | Lys-Ala-Phe | |
| [M + H2O + 2H]2+ | 432.69 | 432.46 | Phe-His-Gly-β-Ala | |
| [M + H2O + 2H]2+ | 523.65 | 523.5 | HSer-Orn-His-Asn | |
| [M + H2O + 2H]2+ | 527.54 | 527.60 | Orn-Val-Glu-Phe | |
| [M + H2O + H]+ | 552.98 | 552.62 | Pro-Hyp-Phe-Thr-Gly | |
| [M + H2O + H]+ | 579.59 | 579.67 | Thr-Phe-Ile-Glu-β-Ala | |
| [M + H2O + H]+ | 689.55 | 689.35 | Ile-C-C-Trp-Hyp | |
| [M + H2O + H]+ | 691.62 | 691.8 | Arg-C-C-Phe-Glu | |
| [M + H2O + H]+ | 729.57 | 729.39 | Gly-C-C-Met-Tyr-HSer |
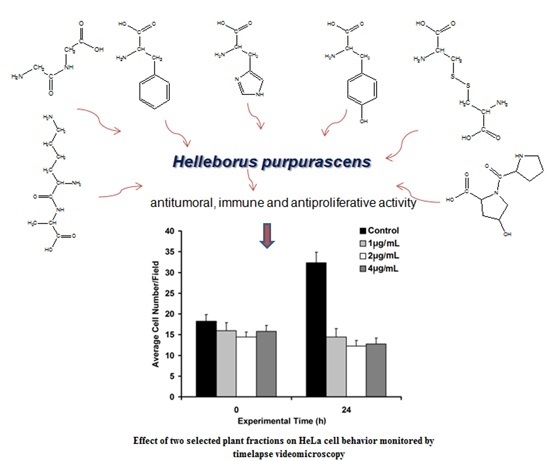
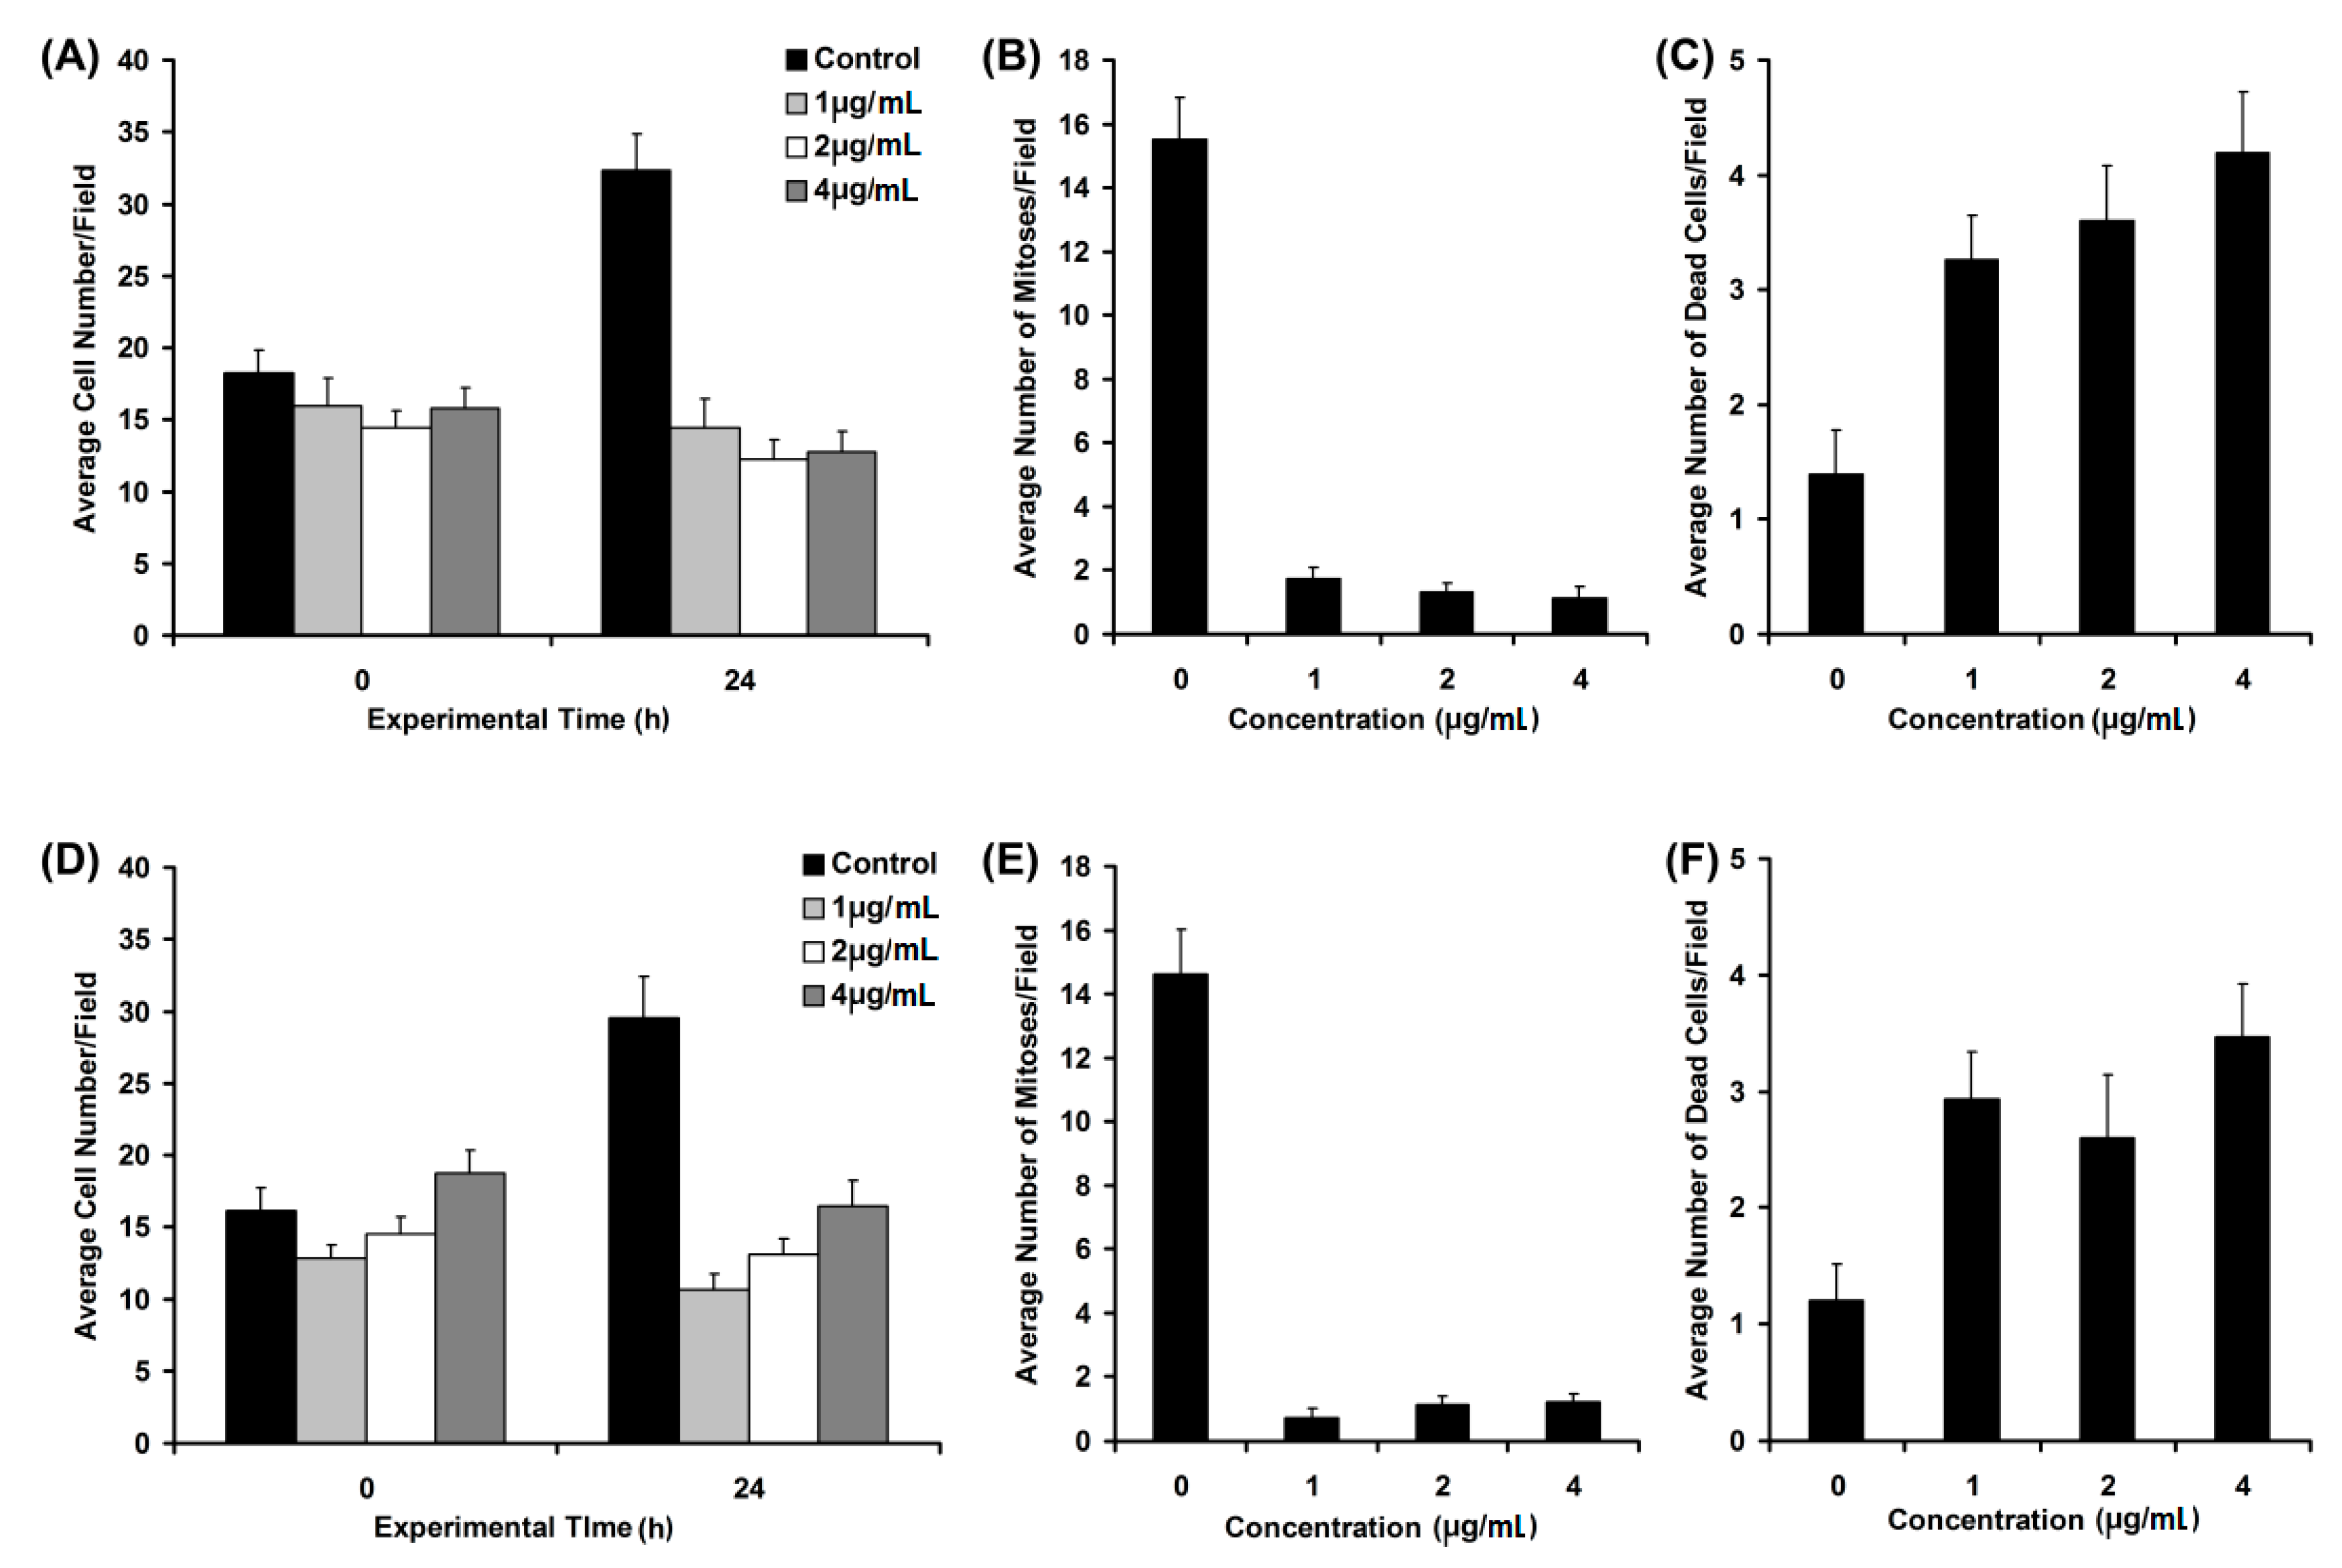
2.5. Biological Activity Investigation

3. Experimental Section
3.1. General Information
3.2. Chromatographic Techniques
3.3. Spectroscopy Techniques
3.4. Isolation Strategy for Amino Acids and Peptides
3.5. Derivatization of Standard Amino Acids
3.6. Thionins
3.7. GC-MS Separation Conditions
3.8. HPLC-DAD Separation Conditions
3.9. Mass Spectrometry Analysis
3.10. Study of the Biological Activity
4. Conclusions
Acknowledgments
Author Contributions
Conflicts of Interest
References
- Colegate, S.M.; Molyneux, R.J. Bioactive Natural Products Detection, Isolation and Structural Determination, 2nd ed.; Taylor & Francis Group: Boca Raton, FL, USA, 2008; pp. 9–16, 249–261. [Google Scholar]
- Ilie, T.; Minoiu, M. Plante Medicinale Miraculoase din Flora Romanie; Artmed: Bucuresti, Romania, 2004; pp. 225–227. [Google Scholar]
- Domokos, E. The Ecological Characterization of the Forestry Associations from the Middle Stream of the Niraj Valley (Romania, Mureş County). Sci. Ann. Alexandru Ioan Cuza Univ. Iasi. 2013, 59, 99–106. [Google Scholar]
- Neacsu, C.; Ciobanu, C.; Barbu, I.; Toader, O.; Szegli, G.; Kerek, F.; Babes, A. Substance MCS-18 Isolated from Helleborus purpurascens Is a Potent Antagonist of the Capsaicin Receptor, TRPV1, in Rat Cultured Sensory Neurons. Physiol. Res. 2010, 59, 289–298. [Google Scholar] [PubMed]
- Kerek, F. Boicil, a new and very efficient antialgic spasmolytic and blood vessel regulating drug obtained from the plant Helleborus. Int. Conf. Chem. Biotechnol. Biol. Nat. Prod. 1981, 2, 22–37. [Google Scholar]
- Rosselli, S.; Maggio, A.; Bruno, M.; Spadaro, V.; Formisano, C.; Irace, C.; Maffettone, C.; Mascolo, N. Furostanol Saponins and Ecdysones with Cytotoxic Activity from Helleborus bocconei ssp. Intermedius. Phytother. Res. 2009, 23, 1243–1249. [Google Scholar] [CrossRef] [PubMed]
- Paun-Roman, G.; Neagu, E.; Radu, G.L. Membrane Processes for the Purification and Concentration of Helleborus purpurascens Extracts and Evaluation of Antioxidant Activity. Rev. Chim. Buchar. 2010, 61, 877–881. [Google Scholar]
- Vochita, G.; Mihai, C.T.; Gherghel, D.; Iurea, D.; Roman, G.; Radu, G.L.; Rotinberg, P. New Potential Antitumoral Agents of Polyphenolic Nature Obtained from Helleborus purpurascens by Membranary Micro- and Ultrafiltration Techniques. Sci. Ann. Alexandru Ioan Cuza Univ. Iasi. 2011, XII, 41–51. [Google Scholar]
- Stanescu, U.; Hanceanu, M.; Miron, A.; Aprostoaie, C. Plante Medicinale de la A la Z, Monografii ale Produselor de Interes Therapeutic; Grigore T. Popa University of Medicine and Pharmacy: Iasi, Romania, 2004; Volume 1, pp. 280–282. [Google Scholar]
- Stroescu, V. Pharmacological Basis of Medical Practice; Medical Printing House: Bucuresti, Romania, 1998; pp. 236–241. [Google Scholar]
- Simard, E.P.; Engels, E.A. Cancer as a Cause of Death among People with AIDS in the United States. Clin. Infect. Dis. 2010, 51, 957–962. [Google Scholar] [CrossRef] [PubMed]
- Tantry, M.A. Plant natural products and drugs: A comprehensive study. Asian J. Tradit. Med. 2009, 4, 241–249. [Google Scholar]
- Molinski, T.F.; Lievens, S.L.; Saludes, J.P. Drug development from marine natural products. Nat. Rev. Drug Discov. 2009, 8, 69–83. [Google Scholar] [CrossRef] [PubMed]
- Wittmann, V. Glycoproteins: Occurrence and Significance, Glycoscience: Chemistry and Chemical Biology; Fraser-Reid, B.O., Tatsuta, K., Thiem, J., Eds.; Springer: Berlin/Heidelberg, Germany, 2008. [Google Scholar]
- Caleya, R.F.D.; Hernández-Lucas, C.; Carbonero, P.; García-Olmedo, F. Gene expression in alloploid: Genetic control of lipopurothionins in wheat. Genetics 1976, 83, 687–699. [Google Scholar] [PubMed]
- Caleya, R.F.D.; Gonzalez Pascual, B.; Garcia Olmedo, F.; Carbonero, R. Susceptibility of phytopathogenic bacteria to wheat purothionins in vitro. Appl. Microbiol. 1972, 23, 998–1000. [Google Scholar]
- Ebrahimnesbat, F.; Behnke, S.; Kleinhofs, A.; Apel, K. Cultivar specific differences in the distribution of cell wall bound thionins during the generation of compatible and incompatible interactions between barley and powdery mildew. Planta 1989, 179, 203–210. [Google Scholar] [CrossRef] [PubMed]
- Evans, J.; Wang, Y.; Shaw, K.P.; Vernon, L.P. Cellular responses to Pyrularia thionin are mediated by Ca2+ influx and phospholipase A2 activation and are inhibited by thionin tyrosine iodination. Proc. Natl. Acad. Sci. USA 1989, 86, 5849–5853. [Google Scholar] [CrossRef] [PubMed]
- Bhave, M.; Methuku, D.R. Small Cysteine-Rich Proteins from Plants: A Rich Resource of Antimicrobial Agents, Science against Microbial Pathogens: Communicating Current Research and Technological Advances; Mendez-Vilas, A., Ed.; Formatex Research Center: Badajoz, Spain, 2011; pp. 1074–1083. [Google Scholar]
- Apetrei, N.S.; Lupu, A.R.; Calugaru, A.; Kerek, F.; Szegli, G.; Cremer, L. The antioxidant effects of some progressively purified fractions from Helleborus purpurascens. Romanian Biotechnol. Lett. 2011, 16, 6673–6682. [Google Scholar]
- Horstmann, B.; Zinser, E.; Turza, N.; Kerek, F.; Steinkasserer, A. MCS-18, a novel natural product isolated from Helleborus purpurascens inhibits dendritic cell activation and prevents autoimmunity as shown in vivo using the EAE model. Immunobiology 2008, 212, 839–853. [Google Scholar] [CrossRef] [PubMed]
- Lupu, A.R.; Cremer, L.; Kerek, F.; Calugaru, A. New natural compound MCS-18. A TLR-2 antagonist able to down-regulate inflammation-related pain. Eur. J. Pain. 2009, 13, 527. [Google Scholar] [CrossRef]
- Yang, F.Y.; Su, Y.F.; Wang, Y.; Chai, X.; Han, X.; Wu, Z.-H.; Gao, X.-M. Bufadienolides and phytoecdystones from the rhizomes of Helleborus thibetanus (Ranunculaceae). Biochem. Syst. Ecol. 2010, 38, 759–763. [Google Scholar] [CrossRef]
- Neda, I.; Vlazan, P.; Pop, R.O.; Sfirloaga, P.; Grozescu, I.; Segneanu, A.E. Peptide and Amino Acids Separation and Identification from Natural Products. In Analytical Chemistry; Ira, S.K., Ed.; Intech: Rijeka, Croatia, 2012; pp. 135–146. [Google Scholar]
- Sasidharan, S.; Chen, Y.; Saravanan, D.; Yoga Latha, L. Extraction, isolation and characterization of bioactive compounds from plants’ extracts. Afr. J. Tradit. Complement. Altern. Med. 2011, 8, 1–10. [Google Scholar] [CrossRef] [PubMed]
- Abdul Md, M.; Syed, M.T.; Apurba, S.; Debasish, B.; Mohammad, S.I. Isolation and Identification of compounds from the Leaf Extract of Dillenia indica Linn. Bangladesh Pharm. J. 2010, 13, 49–53. [Google Scholar]
- Moughan, P.J. Amino acid availability: Aspects of chemical analysis and bioassay methodology. Nutr. Res. Rev. 2003, 16, 127–141. [Google Scholar] [CrossRef] [PubMed]
- Zamfir, A.D.; Serb, A.; Vukelic, Ž.; Flangea, C.; Schiopu, C.; Fabris, D.; Kalanj-Bognar, S.; Capitan, F.; Sisu, E. Assessment of the molecular expression and structure of gangliosides in brain metastasis of lung adenocarcinoma by an advanced approach based on fully automated chip-nanoelectrospray mass spectrometry. J. Am. Soc. Mass Spectrom. 2011, 22, 2145–2159. [Google Scholar] [CrossRef] [PubMed]
- Kerek, F. Peptide Having a High Cysteine Content. U.S. Patent 7750114 B2, 6 July 2010. [Google Scholar]
- Milbradt, A.G.; Kerek, F.; Moroder, L.; Renner, C. Structural characterization of hellethionins from Helleborus purpurascens. Biochemistry 2013, 42, 2404–2411. [Google Scholar] [CrossRef] [PubMed]
- Niculite, C.; Leabu, M. Timelapse monitoring of cell behavior as a tool in tissue engineering. IFMBE Proc. 2011, 36, 352–357. [Google Scholar]
- Rosu, T.; Pahontu, E.; Ilies, D.C.; Georgescu, R.; Mocanu, M.; Leabu, M.; Shova, S.; Gulea, A. Synthesis and characterization of some new complexes of Cu(II), Ni(II) and V(IV) with Schiff base derived from indole-3-carboxaldehyde. Biological activity on prokaryotes and eukaryotes. Eur. J. Med. Chem. 2012, 53C, 380–389. [Google Scholar] [CrossRef] [PubMed]
- Riguera, R. Isolating bioactive compounds from marine organisms. J. Mar. Biotechnol. 1997, 5, 187–193. [Google Scholar]
- Kaźmierczak, D.; Ciesielski, W.; Zakrzewski, R. Separation of Amino Acids as Phenyl Thiocarbamyl Derivatives by Normal and Reversed-Phase Thin-Layer Chromatography. J. Planar Chromatogr. 2005, 18, 427–431. [Google Scholar] [CrossRef]
- Sanchez-Machado, D.I.; Lopez-Cervantes, J.; Lopez-Hernandez, J.; Paseiro-Losada, P.; Simal-Lozano, J. High Performance Liquid Chromatographic Analysis of Amino Acids in Edible Seaweeds after Derivatization with Phenyl Isothiocyanate. Chromatographia 2003, 58, 159–163. [Google Scholar]
- Heinrikson, R.L.; Meridith, S.C. Amino acid analysis by reverse-phase high-performance liquid chromatography: Precolumn derivatization with phenylisothiocyanate. Anal. Biochem. 1984, 136, 65–74. [Google Scholar] [CrossRef]
- Ebert, R.F. Amino acid analysis by HPLC: Optimized conditions for chromatography of phenylthiocarbamyl derivatives. Anal. Biochem. 1986, 154, 431–435. [Google Scholar] [CrossRef]
- Cohen, S.A.; Strydom, D.J. Amino acid analysis utilizing phenyliosthiocyanate derivatives. Anal. Biochem. 1988, 174, 1–16. [Google Scholar] [CrossRef]
- Dimova, N. RP-HPLC Analysis of Amino acids with UV-detection. C. R. Acad. Bulg. Sci. 2003, 56, 12–75. [Google Scholar]
- Sample Availability: Samples of the compounds are not available from the authors.
© 2015 by the authors. Licensee MDPI, Basel, Switzerland. This article is an open access article distributed under the terms and conditions of the Creative Commons by Attribution (CC-BY) license ( http://creativecommons.org/licenses/by/4.0/).
Share and Cite
Segneanu, A.-E.; Grozescu, I.; Cziple, F.; Berki, D.; Damian, D.; Niculite, C.M.; Florea, A.; Leabu, M. Helleborus purpurascens—Amino Acid and Peptide Analysis Linked to the Chemical and Antiproliferative Properties of the Extracted Compounds. Molecules 2015, 20, 22170-22187. https://doi.org/10.3390/molecules201219819
Segneanu A-E, Grozescu I, Cziple F, Berki D, Damian D, Niculite CM, Florea A, Leabu M. Helleborus purpurascens—Amino Acid and Peptide Analysis Linked to the Chemical and Antiproliferative Properties of the Extracted Compounds. Molecules. 2015; 20(12):22170-22187. https://doi.org/10.3390/molecules201219819
Chicago/Turabian StyleSegneanu, Adina-Elena, Ioan Grozescu, Florentina Cziple, Daniel Berki, Daniel Damian, Cristina Mariana Niculite, Alexandru Florea, and Mircea Leabu. 2015. "Helleborus purpurascens—Amino Acid and Peptide Analysis Linked to the Chemical and Antiproliferative Properties of the Extracted Compounds" Molecules 20, no. 12: 22170-22187. https://doi.org/10.3390/molecules201219819
APA StyleSegneanu, A.-E., Grozescu, I., Cziple, F., Berki, D., Damian, D., Niculite, C. M., Florea, A., & Leabu, M. (2015). Helleborus purpurascens—Amino Acid and Peptide Analysis Linked to the Chemical and Antiproliferative Properties of the Extracted Compounds. Molecules, 20(12), 22170-22187. https://doi.org/10.3390/molecules201219819