
Enhanced Bioaccessibility of Crocetin Sugar Esters from Saffron in Infusions Rich in Natural Phenolic Antioxidants


Abstract
: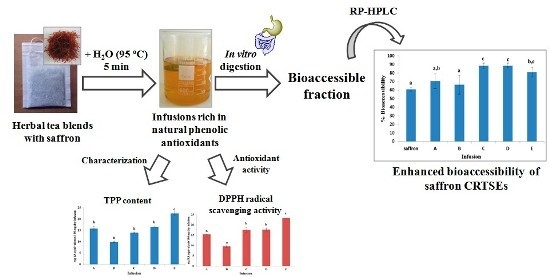
1. Introduction
2. Results and Discussion
2.1. Extractability and Stability of CRTSEs under the Infusion Preparation Conditions
2.2. Changes in the Profile and Content of CRTSEs upon in Vitro Gastrointestinal Digestion
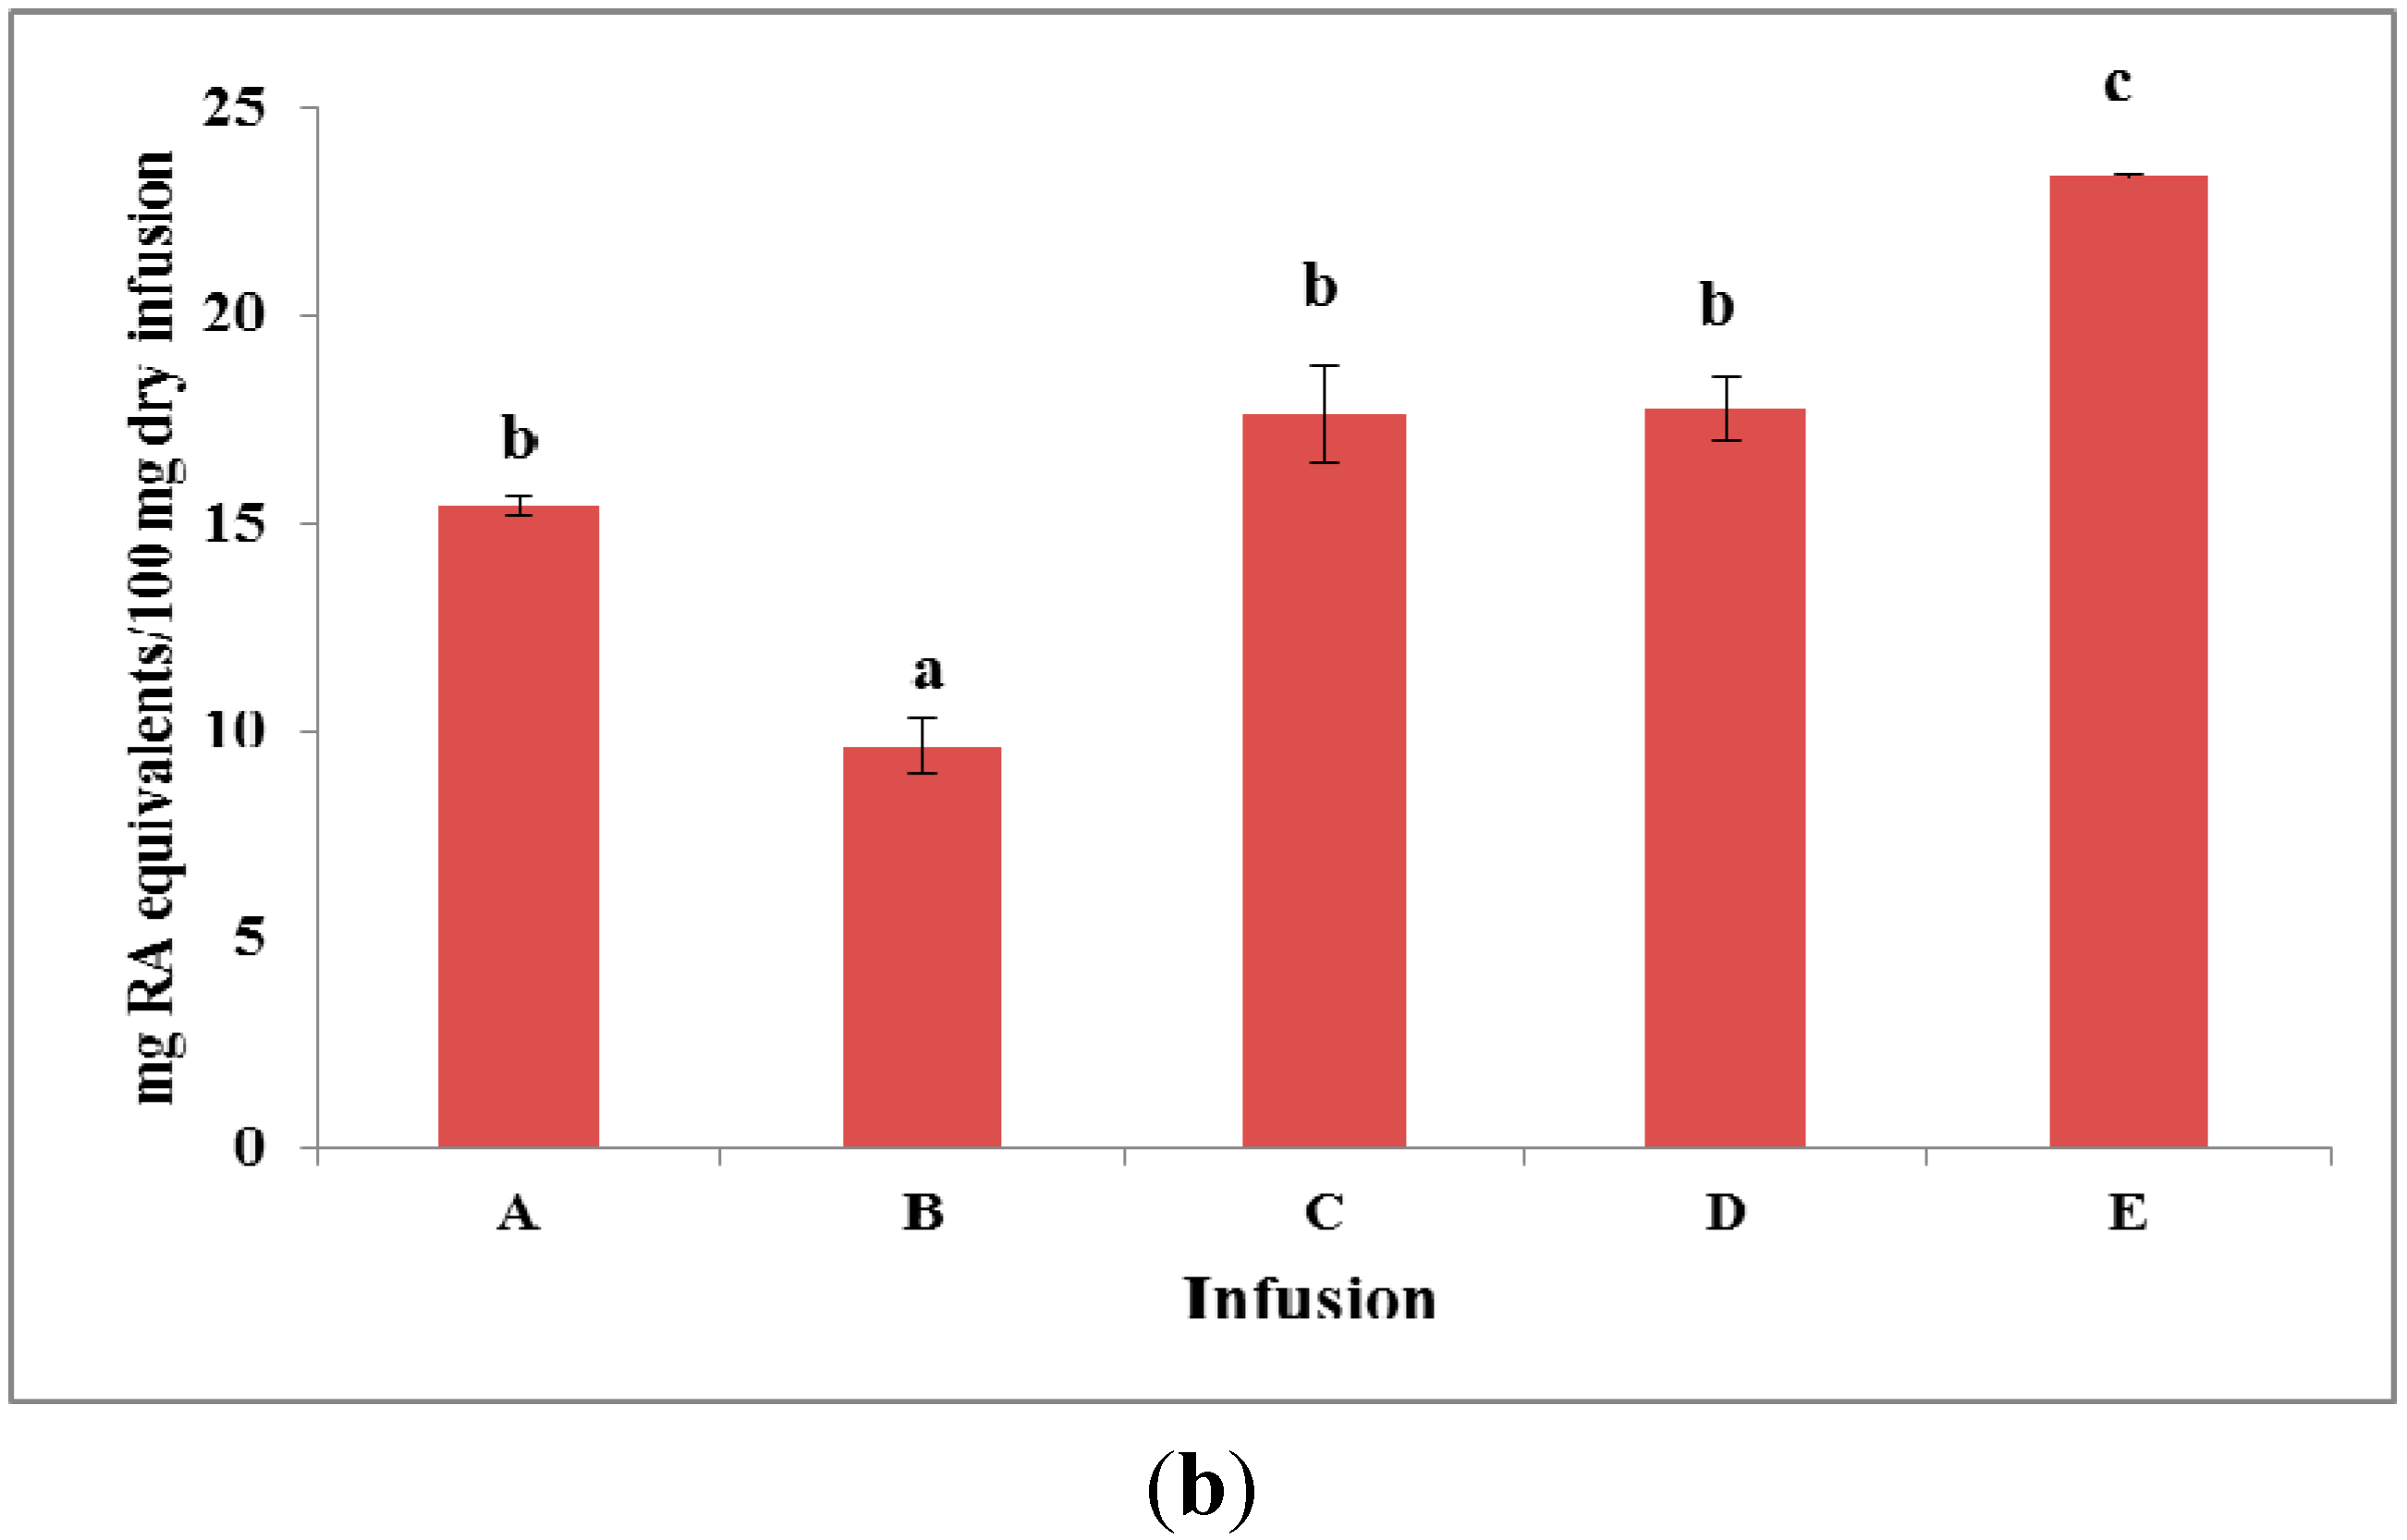
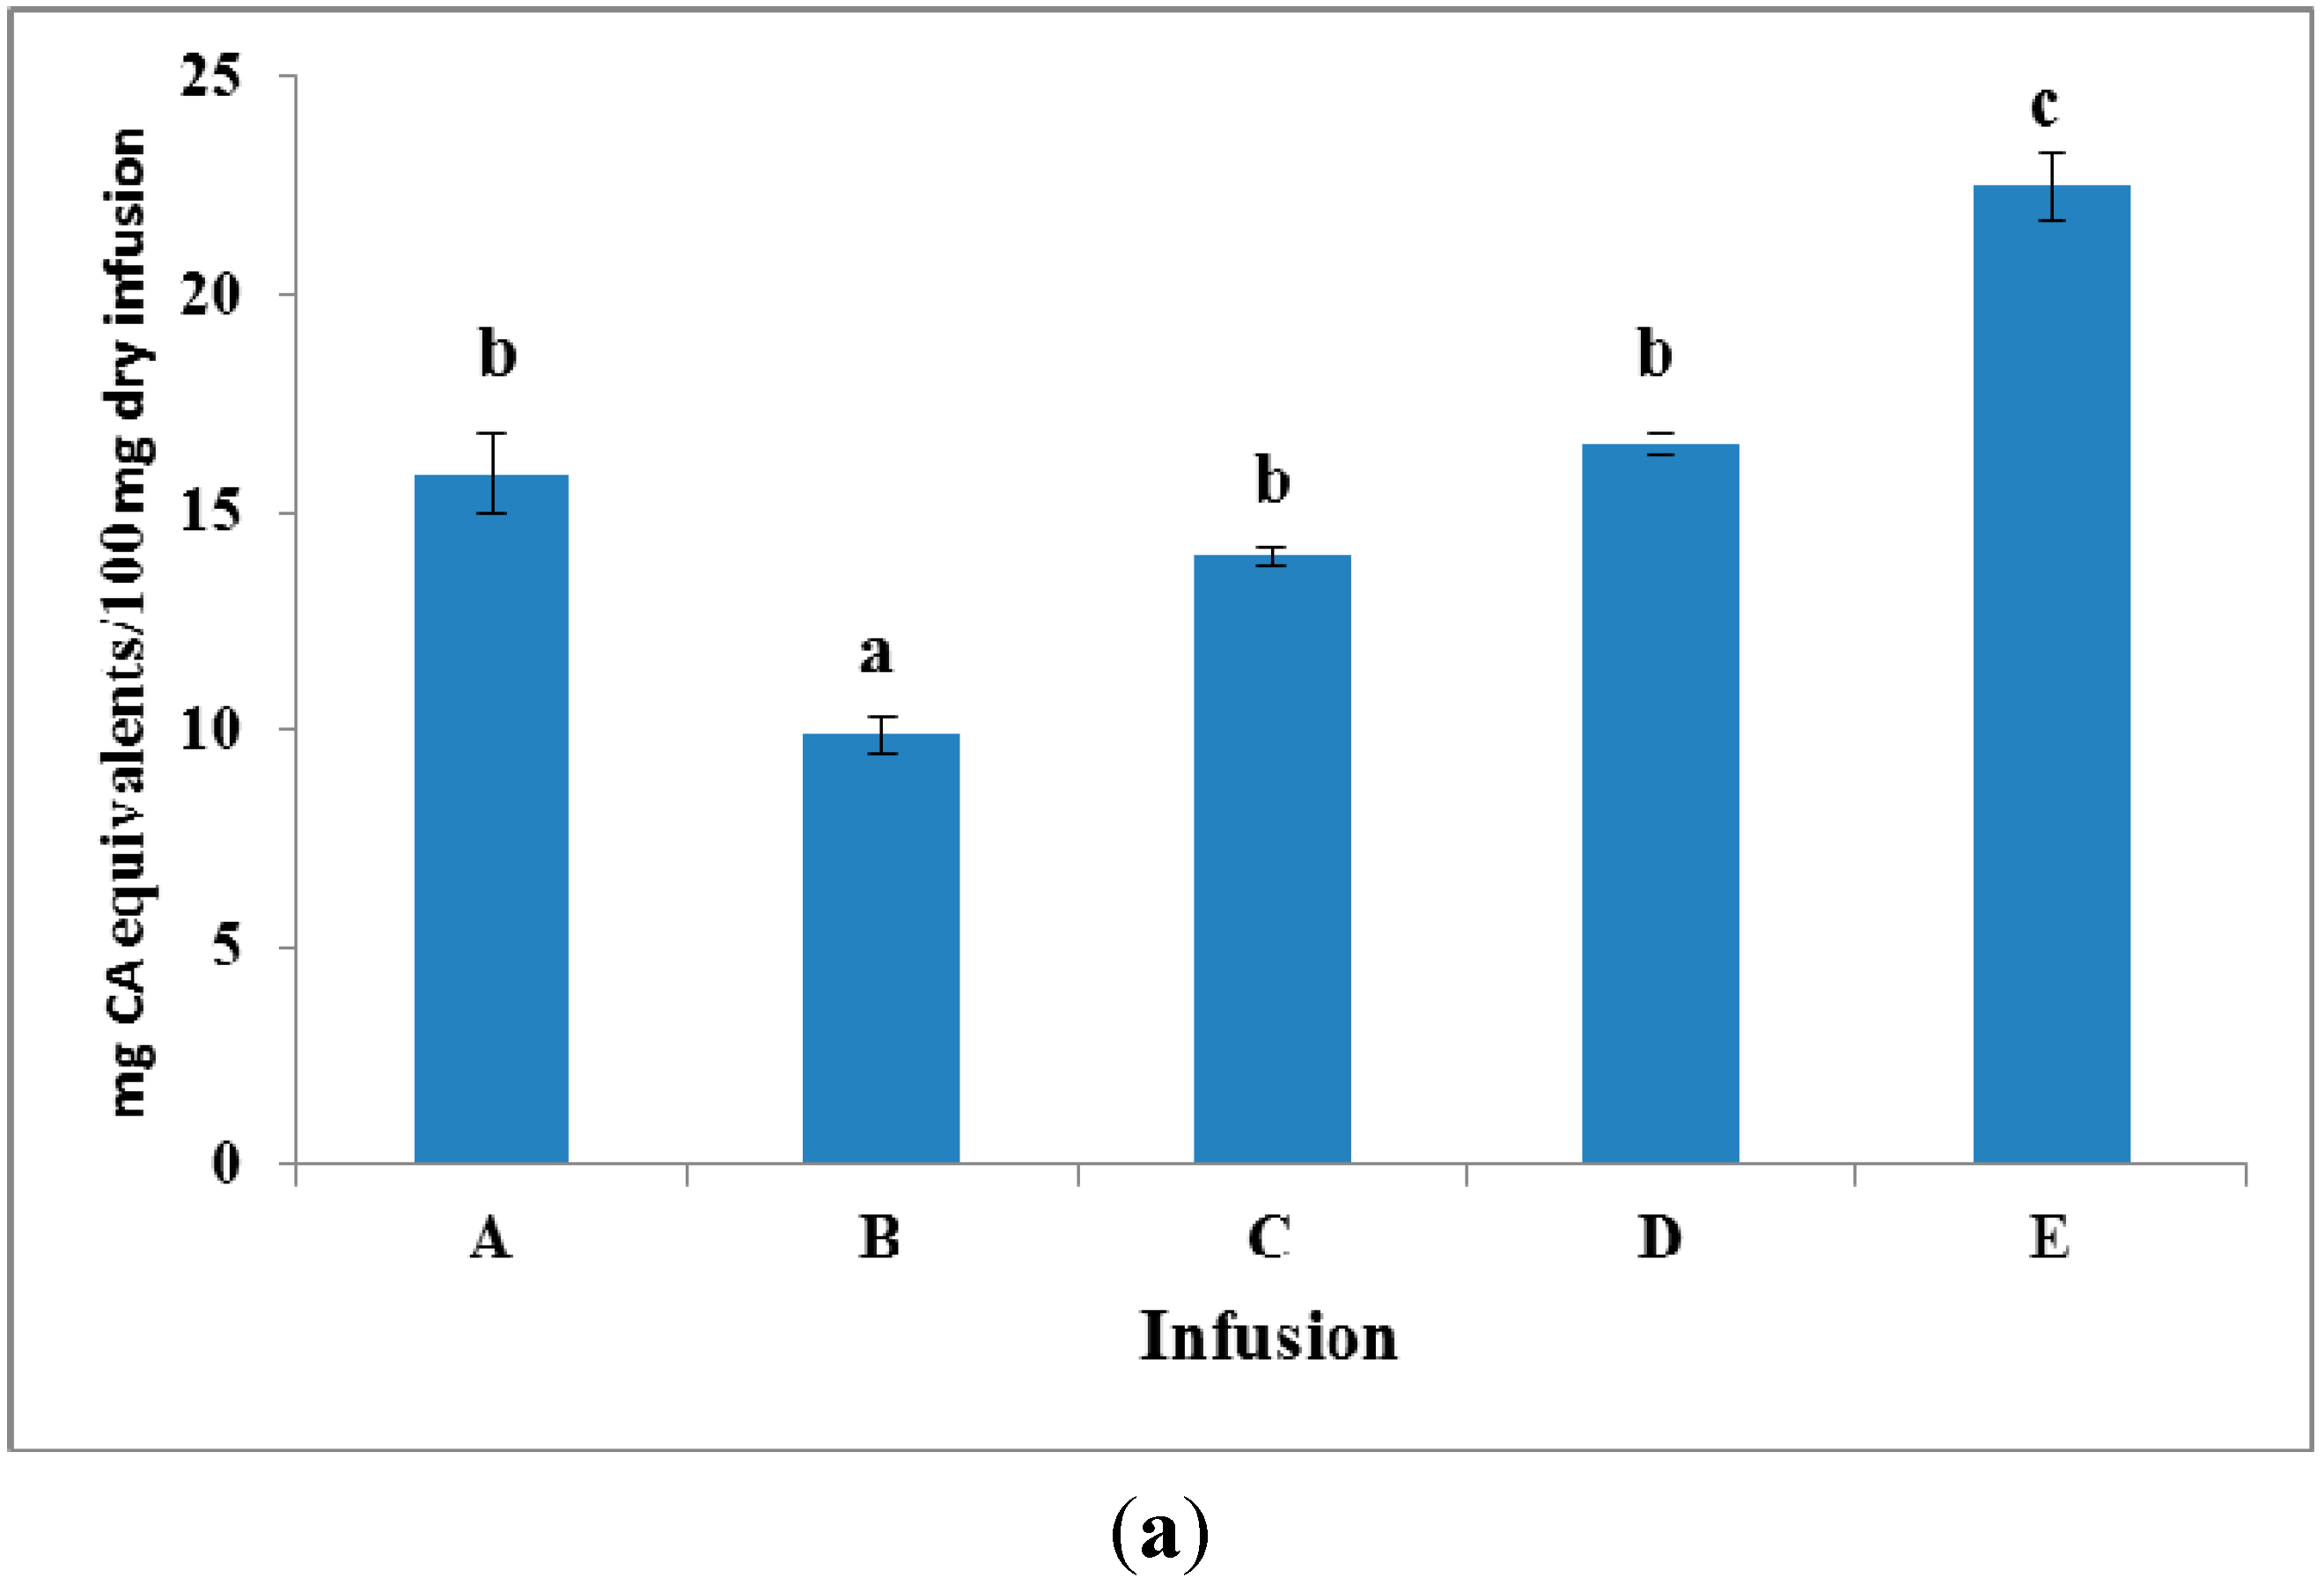
2.3. Total Phenol Content and DPPH Radical Scavenging Activity of Infusions


| CRTSEs: Rosmarinic Αcid (w/w) | % Bioaccessibility a,b | |
|---|---|---|
| CRTSEs | Rosmarinic Αcid | |
| 1:12 | 79.6 ± 6.7 b | 89.6 ± 5.1 a |
| 1:6 | 76.9 ± 4.1 b | 88.8 ± 2.3 a |
| 1:3 | 77.7 ± 4.0 b | 84.8 ± 3.3 a |
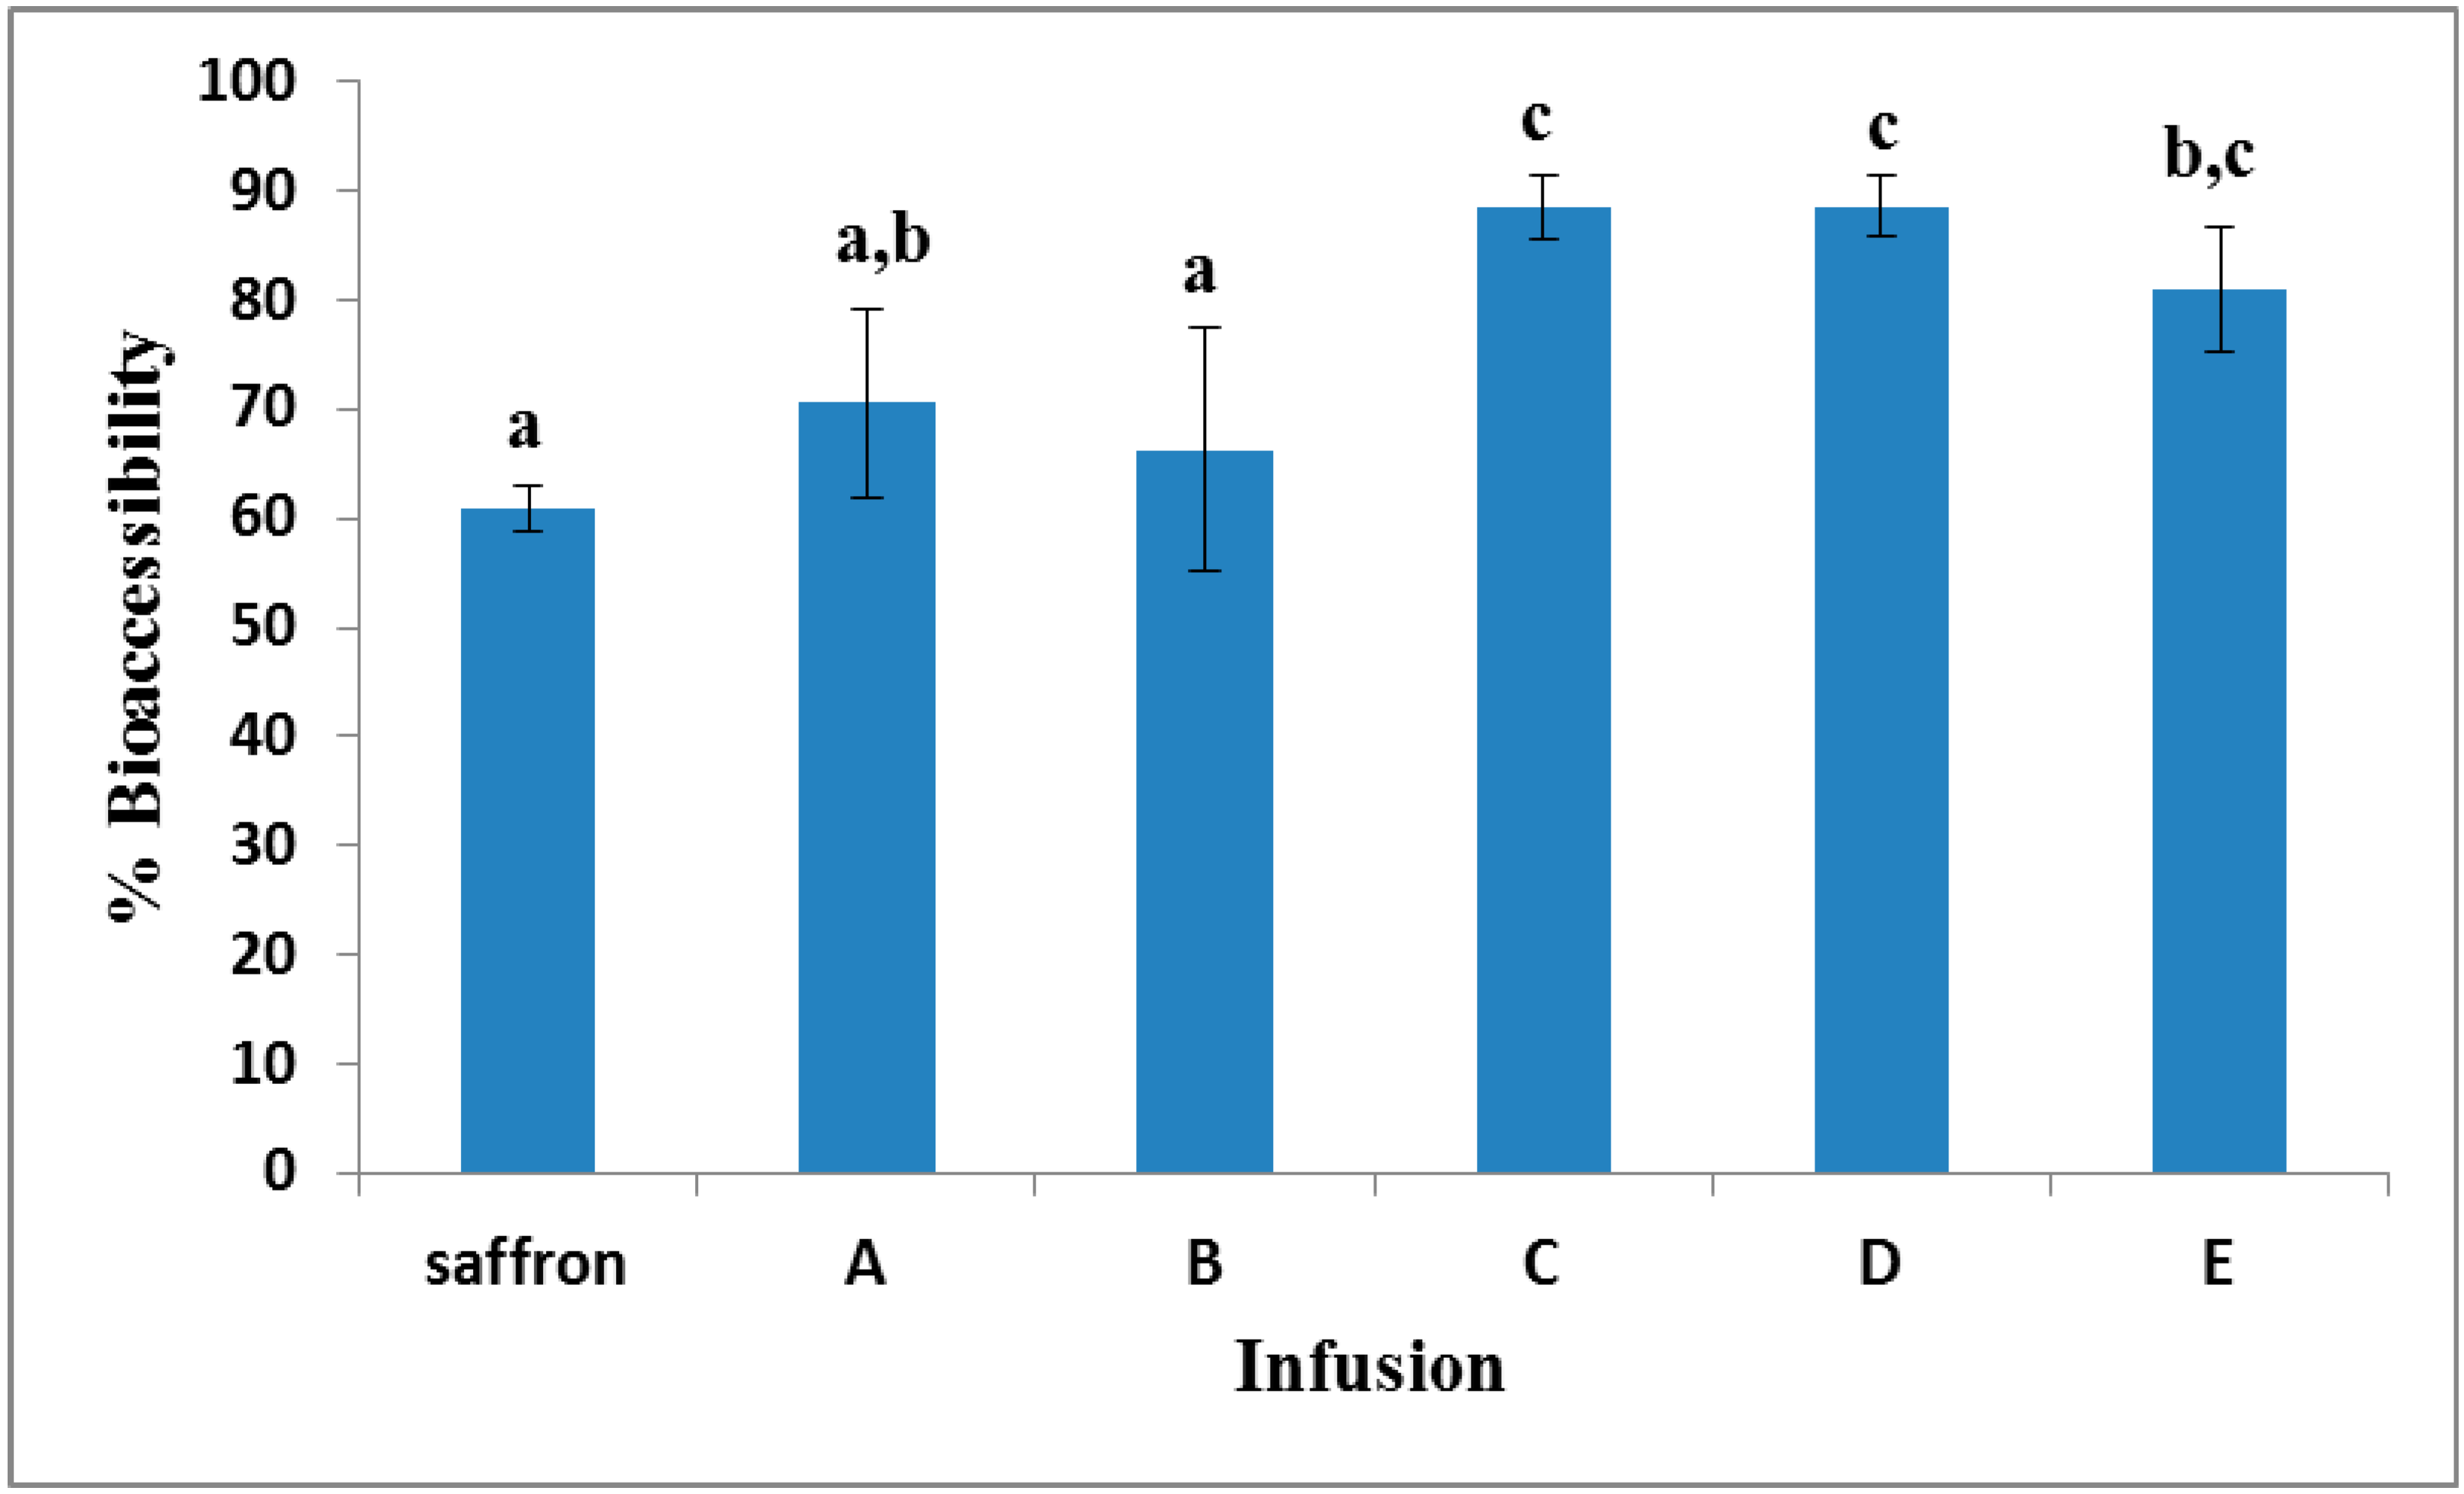
| 1:0 | 60.1 ± 4.9 a | - |
| Model Solution Composition | Bioaccessibility a,b | |
|---|---|---|
| % Crocetin Esters | % Phenolic Compound | |
| CRTSEs c:caffeic acid d | 87.6 ± 5.5 c | 95.2 ± 3.6 |
| CRTSEs c:cinnamic acid d | 49.5 ± 1.9 a | 89.3 ± 6.8 |
| CRTSEs c:rosmarinic acid d | 78.7 ± 1.0 b | 84.9 ± 4.5 |
| Reference sample | 51.6 ± 1.5 a | - |
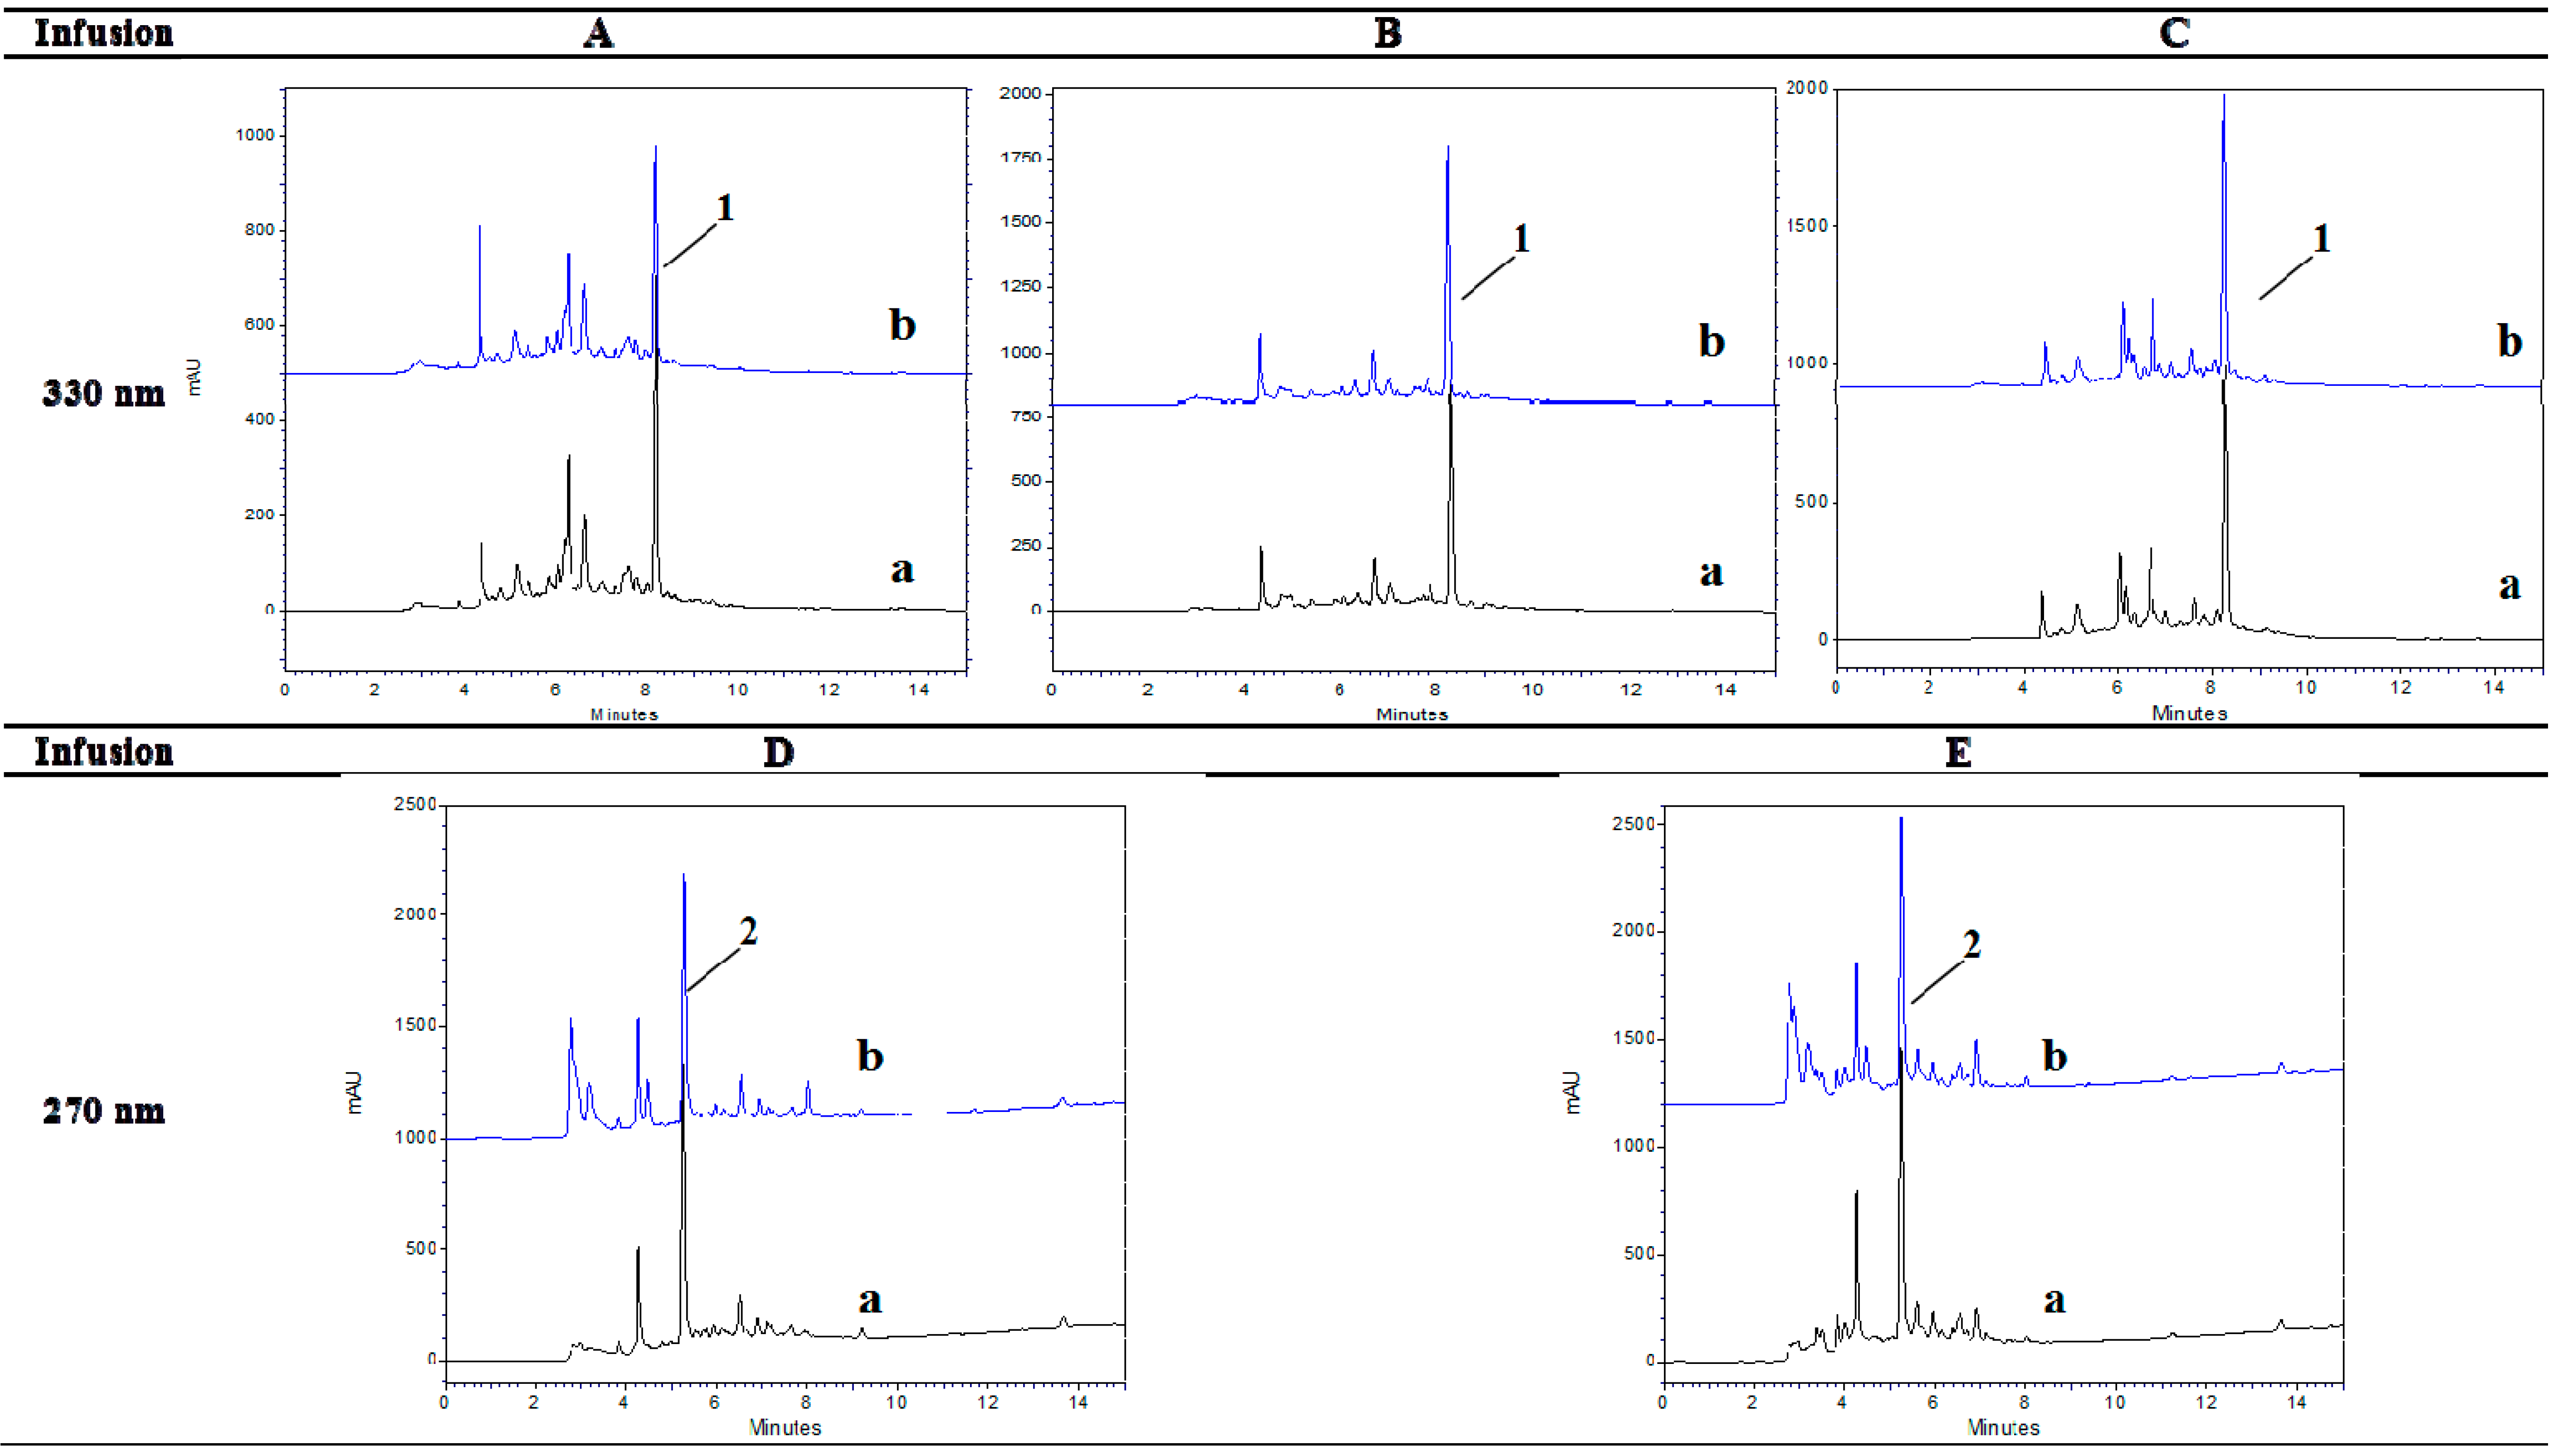
2.4. Changes in the Phenolic Profile and Individual Phenol Content of Infusions A–E upon Gastrointestinal Digestion
| Infusion | Before Digestion | After Digestion | % Bioaccessibility a |
|---|---|---|---|
| mg/100 mg dry infusion a,b | |||
| Total hydroxycinnamic acids c/rosmarinic acid (330 nm) | |||
| A | 3.09 ± 0.02 a/1.53 ± 0.04 a | 2.71 ± 0.14 a/1.09 ± 0.03 b | 87.6 ± 4.1/71.4 ± 2.9 |
| B | 2.70 ± 0.01 a/1.92 ± 0.03 a | 2.12 ± 0.30 b/1.76 ± 0.07 a | 78.6 ± 10.8/91.9 ± 3.2 |
| C | 2.44 ± 0.06 a/1.57 ± 0.04 a | 2.09 ± 0.41 b/1.71 ± 0.02 a | 86.2 ± 19.1/108.7 ± 3.9 |
| Total flavan-3-ols d/(−)-epicatechin (270 nm) | |||
| D | 12.99 ± 0.27 a/12.23 ± 0.30 a | 12.91 ± 0.60 a/10.68 ± 0.38 a | 99.3 ± 2.2/87.3 ± 1.3 |
| E | 19.47 ± 0.60 a/13.89 ± 0.26 a | 18.35 ± 0.30 a/12.60 ± 0.16 a | 94.3 ± 2.9/90.8 ± 1.5 |
2.4.1. Changes Observed in the Class of Hydroxycinnamic Acids
2.4.2. Changes Observed in the Class of Flavan-3-ols
3. Experimental Section
3.1. Samples
3.2. Standards, Reagents and Solvents
3.3. Preparation of the Infusions
3.4. Total Phenol Content by the Folin-Ciocalteu Assay
3.5. DPPH Radical Scavenging Activity
3.6. In Vitro Gastrointestinal Digestion Procedure
3.7. Liquid Chromatographic Analysis
3.7.1. Crocetin Sugar Esters
3.7.2. Phenolic Compounds
3.8. Statistical Analysis
4. Conclusions
Acknowledgment
Author Contributions
Conflicts of Interest
References
- Kyriakoudi, A.; Chrysanthou, A.; Mantzouridou, F.; Tsimidou, M.Z. Revisiting extraction of bioactive apocarotenoids from Crocus sativus L. dry stigmas (saffron). Anal. Chim. Acta 2012, 755, 77–85. [Google Scholar] [CrossRef] [PubMed]
- Kyriakoudi, A.; Ordoudi, S.A.; Roldan-Medina, M.; Tsimidou, M.Z. Saffron, A Functional Spice. Austin J. Nutri. Food Sci. 2015, 3, 1059. [Google Scholar]
- Fernández-García, E.; Carvajal-Lérida, I.; Pérez-Gálvez, A. In vitro bioaccessibility assessment as a prediction tool of nutritional efficiency. Nutr. Res. 2009, 29, 751–760. [Google Scholar] [CrossRef] [PubMed]
- Kyriakoudi, A.; Tsimidou, M.Z.; O’Callaghan, Y.C.; Galvin, K.; O’Brien, N.M. Changes in total and individual crocetin esters upon in vitro gastrointestinal digestion of saffron aqueous extracts. J. Agric. Food Chem. 2013, 61, 5318–5327. [Google Scholar] [CrossRef] [PubMed]
- McCarthy, A.; O’Brien, N.M. Bioaccessibility of functional ingredients. Curr. Nutr. Food Sci. 2013, 9, 271–282. [Google Scholar] [CrossRef]
- Rodríguez-Roque, M.J.; Rojas-Graü, M.A.; Elez-Martínez, P.; Martín-Belloso, O. In vitro bioaccessibility of health-related compounds from a blended fruit juice–soymilk beverage: Influence of the food matrix. J. Func. Foods 2014, 7, 161–169. [Google Scholar] [CrossRef]
- Van Der Burg-Koorevaar, M.C.D.; Miret, S.; Duchateau, G.S.M.J.E. Effect of milk and brewing method on black tea catechin bioaccessibility. J. Agric. Food Chem. 2011, 59, 7752–7758. [Google Scholar] [CrossRef] [PubMed]
- Piljac-Žegarac, J.; Šamec, D.; Piljac, A. Herbal teas: A focus on antioxidant properties. In Tea in Health and Disease Prevention; Preedy, V., Ed.; Academic Press: Massachusetts, MA, USA, 2013; Chapter 11; pp. 129–140. [Google Scholar]
- Sánchez, A.M.; Carmona, M.; Ordoudi, S.A.; Tsimidou, M.Z.; Alonso, G.L. Kinetics of individual crocetin ester degradation in aqueous extracts of saffron (Crocus sativus L.) upon thermal treatment in the dark. J. Agric. Food Chem. 2008, 56, 1627–1637. [Google Scholar] [CrossRef] [PubMed]
- Tsimidou, M.; Tsatsaroni, E. Stability of saffron pigments in aqueous extracts. J. Food Sci. 1993, 58, 1073–1075. [Google Scholar] [CrossRef]
- Podsędek, A.; Redzynia, M.; Klewicka, E.; Koziołkiewicz, M. Matrix effects on the stability and antioxidant activity of red cabbage anthocyanins under simulated gastrointestinal digestion. Biomed. Res. Int. 2014, 2014, 1–11. [Google Scholar] [CrossRef] [PubMed]
- Rodríguez-Roque, M.J.; Rojas-Graü, M.A.; Elez-Martínez, P.; Martín-Belloso, O. Changes in vitamin C, phenolic, and carotenoid profiles throughout in vitro gastrointestinal digestion of a blended fruit juice. J. Agric. Food Chem. 2013, 61, 1859–1867. [Google Scholar] [CrossRef] [PubMed]
- Jeszka-Skowron, M.; Zgoła-Grześkowiak, A. Analysis of antioxidant activity, chlorogenic acid, and rutin content of Camellia sinensis infusions using response surface methodology optimization. Food Anal. Methods 2014, 7, 2033–2041. [Google Scholar] [CrossRef]
- Joubert, E.; de Beer, D. Rooibos (Aspalathus linearis) beyond the farm gate: From herbal tea to potential phytopharmaceutical. South Afr. J. Bot. 2011, 77, 869–886. [Google Scholar] [CrossRef]
- Lee, J. Caffeic acid derivatives in dried Lamiaceae and Echinacea purpurea products. J. Funct. Foods 2010, 2, 158–162. [Google Scholar] [CrossRef]
- Tsakona, S.; Galanakis, C.M.; Gekas, V. Hydro-ethanolic mixtures for the recovery of phenols from Mediterranean plant materials. Food Bioprocess Technol. 2010, 5, 1384–1393. [Google Scholar] [CrossRef]
- Kapp, K.; Hakala, E.; Orav, A.; Pohjala, L.; Vuorela, P.; Püssa, T.; Vuorela, H.; Raal, A. Commercial peppermint (Mentha × piperita L.) teas: Antichlamydial effect and polyphenolic composition. Food Res. Int. 2013, 53, 758–766. [Google Scholar] [CrossRef]
- Ordoudi, S.A.; Befani, C.D.; Nenadis, N.; Koliakos, G.G.; Tsimidou, M.Z. Further examination of antiradical properties of Crocus sativus stigmas extract rich in crocins. J. Agric. Food Chem. 2009, 57, 3080–3086. [Google Scholar] [CrossRef] [PubMed]
- Nenadis, N.; Lazaridou, O.; Tsimidou, M.Z. Use of reference compounds in antioxidant activity assessment. J. Agric. Food Chem. 2007, 55, 5452–5460. [Google Scholar] [CrossRef] [PubMed]
- Martínez-Ortega, M.V.; García-Parrilla, M.C.; Troncoso, A.M. Changes in phenolic composition of wines submitted to in vitro dissolution tests. Food Chem. 2001, 73, 11–16. [Google Scholar] [CrossRef]
- Fecka, I.; Turek, S. Determination of polyphenolic compounds in commercial herbal drugs and spices from Lamiaceae: Thyme, wild thyme and sweet marjoram by chromatographic techniques. Food Chem. 2008, 108, 1039–1053. [Google Scholar] [CrossRef] [PubMed]
- Freeman, B.L.; Eggett, D.L.; Parker, T.L. Synergistic and antagonistic interactions of phenolic compounds found in navel oranges. J. Food Sci. 2010, 75, 570–576. [Google Scholar] [CrossRef] [PubMed]
- Frontela, C.; Ros, G.; Martínez, C.; Sánchez-Siles, L.M.; Canali, R.; Virgili, F. Stability of Pycnogenol® as an ingredient in fruit juices subjected to in vitro gastrointestinal digestion. J. Sci. Food Agric. 2011, 91, 286–292. [Google Scholar] [CrossRef] [PubMed]
- ISO. Saffron (Crocus sativus Linneaus) Part 1: Specifications. ternational Organization for Standardization; ISO 3632-1; ISO; Geneva, Switzerland, 2011. [Google Scholar]
- Kyriakoudi, A.; Tsimidou, M.Z. A food-grade approach to isolate crocetin from saffron (Crocus sativus L.) extracts. Food Anal. Methods 2015, 8, 2261–2272. [Google Scholar] [CrossRef]
- Nenadis, N.; Tsimidou, M. Observations on the estimation of scavenging activity of phenolic compounds using rapid 1,1-diphenyl-2-picrylhydrazyl (DPPH.) Tests. J. Am. Oil Chem. Soc. 2002, 79, 1191–1195. [Google Scholar] [CrossRef]
- Carmona, M.; Zalacain, A.; Sánchez, A.M.; Novella, J.L.; Alonso, G.L. Crocetin esters, picrocrocin and its related compounds present in Crocus sativus stigmas and Gardenia jasminoides fruits. Tentative identification of seven new compounds by LC-ESI-MS. J. Agric. Food Chem. 2006, 54, 973–979. [Google Scholar] [CrossRef] [PubMed]
- Tarantilis, P.; Tsoupras, G.; Polissiou, M. Determination of saffron (Crocus sativus L.) components in crude plant extract using high -performance liquid chromatography-UV-visible photodiode-array detection mass spectrometry. J. Chromatogr. A 1995, 699, 107–118. [Google Scholar] [CrossRef]
- Sample Availability: Not available by the authors.
© 2015 by the authors. Licensee MDPI, Basel, Switzerland. This article is an open access article distributed under the terms and conditions of the Creative Commons Attribution license ( http://creativecommons.org/licenses/by/4.0/).
Share and Cite
Ordoudi, S.A.; Kyriakoudi, A.; Tsimidou, M.Z. Enhanced Bioaccessibility of Crocetin Sugar Esters from Saffron in Infusions Rich in Natural Phenolic Antioxidants. Molecules 2015, 20, 17760-17774. https://doi.org/10.3390/molecules201017760
Ordoudi SA, Kyriakoudi A, Tsimidou MZ. Enhanced Bioaccessibility of Crocetin Sugar Esters from Saffron in Infusions Rich in Natural Phenolic Antioxidants. Molecules. 2015; 20(10):17760-17774. https://doi.org/10.3390/molecules201017760
Chicago/Turabian StyleOrdoudi, Stella A., Anastasia Kyriakoudi, and Maria Z. Tsimidou. 2015. "Enhanced Bioaccessibility of Crocetin Sugar Esters from Saffron in Infusions Rich in Natural Phenolic Antioxidants" Molecules 20, no. 10: 17760-17774. https://doi.org/10.3390/molecules201017760
APA StyleOrdoudi, S. A., Kyriakoudi, A., & Tsimidou, M. Z. (2015). Enhanced Bioaccessibility of Crocetin Sugar Esters from Saffron in Infusions Rich in Natural Phenolic Antioxidants. Molecules, 20(10), 17760-17774. https://doi.org/10.3390/molecules201017760