Imaging Live Cells at the Nanometer-Scale with Single-Molecule Microscopy: Obstacles and Achievements in Experiment Optimization for Microbiology

Abstract
:
1. Introduction
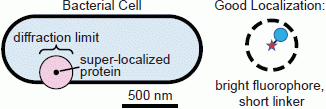
1.1. Conventional Limits: The Diffraction Limit of Light
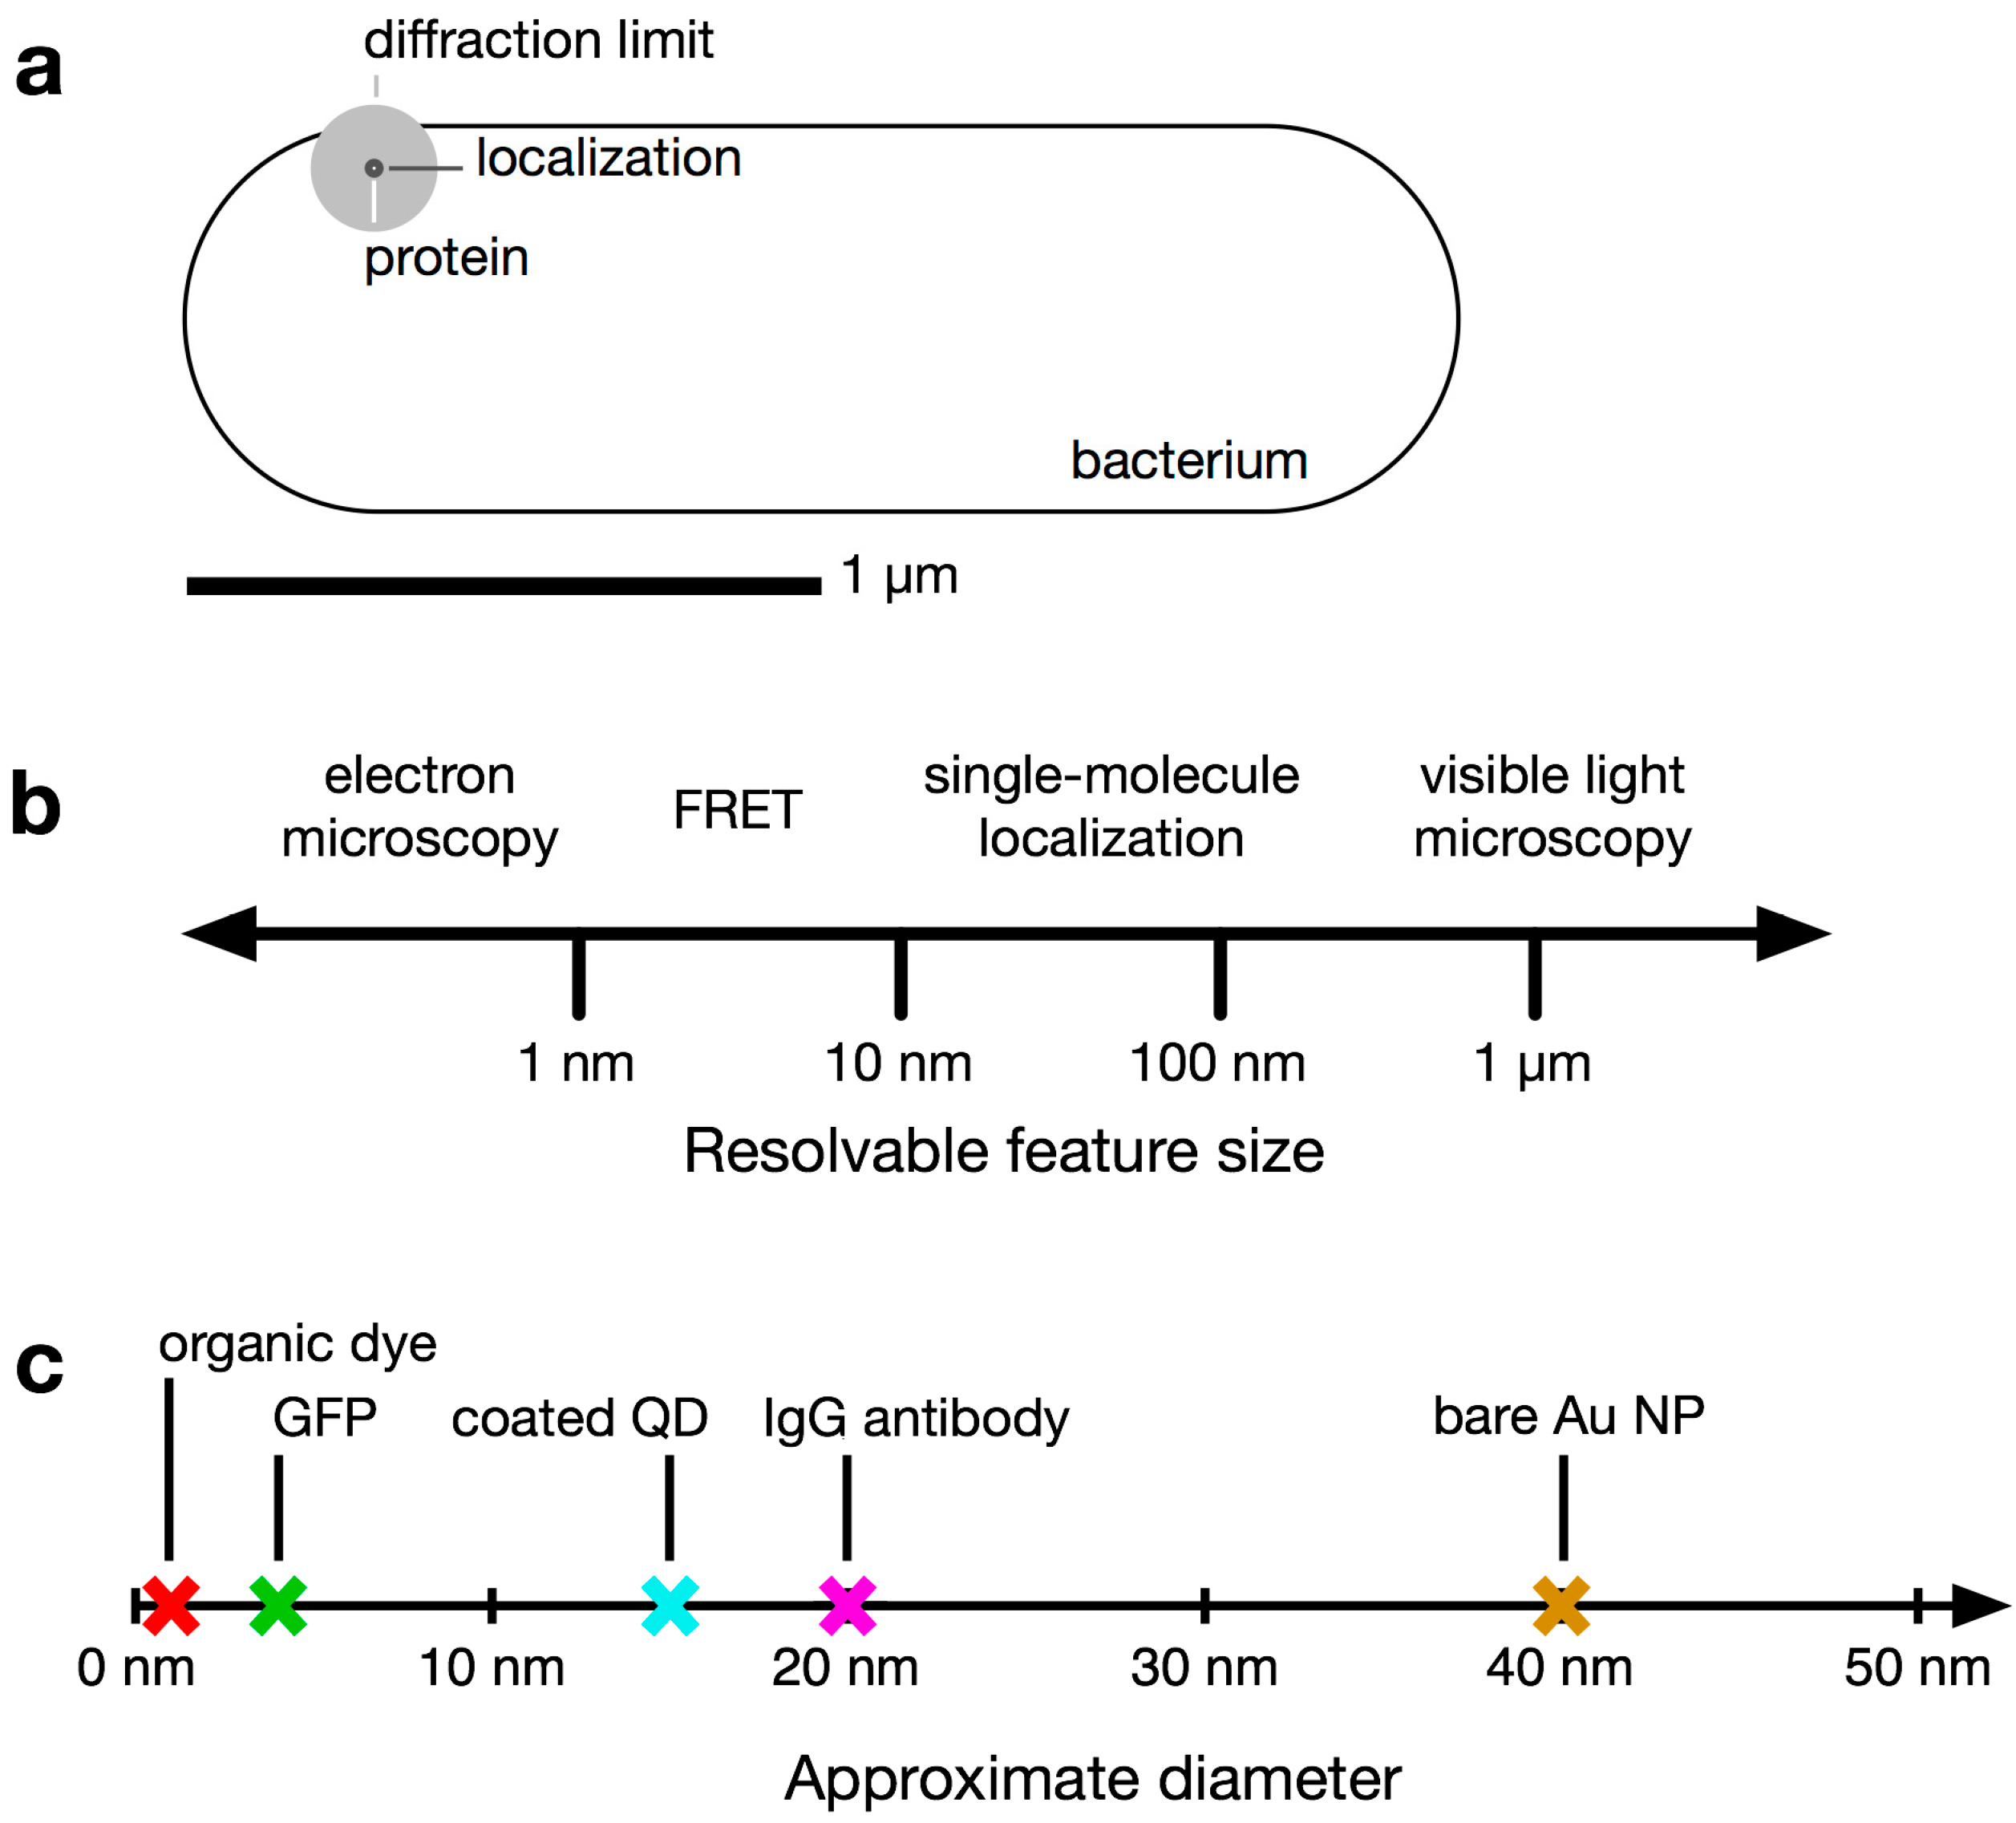
1.2. Super-Resolution Microscopy

| Method | Full Name | Reference |
|---|---|---|
| FIONA | Fluorescence Imaging with One-Nanometer Accuracy | [16] |
| SHRImP | Single-molecule High-Resolution Imaging with Photobleaching | [20] |
| NALMS | Nanometer-Localized Single-Molecule Fluorescence Microscopy | [21] |
| SHREC | Single-molecule High-Resolution Colocalization | [22] |
| ICA | Superresolution by Localization of Quantum Dots Using Blinking Statistics | [23] |
| PALM | Photoactivated Localization Microscopy | [12] |
| STORM | Stochastic Optical Reconstruction Microscopy | [14] |
| FPALM | Fluorescence Photoactivation Localization Microscopy | [13] |
| PAINT | Point Accumulation for Imaging in Nanoscale Topography | [24] |
| PALMIRA | PALM with Independently Running Acquisition | [25] |
| dSTORM | Direct STORM | [26] |
| uPAINT | Universal PAINT | [27] |
| CALM | Complementation Activated Localization Microscopy | [28] |
| BALM | Binding-Activated Localization Microscopy | [29] |
| SPRAIPAINT | Superresolution by Power-Dependent Active Intermittency PAINT | [30] |
| BaLM | Bleaching/blinking assisted Localization Microscopy | [31] |
| SMACM | Single-Molecule Active-Control Microscopy | [32] |
| TALM | Tracking and Localization Microscopy | [33] |
| FRET | Förster Resonance Energy Transfer | [7] |
| FCS | Fluorescence Correlation Spectroscopy | [34] |
| FRAP | Fluorescence Recovery After Photobleaching | [35] |
| STED | Stimulated Emission Depletion | [17] |
| (S)SIM | Saturated Structured-Illumination Microscopy | [18] |
1.3. Bacteria Beyond the Diffraction Limit
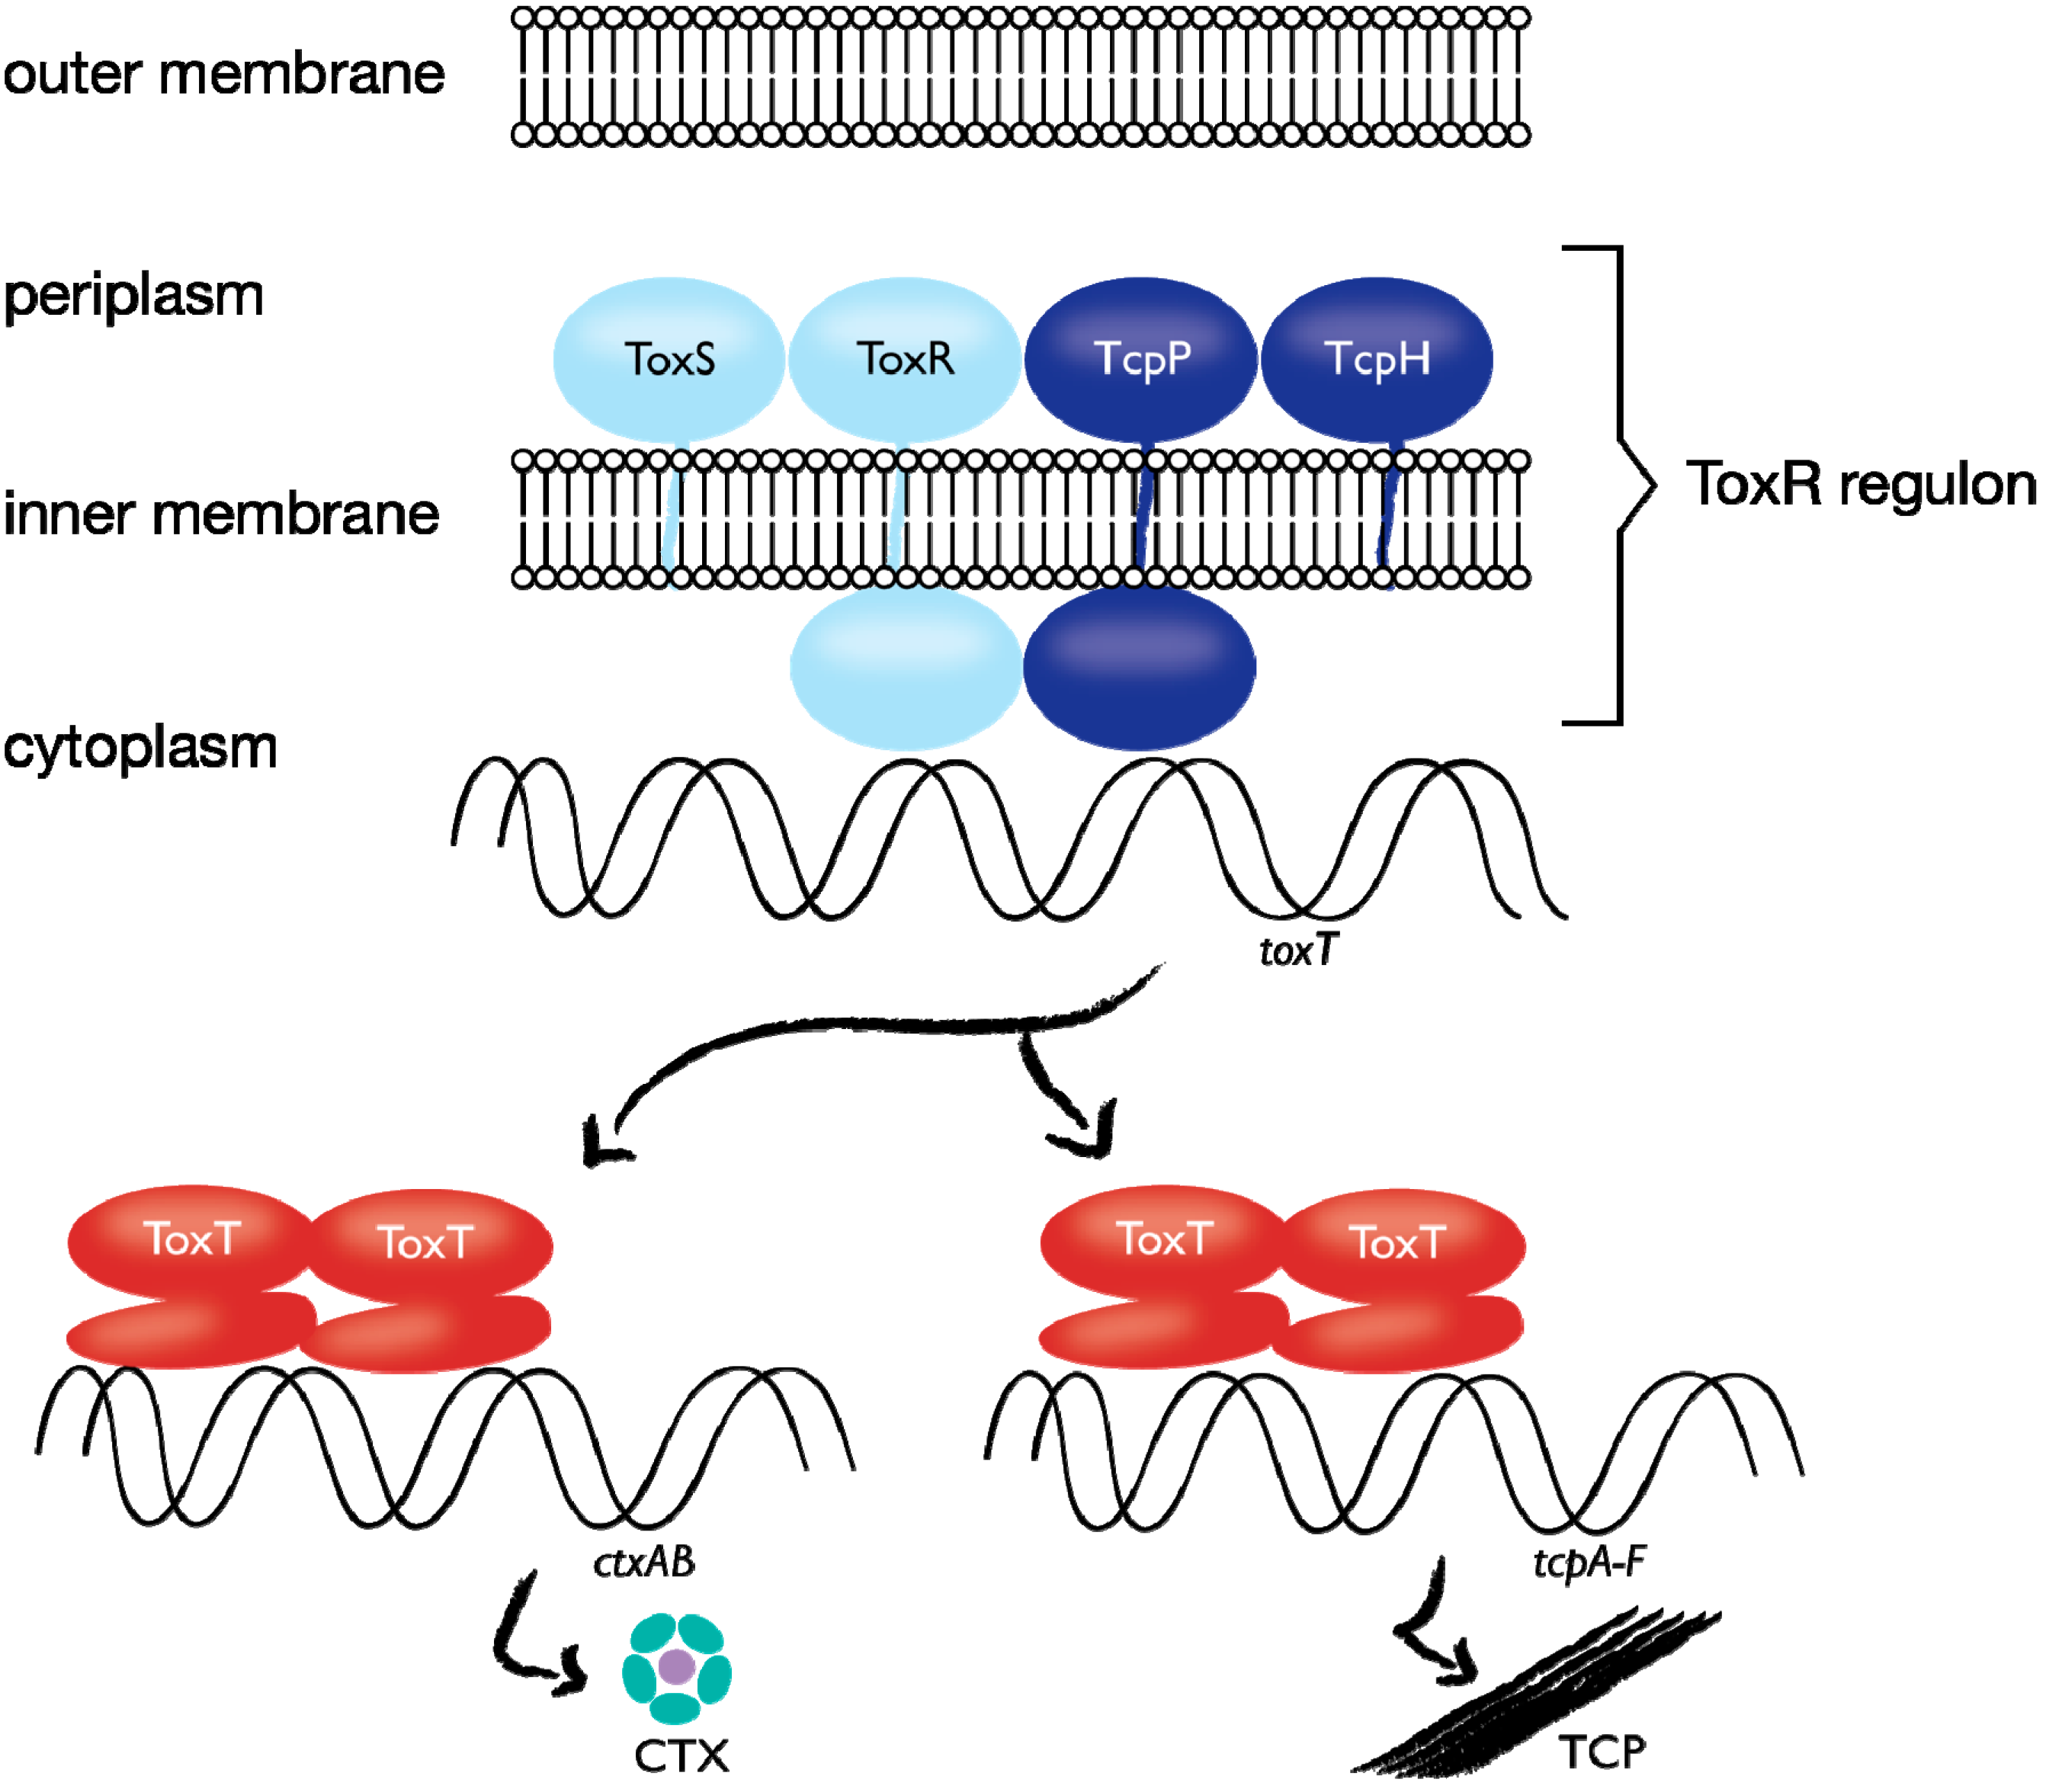
1.4. Case Study: Membrane-bound Transcription Regulation in the Human Pathogen V. cholerae

| Species | Proteins | References |
|---|---|---|
| Vibrio cholerae | ToxR | [48] |
| TcpP | [49] | |
| CadC | [50] | |
| TfoS | [51] | |
| Vibrio fischeri | LuxR | [52] |
| ToxR | [53] | |
| Vibrio parahaemolyticus | ToxR | [54] |
| Escherichia coli | CadC | [55] |
| Bacteroides thetaiotaomicron | SusR | [56] |
| Yersinia pseudotuberculosis | PsaE | [57] |
| Photobacterium spp. | ToxR | [58] |
| Salmonella typhimurium | MarT | [59] |
| Sulfolobus acidocaldarius | ArnR | [60] |
2. Fluorescent Labels
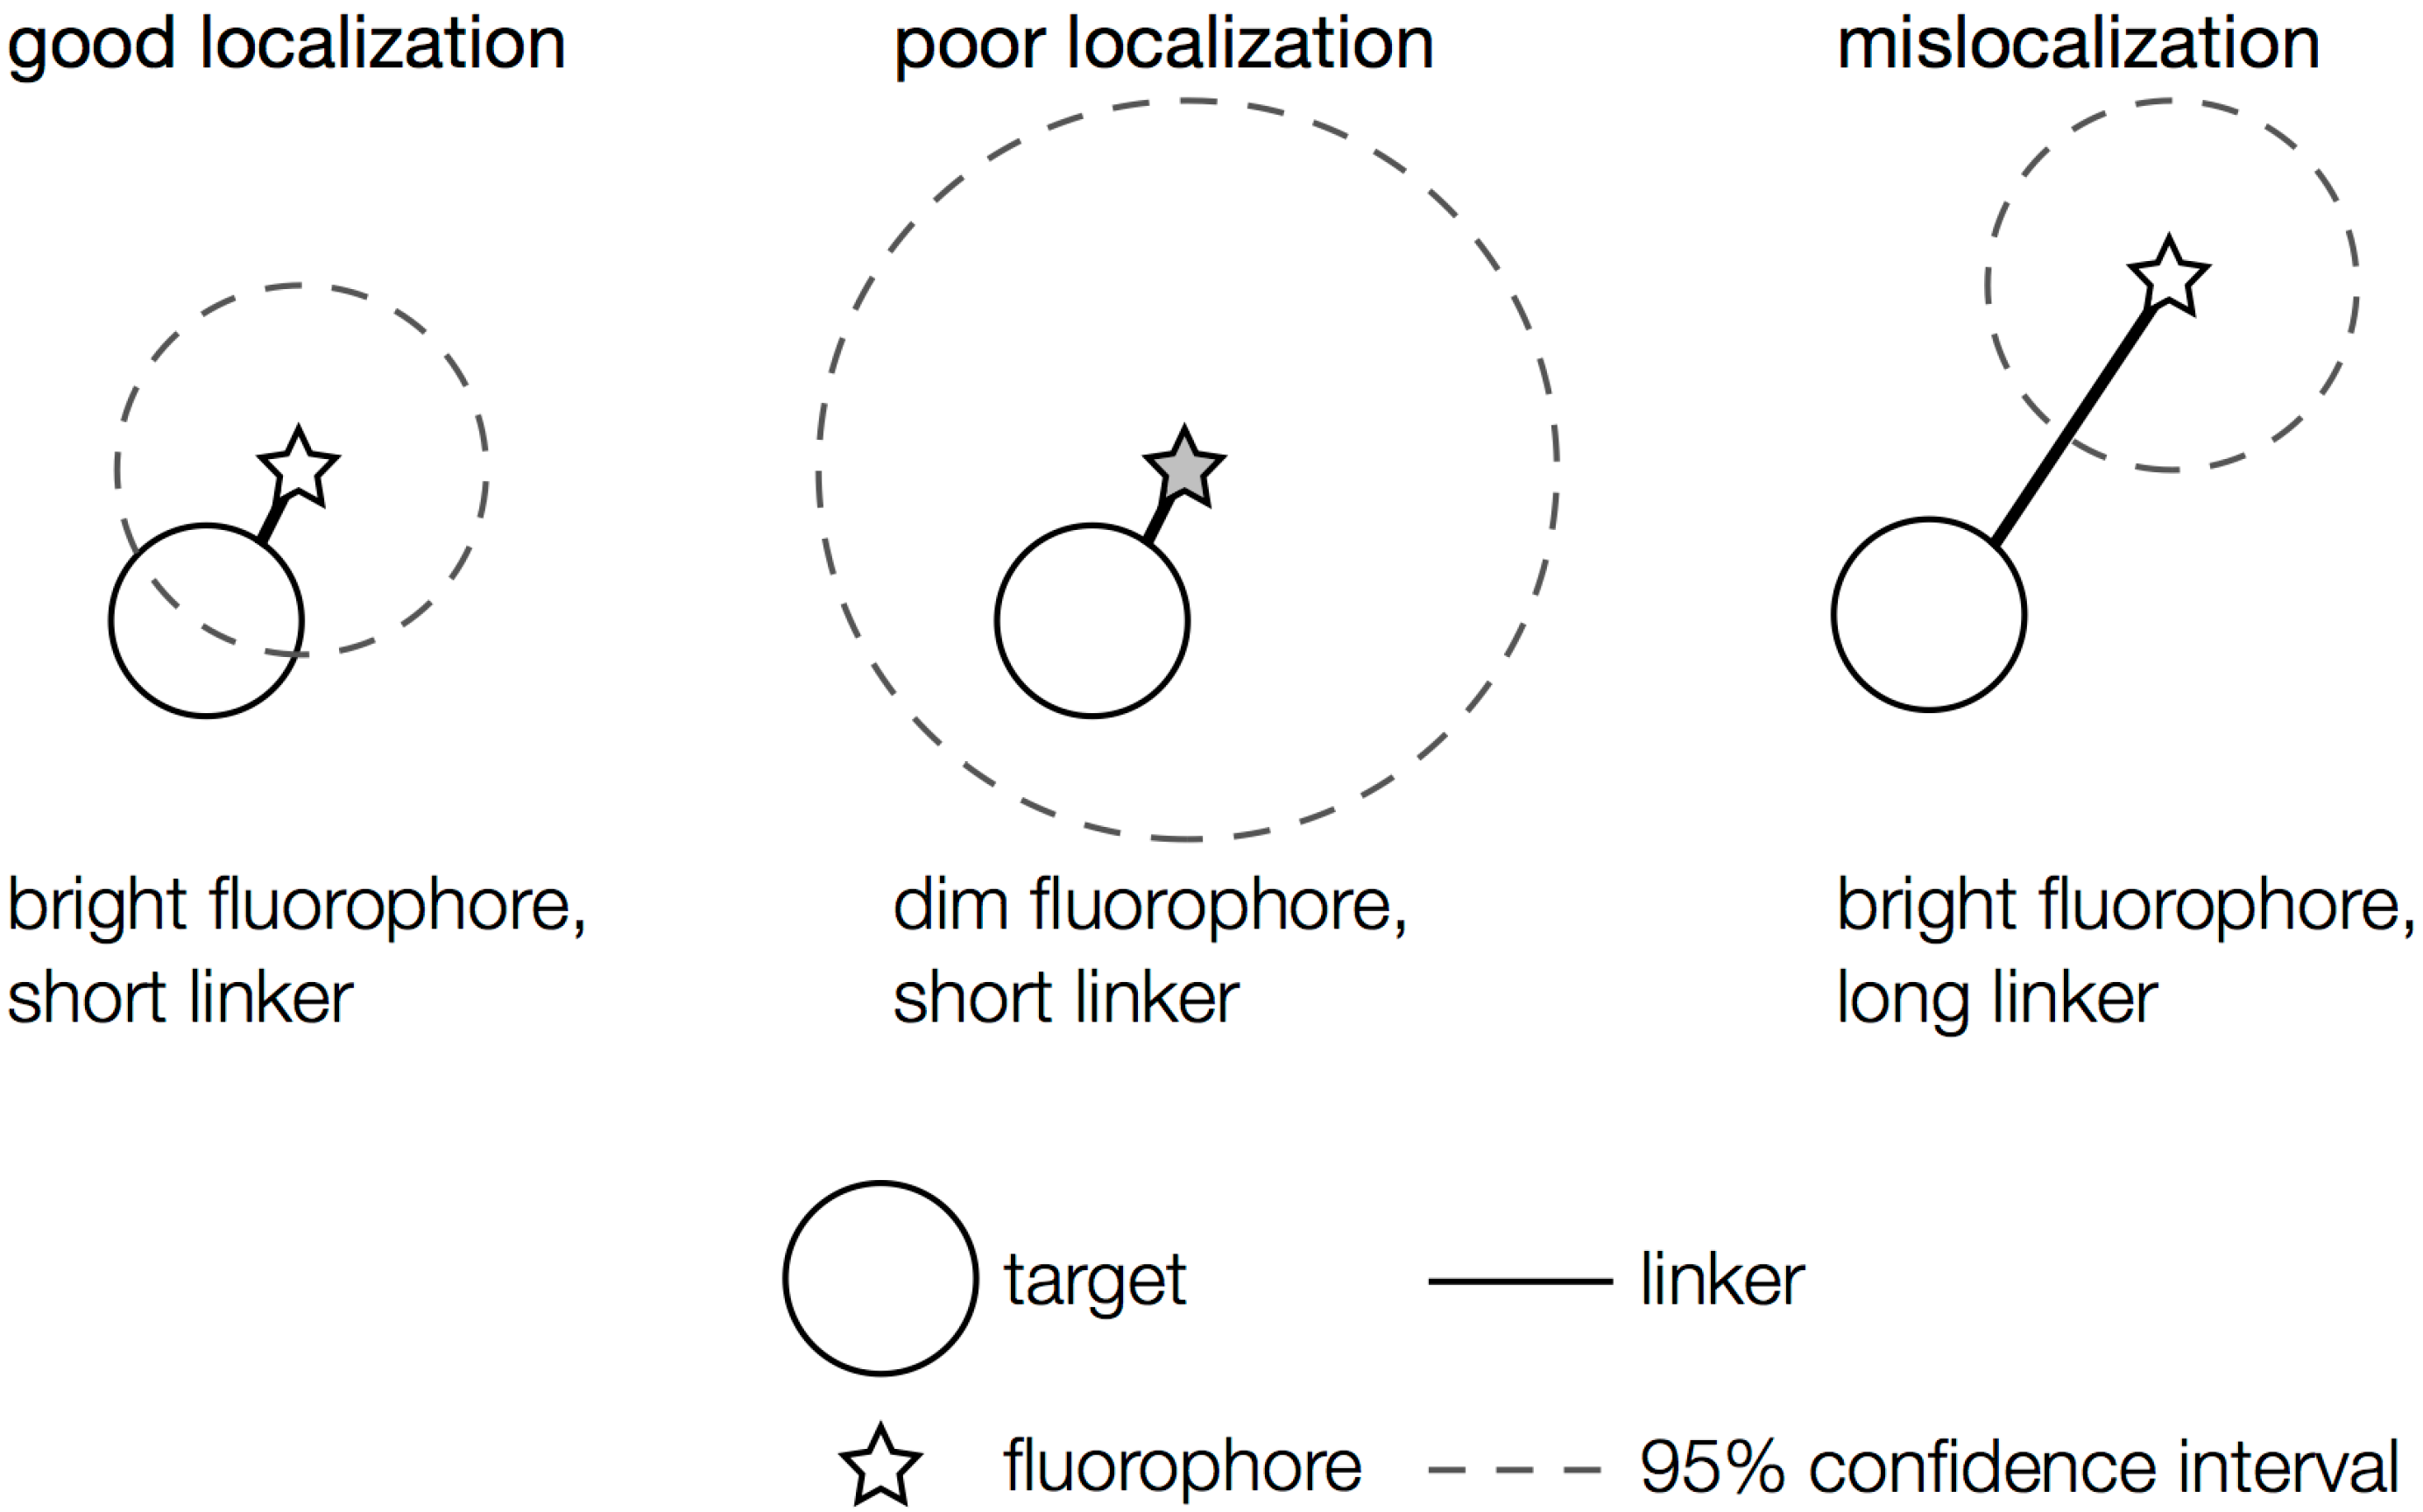
2.1. General Considerations

2.2. Fluorescent Proteins


2.3. Small-Molecule Dyes
2.4. Other Labeling Schemes
3. Sample Considerations
3.1. Achieving Single-Molecule Levels of Fluorescence

3.2. Minimizing Cell Stress
3.3. Drift
3.4. Sources of Background
3.5. Balancing Speed with Precision
4. Analysis Methods
4.1. Localization
4.2. Single-Particle Tracking

4.3. Mean Squared Displacement Analysis
4.4. Cumulative Probability Distribution Analysis

 ,
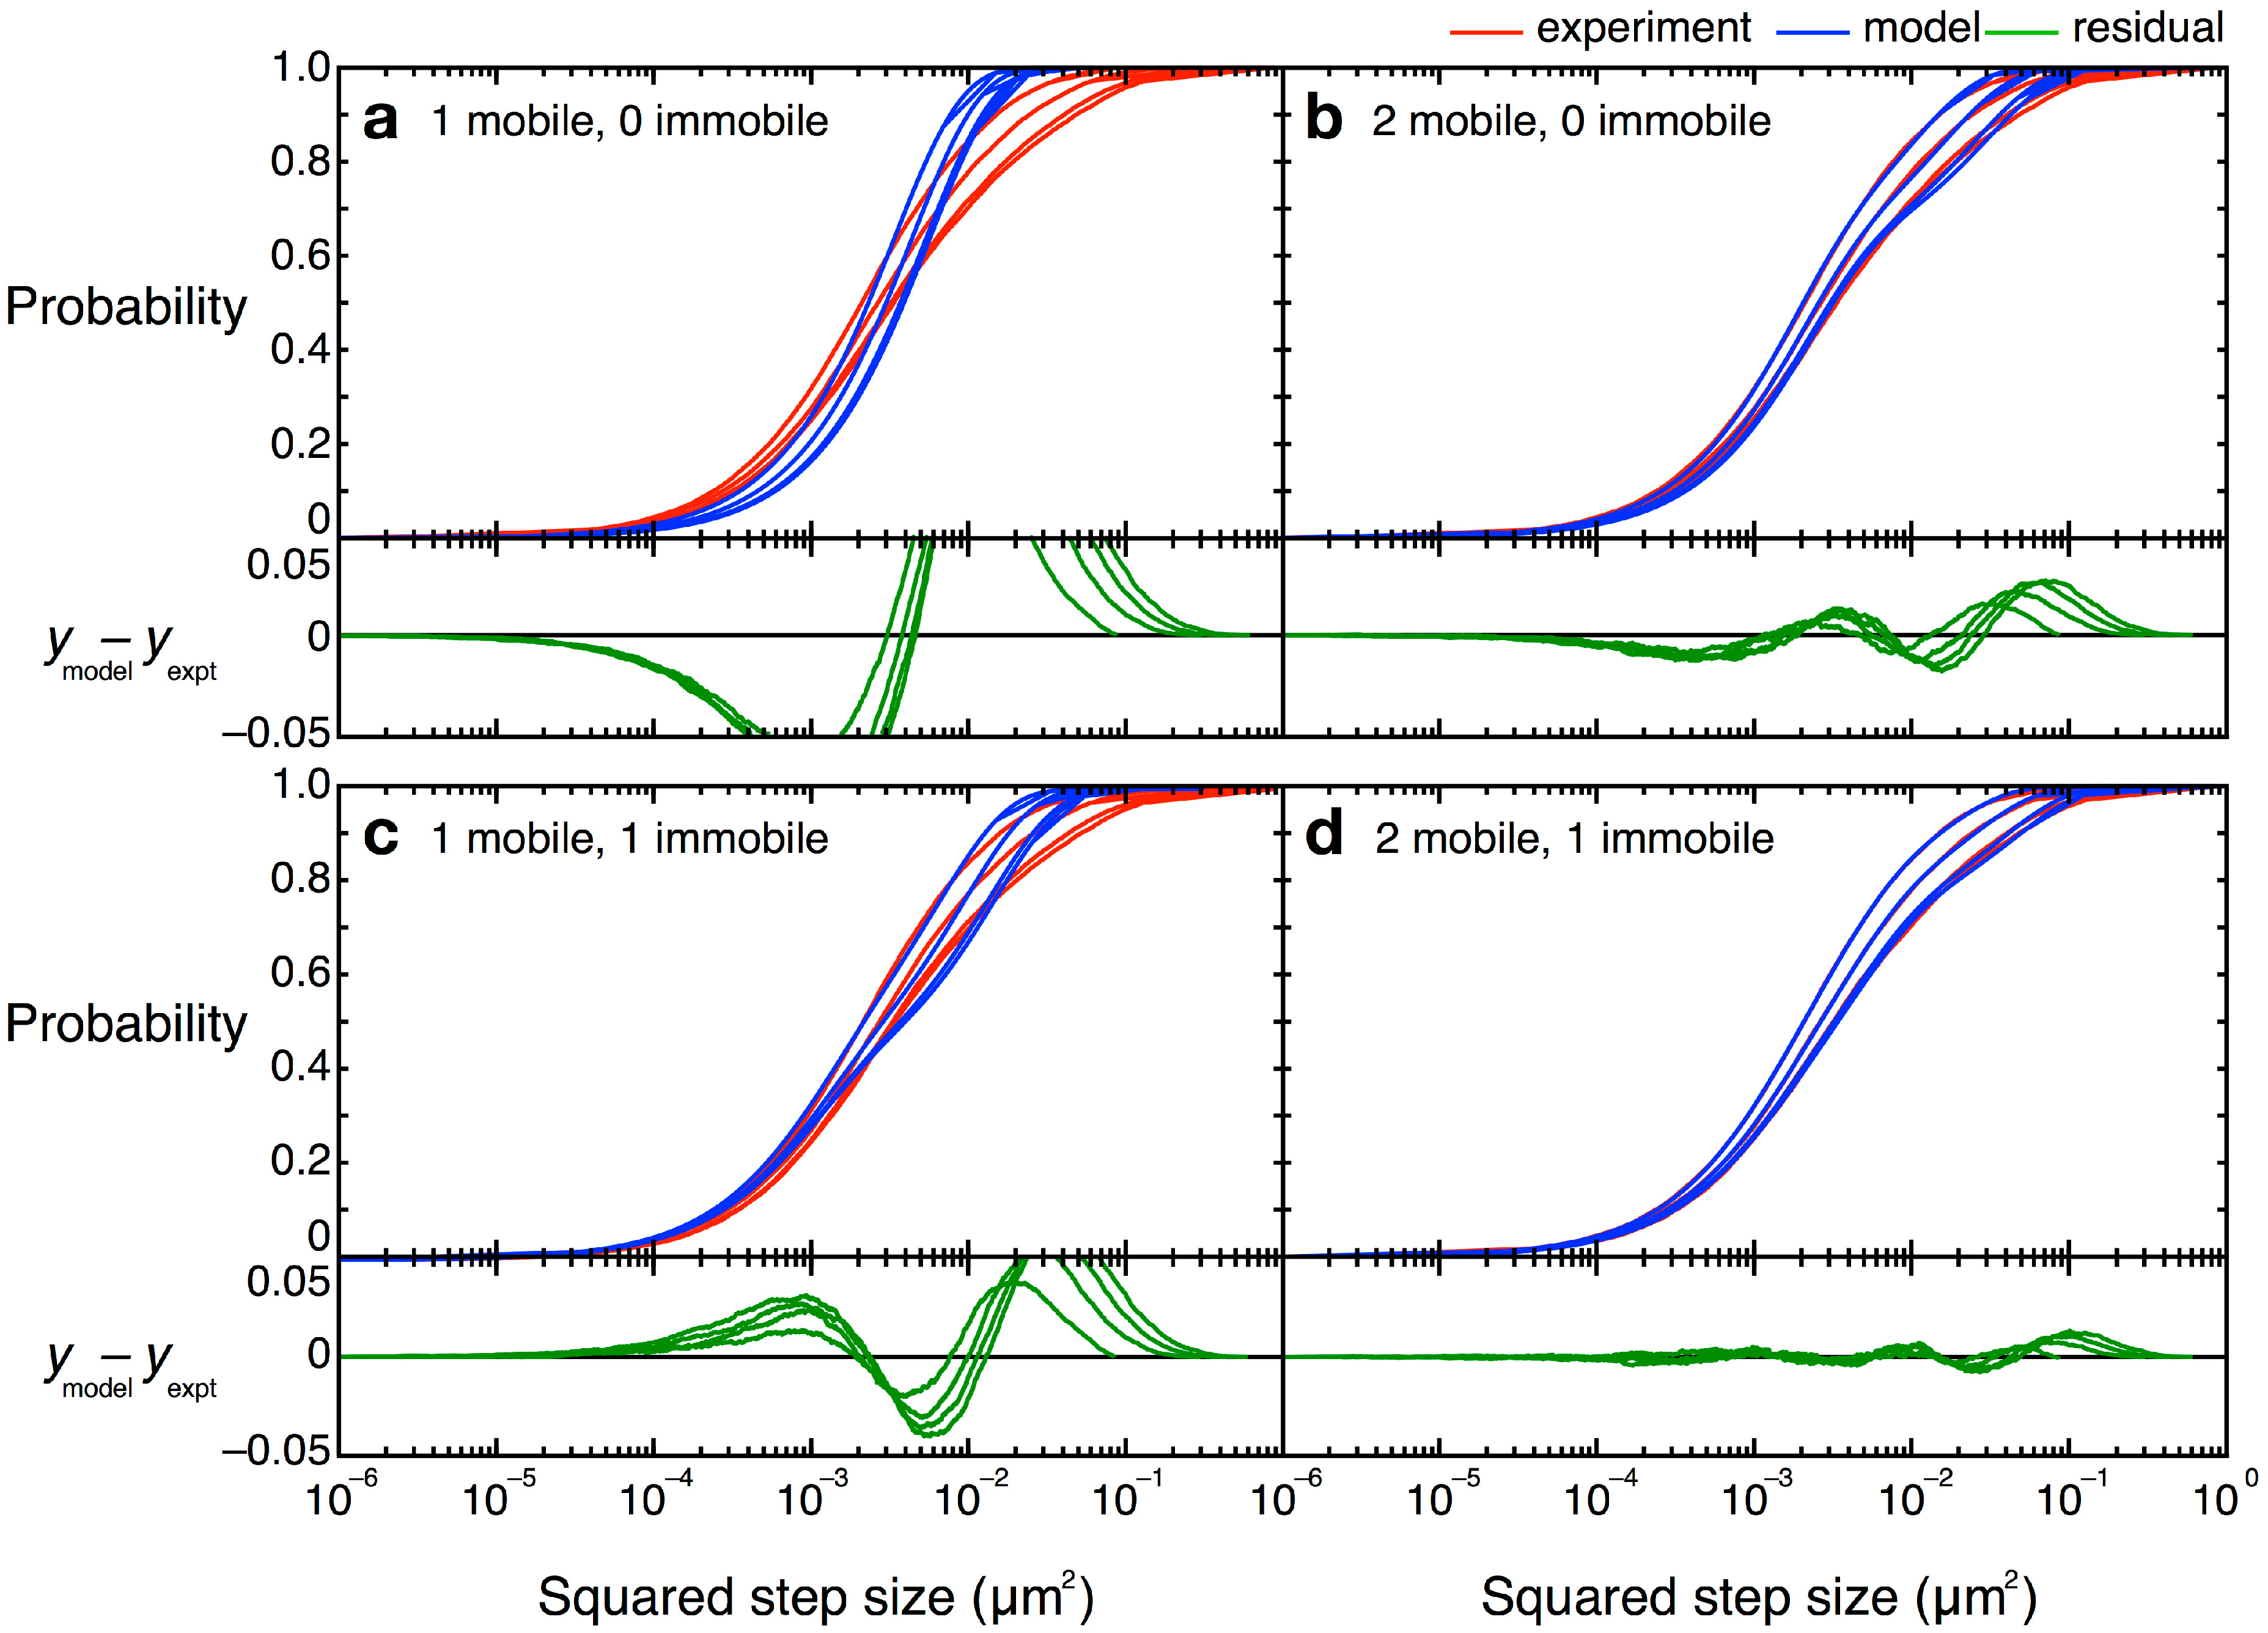
,  , etc.). The MSD values are then plotted as in single-molecule MSD analysis, and the diffusion coefficient for each population is calculated from the slopes of these curves, as described above (Equation (1)). For both single-molecule MSD and CPD analysis of TcpP diffusion in V. cholerae, we included only trajectories with at least 10 frames, removing very noisy datasets from consideration.
 = 0 µm2∕s) within our resolution (σ = 30 nm). Simpler models, with only one or two terms, did not describe the data well (Figure 12). Unfortunately, though the CPD analysis could reveal the system heterogeneity, this stepwise analysis does not permit individual proteins to be classified into a specific population. The best-fit model allowed us to determine that, at any given time, 22% of TcpP-PAmCherry molecules in a ΔtcpP TcpP-PAmCherry strain are in the immobile population, but the aggregation of all trajectory data prevents us from determining which specific molecules are immobilized, or to which trajectories they belong. On the other hand, single-molecule MSD analysis could not give us such clear information about the population heterogeneity.
4.5. Curvature Challenges
5. Conclusions
Acknowledgments
Author Contributions
Conflicts of Interest
References
- Xie, X.S.; Choi, P.J.; Li, G.W.; Lee, N.K.; Lia, G. Single-molecule approach to molecular biology in living bacterial cells. Annu. Rev. Biophys. 2008, 37, 417–444. [Google Scholar] [CrossRef]
- Huang, B.; Bates, M.; Zhuang, X.W. Super-resolution fluorescence microscopy. Annu. Rev. Biochem. 2009, 78, 993–1016. [Google Scholar] [CrossRef]
- Biteen, J.S.; Moerner, W.E. Single-molecule and superresolution imaging in live bacteria cells. Cold Spring Harb. Perspect. Biol. 2010, 2. [Google Scholar] [CrossRef]
- Van den Wildenberg, S.M.J.L.; Bollen, Y.J.M.; Peterman, E.J.G. How to quantify protein diffusion in the bacterial membrane. Biopolymers 2011, 95, 312–321. [Google Scholar] [CrossRef]
- Abbe, E. Beiträge zur theorie des mikroskops und der mikroskopischen wahrnehmung. Archiv. Mikrosk. Anat. 1873, 9, 413–468. [Google Scholar]
- Chiu, W.; Baker, M.L.; Jiang, W.; Dougherty, M.; Schmid, M.F. Electron cryomicroscopy of biological machines at subnanometer resolution. Structure 2005, 13, 363–372. [Google Scholar] [CrossRef]
- Förster, T. Zwischenmolekulare energiewanderung und fluoreszenz. Ann. Phys. 1948, 437, 55–75. [Google Scholar] [CrossRef]
- Ormö, M.; Cubitt, A.B.; Kallio, K.; Gross, L.A.; Tsien, R.Y.; Remington, S.J. Crystal structure of the Aequorea victoria green fluorescent protein. Science 1996, 273, 1392–1395. [Google Scholar]
- Michalet, X.; Pinaud, F.F.; Bentolila, L.A.; Tsay, J.M.; Doose, S.; Li, J.J.; Sundaresan, G.; Wu, A.M.; Gambhir, S.S.; Weiss, S. Quantum dots for live cells, in vivo imaging, and diagnostics. Science 2005, 307, 538–544. [Google Scholar] [CrossRef]
- Chen, Y.; Cai, J.; Xu, Q.; Chen, Z.W. Atomic force bio-analytics of polymerization and aggregation of phycoerythrin-conjugated immunoglobulin G molecules. Mol. Immunol. 2004, 41, 1247–1252. [Google Scholar] [CrossRef]
- Thompson, R.E.; Larson, D.R.; Webb, W.W. Precise nanometer localization analysis for individual fluorescent probes. Biophys. J. 2002, 82, 2775–2783. [Google Scholar]
- Betzig, E.; Patterson, G.H.; Sougrat, R.; Lindwasser, O.W.; Olenych, S.; Bonifacino, J.S.; Davidson, M.W.; Lippincott-Schwartz, J.; Hess, H.F. Imaging intracellular fluorescent proteins at nanometer resolution. Science 2006, 313, 1642–1645. [Google Scholar]
- Hess, S.T.; Girirajan, T.P.K.; Mason, M.D. Ultra-high resolution imaging by fluorescence photoactivation localization microscopy. Biophys. J. 2006, 91, 4258–4272. [Google Scholar] [CrossRef]
- Rust, M.J.; Bates, M.; Zhuang, X. Sub-diffraction-limit imaging by stochastic optical reconstruction microscopy (STORM). Nat. Methods 2006, 3, 793–795. [Google Scholar] [CrossRef]
- Zhu, L.; Zhang, W.; Elnatan, D.; Huang, B. Faster STORM using compressed sensing. Nat Methods 2012, 9, 721–723. [Google Scholar] [CrossRef]
- Yildiz, A.; Forkey, J.N.; McKinner, S.A.; Ha, T.; Goldman, Y.E.; Selvin, P.R. Myosin V walks hand-over-hand: Single fluorophore imaging with 1.5-nm localization. Science 2003, 300, 2061–2065. [Google Scholar] [CrossRef]
- Hell, S.W.; Wichmann, J. Breaking the diffraction resolution limit by stimulated emission: Stimulated-emission-depletion fluorescence microscopy. Opt. Lett. 1994, 19, 780–782. [Google Scholar] [CrossRef]
- Gustafsson, M.G.L. Nonlinear structured-illumination microscopy: Wide-field fluorescence imaging with theoretically unlimited resolution. Proc. Natl. Acad. Sci. USA 2005, 102, 13081–13086. [Google Scholar] [CrossRef]
- Hell, S.W. Far-field optical nanoscopy. Science 2007, 316, 1153–1158. [Google Scholar] [CrossRef]
- Gordon, M.P.; Ha, T.; Selvin, P.R. Single-molecule high-resolution imaging with photobleaching. Proc. Natl. Acad. Sci. USA 2004, 101, 6462–6465. [Google Scholar] [CrossRef]
- Qu, X.; Wu, D.; Mets, L.; Scherer, N.F. Nanometer-localized multiple single-molecule fluorescence microscopy. Proc. Natl. Acad. Sci. USA 2004, 101, 11298–11303. [Google Scholar] [CrossRef]
- Churchman, L.S.; Oekten, Z.; Rock, R.S.; Dawson, J.F.; Spudich, J.A. Single molecule high-resolution colocalization of Cy3 and Cy5 attached to macromolecules measures intramolecular distances through time. Proc. Natl. Acad. Sci. USA 2005, 102, 1419–1423. [Google Scholar]
- Lidke, K.; Rieger, B.; Jovin, T.; Heintzmann, R. Superresolution by localization of quantum dots using blinking statistics. Opt. Express 2005, 13, 7052–7062. [Google Scholar] [CrossRef]
- Sharonov, A.; Hochstrasser, R.M. Wide-field subdiffraction imaging by accumulated binding of diffusing probes. Proc. Natl. Acad. Sci. USA 2006, 103, 18911–18916. [Google Scholar] [CrossRef]
- Egner, A.; Geisler, C.; von Middendorff, C.; Bock, H.; Wenzel, D.; Medda, R.; Andresen, M.; Stiel, A.C.; Jakobs, S.; Eggeling, C.; et al. Fluorescence nanoscopy in whole cells by asynchronous localization of photoswitching emitters. Biophys. J. 2007, 93, 3285–3290. [Google Scholar] [CrossRef]
- Heilemann, M.; van de Linde, S.; Schüttpelz, M.; Kasper, R.; Seefeldt, B.; Mukherjee, A.; Tinnefeld, P.; Sauer, M. Subdiffraction-resolution fluorescence imaging with conventional fluorescent probes. Angew. Chem. Int. Ed. 2008, 47, 6172–6176. [Google Scholar] [CrossRef]
- Giannone, G.; Hosy, E.; Levet, F.; Constals, A.; Schulze, K.; Sobolevsky, A.I.; Rosconi, M.P.; Gouaux, E.; Tampé, R.; Choquet, D.; et al. Dynamic superresolution imaging of endogenous proteins on living cells at ultra-high density. Biophys. J. 2010, 99, 1303–1310. [Google Scholar] [CrossRef]
- Pinaud, F.; Dahan, M. Targeting and imaging single biomolecules in living cells by complementation-activated light microscopy with split-fluorescent proteins. Proc. Natl. Acad. Sci. USA 2011, 108, E201–E210. [Google Scholar] [CrossRef]
- Schoen, I.; Ries, J.; Klotzsch, E.; Ewers, H.; Vogel, V. Binding-activated localization microscopy of DNA structures. Nano Lett. 2011, 11, 4008–4011. [Google Scholar] [CrossRef]
- Lew, M.D.; Lee, S.F.; Ptacin, J.L.; Lee, M.K.; Tweig, R.J.; Shapiro, L.; Moerner, W.E. Three-dimensional superresolution colocalization of intracellular protein superstructures and the cell surface in live Caulobacter crescentus. Proc. Natl. Acad. Sci. USA 2011, 108, E1102–E1110. [Google Scholar]
- Burnette, D.T.; Sengupta, P.; Dai, Y.; Lippincott-Schwartz, J.; Kachar, B. Bleaching/blinking assisted localization microscopy for superresolution imaging using standard fluorescent molecules. Proc. Natl. Acad. Sci. USA 2011, 108, 21081–21086. [Google Scholar] [CrossRef]
- Moerner, W.E. Microscopy beyond the diffraction limit using actively controlled single molecules. J. Microsc. 2012, 246, 213–220. [Google Scholar] [CrossRef]
- Appelhans, T.; Richter, C.P.; Wilkens, V.; Hess, S.T.; Piehler, J.; Busch, K.B. Nanoscale organization of mitochondrial microcompartments revealed by combining tracking and localization microscopy. Nano Lett. 2012, 12, 610–616. [Google Scholar] [CrossRef]
- Magde, D.; Elson, E.; Webb, W.W. Thermodynamic fluctuations in a reacting System—Measurement by fluorescence correlation spectroscopy. Phys. Rev. Lett. 1972, 28, 705–708. [Google Scholar] [CrossRef]
- Peters, R.; Peters, J.; Tews, K.H.; Bähr, W. A microfluorimetric study of translational diffusion in erythrocyte membranes. Biochim. Biophys. Acta 1974, 367, 282–294. [Google Scholar] [CrossRef]
- Koch, A.L. What size should a bacterium be? A question of scale. Annu. Rev. Microbiol. 1996, 50, 317–348. [Google Scholar] [CrossRef]
- Kay, B.A.; Bopp, C.A.; Wells, J.G. Isolation and identification of Vibrio cholerae O1 from fecal specimens. In Vibrio Cholerae and Cholera: Molecular to Global Perspectives; Wachsmuth, I.K., Blake, P.A., Olsvik, Ø., Eds.; American Society for Microbiology Press: Washington, DC, USA, 1994; pp. 3–26. [Google Scholar]
- Kumar, M.; Mommer, M.S.; Sourjik, V. Mobility of cytoplasmic, membrane, and DNA-binding proteins in Escherichia coli. Biophys. J. 2010, 98, 552–559. [Google Scholar] [CrossRef]
- Deich, J.; Judd, E.M.; McAdams, H.H.; Moerner, W.E. Visualization of the movement of single histidine kinase molecules in live Caulobacter cells. Proc. Natl. Acad. Sci. USA 2004, 101, 15921–15926. [Google Scholar] [CrossRef]
- Logan, N.A. Bacterial Systematics; Blackwell Scientific Publications: London, UK, 1994. [Google Scholar]
- Rosselló-Mora, R.; Amann, R. The species concept for prokaryotes. FEMS Microbiol. Rev. 2001, 25, 39–67. [Google Scholar] [CrossRef]
- Baker, H.; Bloom, W.L. Further studies on the gram stain. J. Bacteriol. 1948, 56, 387–390. [Google Scholar]
- Kuo, S.C.; McGrath, J.L. Steps and fluctuations of listeria monocytogenes during actin-based motility. Nature 2000, 407, 1026–1029. [Google Scholar] [CrossRef]
- Wang, W.; Li, G.; Chen, C.; Xie, X.S.; Zhuang, X. Chromosome organization by a nucleoid-associated protein in live bacteria. Science 2011, 333, 1445–1449. [Google Scholar] [CrossRef]
- Bakshi, S.; Siryaporn, A.; Goulian, M.; Weisshaar, J.C. Superresolution imaging of ribosomes and RNA polymerase in live Escherichia coli cells. Mol. Microbiol. 2012, 85, 21–38. [Google Scholar] [CrossRef]
- Haas, B.L.; Matson, J.S.; DiRita, V.J.; Biteen, J.S. Single-molecule tracking in live Vibrio cholerae reveals that ToxR recruits the membrane-bound transcription activator TcpP to the toxT promoter. 2014. submitted. [Google Scholar]
- Matson, J.S.; Withey, J.H.; DiRita, V.J. Regulatory networks controlling Vibrio cholerae virulence gene expression. Infect. Immun. 2007, 75, 5542–5549. [Google Scholar] [CrossRef]
- Miller, V.L.; Taylor, R.K.; Mekalanos, J.J. Cholera toxin transcriptional activator ToxR is a transmembrane DNA binding protein. Cell 1987, 48, 271–279. [Google Scholar] [CrossRef]
- Häse, C.C.; Mekalanos, J.J. TcpP protein is a positive regulator of virulence gene expression in Vibrio cholerae. Proc. Natl. Acad. Sci. USA 1998, 95, 730–734. [Google Scholar] [CrossRef]
- Merrell, D.S.; Camilli, A. Regulation of Vibrio cholerae genes required for acid tolerance by a member of the “ToxR-like” family of transcriptional regulators. J. Bacteriol. 2000, 182, 5342–5350. [Google Scholar] [CrossRef]
- Dalia, A.B.; Lazinski, D.W.; Camilli, A. Identification of a membrane-bound transcriptional regulator that links chitin and natural competence in Vibrio cholerae. mBio 2014, 5. [Google Scholar] [CrossRef]
- Kolibachuk, D.; Greenberg, E.P. The Vibrio fischeri luminescence gene activator LuxR is a membrane-associated protein. J. Bacteriol. 1993, 175, 7307–7312. [Google Scholar]
- Reich, K.A.; Schoolnik, G.K. The light organ symbiont Vibrio fischeri possesses a homolog of the Vibrio cholerae transmembrane transcriptional activator ToxR. J. Bacteriol. 1994, 176, 3085–3088. [Google Scholar]
- Lin, Z.; Kumagai, K.; Baba, K.; Mekalanos, J.J.; Nishibuchi, M. Vibrio parahaemolyticus has a homolog of the Vibrio cholerae toxRS operon that mediates environmentally induced regulation of the thermostable direct hemolysin gene. J. Bacteriol. 1993, 175, 3844–3855. [Google Scholar]
- Neely, M.N.; Dell, C.L.; Olson, E.R. Roles of LysP and CadC in mediating the lysine requirement for acid induction of the Escherichia coli cad operon. J. Bacteriol. 1994, 176, 3278–3285. [Google Scholar]
- D’Elia, J.N.; Salyers, A.A. Effect of regulatory protein levels on utilization of starch by Bacteroides thetaiotaomicron. J. Bacteriol. 1996, 178, 7180–7186. [Google Scholar]
- Yang, Y.; Isberg, R.R. Transcriptional regulation of the Yersinia pseudotuberculosis pH 6 antigen adhesin by two envelope-associated components. Mol. Microbiol. 1997, 24, 499–510. [Google Scholar] [CrossRef]
- Welch, T.J.; Bartlett, D.H. Identification of a regulatory protein required for pressure-responsive gene expression in the deep-sea bacterium Photobacterium species strain SS9. Mol. Microbiol. 1998, 27, 977–985. [Google Scholar] [CrossRef]
- Blanc-Potard, A.; Solomon, F.; Kayser, J.; Groisman, E.A. The SPI-3 pathogenicity island of Salmonella enterica. J. Bacteriol. 1999, 181, 998–1004. [Google Scholar]
- Lassak, K.; Peeters, E.; Wróbel, S.; Albers, S. The one-component system ArnR: A membrane-bound activator of the crenarchaeal archaellum. Mol. Microbiol. 2013, 88, 125–139. [Google Scholar] [CrossRef]
- Bates, M.; Huang, B.; Dempsey, G.T.; Zhuang, X. Multicolor super-resolution imaging with photo-switchable fluorescent probes. Science 2007, 317, 1749–1753. [Google Scholar] [CrossRef]
- Biteen, J.S.; Thompson, M.A.; Tselentis, N.K.; Bowman, G.R.; Shapiro, L.; Moerner, W.E. Super-resolution imaging in live Caulobacter crescentus cells using photoswitchable EYFP. Nat. Methods 2008, 5, 947–949. [Google Scholar] [CrossRef]
- Rowland, D.J.; Biteen, J.S. Top-hat and asymmetric gaussian-based fitting functions for quantifying directional single-molecule motion. ChemPhysChem 2014, 15, 712–720. [Google Scholar] [CrossRef]
- Ritchie, K.; Lill, Y.; Sood, C.; Lee, H.; Zhang, S. Single-molecule imaging in live bacteria cells. Philos. Trans. R. Soc. B 2013, 368. [Google Scholar] [CrossRef]
- Einstein, A. Über die von der molekularkinetischen theorie der wärme geforderte bewegung von in ruhenden flüssigkeiten suspendierten teilchen. Ann. Phys. 1905, 322, 549–560. [Google Scholar] [CrossRef]
- Beck, N.A.; Krukonis, E.S.; DiRita, V.J. TcpH influences virulence gene expression in Vibrio cholerae by inhibiting degradation of the transcription activator TcpP. J. Bacteriol. 2004, 186, 8309–8316. [Google Scholar] [CrossRef]
- Yu, J.; Xiao, J.; Ren, X.; Lao, K.; Xie, X.S. Probing gene expression in live cells, one protein molecule at a time. Science 2006, 311, 1600–1603. [Google Scholar] [CrossRef]
- Elf, J.; Li, G.W.; Xie, X.S. Probing transcription factor dynamics at the single-molecule level in a living cell. Science 2007, 316, 1191–1194. [Google Scholar] [CrossRef]
- Chen, I.; Ting, A. Site-specific labeling of proteins with small molecules in live cells. Curr. Opin. Biotechnol. 2005, 16, 35–40. [Google Scholar] [CrossRef]
- Fernandez-Suarez, M.; Ting, A.Y. Fluorescent probes for super-resolution imaging in living cells. Nat. Rev. Mol. Cell Biol. 2008, 9, 929–943. [Google Scholar] [CrossRef]
- Chudakov, D.M.; Matz, M.V.; Lukyanov, S.; Lukyanov, K.A. Fluorescent proteins and their applications in imaging living cells and tissues. Physiol. Rev. 2010, 90, 1103–1163. [Google Scholar] [CrossRef]
- Hu, C.; Kerppola, T.K. Simultaneous visualization of multiple protein interactions in living cells using multicolor fluorescence complementation analysis. Nat. Biotechnol. 2003, 21, 539–545. [Google Scholar] [CrossRef]
- Shaner, N.C.; Campbell, R.E.; Steinbach, P.A.; Giepmans, B.N.G.; Palmer, A.E.; Tsien, R.Y. Improved monomeric red, orange and yellow fluorescent proteins derived from Discosoma sp. red fluorescent protein. Nat. Biotechnol. 2004, 22, 1567–1572. [Google Scholar] [CrossRef]
- Wang, S.; Moffitt, J.R.; Dempsey, G.T.; Xie, X.S.; Zhuang, X. Characterization and development of photoactivatable fluorescent proteins for single-molecule-based superresolution imaging. Proc. Natl. Acad. Sci. USA 2014. [Google Scholar] [CrossRef]
- Matz, M.V.; Fradkov, A.F.; Labas, Y.A.; Savitsky, A.P.; Zaraisky, A.G.; Markelov, M.L.; Lukyanov, S.A. Fluorescent proteins from nonbioluminescent anthozoa species. Nat. Biotechnol. 1999, 17, 969–973. [Google Scholar] [CrossRef]
- Verkhusha, V.V.; Lukyanov, K.A. The molecular properties and applications of anthozoa fluorescent proteins and chromoproteins. Nat. Biotechnol. 2004, 22, 289–296. [Google Scholar] [CrossRef]
- Akrap, N.; Seidel, T.; Barisas, B.G. Förster distances for fluorescent resonant energy transfer between mCherry and other visible fluorescent proteins. Anal. Biochem. 2010, 402, 105–106. [Google Scholar] [CrossRef]
- Subach, F.V.; Patterson, G.H.; Manley, S.; Gillette, J.M.; Lippincott-Schwartz, J.; Verkhusha, V.V. Photoactivatable mCherry for high-resolution two-color fluorescence microscopy. Nat. Methods 2009, 6, 153–159. [Google Scholar] [CrossRef]
- Gurskaya, N.G.; Verkhusha, V.V.; Shcheglov, A.S.; Staroverov, D.B.; Chepurnykh, T.V.; Fradkov, A.F.; Lukyanov, S.A.; Lukyanov, K.A. Engineering of a monomeric green-to-red photoactivatable fluorescent protein induced by blue light. Nat. Biotechnol. 2006, 24, 461–465. [Google Scholar] [CrossRef]
- Habuchi, S.; Ando, R.; Dedecker, P.; Verheijen, W.; Mizuno, H.; Miyawaki, A.; Hofkens, J. Reversible single-molecule photoswitching in the GFP-like fluorescent protein dronpa. Proc. Natl. Acad. Sci. USA 2005, 102, 9511–9516. [Google Scholar] [CrossRef]
- Kubitscheck, U.; Kueckmann, O.; Kues, T.; Peters, R. Imaging and tracking of single GFP molecules in solution. Biophys. J. 2000, 78, 2170–2179. [Google Scholar] [CrossRef]
- Baird, G.S.; Zacharias, D.A.; Tsien, R.Y. Biochemistry, mutagenesis, and oligomerization of DsRed, a red fluorescent protein from coral. Proc. Natl. Acad. Sci. USA 2000, 97, 11984–11989. [Google Scholar] [CrossRef]
- Willets, K.A.; Nishimura, S.Y.; Schuck, P.J.; Twieg, R.J.; Moerner, W.E. Nonlinear optical chromophores as nanoscale emitters for single-molecule spectroscopy. Acc. Chem. Res. 2005, 38, 549–556. [Google Scholar] [CrossRef]
- Chudakov, D.M.; Feofanov, A.V.; Mudrik, N.N.; Lukyanov, S.; Lukyanov, K.A. Chromophore environment provides clue to kindling fluorescent protein riddle. J. Biol. Chem. 2003, 278, 7215–7219. [Google Scholar]
- Shaner, N.C.; Lin, M.Z.; McKeown, M.R.; Steinbach, P.A.; Hazelwood, K.L.; Davidson, M.W.; Tsien, R.Y. Improving the photostability of bright monomeric orange and red fluorescent proteins. Nat. Methods 2008, 5, 545–551. [Google Scholar] [CrossRef]
- Durisic, N.; Laparra-Cuervo, L.; Sandoval-Álvarez, Á; Borbely, J.S.; Lakadamyali, M. Single-molecule evaluation of fluorescent protein photoactivation efficiency using an in vivo nanotemplate. Nat. Methods 2004, 11, 156–162. [Google Scholar]
- Shannon, C.E. Communication in the presence of noise. Proc. IRE 1949, 37, 10–21. [Google Scholar] [CrossRef]
- Shroff, H.; Galbraith, C.G.; Galbraith, J.A.; Betzig, E. Live-cell photoactivated localization microscopy of nanoscale adhesion dynamics. Nat. Methods 2008, 5, 417–423. [Google Scholar] [CrossRef]
- Nagai, T.; Ibata, K.; Park, E.S.; Kubota, M.; Mikoshiba, K.; Miyawaki, A. A variant of yellow fluorescent protein with fast and efficient maturation for cell-biological applications. Nat. Biotechnol. 2002, 20, 87–90. [Google Scholar] [CrossRef]
- Sochacki, K.A.; Shkel, I.A.; Record, M.T.; Weisshaar, J.C. Protein diffusion in the periplasm of E. coli under osmotic stress. Biophys. J. 2011, 100, 22–31. [Google Scholar] [CrossRef]
- Griffin, B.A.; Adams, S.R.; Tsien, R.Y. Specific covalent labeling of recombinant protein molecules inside live cells. Science 1998, 281, 269–272. [Google Scholar] [CrossRef]
- Los, G.V.; Encell, L.P.; McDougall, M.G.; Hartzell, D.D.; Karassina, N.; Zimprich, C.; Wood, M.G.; Learish, R.; Ohana, R.F.; Urh, M.; et al. HaloTag: A novel protein labeling technology for cell imaging and protein analysis. ACS Chem. Biol. 2008, 3, 373–382. [Google Scholar] [CrossRef]
- Keppler, A.; Gendreizig, S.; Gronemeyer, T.; Pick, H.; Vogel, H.; Johnsson, K. A general method for the covalent labeling of fusion proteins with small molecules in vivo. Nat. Biotechnol. 2003, 21, 86–89. [Google Scholar]
- Vogelsang, J.; Steinhauer, C.; Forthmann, C.; Stein, I.H.; Person-Skegro, B.; Cordes, T.; Tinnefeld, P. Make them blink: Probes for super-resolution microscopy. ChemPhysChem 2010, 11, 2475–2490. [Google Scholar] [CrossRef]
- Endesfelder, U.; Malkusch, S.; Flottmann, B.; Mondry, J.; Liguzinski, P.; Verveer, P.J.; Heilemann, M. Chemically induced photoswitching of fluorescent probes—A general concept for super-resolution microscopy. Molecules 2011, 16, 3106–3118. [Google Scholar] [CrossRef]
- Henriques, R.; Griffiths, C.; Hesper Rego, E.; Mhlanga, M.M. PALM and STORM: Unlocking live-cell super-resolution. Biopolymers 2011, 95, 322–331. [Google Scholar] [CrossRef]
- Karunatilaka, K.S.; Cameron, E.A.; Martens, E.C.; Koropatkin, N.M.; Biteen, J.S. Super-resolution imaging captures carbohydrate utilization dynamics in human gut symbionts. 2014. submitted. [Google Scholar]
- Nicolle, O.; Rouillon, A.; Guyodo, H.; Tamanai-Shacoori, Z.; Chandad, F.; Meuric, V.; Bonnaure-Mallet, M. Development of SNAP-tag-mediated live cell labeling as an alternative to GFP in Porphyromonas gingivalis. FEMS Immunol. Med. Microbiol. 2010, 59, 357–363. [Google Scholar]
- Seyfert, K.; Oosaka, T.; Yagnuma, H.; Ernst, S.; Noji, H.; Iino, R.; Börsch, M. Subunit Rotation in a Single F0F1-ATP Synthase in a Living Bacterium Monitored by FRET. Available online: http://arxiv.org/ftp/arxiv/papers/1102/1102.2184.pdf (accessed on 11 August 2014).
- Charbon, G.; Wang, J.; Brustad, E.; Schultz, P.G.; Horwich, A.L.; Jacobs-Wagner, C.; Chapman, E. Localization of GroEL determined by in vivo incorporation of a fluorescent amino acid. Bioorg. Med. Chem. Lett. 2011, 21, 6067–6070. [Google Scholar] [CrossRef]
- Brun, M.P.; Bischoff, L.; Garbay, C. A very short route to enantiomerically pure coumarin-bearing fluorescent amino acids. Angew. Chem. Int. Ed. 2004, 43, 3432–3436. [Google Scholar] [CrossRef]
- Katritzky, A.R.; Narindoshvili, T. Fluorescent amino acids: Advances in protein-extrinsic fluorophores. Org. Biomol. Chem. 2009, 7, 627–634. [Google Scholar] [CrossRef]
- Chin, J.W.; Martin, A.B.; King, D.S.; Wang, L.; Schultz, P.G. Addition of a photocrosslinking amino acid to the genetic code of Escherichia coli. Proc. Natl. Acad. Sci. USA 2002, 99, 11020–11024. [Google Scholar]
- Deiters, A.; Cropp, T.A.; Mukherji, M.; Chin, J.W.; Anderson, J.C.; Schultz, P.G. Adding amino acids with novel reactivity to the genetic code of Saccharomyces cerevisiae. J. Am. Chem. Soc. 2003, 125, 11782–11783. [Google Scholar] [CrossRef]
- Zhang, Z.; Smith, B.A.C.; Wang, L.; Brock, A.; Cho, C.; Schultz, P.G. A new strategy for the site-specific modification of proteins in vivo. Biochemistry 2003, 42, 6735–6746. [Google Scholar] [CrossRef]
- Grammel, M.; Hang, H.C. Chemical reporters for biological discovery. Nat. Chem. Biol. 2013, 9, 475–484. [Google Scholar]
- Raulf, A.; Spahn, C.K.; Zessin, P.J.M.; Finan, K.; Bernhardt, S.; Heckel, A.; Heilemann, M. Click chemistry facilitates direct labelling and super-resolution imaging of nucleic acids and proteins. RSC Adv. 2014, 4, 30462–30466. [Google Scholar]
- Heilemann, M.; Margeat, E.; Kasper, R.; Sauer, M.; Tinnefeld, P. Carbocyanine dyes as efficient reversible single-molecule optical switch. J. Am. Chem. Soc. 2005, 127, 3801–3806. [Google Scholar] [CrossRef]
- Zhang, R.; Rothenberg, E.; Fruhwirth, G.; Simonson, P.D.; Ye, F.; Golding, I.; Ng, T.; Lopes, W.; Selvin, P.R. Two-photon 3D FIONA of individual quantum dots in an aqueous environment. Nano Lett. 2011, 11, 4074–4078. [Google Scholar] [CrossRef]
- Mutavdžić, D.; Xu, J.; Thakur, G.; Triulzi, R.; Kasas, S.; Jeremić, M.; Leblanc, R.; Radotić, K. Determination of the size of quantum dots by fluorescence spectroscopy. Analyst 2011, 136, 2391–2396. [Google Scholar] [CrossRef]
- Chalmers, N.I.; Palmer, J.; Robert, J.; Du-Thumm, L.; Sullivan, R.; Shi, W.; Kolenbrander, P.E. Use of quantum dot luminescent probes to achieve single-cell resolution of human oral bacteria in biofilms. Appl. Environ. Microbiol. 2007, 73, 630–636. [Google Scholar] [CrossRef]
- Mahler, B.; Spinicelli, P.; Buil, S.; Quelin, X.; Hermier, J.; Dubertret, B. Towards non-blinking colloidal quantum dots. Nat. Mater. 2008, 7, 659–664. [Google Scholar]
- Huang, F.; Schwartz, S.L.; Byars, J.M.; Lidke, K.A. Simultaneous multiple-emitter fitting for single molecule super-resolution imaging. Biomed. Opt. Express 2011, 2, 1377–1393. [Google Scholar] [CrossRef]
- Taniguchi, Y.; Choi, P.J.; Li, G.; Chen, H.; Babu, M.; Hearn, J.; Emili, A.; Xie, X.S. Quantifying E. coli proteome and transcriptome with single-molecule sensitivity in single cells. Science 329, 533–538.
- Kim, S.Y.; Gitai, Z.; Kinkhabwala, A.; Shapiro, L.; Moerner, W.E. Single molecules of the bacterial actin MreB undergo directed treadmilling motion in Caulobacter crescentus. Proc. Natl. Acad. Sci. USA 2006, 103, 10929–10934. [Google Scholar] [CrossRef]
- Karunatilaka, K.S.; Coupland, B.R.; Cameron, E.A.; Martens, E.C.; Koropatkin, N.M.; Biteen, J.S. Single-molecule imaging can be achieved in live obligate anaerobic bacteria. Proc. SPIE 2013, 8590. [Google Scholar] [CrossRef]
- Narayanan, J.; Xiong, J.; Liu, X. Determination of agarose gel pore size: Absorbance measurements vis a vis other techniques. J. Phys.: Conf. Ser. 2006, 28, 83–86. [Google Scholar] [CrossRef]
- Xiao, J.; Elf, J.; Li, G.-W.; Yu, J.; Xie, X.S. Imaging gene expression in living cells at the single-molecule level. In Single-Molecule Techniques: A Laboratory Manual; Selvin, P.R., Ha, T., Eds.; Cold Spring Harbor Laboratory Press: Cold Spring Harbor, NY, 2008; pp. 149–169. [Google Scholar]
- Moolman, M.C.; Huang, Z.; Krishnan, S.T.; Kerssemakers, J.W.J.; Dekker, N.H. Electron Beam Fabrication of a Microfluidic Device for Studying Submicron-Scale Bacteria. Available online: http://www.biomedcentral.com/content/pdf/1477-3155-11-12.pdf (accessed on 11 August 2014).
- Anonymous. Artifacts of light. Nat. Methods 2013, 10. [Google Scholar] [CrossRef]
- Endesfelder, U.; Heilemann, M. Art and artifacts in single-molecule localization microscopy: Beyond attractive images. Nat. Methods 2014, 11, 235–238. [Google Scholar] [CrossRef]
- Wagner, M.; Weber, P.; Bruns, T.; Strauss, W.S.; Wittig, R.; Schneckenburger, H. Light dose is a limiting factor to maintain cell viability in fluorescence microscopy and single molecule detection. Int. J. Mol. Sci. 2010, 11, 956–966. [Google Scholar] [CrossRef]
- Jones, S.A.; Shim, S.; He, J.; Zhuang, X. Fast, three-dimensional super-resolution imaging of live cells. Nat. Methods 2011, 8, 499–505. [Google Scholar] [CrossRef]
- Peters, I.M.; de Grooth, B.G.; Schins, J.M.; Figdor, C.G.; Greve, J. Three dimensional single-particle tracking with nanometer resolution. Rev. Sci. Instrum. 1998, 69, 2762–2766. [Google Scholar] [CrossRef]
- Dupont, A.; Lamb, D.C. Nanoscale three-dimensional single particle tracking. Nanoscale 2011, 3, 4532–4541. [Google Scholar] [CrossRef]
- Welsher, K.; Yang, H. Multi-resolution 3D visualization of the early stages of cellular uptake of peptide-coated nanoparticles. Nat. Nanotechnol. 2014, 9, 198–203. [Google Scholar] [CrossRef]
- Benson, R.C.; Meyer, R.A.; Zaruba, M.E.; McKhann, G.M. Cellular autofluorescence–is it due to flavins? J. Histochem. Cytochem. 1979, 27, 44–48. [Google Scholar] [CrossRef]
- Michalet, X.; Berglund, A.J. Optimal diffusion coefficient estimation in single-particle tracking. Phys. Rev. E Stat. Nonlin. Soft Matter Phys. 2012, 85, 061916. [Google Scholar]
- Saxton, M.J. Single-particle tracking: The distribution of diffusion coefficients. Biophys. J. 1997, 72, 1744–1753. [Google Scholar] [CrossRef]
- Jaqaman, K.; Loerke, D.; Mettlen, M.; Kuwata, H.; Grinstein, S.; Schmid, S.L.; Danuser, G. Robust single-particle tracking in live-cell time-lapse sequences. Nat. Methods 2008, 5, 695–702. [Google Scholar]
- Jaqaman, K.; Danuser, G. Computational image analysis of cellular dynamics: A case study based on particle tracking. Cold Spring Harb. Protoc. 2009, 4. [Google Scholar] [CrossRef]
- Shuang, B.; Byers, C.P.; Kisley, L.; Wang, L.; Zhao, J.; Morimura, H.; Link, S.; Landes, C.F. Improved analysis for determining diffusion coefficients from short, single-molecule trajectories with photoblinking. Langmuir 2013, 29, 228–234. [Google Scholar]
- Hebert, B.; Costantino, S.; Wiseman, P.W. Spatiotemporal image correlation spectroscopy (STICS) theory, verification, and application to protein velocity mapping in living CHO cells. Biophys. J. 2005, 88, 3601–3614. [Google Scholar] [CrossRef]
- Semrau, S.; Schmidt, T. Particle image correlation spectroscopy (PICS): Retrieving nanometer-scale correlations from high-density single-molecule position data. Biophys. J. 2007, 92, 613–621. [Google Scholar] [CrossRef]
- Di Rienzo, C.; Gratton, E.; Beltram, F.; Cardarelli, F. Fast spatiotemporal correlation spectroscopy to determine protein lateral diffusion laws in live cell membranes. Proc. Natl. Acad. Sci. USA 2013, 110, 12307–12312. [Google Scholar] [CrossRef]
- Anderson, C.M.; Georgiou, G.N.; Morrison, I.E.; Stevenson, G.V.; Cherry, R.J. Tracking of cell surface receptors by fluorescence digital imaging microscopy using a charge-coupled device camera. low-density lipoprotein and influenza virus receptor mobility at 4 degrees C. J. Cell Sci. 1992, 101, 415–425. [Google Scholar]
- Robson, A.; Burrage, K.; Leake, M.C. Inferring diffusion in single live cells at the single molecule level. Philos. Trans. R. Soc. B 2013, 368. [Google Scholar] [CrossRef]
- Qian, H.; Sheetz, M.P.; Elson, E.L. Single particle tracking. Analysis of diffusion and flow in two-dimensional systems. Biophys. J. 1991, 60, 910–921. [Google Scholar] [CrossRef]
- Michalet, X. Mean square displacement analysis of single-particle trajectories with localization error: Brownian motion in an isotropic medium. Phys. Rev. E Stat. Nonlin. Soft Matter Phys. 2011, 82. [Google Scholar] [CrossRef]
- Schütz, G.J.; Schindler, H.; Schmidt, T. Single-molecule microscopy on model membranes reveals anomalous diffusion. Biophys. J. 1997, 73, 1073–1080. [Google Scholar] [CrossRef]
- Qiu, Y.; Chen, X.; Li, Y.; Zheng, B.; Li, S.; Chen, W.R.; Liu, H. Impact of the optical depth of field on cytogenetic image quality. J. Biomed. Opt. 2012, 17, 096017. [Google Scholar]
- Huang, B.; Wang, W.; Bates, M.; Zhuang, X. Three-dimensional super-resolution imaging by stochastic optical reconstruction microscopy. Science 2008, 319, 810–813. [Google Scholar] [CrossRef]
- Biteen, J.S.; Goley, E.D.; Shapiro, L.; Moerner, W.E. Three-dimensional super-resolution imaging of the midplane protein FtsZ in live Caulobacter crescentus cells using astigmatism. ChemPhysChem 2012, 13, 1007–1012. [Google Scholar] [CrossRef]
- Pavani, S.R.P.; Thompson, M.A.; Biteen, J.S.; Lord, S.J.; Liu, N.; Twieg, R.J.; Piestun, R.; Moerner, W.E. Three-dimensional, single-molecule fluorescence imaging beyond the diffraction limit by using a double-helix point spread function. Proc. Natl. Acad. Sci. USA 2009, 106, 2995–2999. [Google Scholar] [CrossRef]
- Lee, H.D.; Sahl, S.J.; Lew, M.D.; Moerner, W.E. The double-helix microscope super-resolves extended biological structures by localizing single blinking molecules in three dimensions with nanoscale precision. Appl. Phys. Lett. 2012, 100, 153701. [Google Scholar] [CrossRef]
- Fischer, R.S.; Wu, Y.; Kanchanawong, P.; Shroff, H.; Waterman, C.M. Microscopy in 3D: A biologist’s toolbox. Trends Cell Biol. 2011, 21, 682–691. [Google Scholar] [CrossRef]
- Fu, G.; Huang, T.; Buss, J.; Coltharp, C.; Hensel, Z.; Xiao, J. In vivo structure of the E. coli FtsZ-ring revealed by photoactivated localization microscopy (PALM). PLoS One 2010, 5, e12680. [Google Scholar]
- Hensel, Z.; Weng, X.; Lagda, A.C.; Xiao, J. Transcription-factor-mediated DNA looping probed by high-resolution, single-molecule imaging in live E. coli cells. PLoS Biol. 2013, 11, e1001591. [Google Scholar] [CrossRef]
- Lee, S.F.; Thompson, M.A.; Schwartz, M.A.; Shapiro, L.; Moerner, W.E. Super-resolution imaging of the nucleoid-associated protein HU in Caulobacter crescentus. Biophys. J. 2011, 100, L31–L33. [Google Scholar]
- Hammar, P.; Leroy, P.; Mahmutovic, A.; Marklund, E.G.; Berg, O.G.; Elf, J. The lac repressor displays facilitated diffusion in living cells. Science 2012, 336, 1595–1598. [Google Scholar] [CrossRef]
© 2014 by the authors. Licensee MDPI, Basel, Switzerland. This article is an open access article distributed under the terms and conditions of the Creative Commons Attribution license ( http://creativecommons.org/licenses/by/3.0/).
Share and Cite
Haas, B.L.; Matson, J.S.; DiRita, V.J.; Biteen, J.S. Imaging Live Cells at the Nanometer-Scale with Single-Molecule Microscopy: Obstacles and Achievements in Experiment Optimization for Microbiology. Molecules 2014, 19, 12116-12149. https://doi.org/10.3390/molecules190812116
Haas BL, Matson JS, DiRita VJ, Biteen JS. Imaging Live Cells at the Nanometer-Scale with Single-Molecule Microscopy: Obstacles and Achievements in Experiment Optimization for Microbiology. Molecules. 2014; 19(8):12116-12149. https://doi.org/10.3390/molecules190812116
Chicago/Turabian StyleHaas, Beth L., Jyl S. Matson, Victor J. DiRita, and Julie S. Biteen. 2014. "Imaging Live Cells at the Nanometer-Scale with Single-Molecule Microscopy: Obstacles and Achievements in Experiment Optimization for Microbiology" Molecules 19, no. 8: 12116-12149. https://doi.org/10.3390/molecules190812116
APA StyleHaas, B. L., Matson, J. S., DiRita, V. J., & Biteen, J. S. (2014). Imaging Live Cells at the Nanometer-Scale with Single-Molecule Microscopy: Obstacles and Achievements in Experiment Optimization for Microbiology. Molecules, 19(8), 12116-12149. https://doi.org/10.3390/molecules190812116