3.1. Plant Material
A total of 37 whipgrass (
H. compressa L.) germplasms, including three registered varieties, were analyzed in the present study (
Table 7 and
Figure 5); these accessions were collected from southwest China. Based on geographic origin and ecological environment, the materials were divided into the following four geographic groups: Chengdu Plain (CDL), Chongqing (CQ), Guizhou (GZ), and Yunnan and Liangshan (YL) [
33]. Based on a previous study of the morphological traits of whipgrass collections from southwest China [
2], the germplasms were classified into the following three categories: (I) high-erect type (thin and long leaves, long internodes and erect plants); (II) fine-low type (thin and short leaves, fine and stoloniferous stems, short internodes and low-creeping plants); and (III) thickset-low type (wide and long leaves, short internodes, stocky-stoloniferous stems and creeping plants) (
Table 7). Using the root tip squash method [
34], we found that most of the whipgrass accessions used in the present study were hexaploid (2
n = 6x = 54); only four accessions were tetraploid (2
n = 4x = 36).
Table 7.
Source of the clones of H. compressa.
Table 7.
Source of the clones of H. compressa.
| No. | Code | Origin | Latitude (N) | Longitude (E) | Altitude (m) | Geographic Groups | Morphological Types † | Ploidy+ |
|---|
| 1 | H041 | Dushan, Guizhou | 25°20'18" | 107°28'41" | 930 | GZ | II | 6x |
| 2 | H042 | Dushan, Guizhou | 25°36'20" | 107°29'38" | 950 | GZ | I | 6x |
| 3 | H043 | Dushan, Guizhou | 25°49'23" | 107°32'31" | 970 | GZ | I | 6x |
| 4 | H044 | Dushan, Guizhou | 25°34'29" | 107°44'13" | 820 | GZ | II | 6x |
| 5 | H045 | Libo, Guizhou | 25°29'58" | 107°49'45" | 890 | GZ | I | 6x |
| 6 | H046 | Libo, Guizhou | 25°24'33" | 107°53'25" | 420 | GZ | I | 6x |
| 7 | H047 | Libo, Guizhou | 25°15'08" | 107°44'35" | 410 | GZ | I | 6x |
| 8 | H002 | Rongchang, Chongqing | 29°24'06" | 105°34'59" | 600 | CQ | II | 6x |
| 9 | H010 | Nanshan, Chongqing | 29°33'24" | 106°37'56" | 420 | CQ | II | 6x |
| 10 | H011 | Hechuan, Chongqing | 30°04'36" | 106°19'32" | 270 | CQ | II | 6x |
| 11 | H031 | Yuzhong, Chongqing | 29°33'13" | 106°31'30" | 180 | CQ | II | 6x |
| 12 | H035 | Liangping, Chongqing | 30°46'42" | 107°34'46" | 400 | CQ | II | 6x |
| 13 | H040 | Fuling, Chongqing | 29°44'03" | 107°22'11" | 190 | CQ | II | 6x |
| 14 | H056 | Jiangjing, Chongqing | 28°49'43" | 106°19'50" | 350 | CQ | II | 6x |
| 15 | H057 | Dazu, Chongqing | 29°40'58" | 105°30'36" | 400 | CQ | II | 6x |
| 16 | Chonggao | Chongqing | - | - | - | CQ | II | 6x |
| 17 | H001 | Leshan, Sichuan | 29°14'05" | 103°15'36" | 500 | CDP | II | 6x |
| 18 | H003 | Yaan, Sichuan | 30°01'12" | 103°02'04" | 670 | CDP | II | 6x |
| 19 | H004 | Yaan, Sichuan | 30°10'46" | 103°13'12" | 750 | CDP | II | 6x |
| 20 | H006 | Hongya, Sichuan | 29°53'20" | 103°22'31" | 540 | CDP | II | 6x |
| 21 | H009 | Hongya, Sichuan | 29°53'51" | 103°22'25" | 480 | CDP | II | 6x |
| 22 | H013 | Qionglai, Sichuan | 30°23'10" | 103°27'36" | 520 | CDP | II | 6x |
| 23 | H014 | Dayi, Sichuan | 30°33'56" | 103°30'20" | 540 | CDP | II | 4x |
| 24 | H016 | Meishan, Sichuan | 36°25'00" | 103°51'12" | 465 | CDP | I | 4x |
| 25 | H017 | Leshan, Sichuan | 29°32'15" | 103°49'05" | 390 | CDP | I | 6x |
| 26 | H019 | Yaan, Sichuan | 29°57'26" | 103°06'38" | 540 | CDP | II | 6x |
| 27 | H054 | Leshan, Sichuan | 29°06'28" | 104°00'27" | 340 | CDP | II | 6x |
| 28 | Guangyi | Guangxi | - | - | - | CDP | III | 6x |
| 29 | Yaan | Yaan, Sichuan | 29°59'48" | 103°01'33" | 620 | CDP | III | 6x |
| 30 | H026 | Ningnan, Sichuan | 27°30'50" | 102°45'25" | 1200 | YL | II | 6x |
| 31 | H028 | Ningnan, Sichuan | 27°08'28" | 102°38'36" | 1350 | YL | II | 4x |
| 32 | H029 | Ningnan, Sichuan | 26°54'12" | 102°53'56" | 710 | YL | III | 4x |
| 33 | H048 | Qiaojia, Yunnan | 26°53'51" | 102°56'46" | 920 | YL | I | 6x |
| 34 | H049 | Qiaojia, Yunnan | 26°56'18" | 102°53'45" | 680 | YL | I | 6x |
| 35 | H050 | Ningnan, Sichuan | 26°53'12" | 102°54'58" | 670 | YL | III | 6x |
| 36 | H051 | Ningnan, Sichuan | 26°53'32" | 102°54'26" | 710 | YL | II | 6x |
| 37 | H058 | Panzhihua, Sichuan | 26°45'07" | 101°50'31" | 1200 | YL | II | 6x |
Figure 5.
Map showing the geographical locations of the 37 whipgrass clones in China, with spots indicating the collection sites.
Figure 5.
Map showing the geographical locations of the 37 whipgrass clones in China, with spots indicating the collection sites.
3.4. Data Scoring and Statistical Analysis
No assumptions about the genetic nature of the SCoT DNA fragments/bands (designated as alleles from this point forward) were made due to the aneu-polyploid nature of whipgrass and the absence of segregation analysis [
36]. Therefore, unequivocally scorable bands were scored manually as either present (1) and absent (0). Each band was treated as an independent character regardless of its intensity and used to create a matrix to estimate the variables listed below.
The discriminatory power of the SCoT primer sets was evaluated based on the following eight parameters: the total number of bands (TNB), the number of polymorphic bands (NPB), the percentage of polymorphic bands (PPB), the polymorphism information content (PIC), the genotype index (GI), the resolving power (Rp), the marker index (MI) and Shannon’s diversity index (H). The polymorphism information content (PIC) for each SCoT marker was calculated with the formula described by Roldan-Ruiz
et al. [
21]: PIC
i = 2
fi(1 −
fi) where PIC
i is the polymorphic information content of marker
i,
fi the frequency of the marker bands which were present, and (1 −
fi) the frequency of marker bands which were absent. PIC values for dominant marker bands such as SCoT markers have a maximum of 0.5 for
fi = 0.5 [
22]. PIC values were used to calculate a primer index, which was generated by adding the PIC values of all markers amplified by the same primer. GI reveals the proportion of genotype profiles to the total tested materials studied per assay [
37]. The band informativeness (Ib) was estimated using the following equation: Ib = 1 − (2 × |0.5 − p
i|), where p
i is the proportion of the varieties or genotypes containing the band [
38]. Rp was measured using the following equation: Rp = ΣIb. MI was determined using the following equation: EMR × DI, where the EMR (Effective Multiplex Ratio) was the number of polymorphic markers generated per assay and the DI (Diversity Index) was the average PIC value [
39]. Shannon’s diversity index (H) was calculated using the following equation: H = −∑
fiLn
fi, where “
fi” is the frequency of an amplified band across all samples. Pearson correlation coefficients were calculated between the last five parameters (PIC, Rp, MI, GI and H).
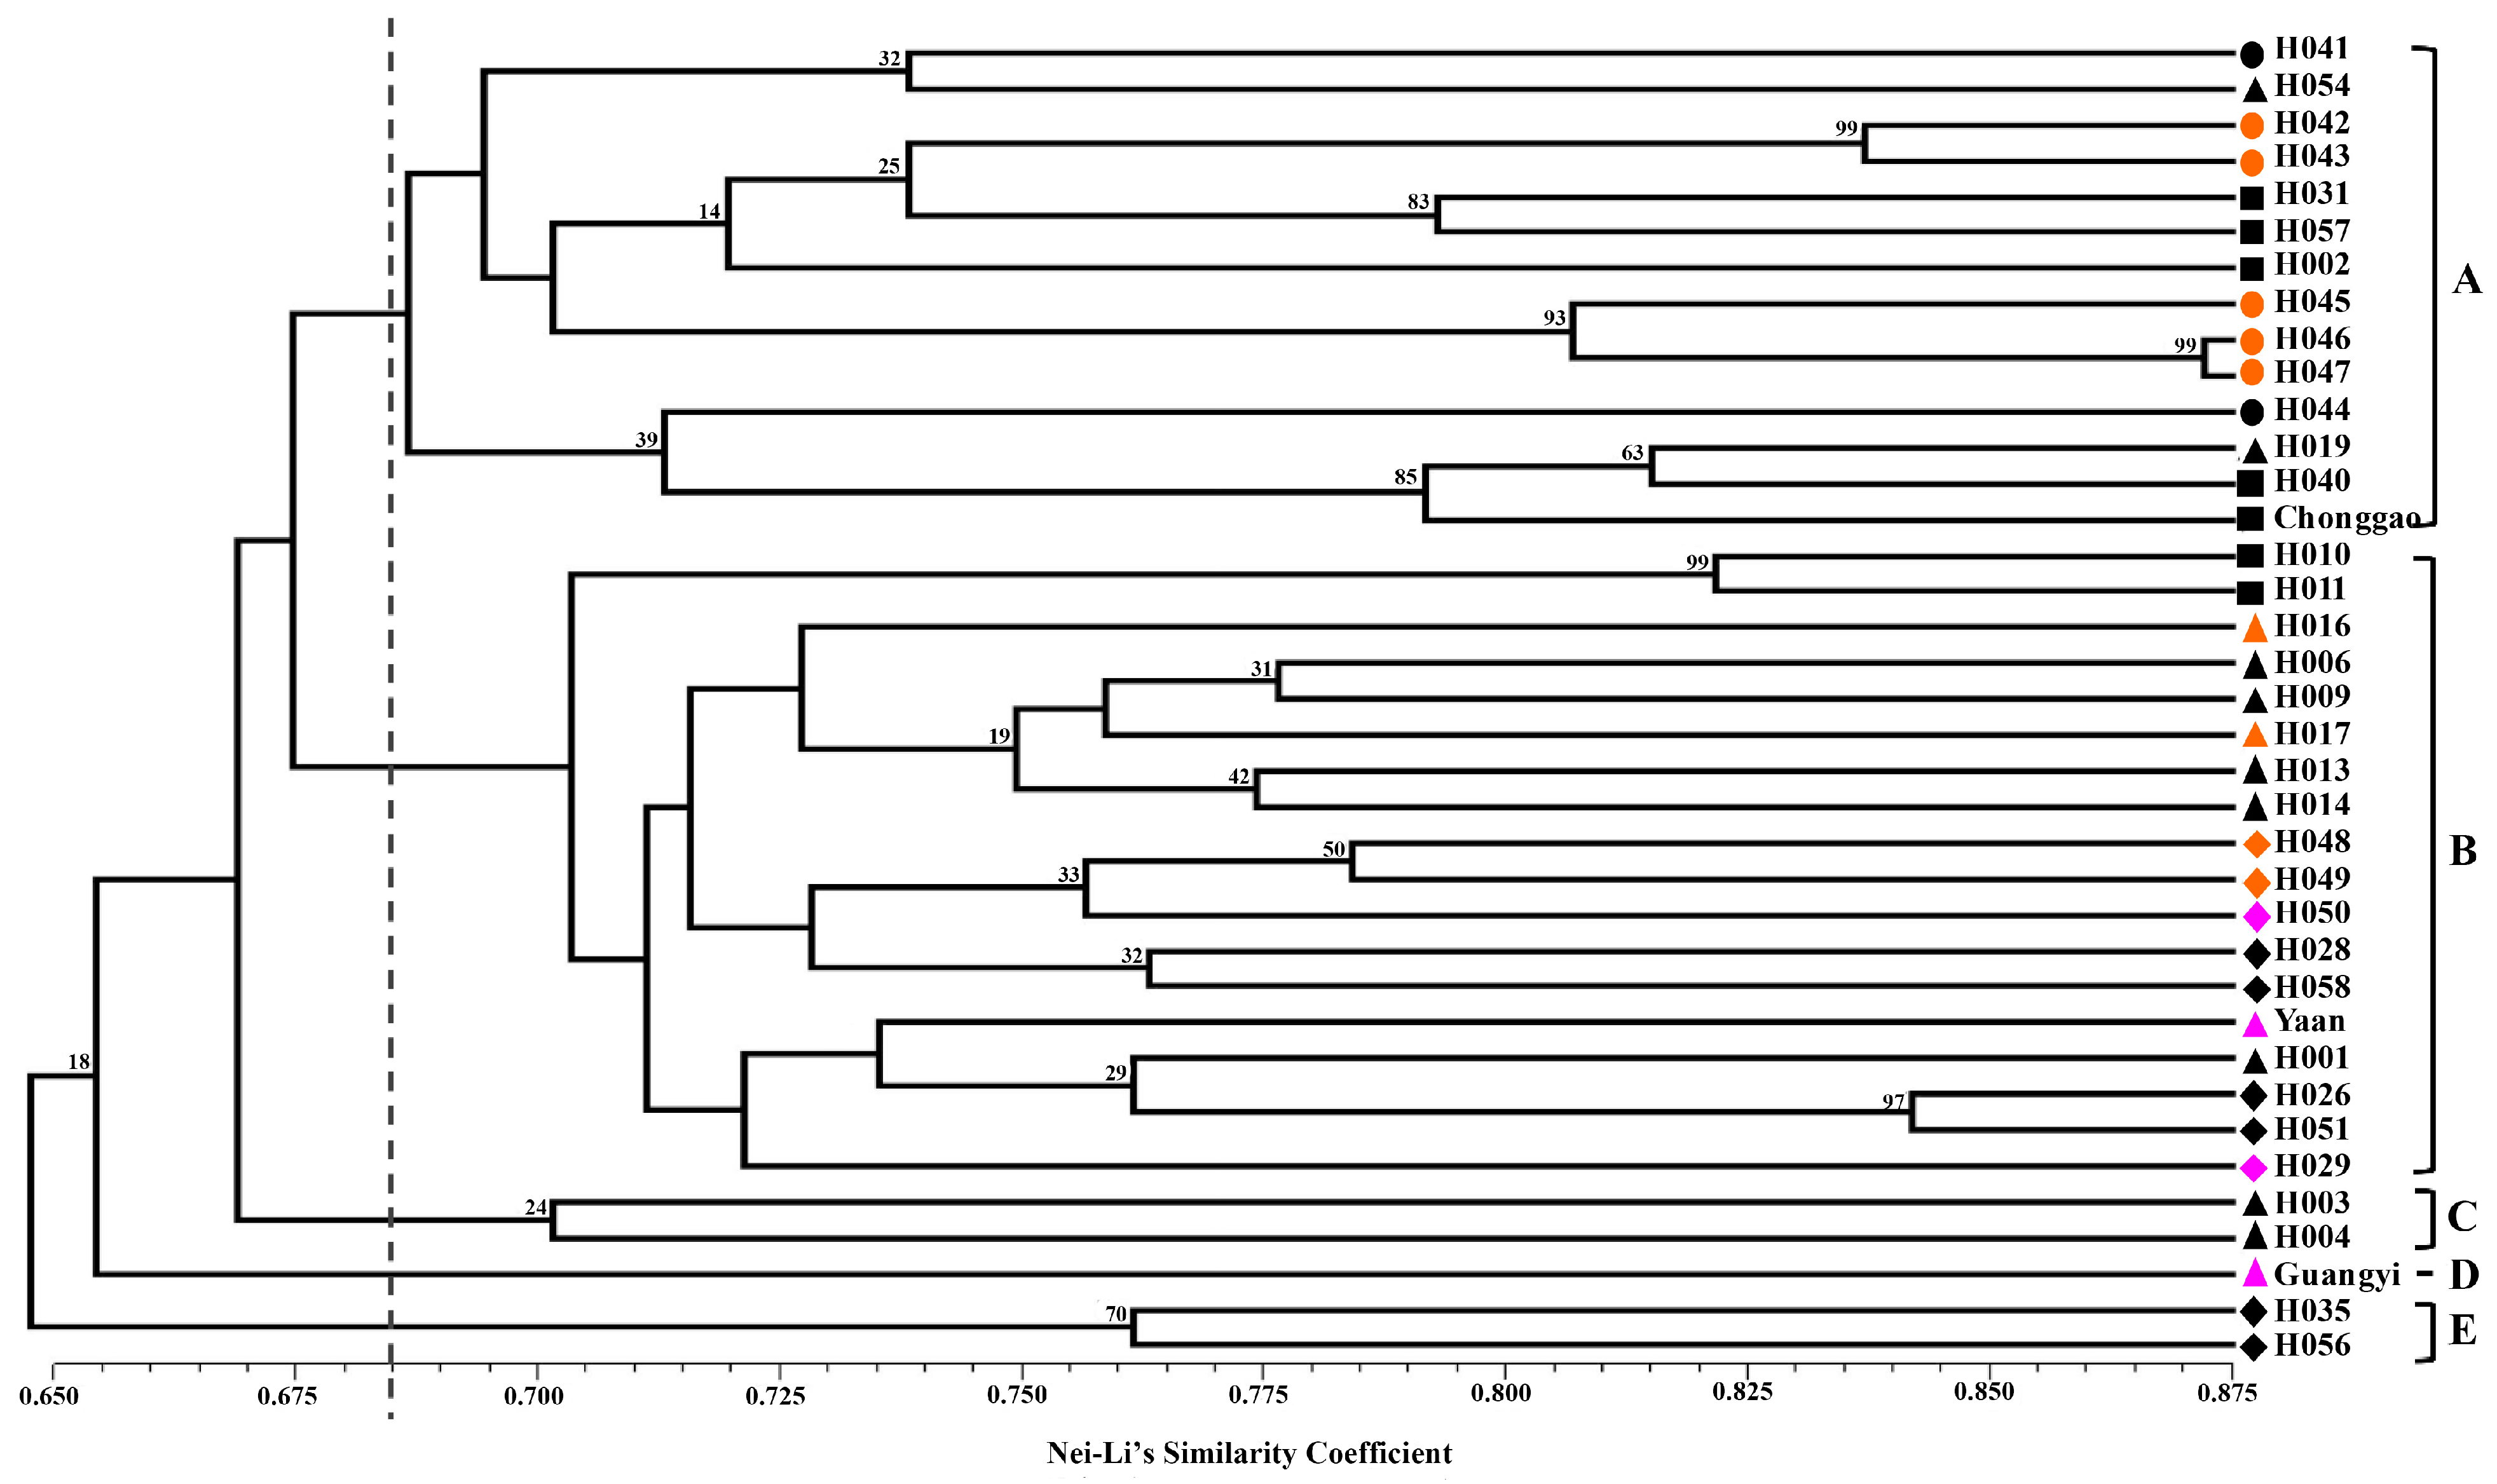
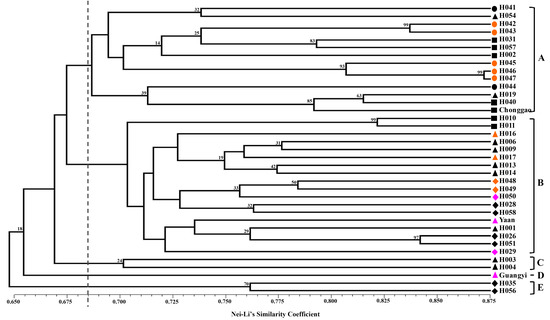
Nei and Li’s GS [
40] and the unweighted pair group method with arithmetic mean (UPGMA) were used to perform clustering analysis. The clustering analysis was tested by bootstrapping analysis to assess the robustness of the dendrogram topology using NTSYS-pc 2.10 software [
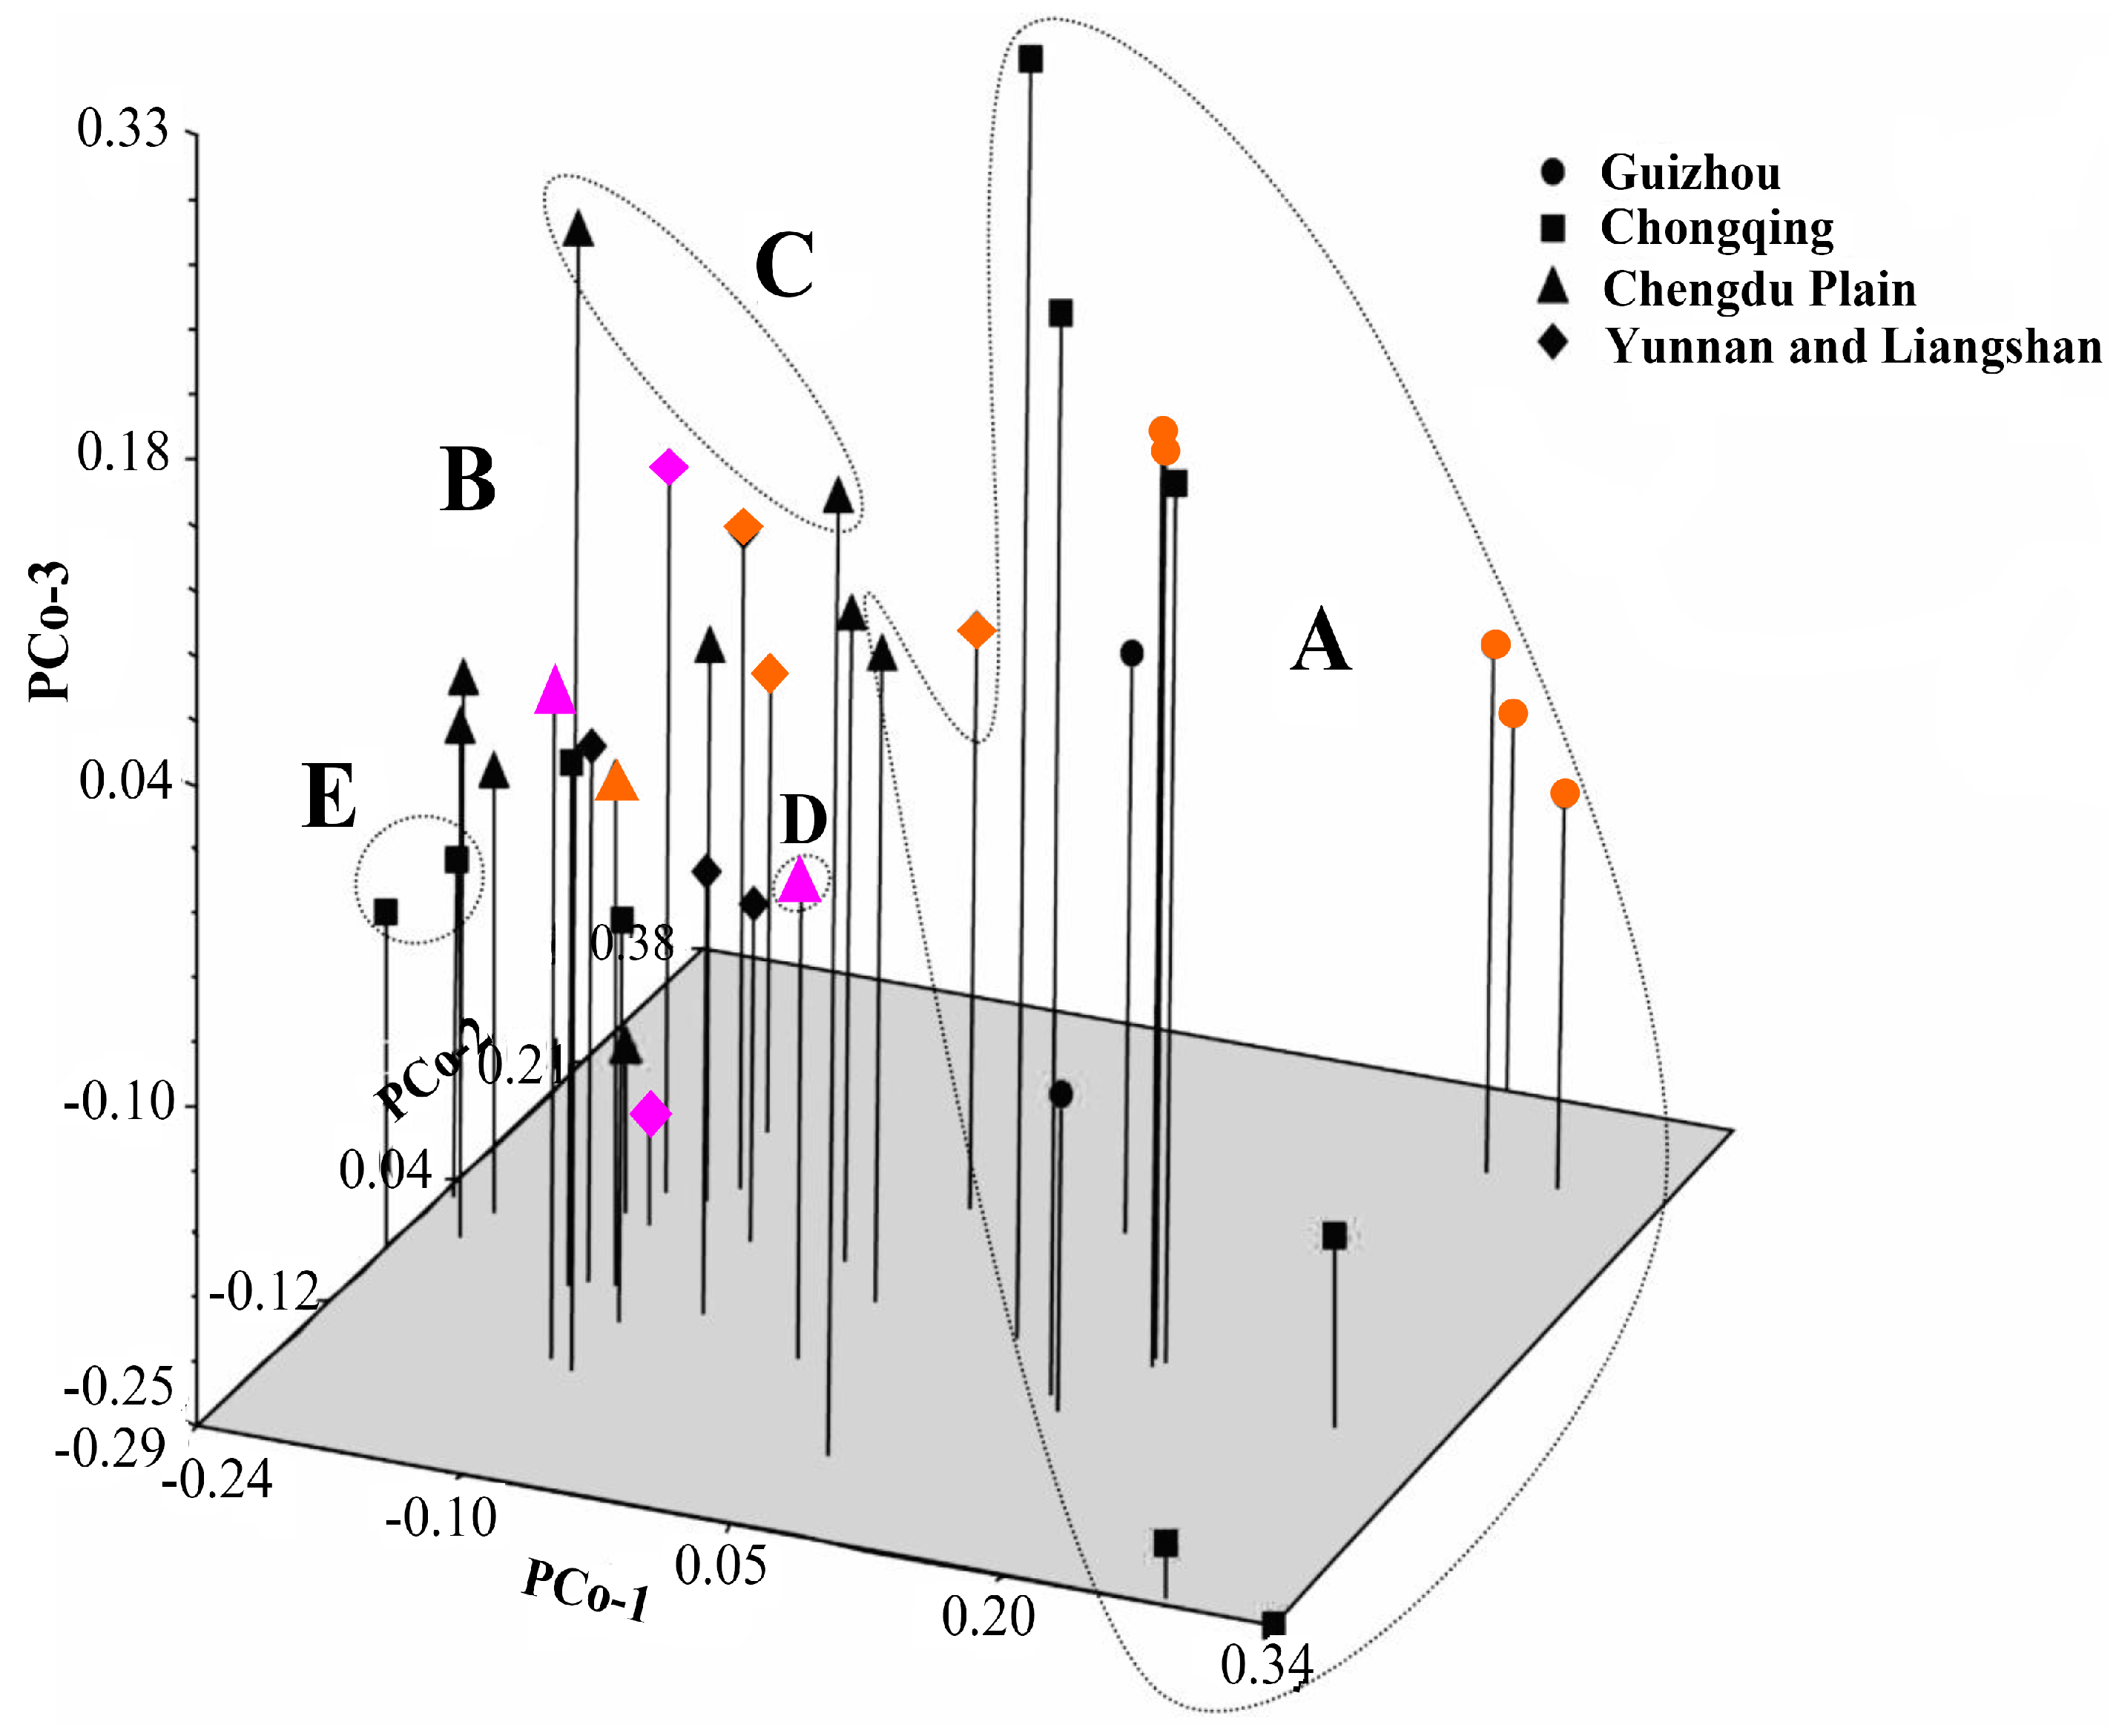
41]. Principal coordinate analysis (PCoA) was also performed to determine the location relationship of the 37 accessions in three dimensions. Furthermore, a Mantel test with 10,000 permutations was conducted using the same software to determine the extent of correlation, if any, between the genetic distance (GD = 1 − GS) and the geographical distance (in kilometers) [
42].
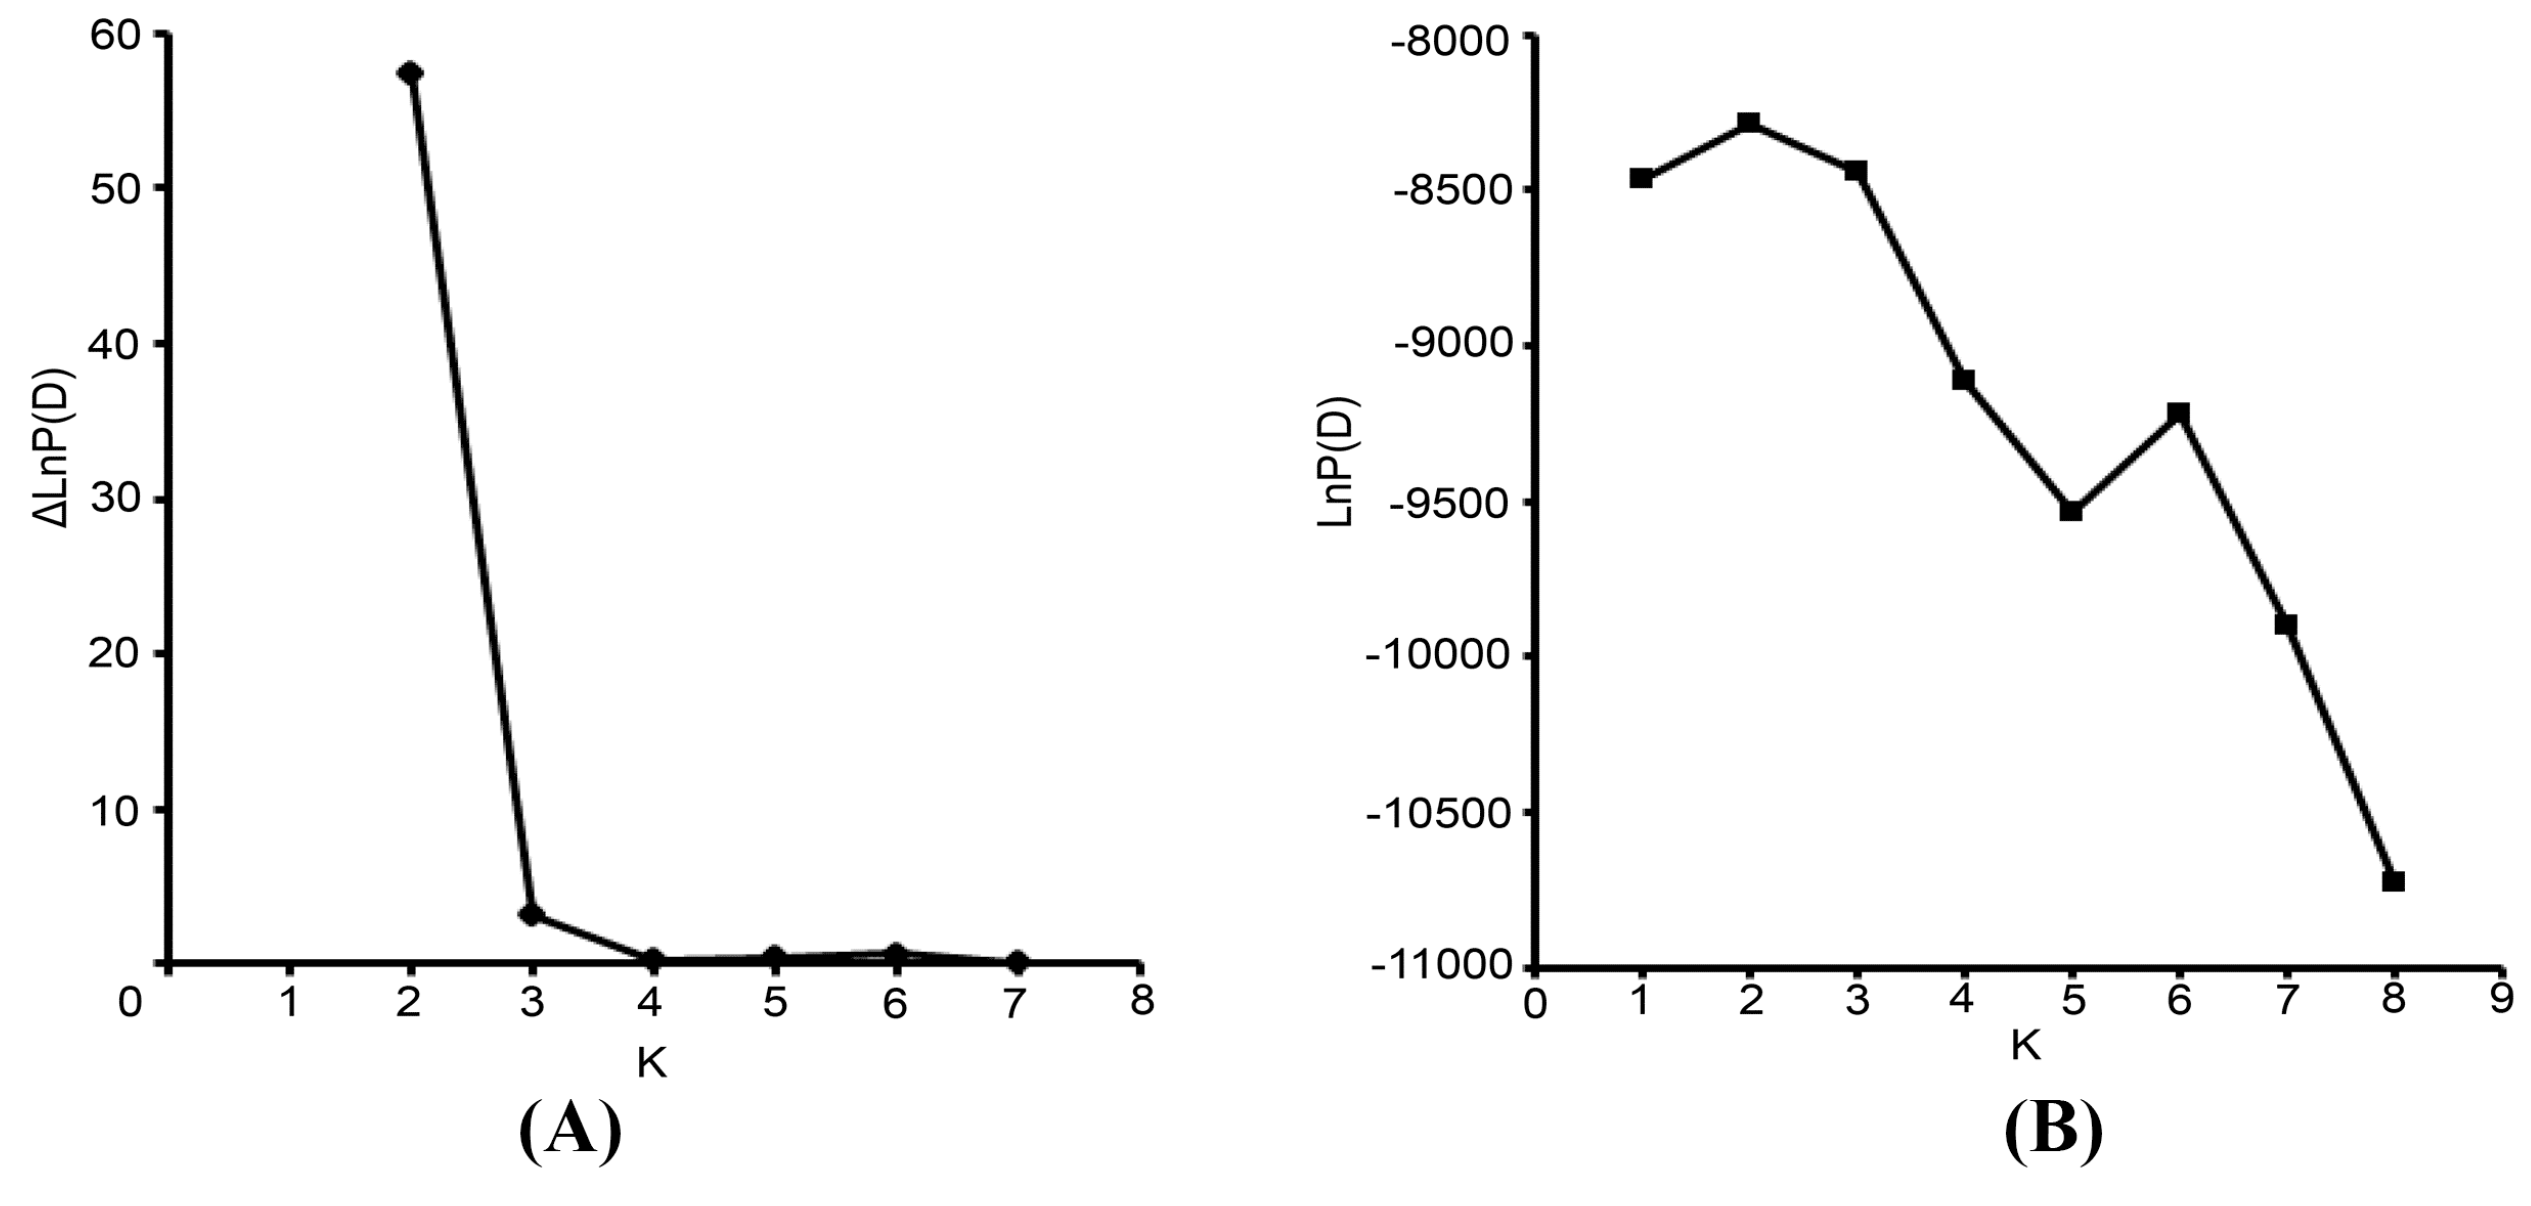
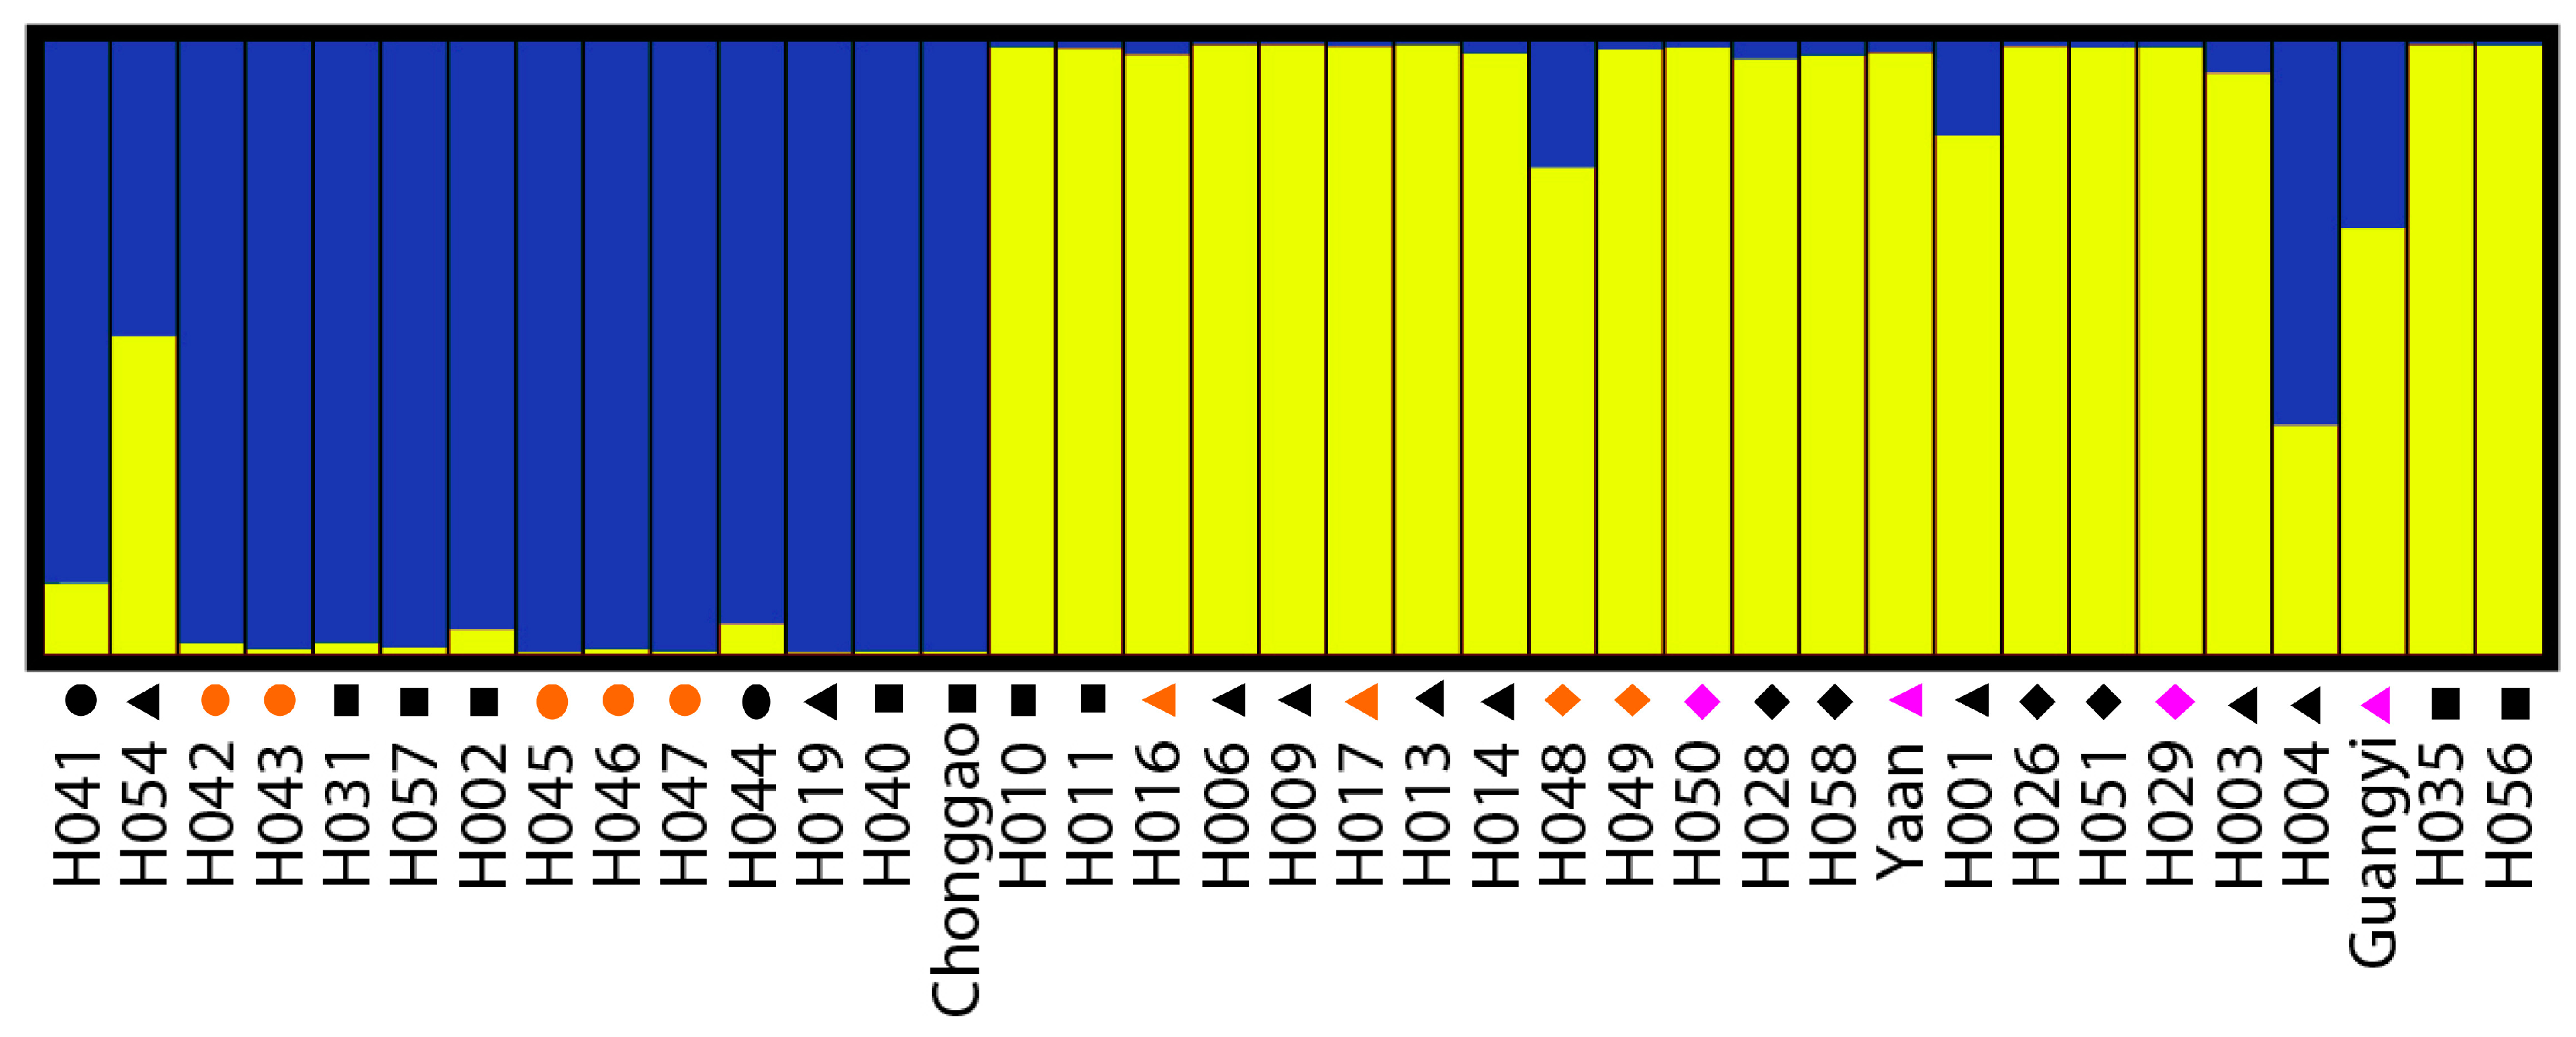
The Bayesian-based clustering method was applied to delineate the clusters of genetically similar accessions using STRUCTURE software version 2.3.3 [
18,
43]. An admixture model and an allele frequencies-correlated model were adopted without prior assumptions concerning the population. The value of K was set from 1 to 8. Ten independent runs were performed, each with a Markov Chain Monte Carlo (MCMC) of 100,000 repetitions following a burn-in period of 50,000 iterations [
17]. Default values were used for all other parameters. For the chosen K value, the run that had the highest likelihood estimate was adopted to assign individuals to clusters. To identify the optimal value of K, the STRUCTURE output file was implemented in Structure Harvester [
44]. The 10 runs with the highest LnP(D) and/or ΔLnP(D) values for the selected K-value were retained, and their admixture estimates were averaged using CLUMPP 1.1 [
45]. The run with the maximum likelihood was applied to subdivide the tested accessions into different subgroups using a membership probability threshold of 0.60 [
46]. Accessions with less than 0.60 membership probabilities were retained in the admixed group (AD). The results were visualized using DISTRUCT 1.1 [
47].
The germplasm collections studied here were artificially grouped into four geographic groups. The geographical distances between accessions within the groups varied greatly from tens to hundreds of kilometers. It is difficult to analyze the variance components and their significance levels of genetic variation within and between geographic groups using common software under the Hardy-Weinberg equilibrium assumption. To avoid the complications mentioned above, genetic divergence was analyzed using Shannon’s diversity index, analysis of molecular variance (AMOVA) and Bayesian inference. The magnitude of the genetic variation was determined for each geographical group using Shannon’s diversity index [
48]. Shannon’s diversity index is frequently applied in dominant marker data analysis because the index is insensitive to the potential introduction of bias due to undetectable heterozygosity. Total diversity was calculated using the Shannon index with the following equation: H
W = −∑
fiLn
fi, where “
fi” is the frequency of an amplified band across all samples. The Shannon index within a subset of data (a geographic group) can be calculated using the following equation: H
zone = −∑
fiLn
fi, where “
fi” is the frequency of an amplified band within a subset. The average diversity between different groups was calculated using the following equation: H
A = H
zone = ∑H
zone/n, where
n is the number of groups. Thus, H
A is the average group diversity over
n groups. The intra- and inter-group diversity components were calculated as H
A/H
W and (H
W − H
A)/H
W, respectively. To compare the levels of diversity detected by different primer sets, the total Shannon diversity was calculated separately for each primer set.
AMOVA based on a Euclidean squared distance matrix was hierarchically calculated to estimate the allocation of genetic variation among and within regional groups using GenAlEx version 6.5 [
32]. AMOVA components of variance include Φ
PT, an analogue of F
ST [
49]. The significance of the different components of variance was tested with 9999 random permutations.
We compared the Shannon index and AMOVA results for the population genetic structure with allele-frequency estimates calculated using HICKORY software 1.1 [
19]. HICKORY employs a Bayesian approach to estimate
θB using dominant markers; HICKORY does not assume Hardy-Weinberg equilibrium. Its
f and
θB are equivalent to the inbreeding coefficient (F
IS) and the fixation index (F
ST) of F-statistics, respectively. The Bayesian estimator of genetic diversity was calculated for each of the following four models: (1) the
full model (with non-informative priors for
f and
θB); (2)
f = 0 (assumes no inbreeding); (3)
θB = 0 (assumes no population structure); and (4)
f-free (allows for the incorporation of uncertainty concerning
f into the analysis). We conducted several runs with default sampling parameters (burn-in = 50,000, sample = 250,000, thin = 50) to ensure model convergence. The deviance information criterion (DIC) was used to estimate the fit between the data and a particular model and to choose among models [
50].

 ,
, 
