Spectral and Kinetic Properties of Radicals Derived from Oxidation of Quinoxalin-2-One and Its Methyl Derivative

Abstract
:
1. Introduction
2. Results and Discussion

2.1. Reactions of •OH
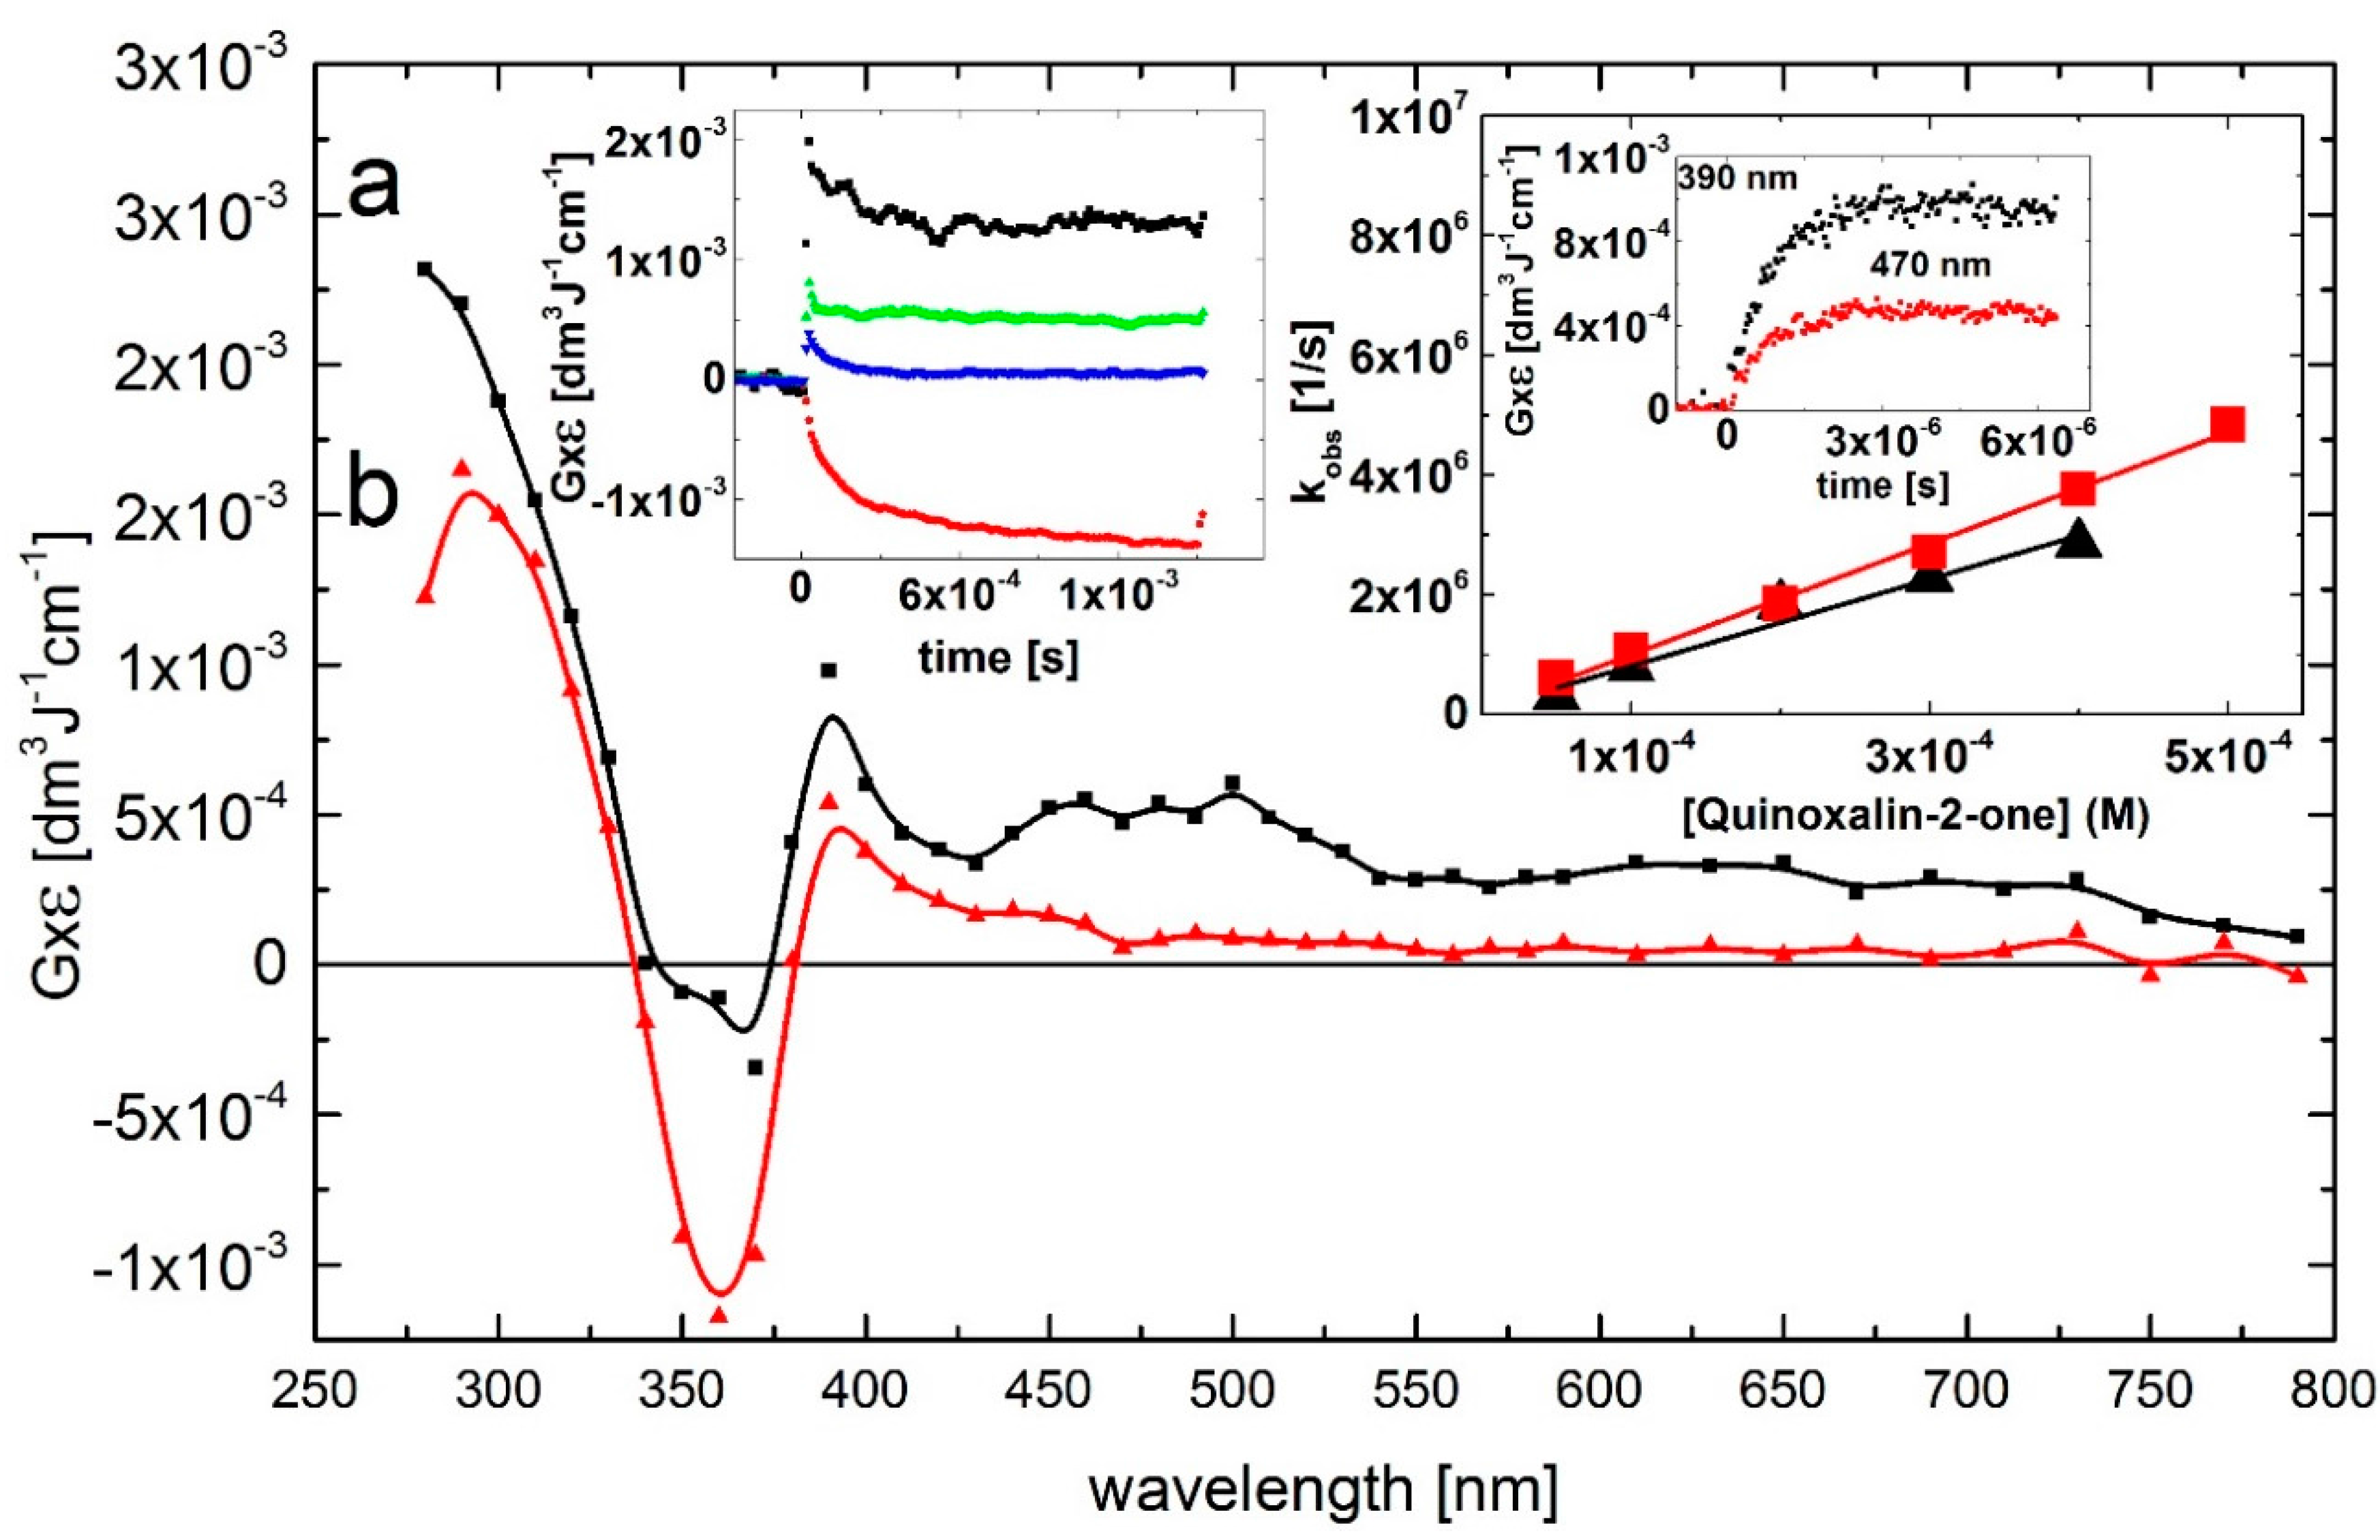
2.1.1. Quinoxalin-2(1H)-One (Q)
 ), and 470 nm (
  ) and bleaching at λ = 360 nm (
  ); (right) Plots of the observed pseudo-first-order rate constants of the formation of the 390-nm (▲) and 470 nm (
  ) absorption (kobs) as a function of Q at pH 7. Inset of right inset: Time profiles representing growths at λ = 390 and 470 nm at 0.1 mM concentration of Q.
), and 470 nm ( ) and bleaching at λ = 360 nm ( ); (right) Plots of the observed pseudo-first-order rate constants of the formation of the 390-nm (▲) and 470 nm ( ) absorption (kobs) as a function of Q at pH 7. Inset of right inset: Time profiles representing growths at λ = 390 and 470 nm at 0.1 mM concentration of Q.
) absorption (kobs) as a function of Q at pH 7. Inset of right inset: Time profiles representing growths at λ = 390 and 470 nm at 0.1 mM concentration of Q.
), and 470 nm ( ) and bleaching at λ = 360 nm ( ); (right) Plots of the observed pseudo-first-order rate constants of the formation of the 390-nm (▲) and 470 nm ( ) absorption (kobs) as a function of Q at pH 7. Inset of right inset: Time profiles representing growths at λ = 390 and 470 nm at 0.1 mM concentration of Q.
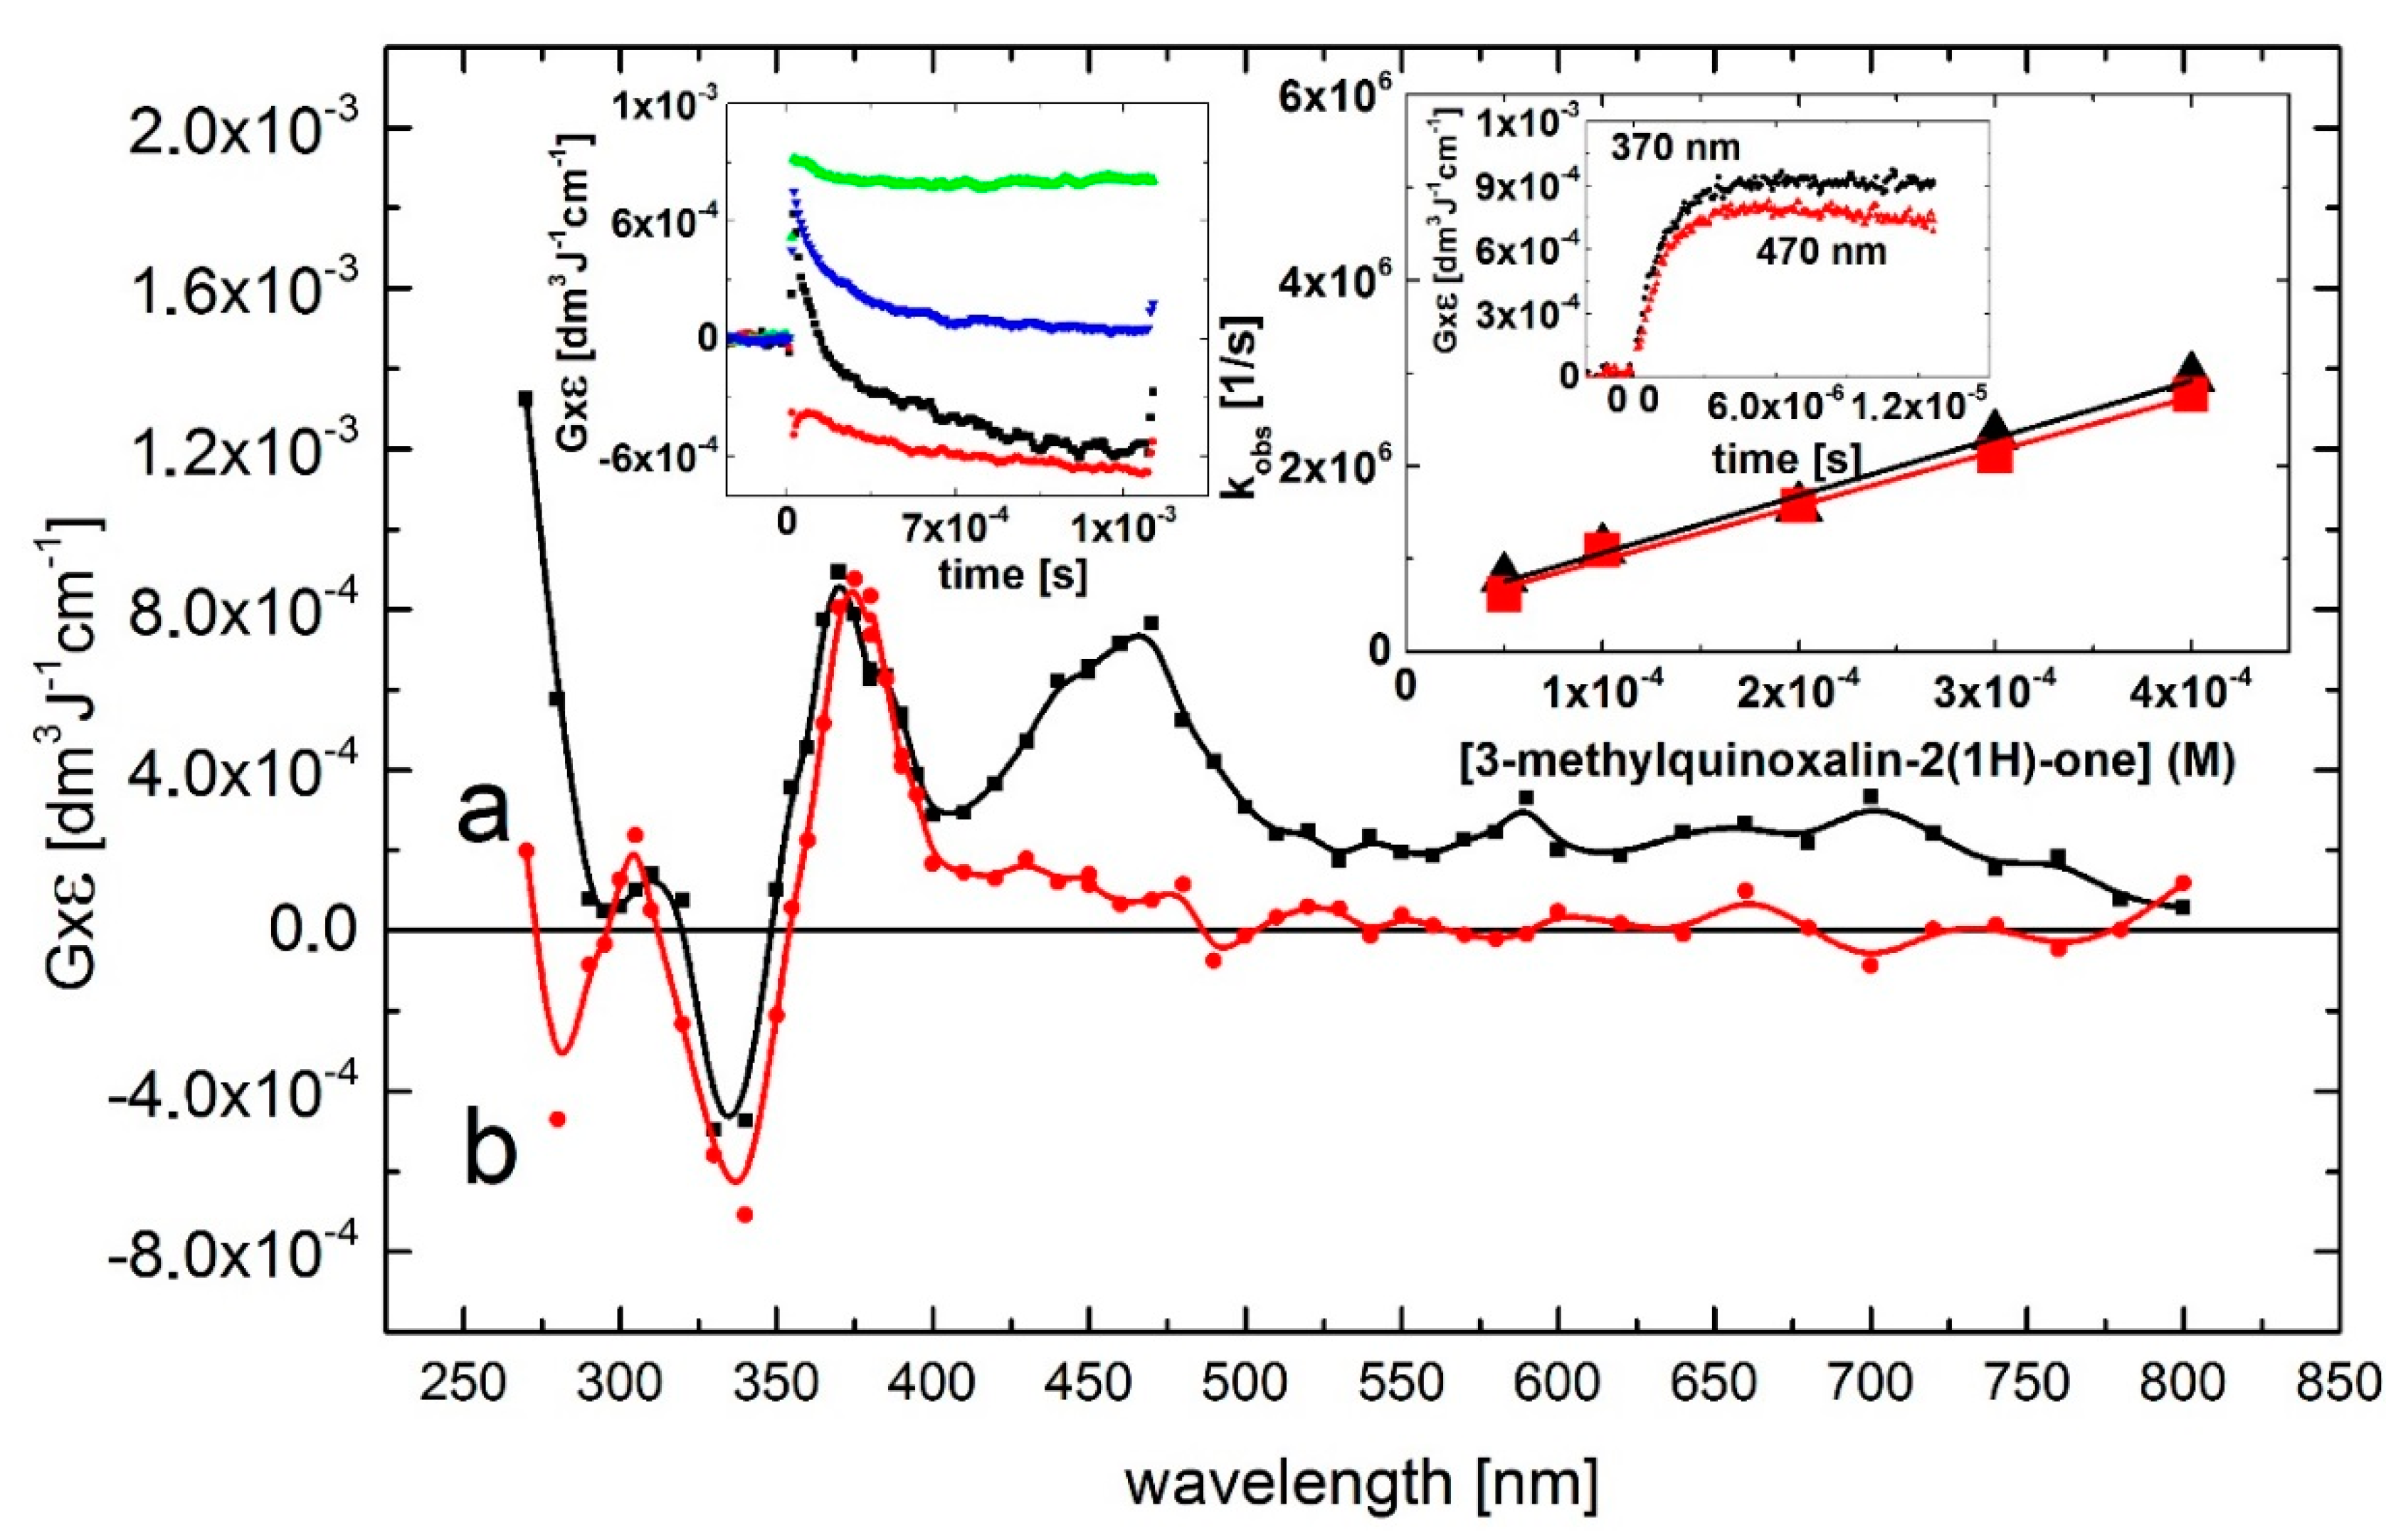
2.1.2. 3-Methylquinoxalin-2(1H)-One (3-MeQ)
), and 470 nm ( ) and bleaching at λ = 330 nm ( ); (right) Plots of the observed pseudo-first-order rate constants of the formation of the 370-nm (▲) and 470 nm ( ) absorption (kobs) as a function of 3-MeQ concentration at pH 7. Inset of right inset: Time profiles representing growths at λ = 390 and 470 nm at 0.1 mM concentration of 3-MeQ. Bottom right inset: Absorption spectrum recorded in N2O-saturated aqueous solution containing 0.2 mM 3-MeQ at pH 7 after γ-irradiation with a dose of 30 Gy.
), and 470 nm ( ) and bleaching at λ = 330 nm ( ); (right) Plots of the observed pseudo-first-order rate constants of the formation of the 370-nm (▲) and 470 nm ( ) absorption (kobs) as a function of 3-MeQ concentration at pH 7. Inset of right inset: Time profiles representing growths at λ = 390 and 470 nm at 0.1 mM concentration of 3-MeQ. Bottom right inset: Absorption spectrum recorded in N2O-saturated aqueous solution containing 0.2 mM 3-MeQ at pH 7 after γ-irradiation with a dose of 30 Gy.
2.1.3. Assignment of the Species Responsible for the 370/390-nm and 470 Absorption Bands
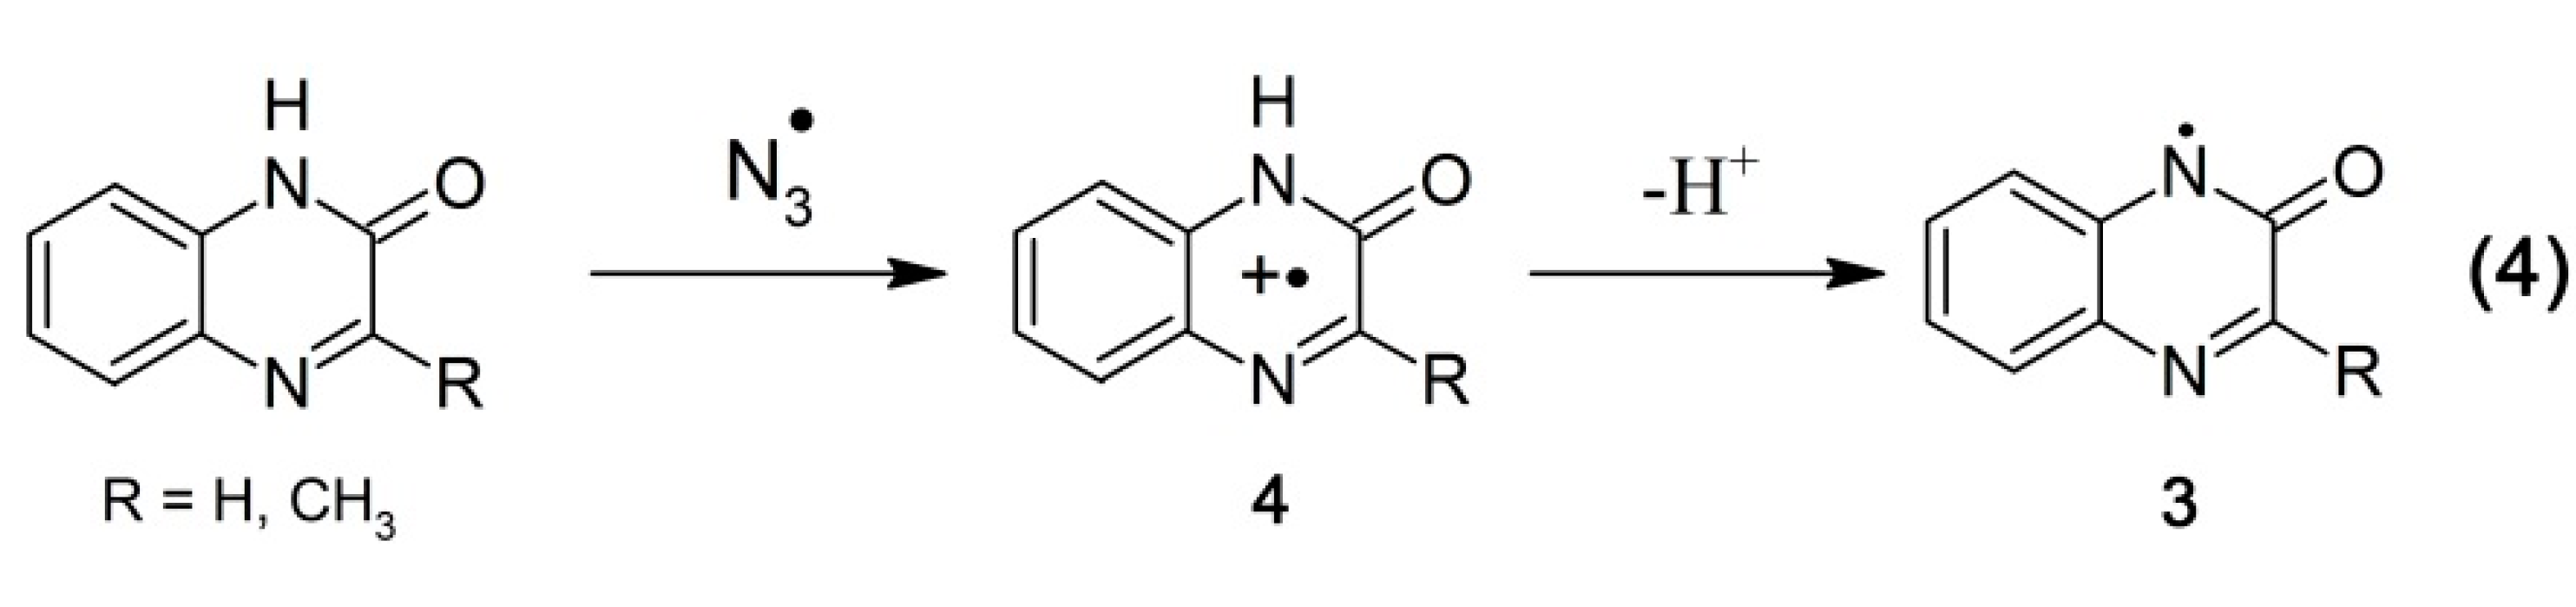
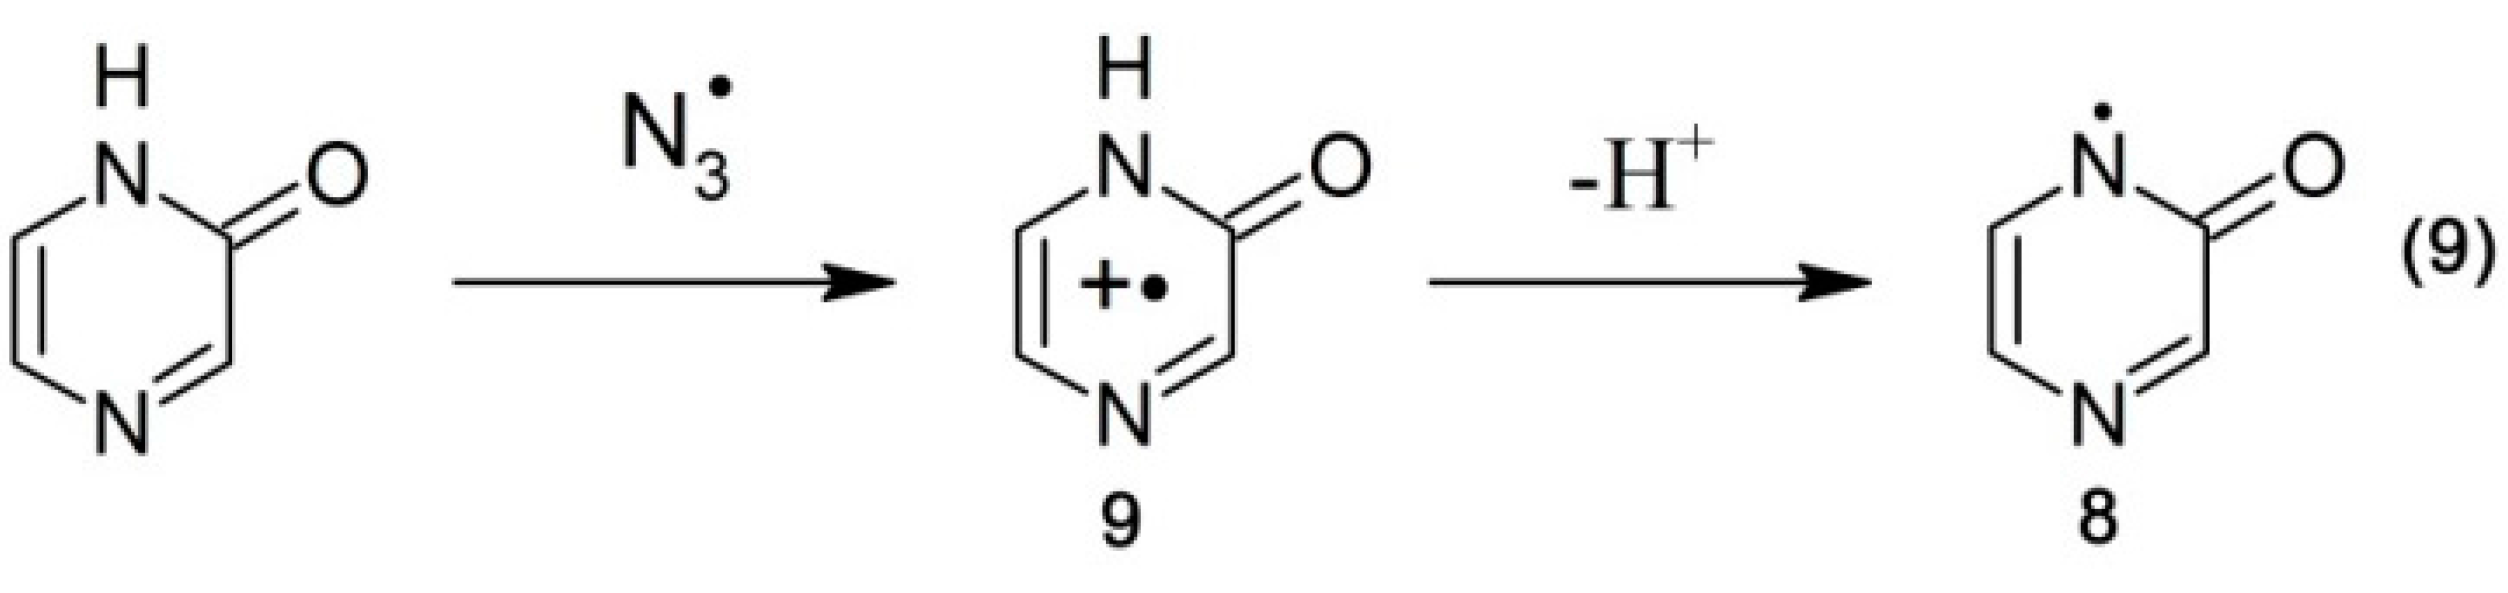
2.1.3.1. Oxidation by •N3 Radicals
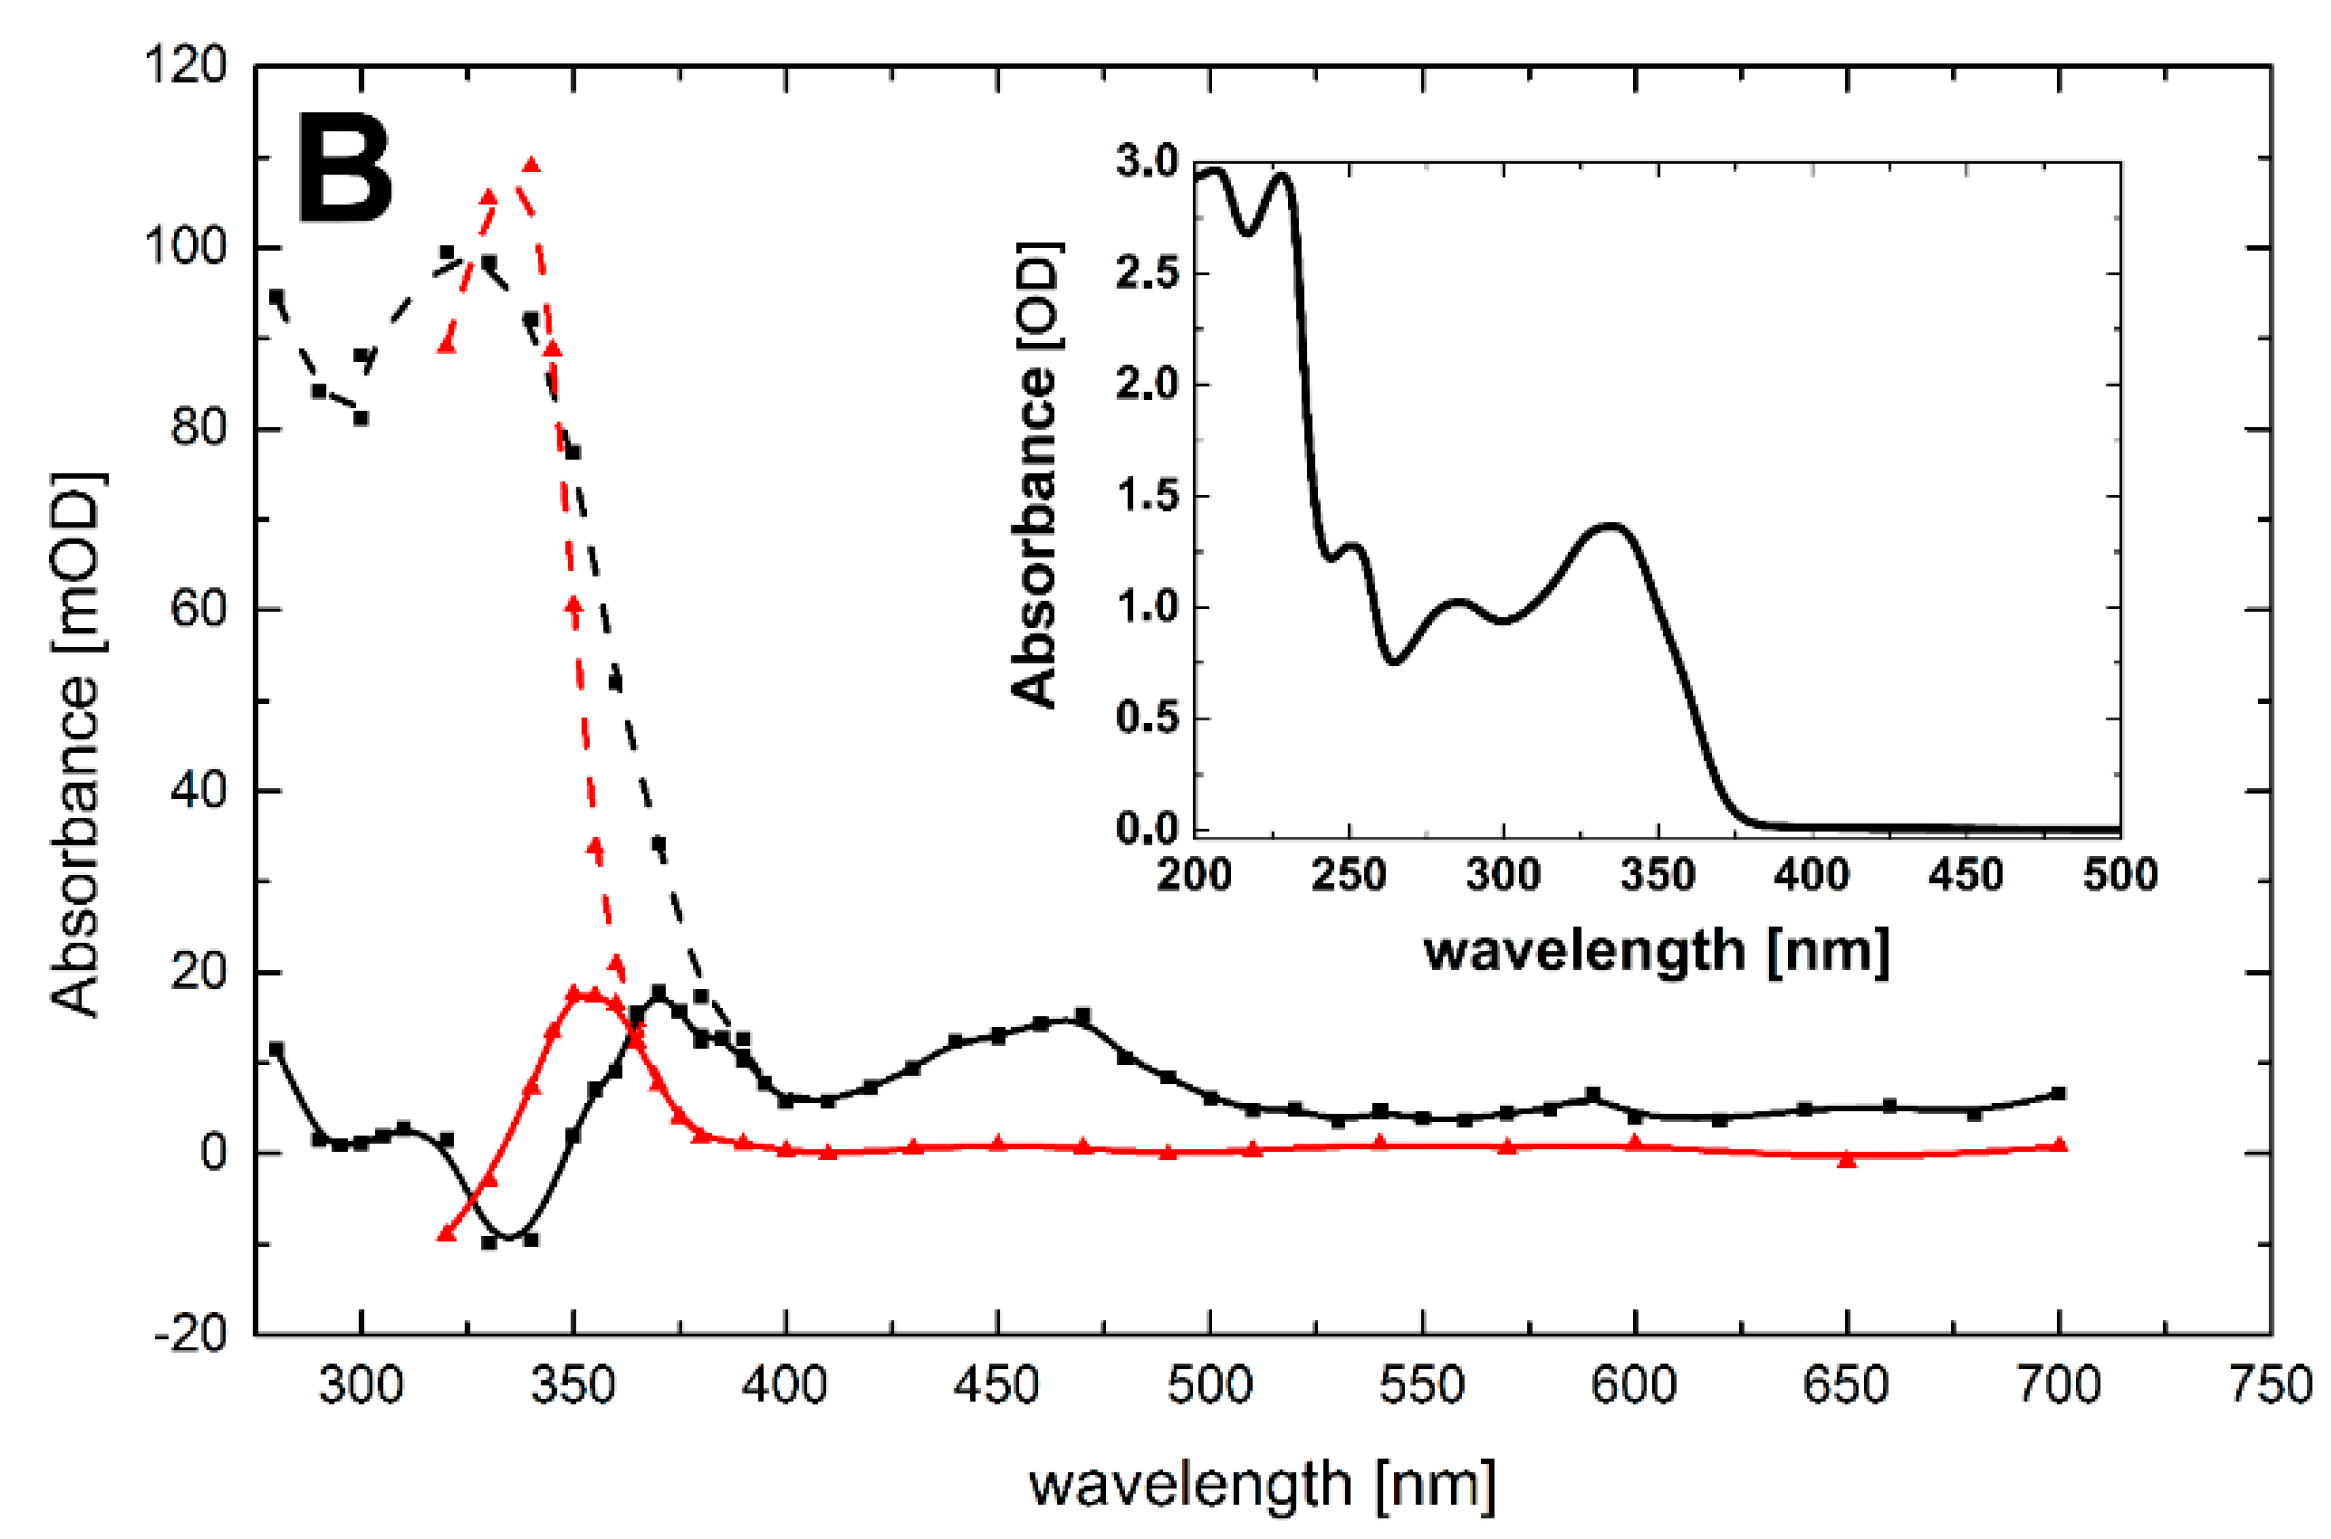
 ); spectrum c, time delay 1.5 ms ( ). Insets: (left) Time profile representing decay at λ = 350 nm; (right) Plot of the observed pseudo-first-order rate constants of the formation of the 350-nm absorption (kobs) as a function of 3-MeQ concentration at pH 7. Inset of right inset: Time profile representing growth at λ = 350 nm at 0.1 mM concentration of 3-MeQ; (B) Transient absorption spectra uncorrected (solid lines), and corrected for the ground-state absorption (dashed lines) recorded 4 μs after the electron pulse in N2O-saturated aqueous solution at pH 7 and containing 0.1 mM of 3-MeQ, without (■), and with 0.1 M NaN3 (
  ). Inset: Ground-state absorption spectrum of 3-MeQ in aqueous solutions at pH 7.
); spectrum c, time delay 1.5 ms ( ). Insets: (left) Time profile representing decay at λ = 350 nm; (right) Plot of the observed pseudo-first-order rate constants of the formation of the 350-nm absorption (kobs) as a function of 3-MeQ concentration at pH 7. Inset of right inset: Time profile representing growth at λ = 350 nm at 0.1 mM concentration of 3-MeQ; (B) Transient absorption spectra uncorrected (solid lines), and corrected for the ground-state absorption (dashed lines) recorded 4 μs after the electron pulse in N2O-saturated aqueous solution at pH 7 and containing 0.1 mM of 3-MeQ, without (■), and with 0.1 M NaN3 ( ). Inset: Ground-state absorption spectrum of 3-MeQ in aqueous solutions at pH 7.
). Inset: Ground-state absorption spectrum of 3-MeQ in aqueous solutions at pH 7.
); spectrum c, time delay 1.5 ms ( ). Insets: (left) Time profile representing decay at λ = 350 nm; (right) Plot of the observed pseudo-first-order rate constants of the formation of the 350-nm absorption (kobs) as a function of 3-MeQ concentration at pH 7. Inset of right inset: Time profile representing growth at λ = 350 nm at 0.1 mM concentration of 3-MeQ; (B) Transient absorption spectra uncorrected (solid lines), and corrected for the ground-state absorption (dashed lines) recorded 4 μs after the electron pulse in N2O-saturated aqueous solution at pH 7 and containing 0.1 mM of 3-MeQ, without (■), and with 0.1 M NaN3 ( ). Inset: Ground-state absorption spectrum of 3-MeQ in aqueous solutions at pH 7.
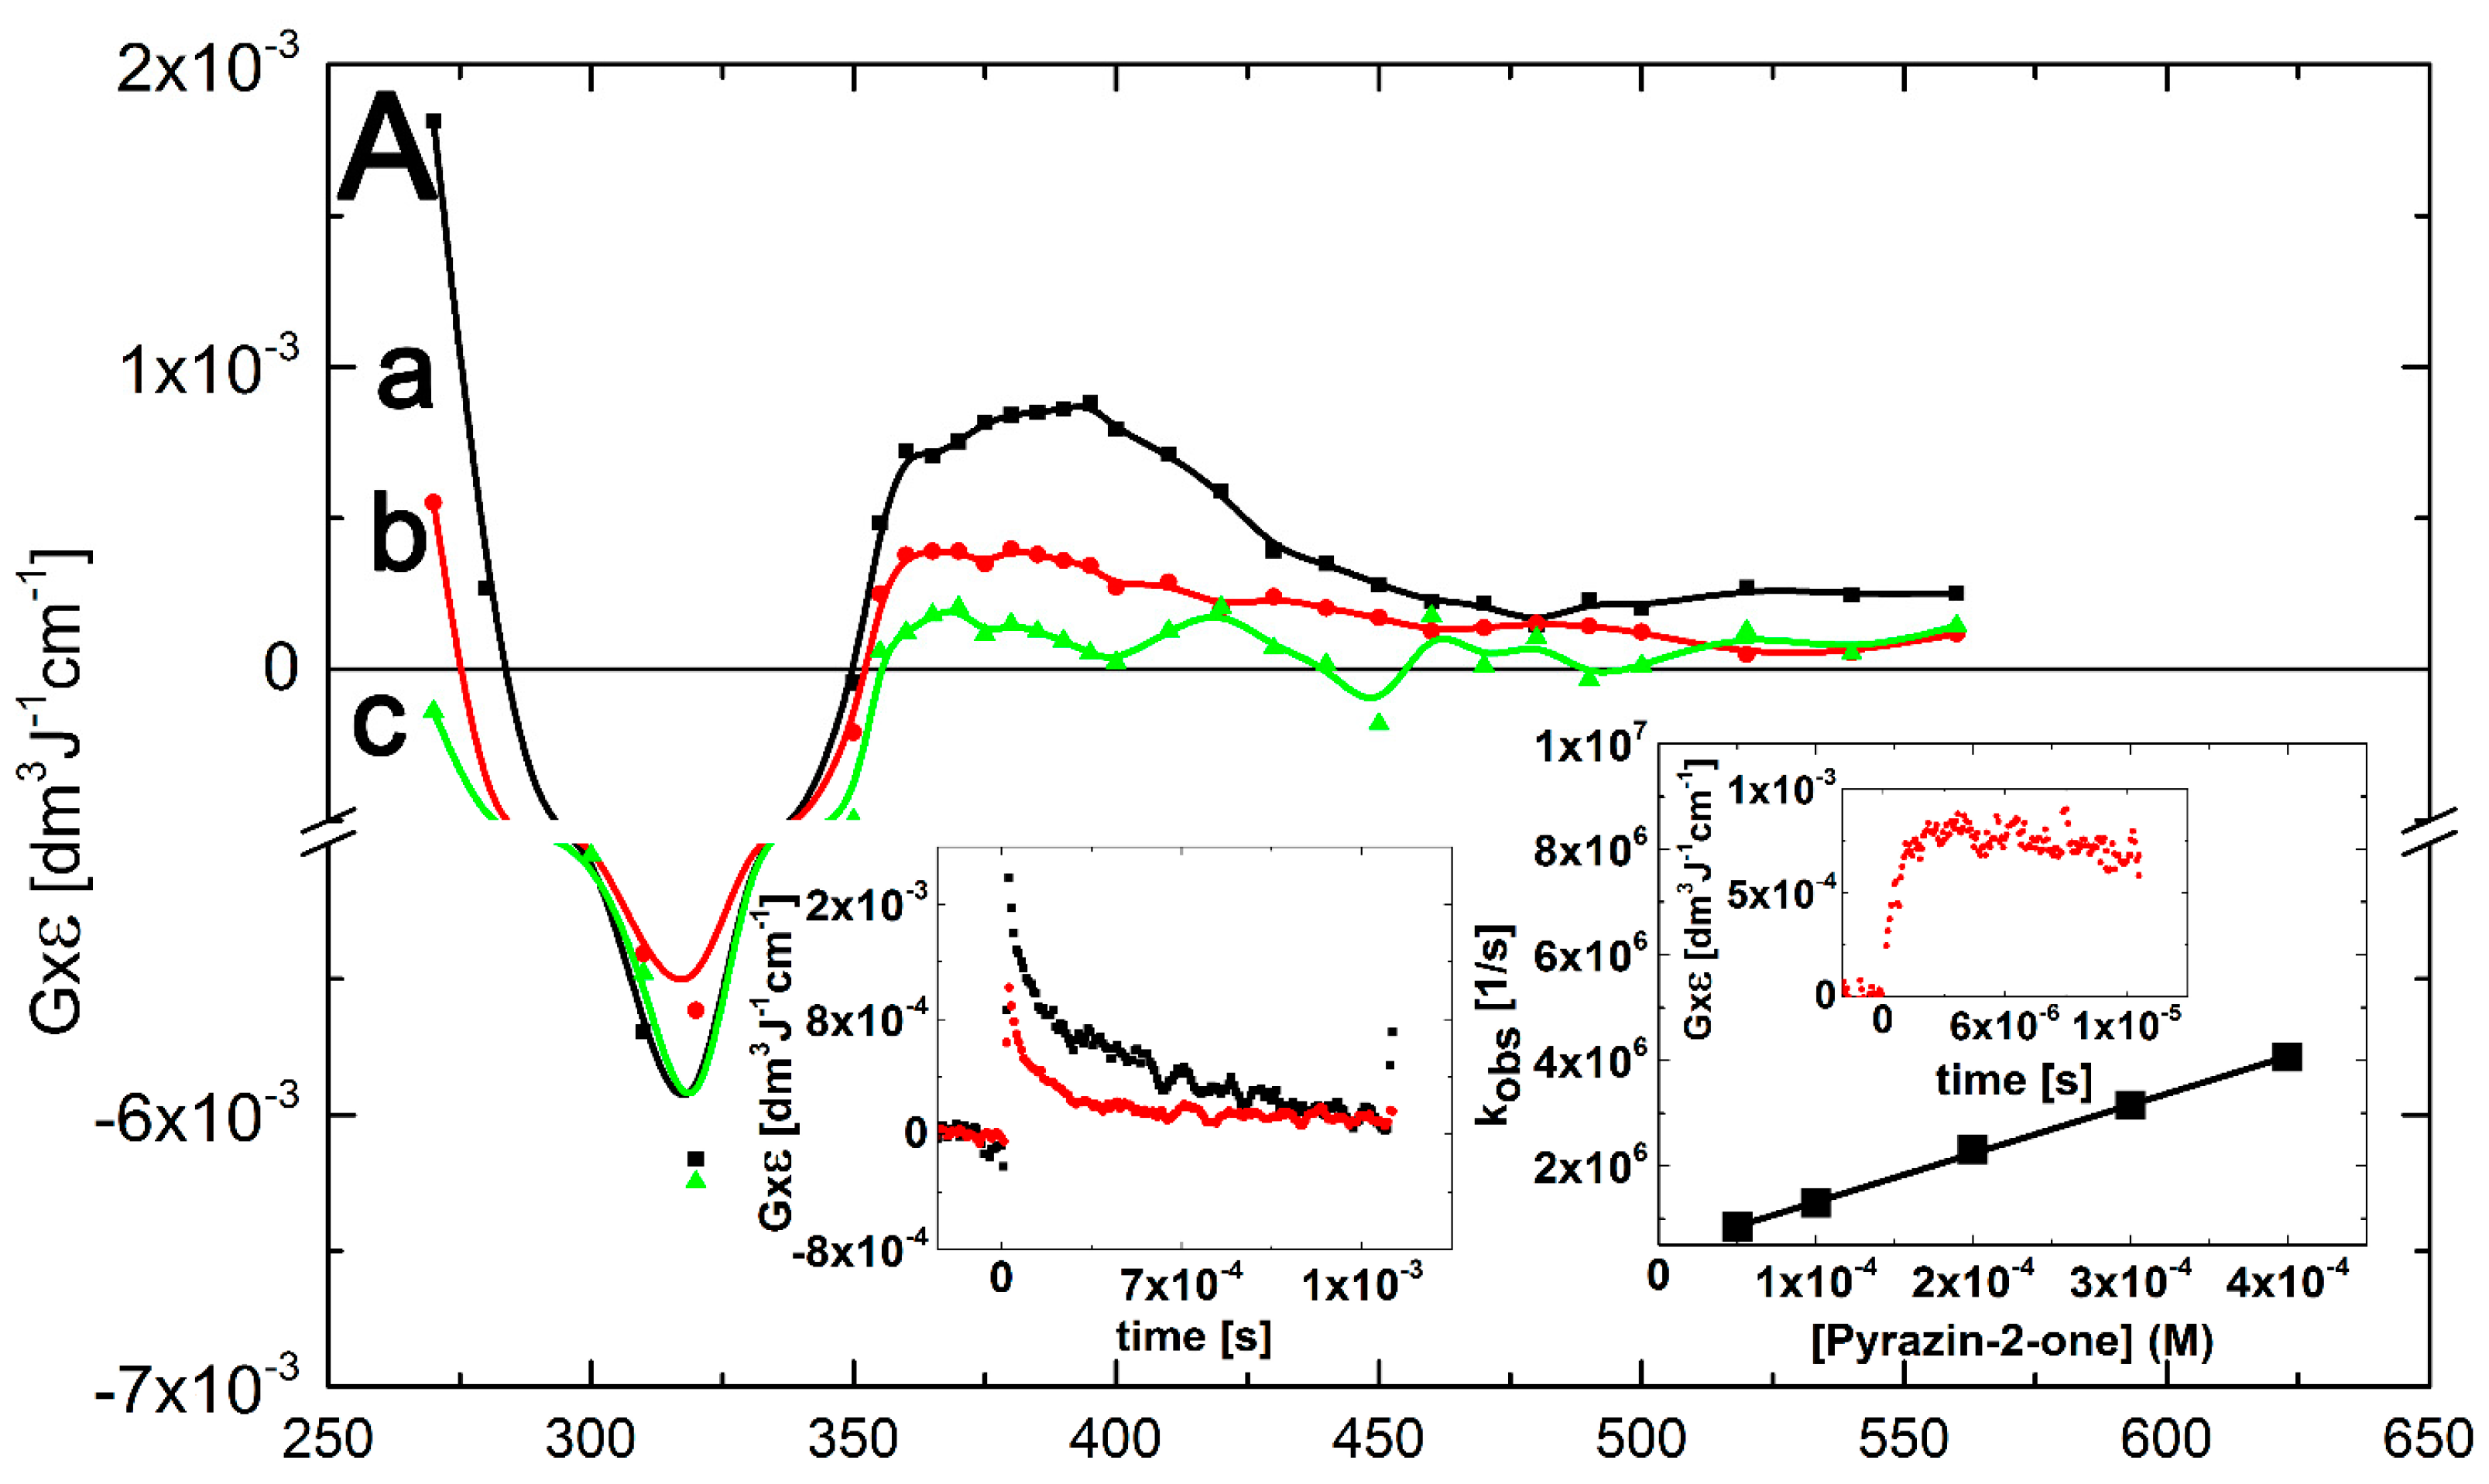
2.1.3.2. Oxidation of Pyrazin-2-One (Pyr) by •OH and •N3 Radicals
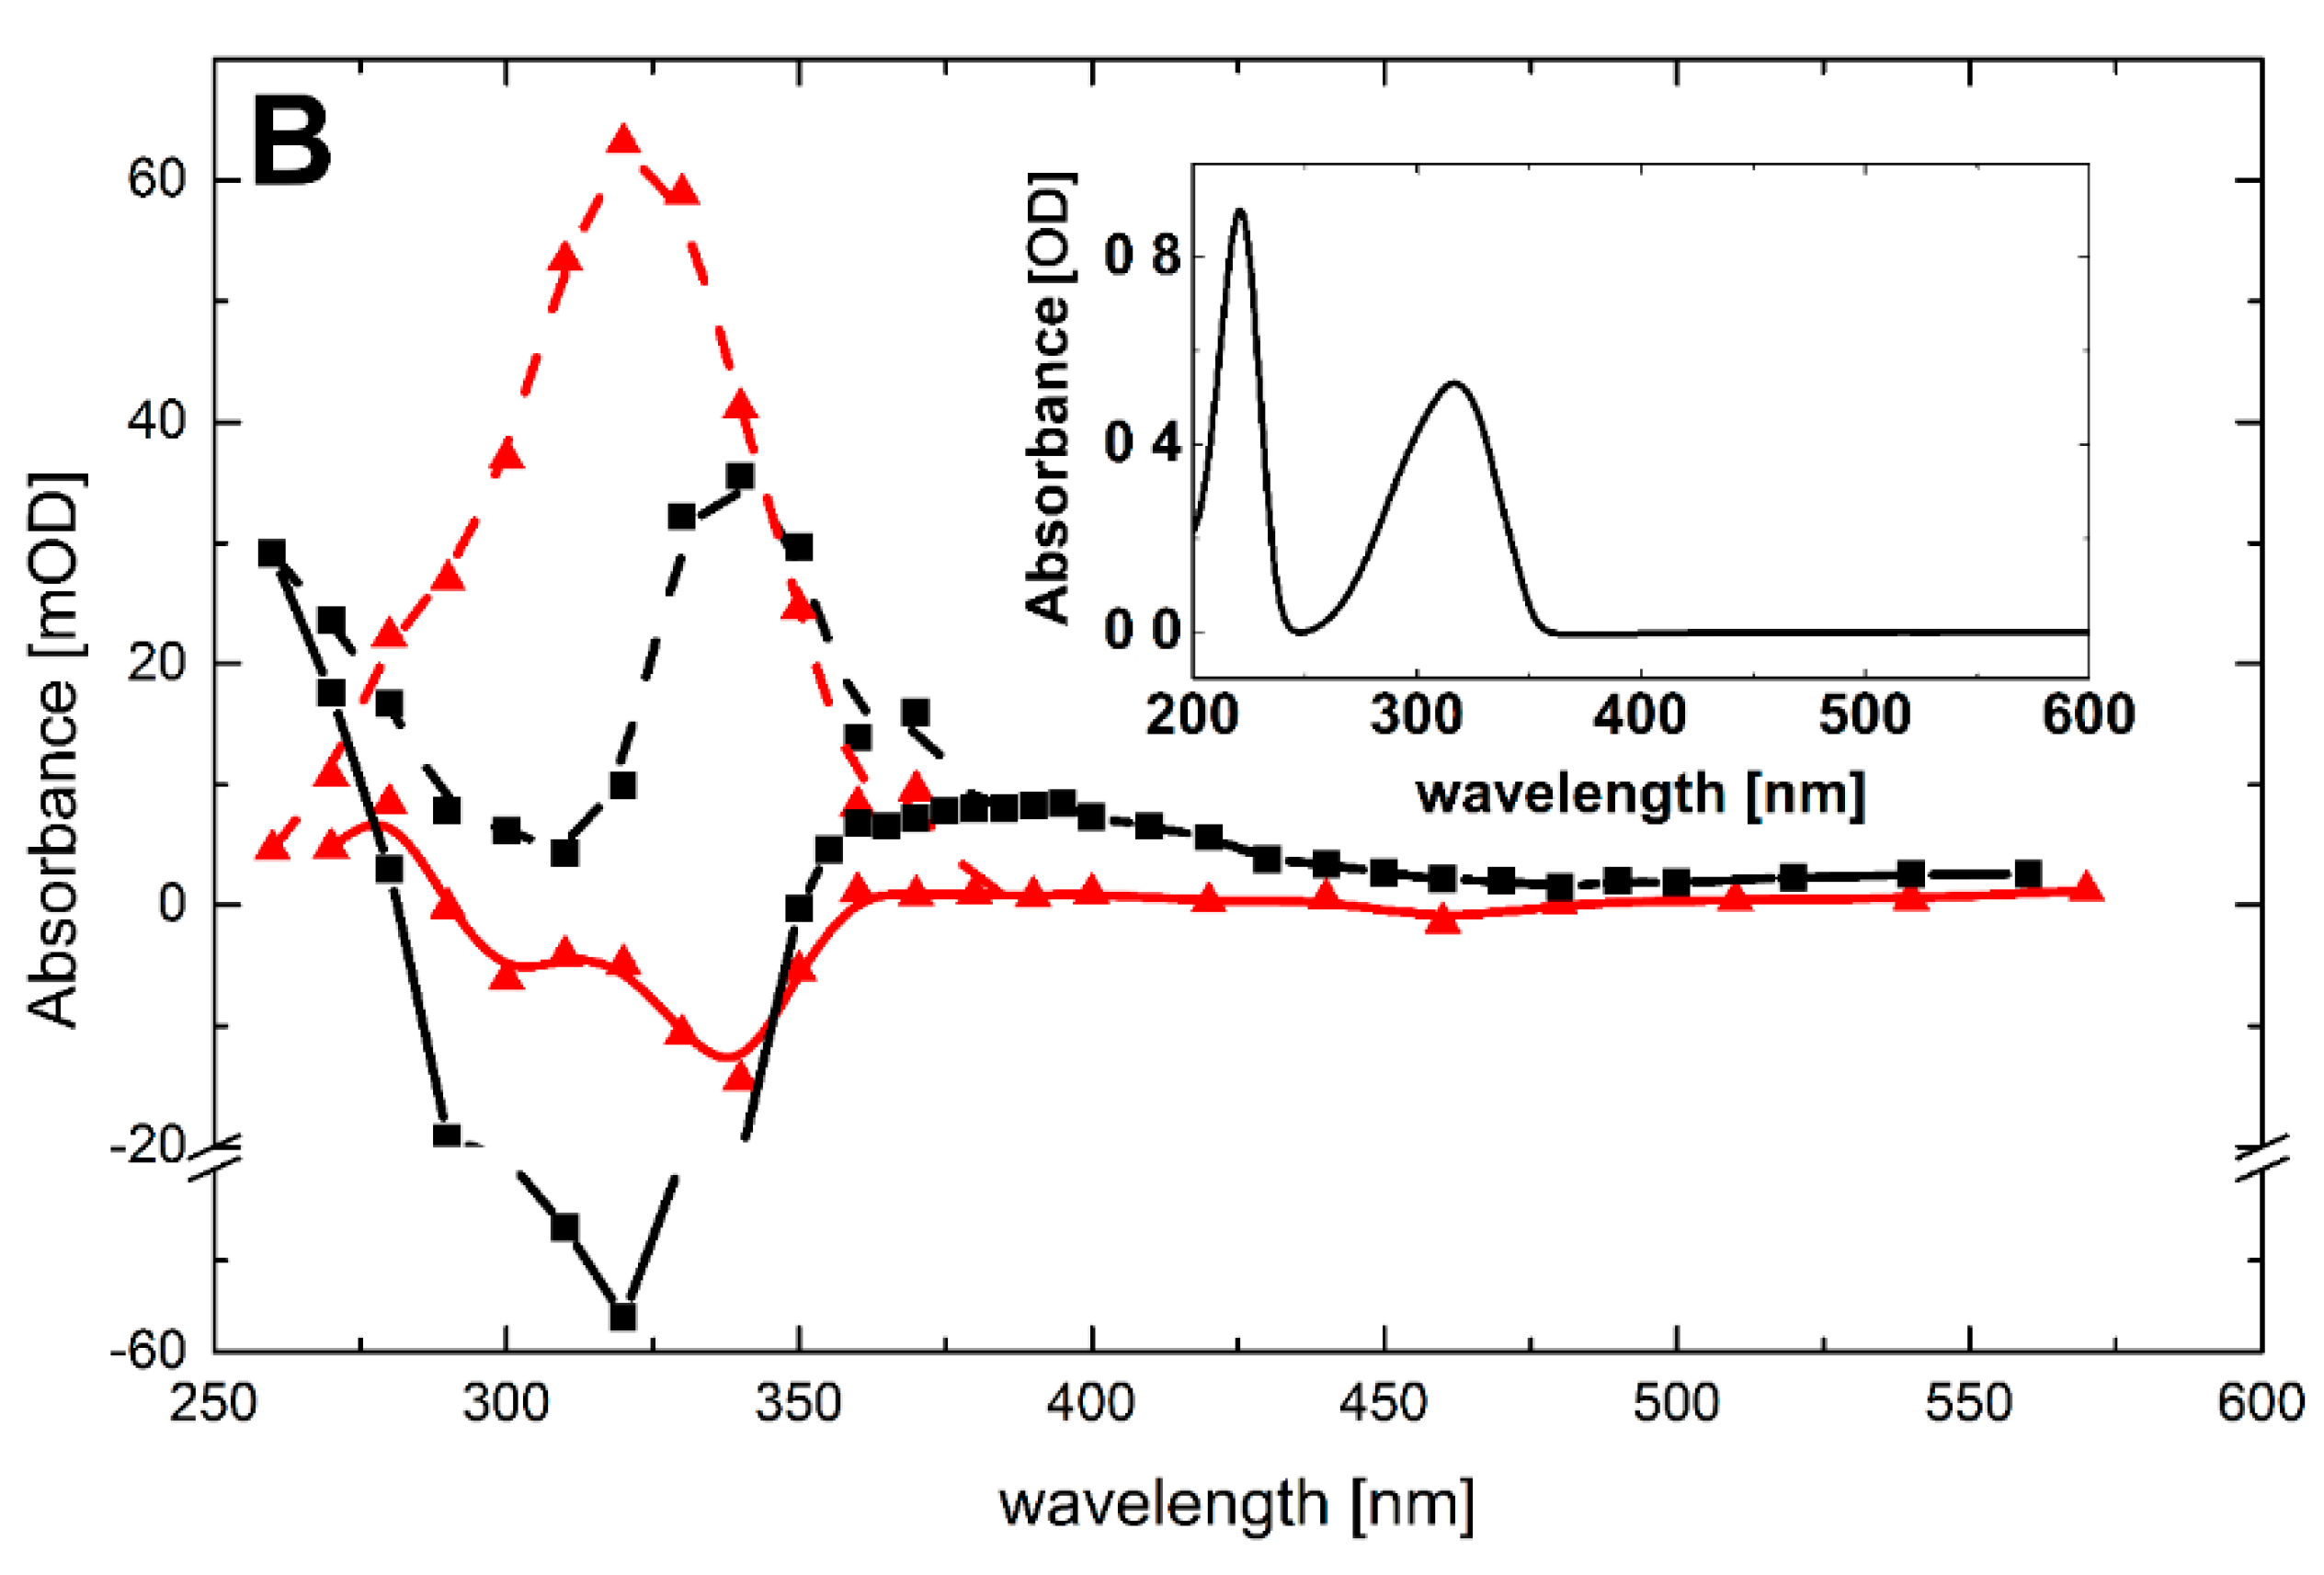
 ); spectrum c, time delay 1.5 ms ( ). Insets: (left) Time profiles representing decays at λ = 270 nm (●) and 390 nm ( ); (right) Plot of the observed pseudo-first-order rate constants of the formation of the 390-nm absorption (kobs) as a function of Pyr concentration at pH 7. Inset of right inset: Time profile representing growth at λ = 390 nm at 0.1 mM concentration of Pyr; (B) Transient absorption spectra uncorrected (solid lines), and corrected for the ground-state absorption (dashed lines) recorded 4 μs after the electron pulse in N2O-saturated aqueous solution at pH 7 and containing 0.1 mM of Pyr, without (■), and with 0.1 M NaN3 ( ). Inset: Ground-state absorption spectrum of Pyr in aqueous solutions at pH 7.
); spectrum c, time delay 1.5 ms ( ). Insets: (left) Time profiles representing decays at λ = 270 nm (●) and 390 nm ( ); (right) Plot of the observed pseudo-first-order rate constants of the formation of the 390-nm absorption (kobs) as a function of Pyr concentration at pH 7. Inset of right inset: Time profile representing growth at λ = 390 nm at 0.1 mM concentration of Pyr; (B) Transient absorption spectra uncorrected (solid lines), and corrected for the ground-state absorption (dashed lines) recorded 4 μs after the electron pulse in N2O-saturated aqueous solution at pH 7 and containing 0.1 mM of Pyr, without (■), and with 0.1 M NaN3 ( ). Inset: Ground-state absorption spectrum of Pyr in aqueous solutions at pH 7.
); spectrum c, time delay 1.5 ms ( ). Insets: (left) Time profiles representing decays at λ = 270 nm (●) and 390 nm ( ); (right) Plot of the observed pseudo-first-order rate constants of the formation of the 390-nm absorption (kobs) as a function of Pyr concentration at pH 7. Inset of right inset: Time profile representing growth at λ = 390 nm at 0.1 mM concentration of Pyr; (B) Transient absorption spectra uncorrected (solid lines), and corrected for the ground-state absorption (dashed lines) recorded 4 μs after the electron pulse in N2O-saturated aqueous solution at pH 7 and containing 0.1 mM of Pyr, without (■), and with 0.1 M NaN3 ( ). Inset: Ground-state absorption spectrum of Pyr in aqueous solutions at pH 7.

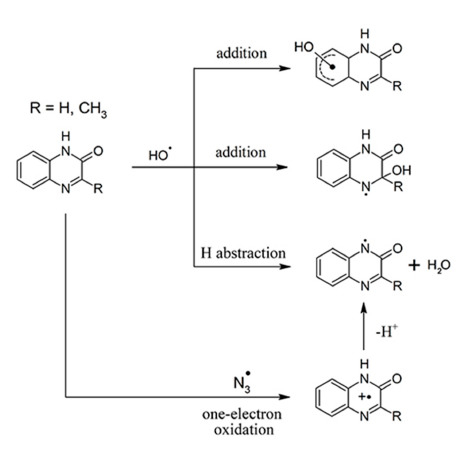
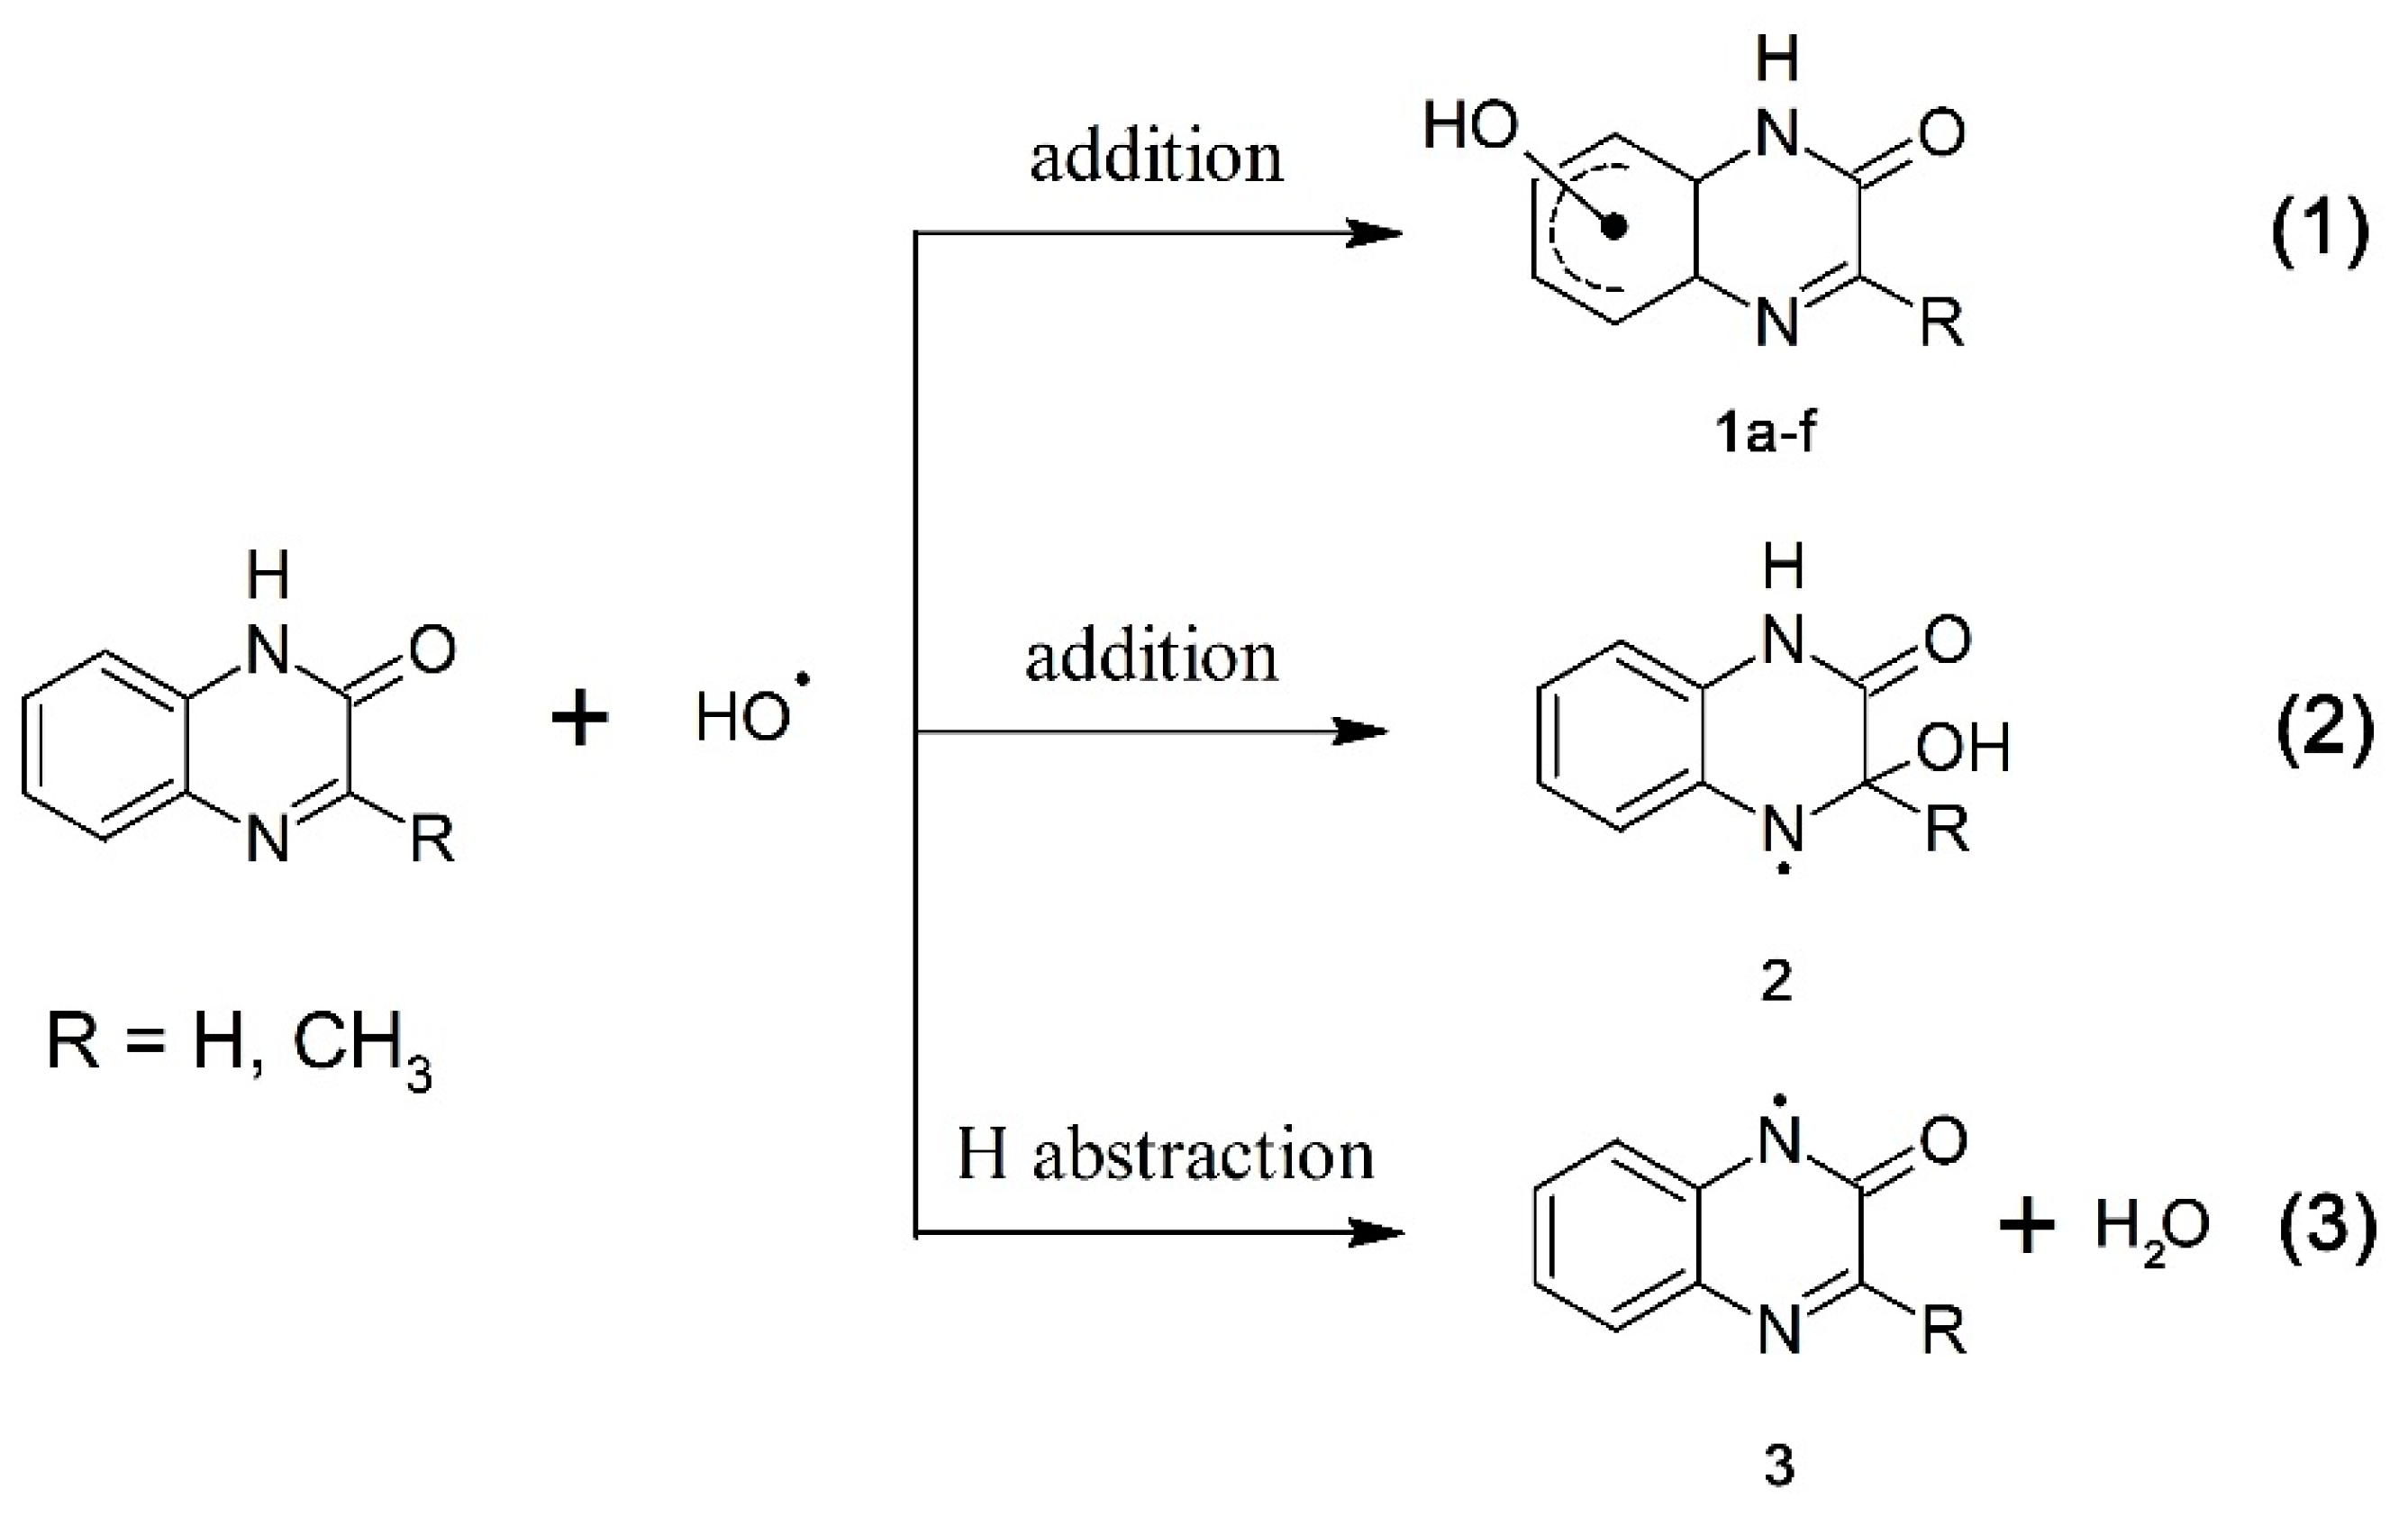
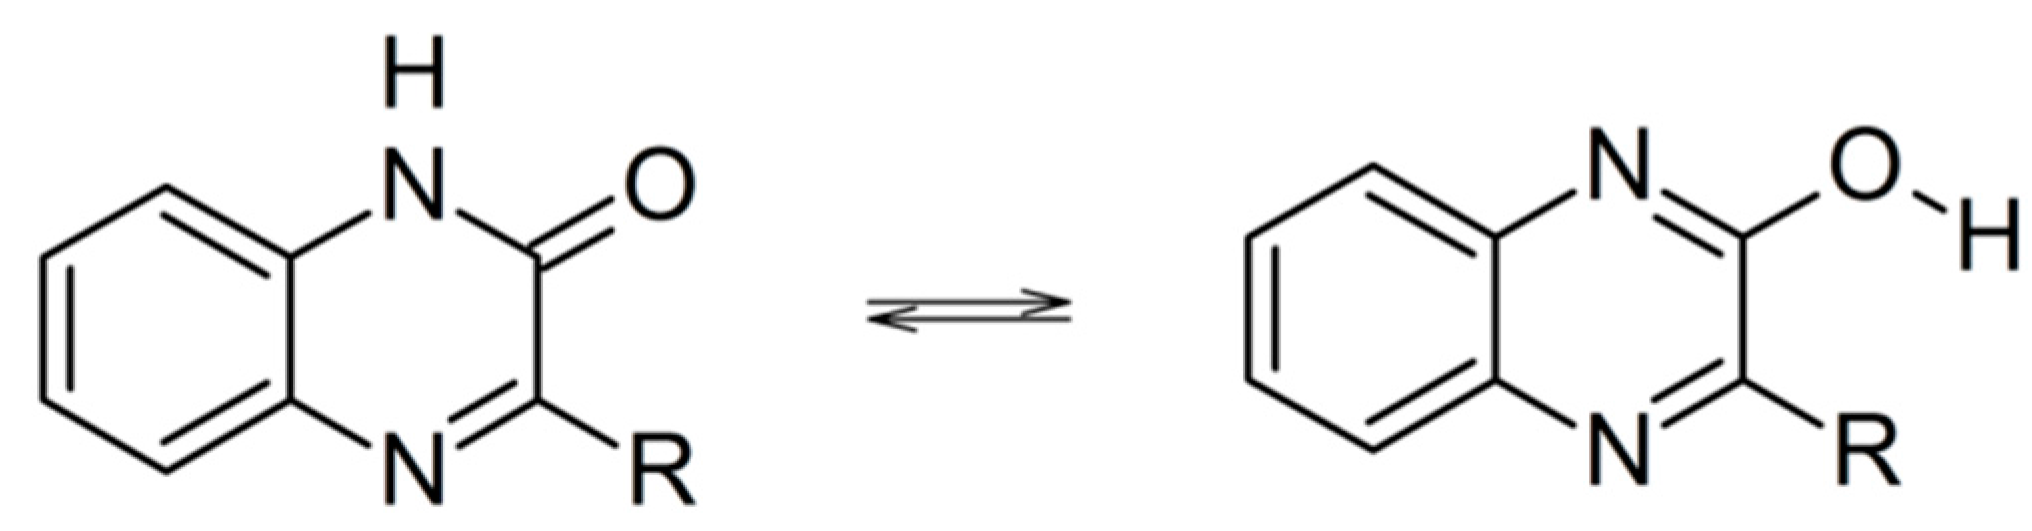
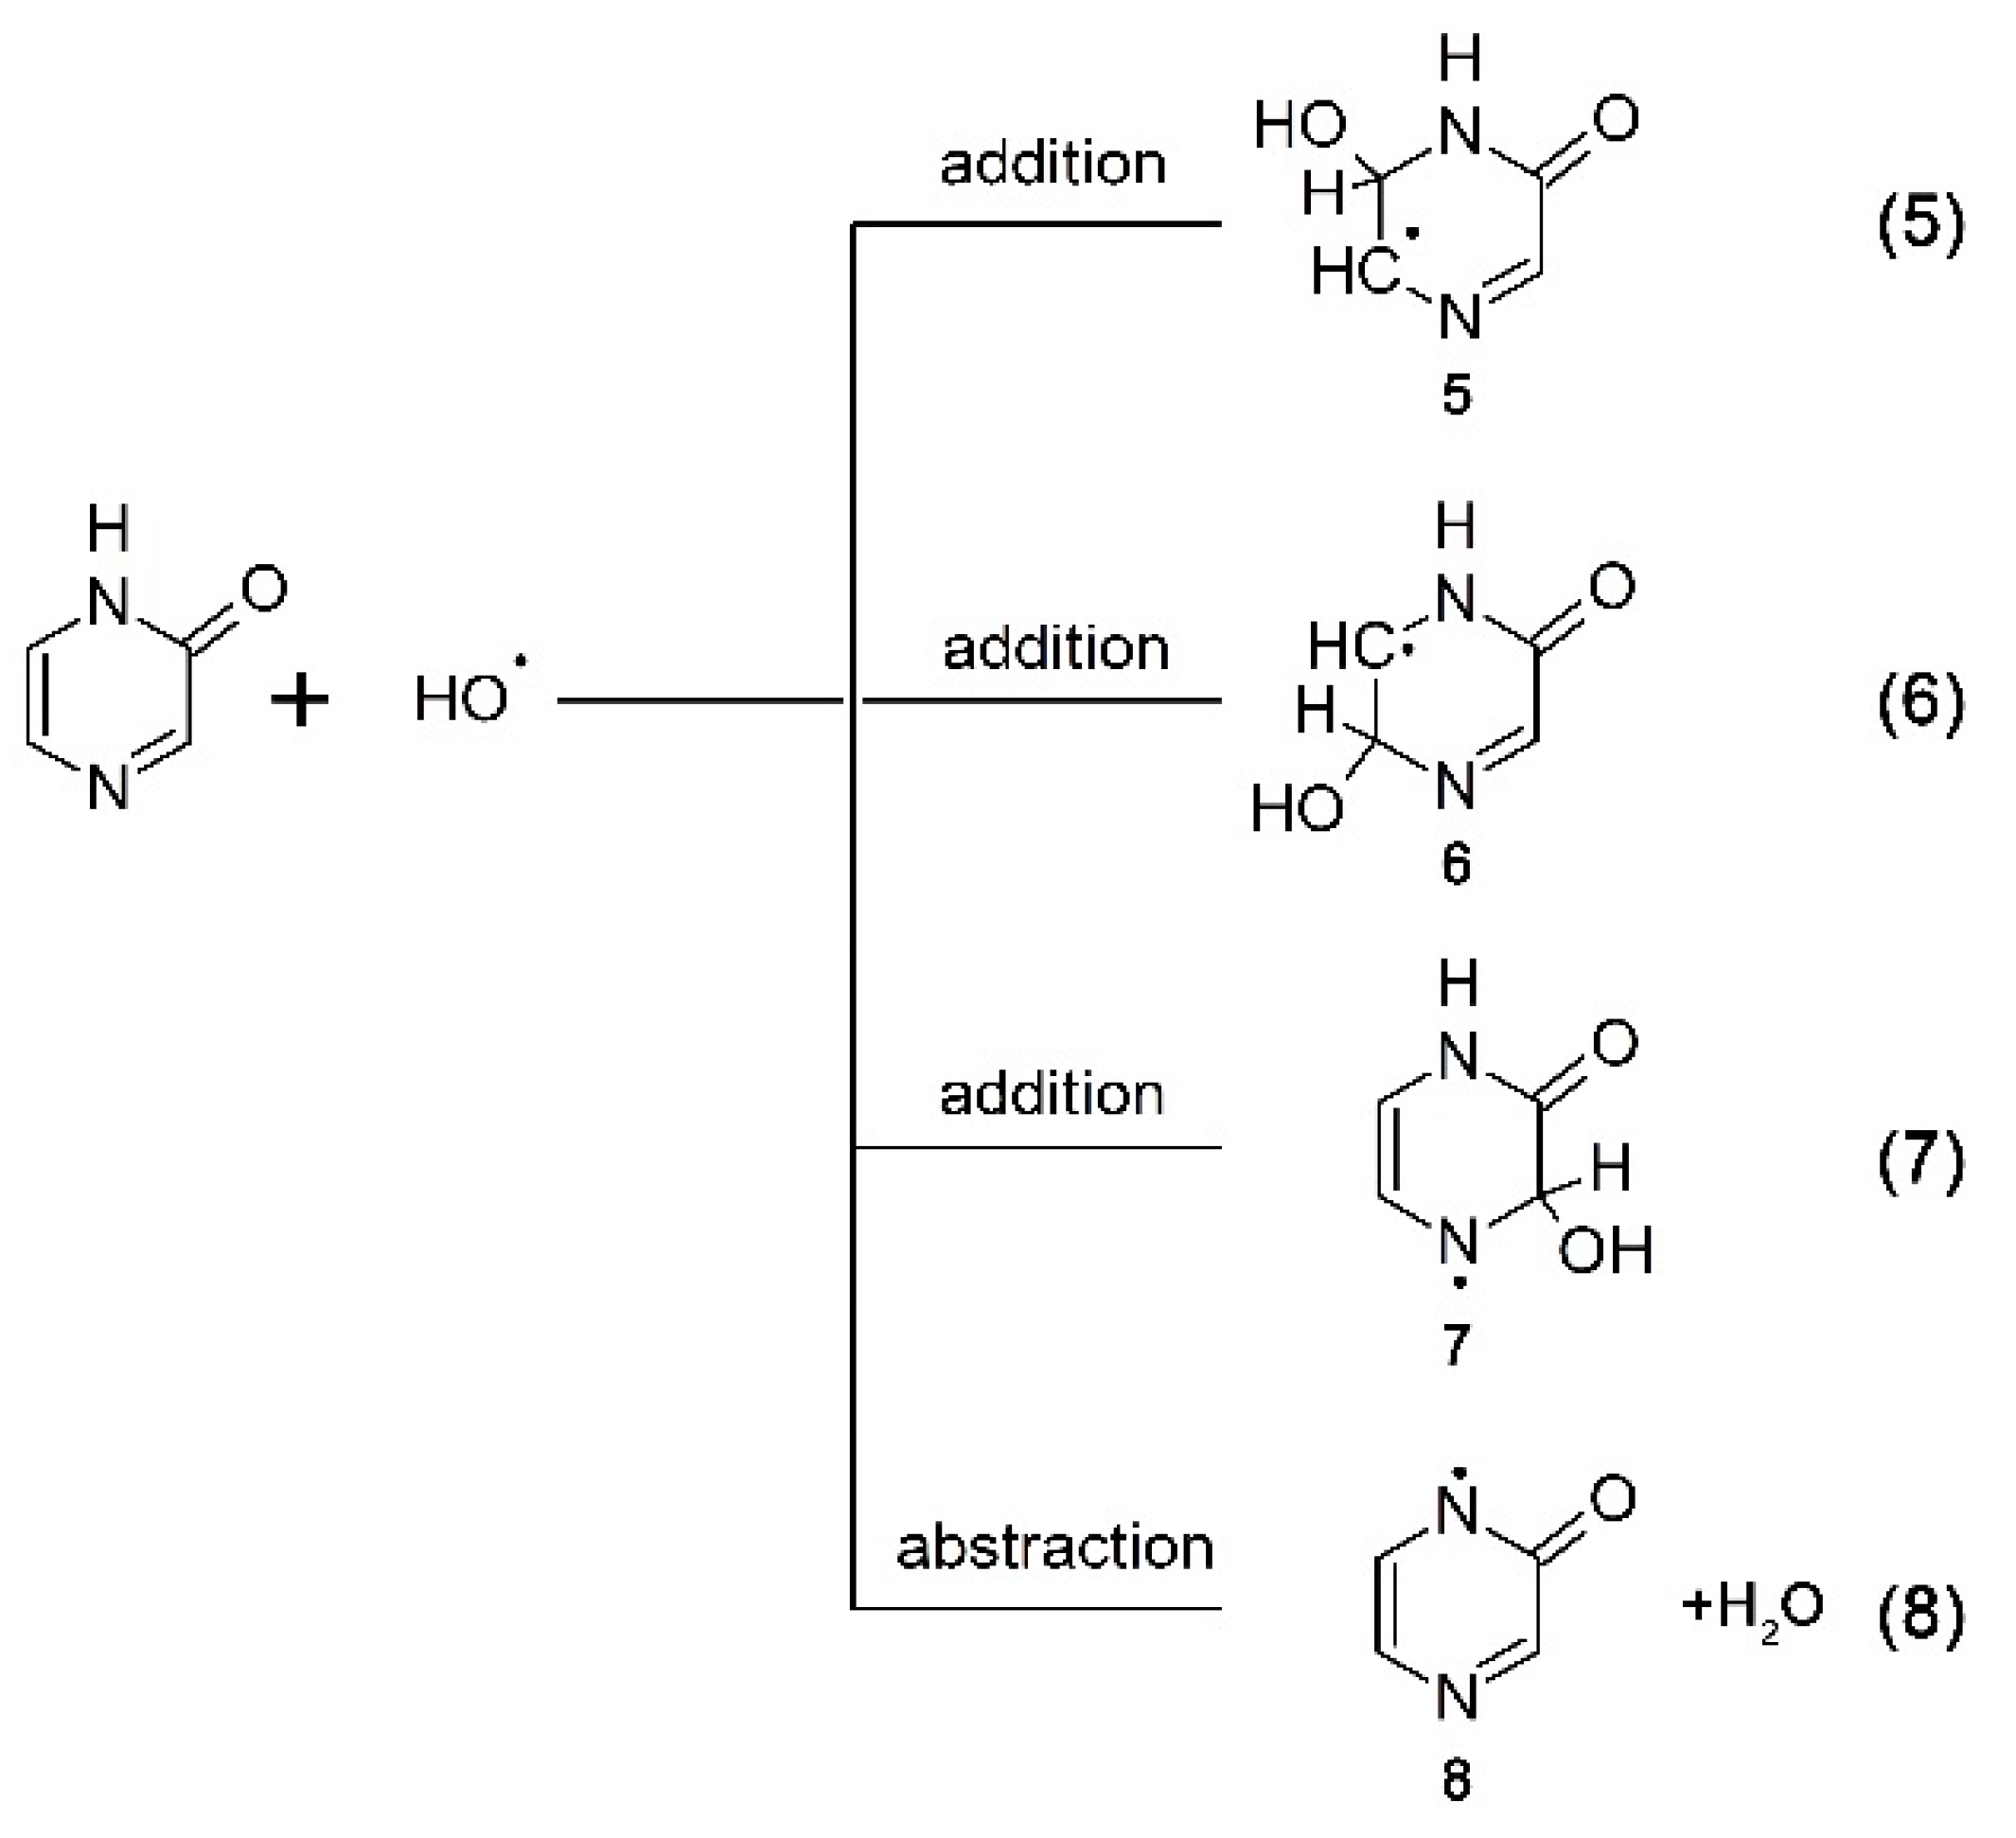
2.1.3.3. Primary Distribution of the •OH Attack on the Quinoxalin-2(1H)-One Molecule
2.1.3.4. OH-Adducts on a Benzene Ring

| Compound | N1 | C2 | O | C3 | N4 | C5 | C6 | C7 | C8 | C9 | C10 |
|---|---|---|---|---|---|---|---|---|---|---|---|
| Q | 0.106 | 0.235 | 0.365 | 0.099 | 0.905 | −0.099 | −0.137 | −0.052 | −0.144 | −0.076 | −0.144 |
| 3-MeQ | 0.105 | 0.225 | 0.361 | 0.132 | 0.019 | −0.018 | −0.138 | −0.047 | −0.147 | −0.069 | −0.126 |
| Compound | C5 | C6 | C7 | C8 |
|---|---|---|---|---|
| Q | −28.49 | −26.19 | −29.30 | −29.92 |
| 3-MeQ | −37.78 | −35.08 | −37.09 | −38.63 |
| Q5OH | Q7OH | 3-MeQ5OH | 3-MeQ7OH | 3-MeQ1N | |||||
|---|---|---|---|---|---|---|---|---|---|
| λ nm | f | λ nm | F | λ nm | f | λ nm | f | λ nm | f |
| 523.5 | 0.029 | 673.6 | 0.020 | 537.6 | 0.032 | 683.0 | 0.038 | 476.7 | 0.023 |
| 421.5 | 0.137 | 635.0 | 0.037 | 420.5 | 0.109 | 638.6 | 0.022 | 465.1 | 0.016 |
| 374.5 | 0.081 | 413.5 | 0.016 | 374.9 | 0.103 | 418.9 | 0.016 | 382.7 | 0.133 |
| 337.7 | 0.134 | 357.3 | 0.081 | 345.0 | 0.157 | 354.9 | 0.081 | 326.0 | 0.062 |
| 302.4 | 0.030 | 322.0 | 0.034 | 304.3 | 0.040 | 323.2 | 0.082 | 324.5 | 0.017 |
| 279.0 | 0.025 | 317.4 | 0.071 | 286.5 | 0.024 | 310.5 | 0.010 | 309.0 | 0.127 |
| 265.0 | 0.017 | 279.3 | 0.040 | 266.2 | 0.020 | 280.6 | 0.025 | 281.1 | 0.011 |
| 231.1 | 0.029 | 277.9 | 0.013 | 241.2 | 0.012 | 268.8 | 0.039 | 248.0 | 0.156 |
| 227.2 | 0.017 | 260.7 | 0.044 | 238.2 | 0.012 | 252.6 | 0.267 | 233.9 | 0.708 |
| 225.6 | 0.017 | 247.3 | 0.253 | 226.7 | 0.015 | 247.7 | 0.166 | 223.4 | 0.135 |
3. Experimental Section
3.1. Materials
3.2. Uv-Vis Spectrophotometry
3.3. Pulse Radiolysis
3.4. γ-Radiolysis
3.5. Spectral Analysis of Time-Resolved Spectra
3.6. Water Radiolysis
3.7. Calculations
4. Conclusions
Acknowledgments
Author Contributions
Conflicts of Interest
References
- Carta, A.; Piras, S.; Loriga, M.; Paglietti, G. Chemistry, biological properties and SAR analysis of quinoxalinones. Mini Rev. Med. Chem. 2006, 6, 1179–1200. [Google Scholar] [CrossRef] [PubMed]
- Olayiwola, G.; Obafemi, C.A.; Taiwo, F.O. Synthesis and neuropharmacological activity of some quinoxalinone derivatives. Afr. J. Biotechnol. 2007, 6, 777–786. [Google Scholar]
- Ajani, O.O.; Obafemi, C.A.; Nwinyi, O.C.; Akinpelu, D.A. Microwave assisted synthesis and antimicrobial activity of 2-quinoxalinone-3-hydrazone derivatives. Bioorg. Med. Chem. 2010, 18, 214–221. [Google Scholar] [CrossRef] [PubMed]
- Sanna, P.; Carta, A.; Loriga, M.; Zanetti, S.; Sechi, L. Synthesis of substituted 2-ethoxycarbonyl- and 2-carboxyquinoxalin-3-ones for evaluation of antimicrobial and anticancer activity. Farmaco 1998, 53, 455–461. [Google Scholar] [CrossRef] [PubMed]
- Sanna, P.; Carta, A.; Loriga, M.; Zanetti, S.; Sechi, L. Preparation and biological evaluation of 6/7-trifluoromethyl(nitro)-, 6,7-difluoro-3-alkyl (aryl)-substituted-quinoxalin-2-ones. Part 3. Farmaco 1999, 54, 169–177. [Google Scholar] [CrossRef]
- El-Sabbagh, O.L.; El-Sadek, M.E.; Lashine, S.M.; Yassin, S.H.; El-Nabtity, S.M. Synthesis of new 2(1H)-quinoxalinone derivatives for antimicrobial and antiinflammatory evaluation. Med. Chem. Res. 2009, 18, 782–797. [Google Scholar] [CrossRef]
- Xu, B.; Sun, Y.; Guo, Y.; Cao, Y.; Yu, T. Synthesis and biological evaluation of N4-(hetero)arylsulfonylquinoxalinones as HIV-1 reverse transcriptase inhibitors. Bioorg. Med. Chem. 2009, 17, 2767–2774. [Google Scholar] [CrossRef] [PubMed]
- Carta, A.; Sanna, P.; Loriga, M.; Setzu, M.G.; La Colla, P.; Loddo, R. Synthesis and evaluation for biological activity of 3-alkyl and 3-halogenoalkyl-quinoxalin-2-ones variously substituted. Part 4. Farmaco 2002, 57, 19–25. [Google Scholar] [CrossRef]
- Ingale, S.J.; Gupta, S.; Upmanyu, N.; Pande, M. Synthesis and biological evaluation of some 4-substituted quinoxalinones. Asian J. Chem. 2007, 19, 3797–3802. [Google Scholar]
- Ulrich, R.G.; Bacon, J.A.; Cramer, C.T.; Petrella, D.K.; Sun, E.L.; Meglasson, M.D.; Holmuhamedov, E. Disruption of mitochondrial activities in rabbit and human hepatocytes by a quinoxalinone anxiolytic and its carboxylic acid metabolite. Toxicology 1998, 131, 33–47. [Google Scholar] [CrossRef] [PubMed]
- Ries, U.J.; Priepke, H.W.M.; Hauel, N.H.; Handschuh, S.; Mihm, G.; Stassen, J.M.; Wienen, W.; Nar, H. Heterocyclic thrombin inhibitors. Part 2: Quinoxalinone derivatives as novel, potent antithrombotic agents. Bioorg. Med. Chem. Lett. 2003, 13, 2297–2302. [Google Scholar]
- Willardsen, J.A.; Dudley, D.A.; Cody, W.L.; Chi, L.G.; McClanahan, T.B.; Mertz, T.E.; Potoczak, R.E.; Narasimhan, L.S.; Holland, D.R.; Rapandalo, S.T.; et al. Design, synthesis, and biological activity of potent, and selective inhibitors of blood coagulation factor Xa. J. Med. Chem. 2004, 47, 4089–4099. [Google Scholar]
- Hirai, H.; Takahashi-Suziki, I.; Shimomura, T.; Fukusawa, K.; Machida, T.; Takaki, T.; Kobayashi, M.; Eguchi, T.; Oki, H.; Arai, T.; et al. Potent anti-tumor activity of a macrocycle-quinoxalinone class pan-Cdk inhibitor in vitro and in vivo. Investig. New Drugs 2011, 29, 534–543. [Google Scholar]
- Koth, E.R.; Anwar, M.A.; Soliman, M.S.; Salama, M.A. Synthesis and reactions of some novel quinoxalines for anticancel evaluation. Phosphorous Sulfur Silicon Relat. Elem. 2007, 182, 1119–1130. [Google Scholar] [CrossRef]
- Lawrence, D.S.; Copper, J.E.; Smith, C.D. Structure-activity studies of substituted quinoxalinones as multiple-drug-resistance antagonists. J. Med. Chem. 2001, 44, 594–601. [Google Scholar] [CrossRef] [PubMed]
- Meyer, E.; Joussef, A.C.; de Souza, L.D.P. Synthesis of new 1,2,4‐ and 1,3,4‐oxadiazole derivatives as potential nonpeptide angiotensin II receptor antagonists. Synth. Commun. 2006, 36, 729–741. [Google Scholar] [CrossRef]
- Mori, Y.; Hirokawa, T.; Aoki, K.; Satomi, H.; Takeda, S.; Aburada, M.; Miyamoto, K. Structure activity relationships of quinoxalin-2-one derivatives as platelet-derived growth factor-β receptor (PDGFβ R) inhibitors, derived from molecular modeling. Chem. Pharm. Bull. 2008, 56, 682–687. [Google Scholar] [CrossRef] [PubMed]
- Ginzinger, W.; Mühlgassner, G.; Arion, V.B.; Jakupec, M.A.; Roller, A.; Galanski, M.; Reithofer, M.; Berger, W.; Keppler, B.K. A SAR study of novel antiproliferative ruthenium and osmium complexes with quinoxalinone ligands in human cancer cell lines. J. Med. Chem. 2012, 55, 3398–3413. [Google Scholar] [CrossRef] [PubMed]
- Gris, J.; Glisoni, R.; Fabian, L.; Fernandez, B.; Moglioni, A.G. Synthesis of potential chemotherapic quinoxalinone derivatives by biocatalysis or microwave-assisted Hinsberg reaction. Tetrahedron Lett. 2008, 49, 1053–1056. [Google Scholar] [CrossRef]
- Dudash, J.; Zhang, Y.Z.; Moore, J.B.; Look, R.; Liang, Y.; Beavers, M.P.; Conway, B.R.; Rybczynski, P.J.; Demarest, K.T. Synthesis and evaluation of 3-anilino-quinoxalinones as glycogen phosphorylase inhibitors. Bioorg. Med. Chem. Lett. 2005, 15, 4790–4793. [Google Scholar] [CrossRef] [PubMed]
- Li, Y.; Zhang, J.; Xu, W.; Zhu, H.; Li, X. Novel matrix metalloproteinase inhibitors derived from quinoxalinone scaffold (Part I). Bioorg. Med. Chem. 2010, 18, 1516–1525. [Google Scholar] [CrossRef] [PubMed]
- Rivera, N.; Marrero-Ponce, Y.; Aran, V.J.; Martinez, C.; Malagon, F. Biological assay of a novel quinoxalinone with antimalarial efficacy on Plasmodium yoelii yoelii. Parasitol. Res. 2013, 112, 1523–1527. [Google Scholar] [CrossRef] [PubMed]
- Denk, D.M.; Heinzl, H.; Franz, P.; Ehrenberger, K. Caroverine in tinnitus treatment.A Placebo-controlled blind study. Acta Oto Laryngol. 1997, 117, 825–830. [Google Scholar] [CrossRef]
- Udilova, N.; Kozlov, A.V.; Bieberschulte, W.; Frei, K.; Ehrenberger, K.; Nohl, K. The antioxidant activity of caroverine. Biochem. Pharmacol. 2003, 65, 59–65. [Google Scholar] [CrossRef] [PubMed]
- Kucybala, Z.; Paczkowski, J. 3-Benzoyl-7-diethylamino-5-methyl-1-phenyl-1H-quinoxalin-2-one: An effective dyeing photoinitiator for free radical polymerization. J. Photochem. Photobiol. A Chem. 1999, 128, 135–138. [Google Scholar] [CrossRef]
- Kucybala, Z.; Pyszka, I.; Paczkowski, J. Development of new dyeing photoinitiators for free radical polymerization based on the 1H-pyrazolo[3,4-b]quinoxaline skeleton. Part 2. J. Chem. Soc. Perkin Trans. 2 2000, 1559–1567. [Google Scholar] [CrossRef]
- Nishio, T. Photochemical reactions of quinoxalin-2-ones and related compounds. J. Chem. Soc. Perkin Trans. 1 1990, 565–570. [Google Scholar] [CrossRef]
- Nishio, T. The (2 + 2) photocycloaddition of the carbon-nitrogen double bond of quinoxalin-2(1H)-ones to electron-deficient olefins. J. Org. Chem. 1984, 49, 827–832. [Google Scholar] [CrossRef]
- Nishio, T. Photocycloaddition of quinoxaline-2(1H)-thiones to alkenes. Helv. Chim. Acta 1992, 75, 487–492. [Google Scholar] [CrossRef]
- Nishio, T.; Kashima, C. Photochemistry of nitrogen-containing six-membered heterocycles conjugated with carbonyl. Rev. Heteroat. Chem. 1995, 13, 149–177. [Google Scholar]
- Nishio, T.; Okuda, N. Photoreactions of isoindoline-1-thiones with alkenes: Unusual formation of tricyclic isoindolines. J. Org. Chem. 1992, 57, 4000–4005. [Google Scholar] [CrossRef]
- De la Fuente, J.R.; Canete, A.; Saitz, C.; Jullian, C. Photoreduction of 3-phenylquinoxalin-2-ones by amines. Transient-absorption and semiempirical quantum-chemical studies. J. Phys. Chem. A 2002, 106, 7113–7120. [Google Scholar]
- De la Fuente, J.R.; Canete, A.; Zanocco, A.L.; Saitz, C.; Jullian, C. Formal hydride transfer mechanism for photoreduction of 3-phenylquinoxalin-2-ones by amines. Association of 3-phenylquinoxalin-2-one with aliphatic amines. J. Org. Chem. 2000, 65, 7949–7958. [Google Scholar]
- De la Fuente, J.R.; Canete, A.; Jullian, C.; Saitz, C.; Aliaga, C. Unexpected imidazoquinoxalinone annulation products in the photoinitiated reaction of substituted-3-methyl-quinoxalin-2-ones with N-phenylglycine. Photochem. Photobiol. 2013, 89, 1335–1345. [Google Scholar] [CrossRef] [PubMed]
- Zimpl, M.; Skopalova, J.; Jirovsky, D.; Bartak, P.; Navratil, T.; Sedonikova, J.; Kotoucek, M. Electrochemical behavior of quinoxalin-2-one derivatives at mercury electrodes and its analytical use. Sci. World J. 2012, 409378. [Google Scholar] [CrossRef]
- Stepien, A.; Grabowski, M.J.; Cygler, M.; Wajsman, E. The crystal and molecular structure of 2-hydroxyquinoxaline. Acta Crystallogr. 1976, 32, 2048–2050. [Google Scholar] [CrossRef]
- Gerega, A.; Lapinski, L.; Nowak, M.J.; Furmanchuk, A.; Leszczynski, J. Systematic effect of benzo-annelation on oxo-hydroxy tautomerism of heterocyclic compounds. Experimental matrix-isolation and theoretical studies. J. Phys. Chem. A 2007, 111, 4934–4943. [Google Scholar]
- Graff, M.; Dobrowolski, J.C. On tautomerism of diazinones. Comput. Theor. Chem. 2013, 1026, 55–64. [Google Scholar]
- Albert, A.; Phillips, J.N. Ionization constants of heterocyclic substances. Part II. Hydroxy-derivatives of nitrogenous six-membered ring-compounds. J. Chem. Soc. 1956, 1294–1304. [Google Scholar] [CrossRef]
- Cheeseman, G.W.H. Quinoxalines and related compounds. Part IV. The fine structure of the 2- and 3-hydroxyquinoxalines and 2-amino and 2-mercaptoquinoxaline. J. Chem. Soc. 1958, 108–113. [Google Scholar] [CrossRef]
- Alfassi, Z.B.; Schuler, R.H. Reaction of azide radicals with aromatic compounds. Azide as a selective oxidant. J. Phys. Chem. 1985, 89, 3359–3363. [Google Scholar]
- Wardman, P. The reduction potentials of one-electron couples involving free radicals in aqueous solution. J. Phys. Chem. Ref. Data 1989, 18, 1637–1755. [Google Scholar] [CrossRef]
- Surendra Babu, N.; Tedese, S.; Lelisho, T.A. Computational and electrochemical studies on the redox reaction of quinoxalin-2(H)-one and its derivatives in aqueous solution. J. Chem. Pharm. Res. 2013, 5, 61–69. [Google Scholar]
- Buxton, G.V.; Greenstock, C.L.; Helman, W.P.; Ross, A.B. Critical review of rate constants for reactions of hydrated electrons, hydrogen atoms and hydroxyl radicals (•OH/O•–) in aqueous solution. J. Phys. Chem. Ref. Data 1988, 17, 513–886. [Google Scholar] [CrossRef]
- Bobrowski, K. Free radicals in chemistry, biology and medicine: Contribution of radiation chemistry. Nukleonika 2005, 50 (Suppl. S3), S67–S76. [Google Scholar]
- Schuler, R.H.; Patterson, L.K.; Janata, E. Yield for the scavenging of hydroxyl radicals in the radiolysis of nitrous oxide-saturated aqueous solutions. J. Phys. Chem. 1980, 84, 2088–2090. [Google Scholar] [CrossRef]
- Buxton, G.V. An overview of the radiation chemistry of liquids. In Radiation Chemistry: From Basics to Applications in Material and Life Sciences; Spotheim-Maurizot, M., Mostafavi, M., Douki, T., Belloni, J., Eds.; EDP Sciences: Les Ulis, France, 2008; pp. 3–16. [Google Scholar]
- Janata, E.; Schuler, R.H. Rate constant for scavenging eaq– in N2O-saturated solutions. J. Phys. Chem. 1982, 86, 2078–2084. [Google Scholar] [CrossRef]
- Sample Availability: Samples of the compounds (Q and Pyr) are commercially available (see Section 3.1. Materials). Samples of 3-MeQ are available from the authors.
© 2014 by the authors. Licensee MDPI, Basel, Switzerland. This article is an open access article distributed under the terms and conditions of the Creative Commons Attribution license ( http://creativecommons.org/licenses/by/4.0/).
Share and Cite
Skotnicki, K.; De la Fuente, J.R.; Cañete, A.; Bobrowski, K. Spectral and Kinetic Properties of Radicals Derived from Oxidation of Quinoxalin-2-One and Its Methyl Derivative. Molecules 2014, 19, 19152-19171. https://doi.org/10.3390/molecules191119152
Skotnicki K, De la Fuente JR, Cañete A, Bobrowski K. Spectral and Kinetic Properties of Radicals Derived from Oxidation of Quinoxalin-2-One and Its Methyl Derivative. Molecules. 2014; 19(11):19152-19171. https://doi.org/10.3390/molecules191119152
Chicago/Turabian StyleSkotnicki, Konrad, Julio R. De la Fuente, Alvaro Cañete, and Krzysztof Bobrowski. 2014. "Spectral and Kinetic Properties of Radicals Derived from Oxidation of Quinoxalin-2-One and Its Methyl Derivative" Molecules 19, no. 11: 19152-19171. https://doi.org/10.3390/molecules191119152
APA StyleSkotnicki, K., De la Fuente, J. R., Cañete, A., & Bobrowski, K. (2014). Spectral and Kinetic Properties of Radicals Derived from Oxidation of Quinoxalin-2-One and Its Methyl Derivative. Molecules, 19(11), 19152-19171. https://doi.org/10.3390/molecules191119152