Article

Removing Tannins from Medicinal Plant Extracts Using an Alkaline Ethanol Precipitation Process: A Case Study of Danshen Injection

Pharmaceutical Informatics Institute, College of Pharmaceutical Sciences, Zhejiang University, Hangzhou 310058, China
*
Author to whom correspondence should be addressed.
Molecules 2014, 19(11), 18705-18720; https://doi.org/10.3390/molecules191118705
Submission received: 21 August 2014 / Revised: 12 October 2014 / Accepted: 7 November 2014 / Published: 14 November 2014
(This article belongs to the Section Natural Products Chemistry)

Abstract

:
The alkaline ethanol precipitation process is investigated as an example of a technique for the removal of tannins extracted from Salviae miltiorrhizae Radix et Rhizoma for the manufacture of Danshen injection. More than 90% of the tannins can be removed. However, the recoveries of danshensu, rosmarinic acid, and salvianolic acid B were less than 60%. Total tannin removal increased as the refrigeration temperature decreased or the amount of NaOH solution added increased. Phenolic compound recoveries increased as refrigeration temperature increased or the amount of NaOH solution added decreased. When operated at a low refrigeration temperature, a relative high separation selectivity can be realized. Phenolic compound losses and tannin removal were mainly caused by precipitation. The formation of phenol salts, whose solubility is small in the mixture of ethanol and water used, is probably the reason for the precipitation. A model considering dissociation equilibrium and dissolution equilibrium was established. Satisfactory correlation results were obtained for phenolic compound recoveries and total tannin removal. Two important parameters in the model, which are the water content and pH value of alkaline supernatant, are suggested to be monitored and controlled to obtain high batch-to-batch consistency.

1. Introduction

Tannins, polyphenolic compounds with relative large molecular weight, widely exist in medicinal plants and are considered to have antioxidant properties. However, the presence of tannins in botanical extract injections may cause the swelling and redness at the injection site, cardiac arrhythmia, and anaphylactic shock [1,2,3], therefore they are considered as toxic impurities in botanical injections [4], making the removal of tannins matter of significant concern in the production of botanical injections.
Tannins can be removed by alkaline ethanol precipitation, electrochemical oxidation [5,6], catabolic enzyme reaction [7], electroprecipitation [8], or adsorption [4,9,10,11,12]. Alkaline ethanol precipitation is a traditional method used in the manufacture of botanical injections, such as Danshen injection and Guanxinning injection. It can be realized by simply adding NaOH solution to the supernatant obtained using an ethanol precipitation process. The operation is easy and the solvent is safe. Comparison of tannin contents of Guanxinning injections manufactured using and without using alkaline ethanol precipitation process shows that the former is much lower than the latter [13]. Recently, the ethanol precipitation process dealing with botanical extracts has gained much attention because of its wide usage in the traditional Chinese medicine and food industries [14,15,16,17,18,19], but research on the alkaline ethanol precipitation process is very limited. The mechanism of tannin removal has not been verified and the effects of different factors on the active constituents in botanical extracts are not clear.
The investigation on the alkaline ethanol precipitation process can improve pharmaceutical process understanding, and further help implement the concept of Quality by Design (QbD) to improve drug quality control [20]. Therefore, the alkaline ethanol precipitation process in the manufacture of Danshen injection, as seen in Figure 1, was investigated as an example in this work.
Figure 1. Schematic diagram of the alkaline ethanol precipitation process.
Molecules 19 18705 g001
Danshen injection is a botanical injection made from Salviae miltiorrhizae Radix et Rhizoma (Danshen in Chinese). It is clinically used for the treatment of coronary artery disease and angina pectoris [21]. According to the pharmacology studies, phenolic compounds such as danshensu (DSS), protocatechuic aldehyde (PA), rosmarinic acid (RA), and salvianolic acid B (SaB) are considered the active constituents of Danshen injection [22,23,24,25,26]. Their structures are shown in Figure 2.
Figure 2. Structural formulae of some active components of Daishen [27].
Molecules 19 18705 g002
In this work, the effects of four factors of the alkaline ethanol precipitation process, including refrigeration temperature, the amount of ethanol added, the amount of alkali added, and refrigeration time were investigated. Phenolic compound contents and total tannin content in the alkaline supernatants were determined. The recoveries of phenolic compounds and the removal of total tannin were calculated. The mechanisms of phenolic compound loss and tannin removal were discussed. A mathematical model based on dissociation equilibrium and dissolution equilibrium was established to correlate the experimental data.

2. Results and Discussion

2.1. Composition of the Concentrated Supernatant

Concentrated supernatant is the material of the alkaline ethanol precipitation process, as seen in Figure 1. The contents of phenolic compounds, total tannin, dry matter, and water content in the concentrated supernatant are listed in Table 1. Dry matter in the concentrated supernatant was mainly composed of phenolic compounds and saccharides [17]. DSS content was higher than any other phenolic compound content in the concentrated supernatant. The sum of four phenolic compounds was 59.5 mg/g, which was 10.0% of dry matter. The mass ratio of total active constituent and total tannin (RACTT) value of the concentrated supernatant was 10.4.
Table 1. Composition of the concentrated supernatant
CompositionContent (mg/g)CompositionContent (mg/g)
Dry matter593.7Water content365.1
DSS27.2PA4.18
RA5.02SaB23.1
Total tannin5.73

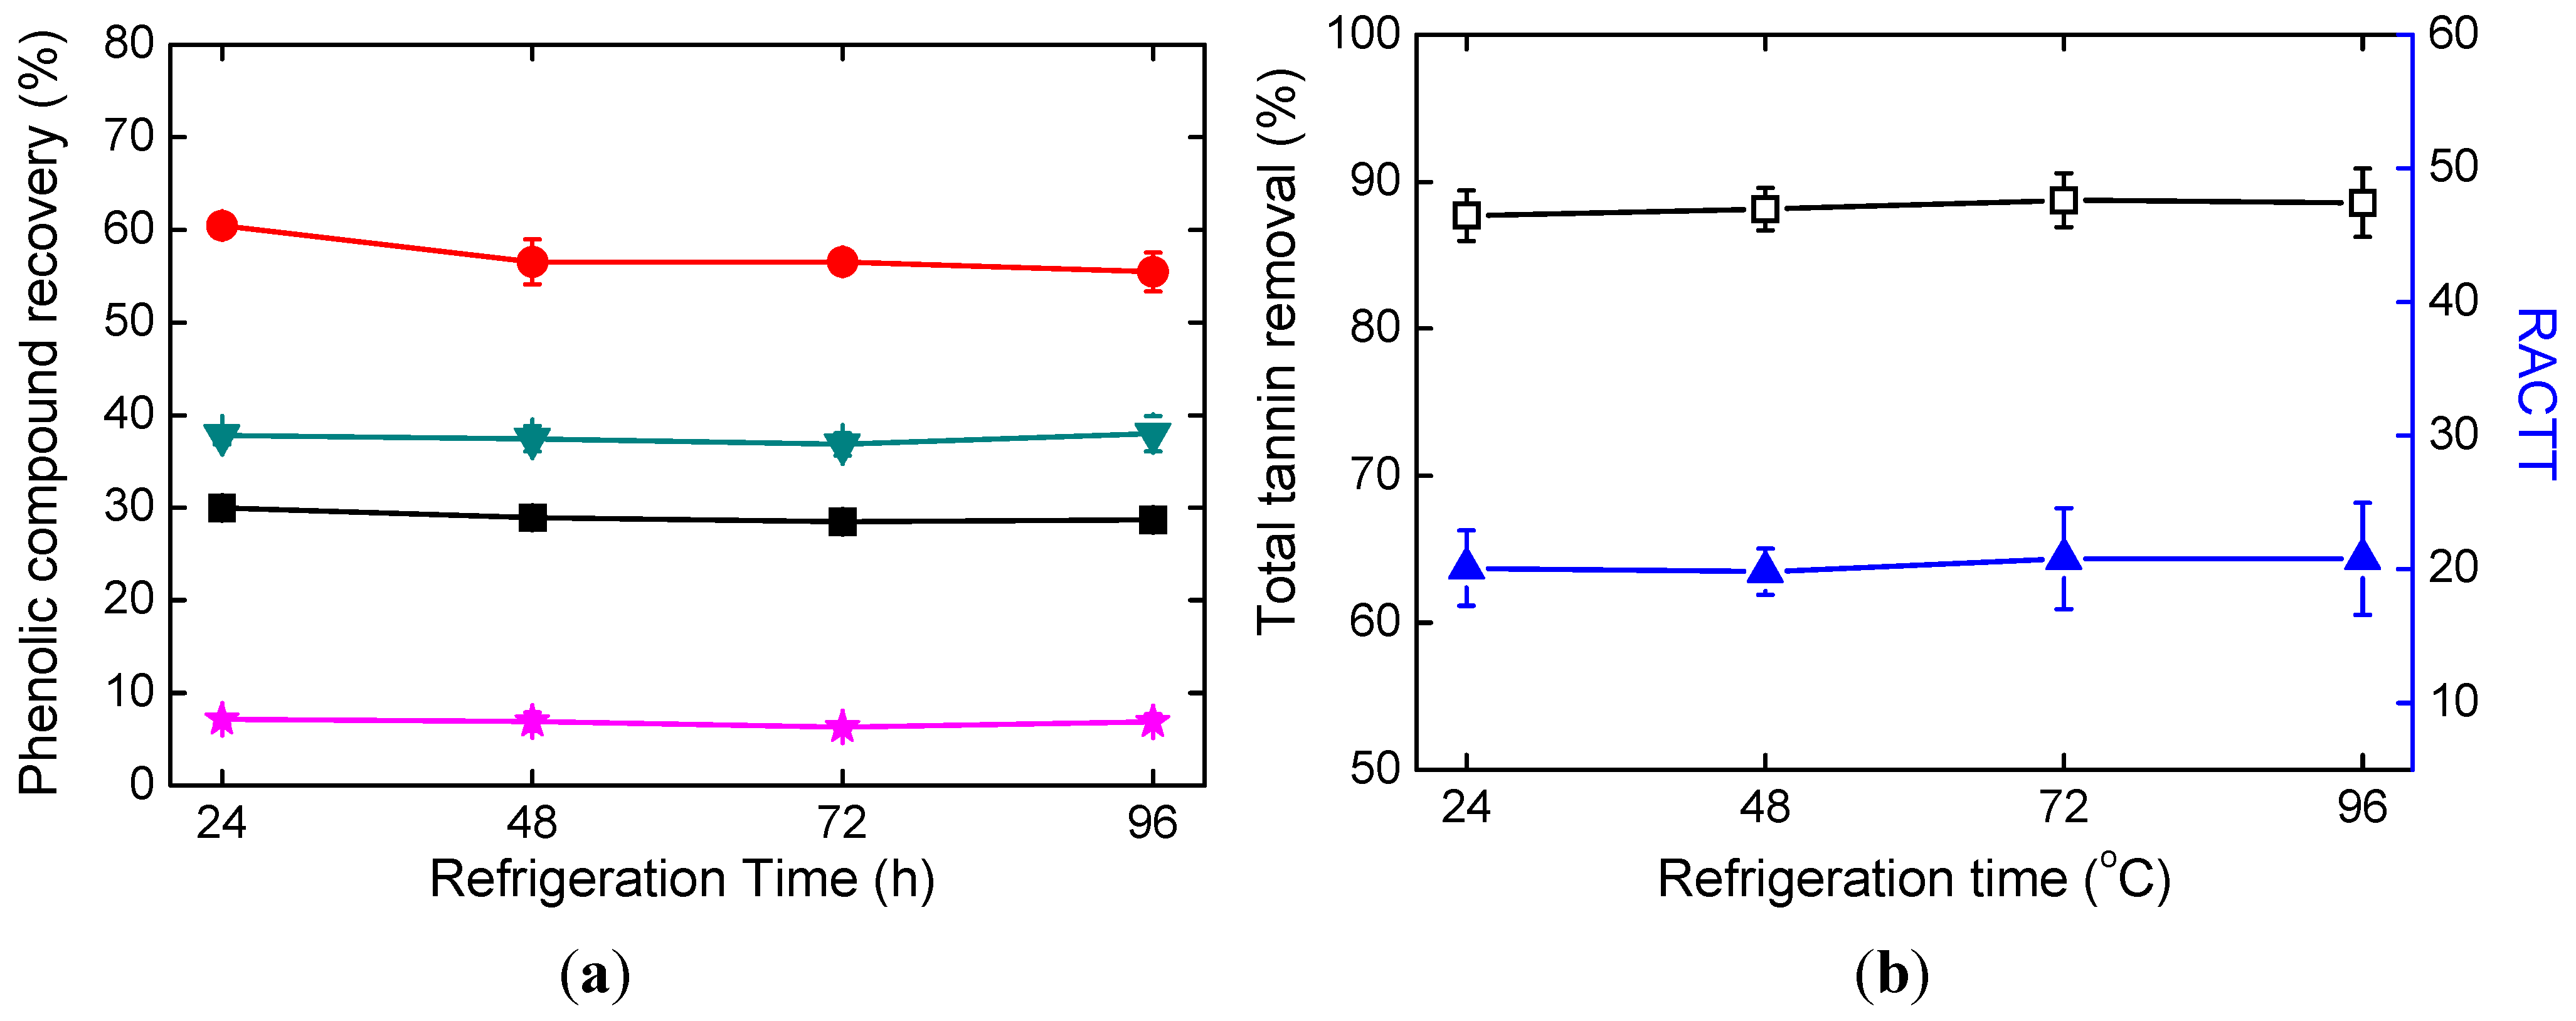
2.2. Effects of Refrigeration Time

According to Figure 3a, refrigeration time showed little effects on DSS recovery, RA recovery, SaB recovery, and total tannin removal (TTR).
Figure 3. Effects of refrigeration time. (a) Phenolic compound recoveries; (b) Total tannin removal and RACTT values.
Molecules 19 18705 g003
n = 3; ■, DSS; ●, PA; ▼, RA; ★, SaB; □, Total tannin removal; ▲, RACTT.
In Table 2, the corresponding p values are higher than 0.05. The recoveries of DSS and RA were less than 40%. SaB recovery was less than 10%. It can be concluded that serious losses of active constituents were observed. TTR and RACTT values changed little as refrigeration time increased, as seen in Figure 3b. RACTT values were larger than that of the concentrated supernatant, which indicates that drug safety was improved.
Table 2. P values obtained with ANOVA method.
ParametersRefrigeration TimeRefrigeration TemperatureEthanol AmountNaOH Solution Amount
TTR0.8990.001 a0.000 a0.000 a
PCRDSS0.2450.000 a0.000 a0.000 a
PCRPA0.0300.000 a0.002 a0.000 a
PCRRA0.7690.001 a0.000 a0.000 a
PCRSaB0.5670.000 a0.000 a0.000 a
RECTT0.9750.006 a0.1560.003 a
a p-value less than 0.01.

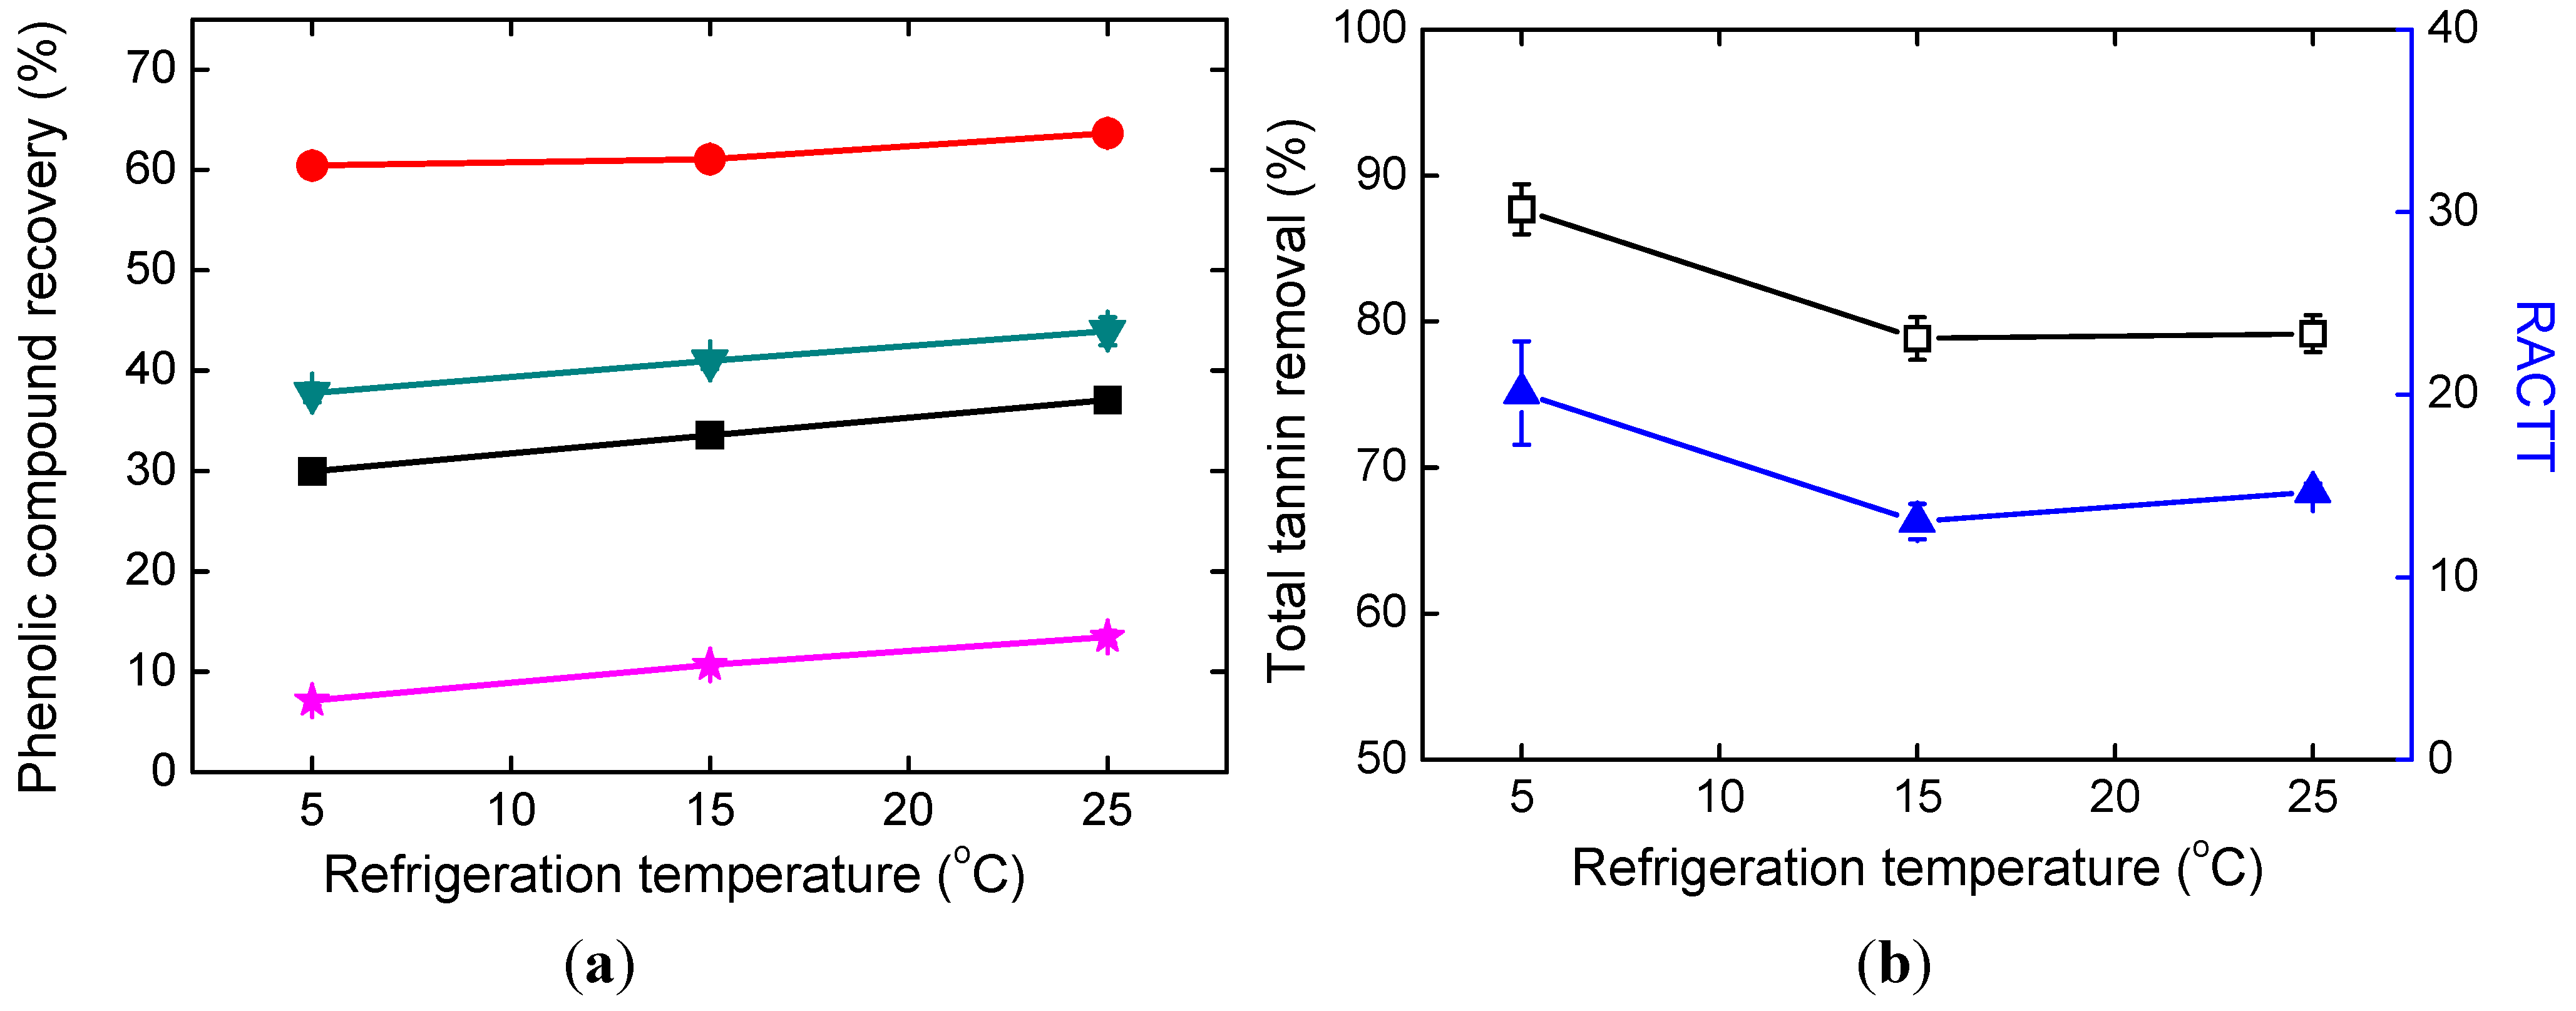
2.3. Effects of Refrigeration Temperature

Refrigeration temperature significantly affected PCR and TTR with p values less than 0.01, as seen in Table 2. In Figure 4a, the recoveries of all the four phenolic compounds of DSS, PA, RA, and SaB slightly increased as refrigeration temperature increased. Higher total tannin removal and higher RACTT values were obtained when the refrigeration temperature was 5 °C, as seen in Figure 4b. Comparing with that of the concentrated supernatant, the RACTT value increased more at 5 °C. Therefore lower temperature is favored in the alkaline ethanol precipitation.
Figure 4. Effects of refrigeration temperature. (a) Phenolic compound recoveries; (b) Total tannin removal and RACTT values.
Molecules 19 18705 g004
n = 3; ■, DSS; ●, PA; ▼, RA; ★, SaB; □, Total tannin removal; ▲, RACTT.

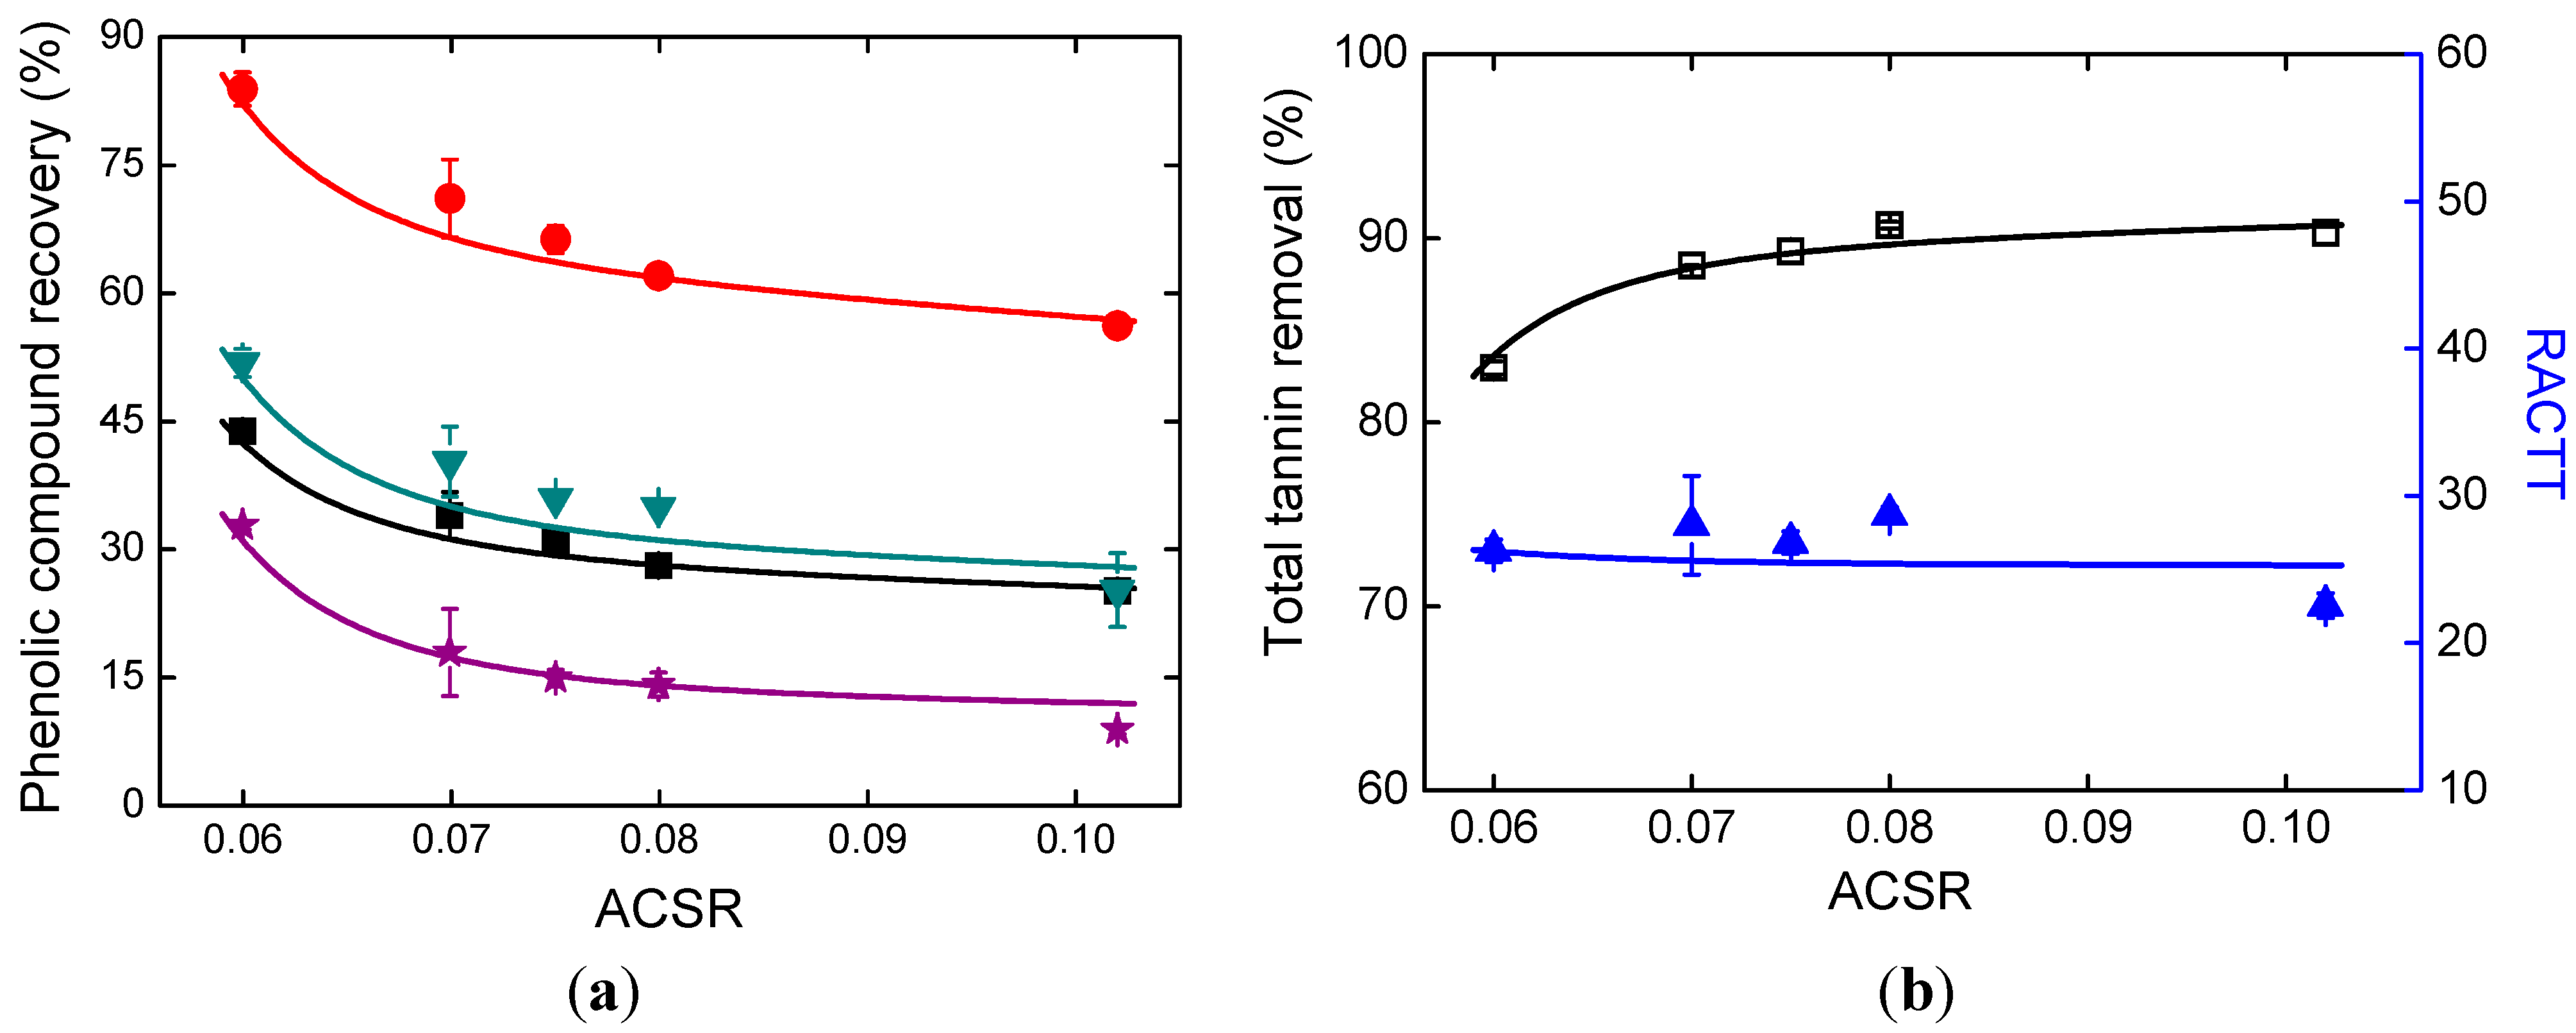
2.4. Effects of Alkali Addition

The amount of NaOH solution added is also a significant factor for the alkaline ethanol precipitation process. All the p values are less than 0.01 in Table 2. In Figure 5a, ACSR refers to the mass ratio of NaOH solution and the concentrated supernatant. The recoveries of all the four phenolic compounds decreased as the amount of NaOH solution added increased. PA recovery was higher than that of any other phenolic acids. SaB, which is a dicarboxylic acid, showed the lowest recovery. Though more phenolic compounds were lost when the amount of NaOH solution added increased, RACTT values were higher than 20, as shown in Figure 5b. This should be attributed to the increasing removal of tannins. In Figure 5b, the tannin removal values were more than 80% and increased remarkably as the amount of NaOH solution added increased.
Figure 5. Effects of alkali addition. (a) Phenolic compound recoveries; (b) Total tannin removal and RACTT values.
Molecules 19 18705 g005
n = 3; ■, DSS; ●, PA; ▼, RA; ★, SaB; □, Total tannin removal; ▲, RACTT; Solid lines, calculation results.

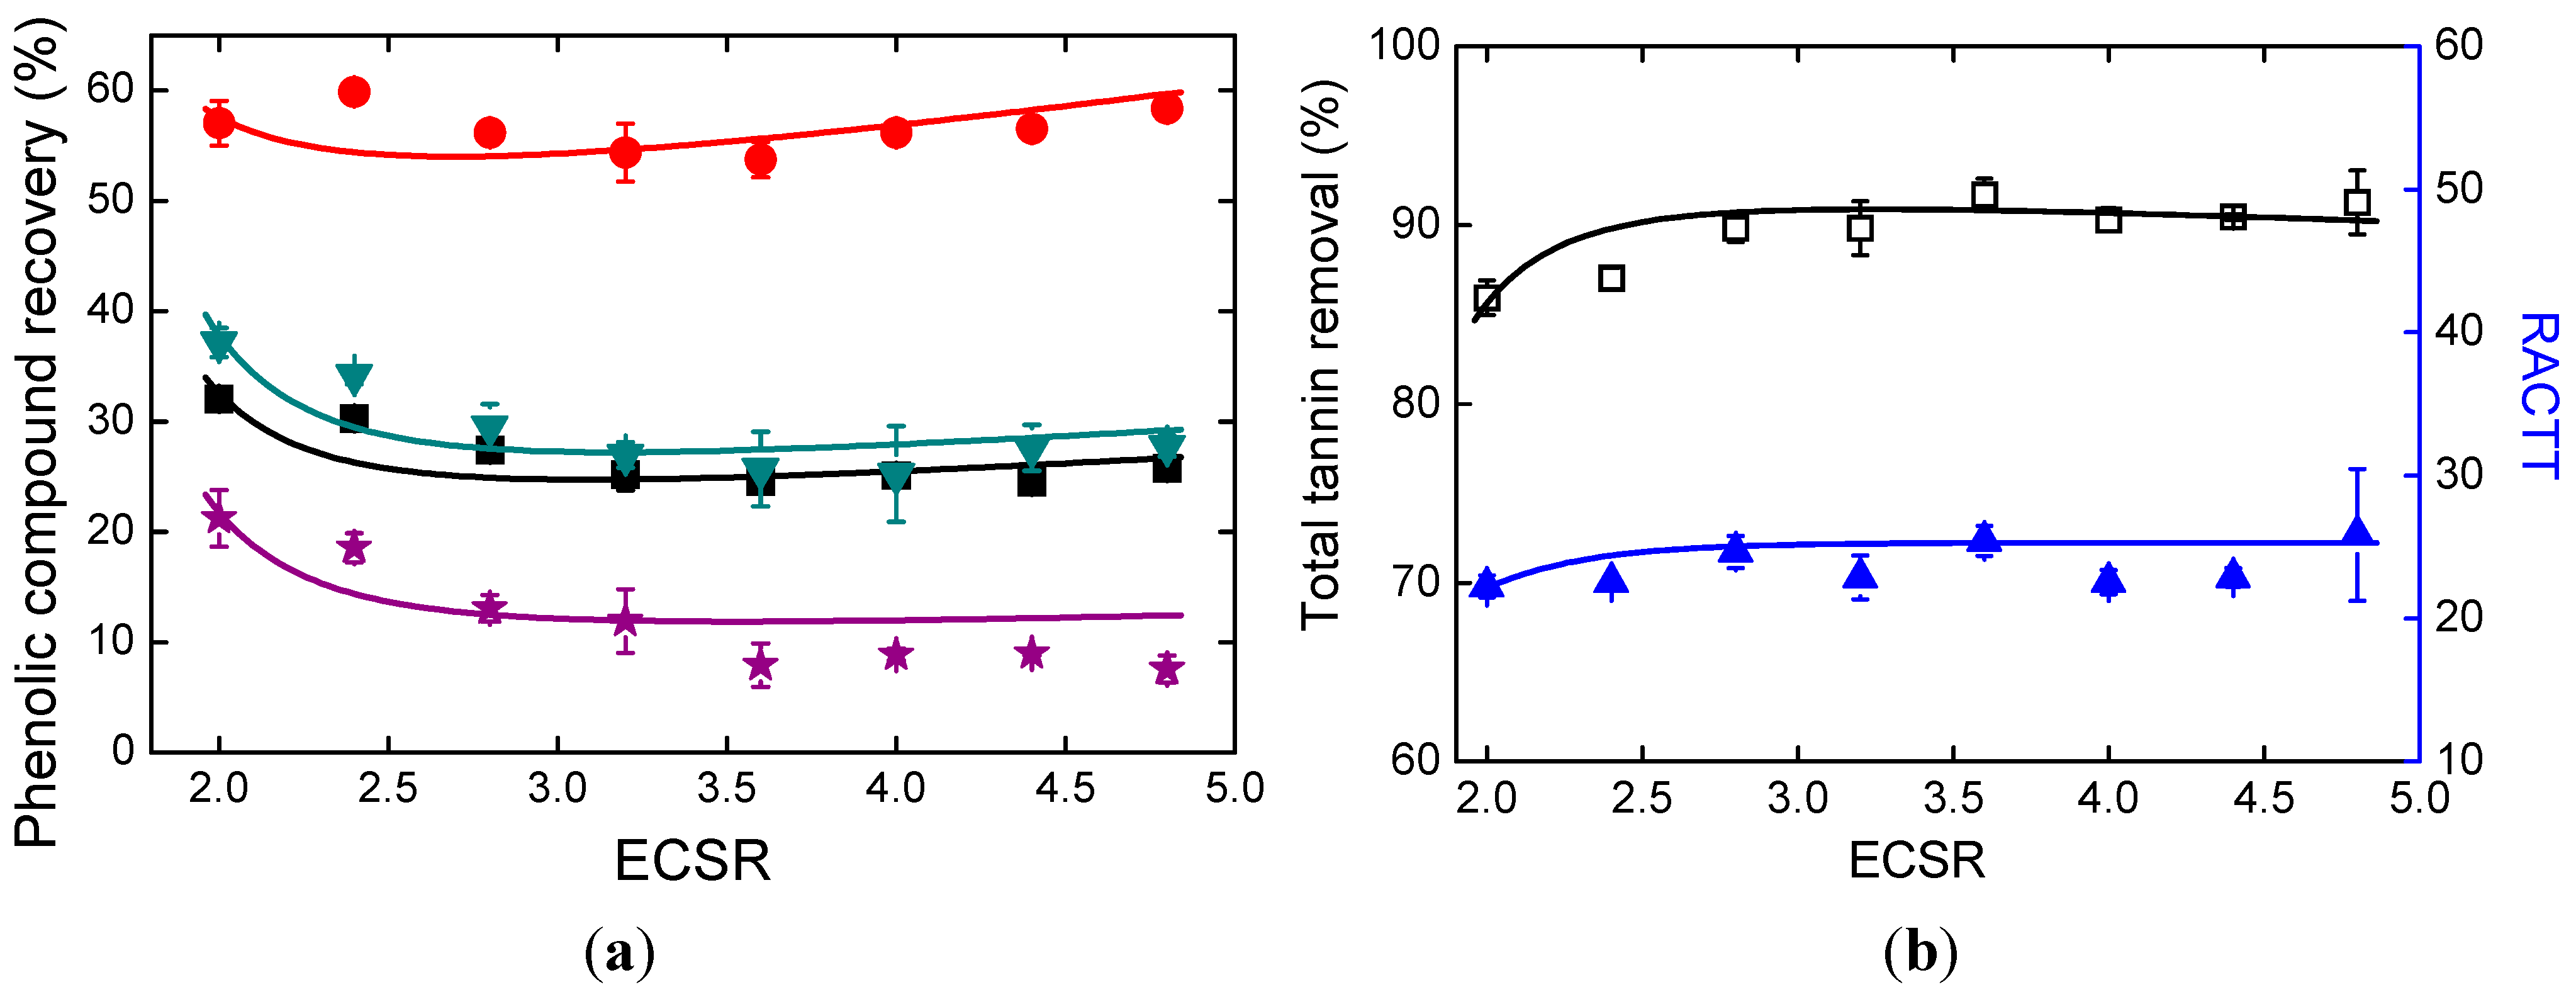
2.5. Effects of Ethanol Addition

The amount of ethanol added is considered to be another important factor because it affects the solvent composition of the supernatant. In Table 2, all the p values are less than 0.01. In Figure 6a, ECSR represents the mass ratio of ethanol and the concentrated supernatant. PA recovery, which was higher than 50%, was the highest among all the phenolic compound recoveries. SaB recovery was lower than 22%. RA recovery and SaB recovery decreased slightly as ethanol addition increased. Figure 6b shows the effects of ethanol addition on TTR and RACTT values. RACTT values varied little. TTR was between 85% and 92%, and slightly increased when ECSR value was less than 3.
Figure 6. Effects of ethanol addition. (a) Phenolic compound recoveries; (b) Total tannin removal and RACTT values.
Molecules 19 18705 g006
n = 3; ■, DSS; ●, PA; ▼, RA; ★, SaB; □, Total tannin removal; ▲, RACTT; Solid lines, calculation results.

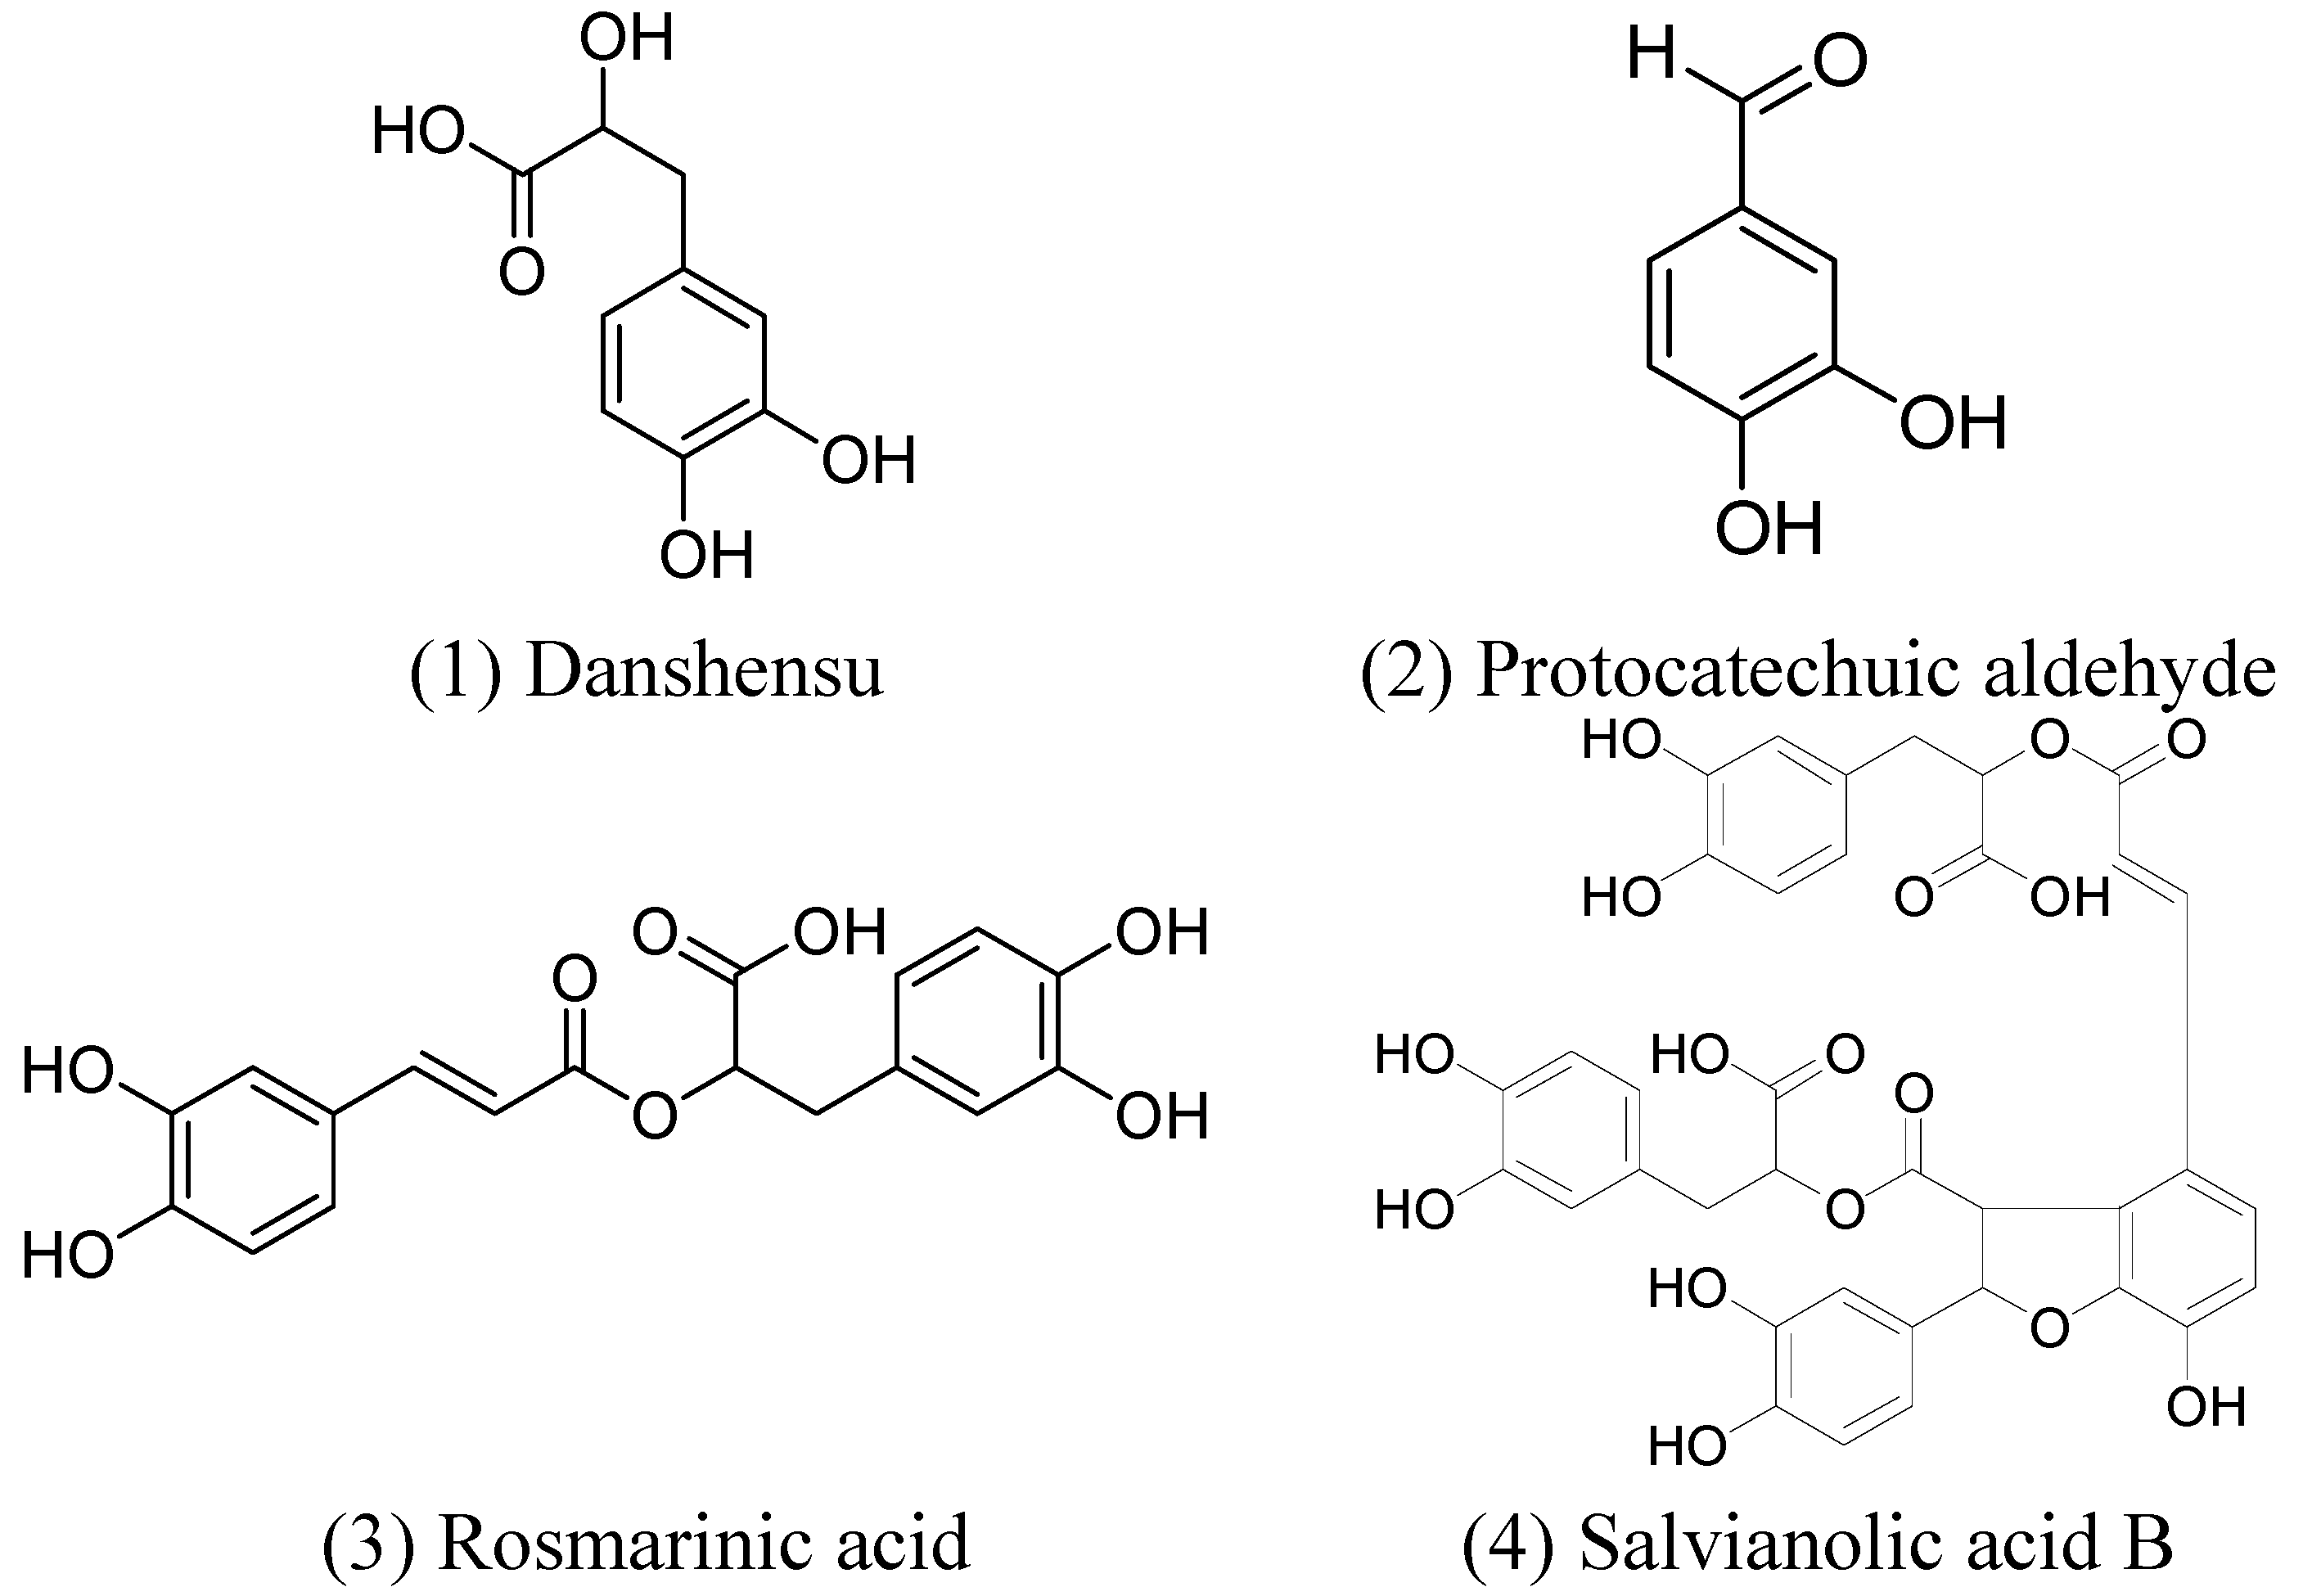
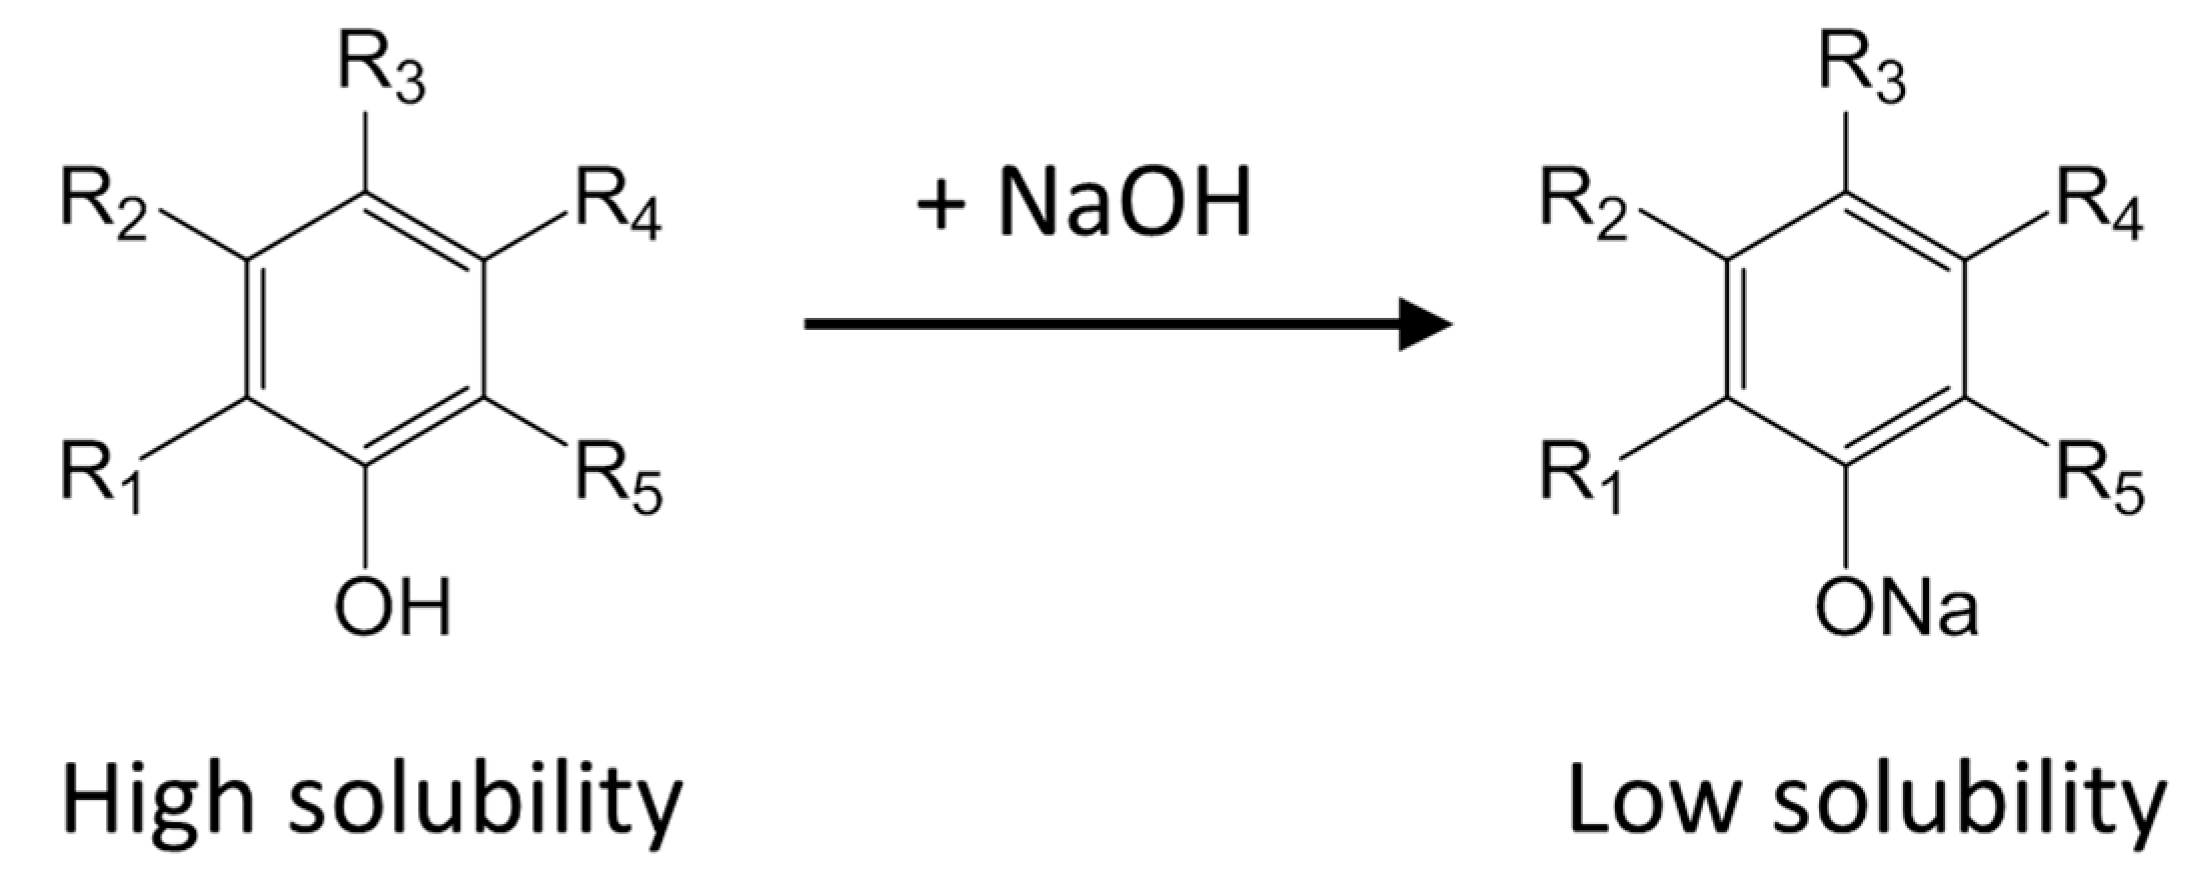
2.6. Mechanism of Phenolic Compound Loss and Tannin Removal

Phenolic compounds may be lost because of chemical transformation or precipitation during the alkaline ethanol precipitation process [28]. To examine this hypothesis the precipitate of Experiment 13 in Table 3 was analyzed.
Table 3. Experimental conditions, supernatant pH value, and MSPCS values (n = 3).
NO.ECSRRefrigeration Temperature (°C)Refrigeration Time (h)ACSRAlkaline Supernatant pH ValueMSPCS (g/g)
12.05240.1028.614 ± 0.6142.418 ± 0.001
22.45240.1028.658 ± 0.0312.753 ± 0.005
32.85240.1028.937 ± 0.0443.026 ± 0.003
43.25240.1029.024 ± 0.1753.257 ± 0.062
53.65240.1029.185 ± 0.1193.511 ± 0.045
64.05240.1029.101 ± 0.0673.827 ± 0.018
74.45240.1029.046 ± 0.0414.054 ± 0.052
84.85240.1029.150 ± 0.0894.482 ± 0.082
94.05240.0607.350 ± 0.0224.416 ± 0.016
104.05240.0708.036 ± 0.1344.289 ± 0.053
114.05240.0758.282 ± 0.1154.227 ± 0.026
124.05240.0808.413 ± 0.0974.167 ± 0.034
134.05240.0828.483 ± 0.0424.170 ± 0.005
144.05480.0828.532 ± 0.0704.156 ± 0.089
154.05720.0828.413 ± 0.0474.248 ± 0.028
164.05960.0828.412 ± 0.0964.214 ± 0.058
174.015240.0828.550 ± 0.0474.293 ± 0.013
184.025240.0828.369 ± 0.0144.425 ± 0.020
All four phenolic compounds were found in the precipitate. Considering that the increase of NaOH solution addition amount resulted in lower phenolic compound recoveries, phenolic compounds probably formed sodium salts. The solubility of these salts are small in the mixture of ethanol and water, which results in precipitation. The mechanism is shown in Scheme 1.
Scheme 1. The mechanism of phenolic compound loss and tannin removal.
Molecules 19 18705 g007
The precipitated phenolic compound (RPPC) ratio represents the proportion of phenolic compounds which is lost because of precipitation, as seen in Table 4. The RPPC value of SaB was higher than 90%, indicating most of the SaB loss was caused by precipitation. The sum of phenolic compound recovery (PCR) and RPPC is the quotient of the total amount of a phenolic compound after and before the alkaline ethanol precipitation process. To estimate the influences of chemical transformation on amounts of phenolic compounds, the sum of PCR and RPPC was calculated and listed in Table 4. For DSS, RA, and SaB, the sum of PCR and RPPC was close to 1, which means that chemical transformation had little influence on the amounts of these phenolic compounds. The sum of PCR and RPPC was about 90% for PA, which means that some of PA lost because of reactions. In Figure 3a, PA recovery decreased slightly as refrigeration time increased.
Table 4. RPPC and the sum of PCR and RPPC
Phenolic CompoundsRPPC (%)PCR + RPPC (%)
DSS67.3 ± 6.597.2 ± 6.2
PA29.3 ± 3.089.8 ± 3.4
RA59.7 ± 6.497.5 ± 6.4
SaB91.6 ± 8.998.7 ± 9.1
Tannins were also found in the precipitate of Experiment 13. The ratio of precipitated tannins (PRTT) was 80.0% ± 2.1%. It indicates that most tannins formed sodium salts during the alkaline ethanol precipitation process. Total tannin remained in supernatant (TTS) can be calculated with Equation (1):
TTS = 1 - TTR
The sum of TTS and RPTT value was 108% ± 1%. It can be concluded that the impact of chemical transformation on tannin amount was small. Because phenolic active ingredients and tannins have similar properties, the mechanisms of phenolic compound loss and tannin removal are similar. Therefore selective removal of tannins is still an unresolved technical issue.

2.7. Modeling

Modeling is a way to find the potential important parameters in a process [29]. A model is derived to describe the concentrations of DSS, PA, RA, SaB, and TT in the alkaline supernatants. Precipitate generated in alkaline precipitation is assumed to contain no water. Water mass fraction in the mixture of ethanol and water of alkaline supernatant (Ø) then can be calculated with Equation (2) according to the law of conservation of mass.
ϕ = w 2 + w 1 × ECSR + w 3 × ACSR w 2 + w 4 + ECSR + w 3 × ACSR
where w1, w2, and w3 refer to the water mass fraction in 95% (v/v) ethanol, the concentrated supernatant, and NaOH solution, respectively; w4 refers to ethanol mass fraction in the concentrated supernatant. A phenolic compound exists in alkaline supernatant both in its ionized form and unionized form [28]. Therefore Equation (3) can be obtained:
PC AS = PC IF + PC UF
where PC is the phenolic compound content; subscript AS refers to the alkaline supernatant; subscripts IF and UF refer to ionized form and unionized form, respectively. There is a dissociation equilibrium between the two forms of phenolic compounds in the alkaline supernatant. By assuming that the activity coefficients of phenolic compounds were 1, Equation (4) can be obtained:
K a = A IF × A H + A UF = γ I F γ U F × PC IF PC UF × A H + = PC IF PC UF × A H +
where Ka is dissociation coefficient, A is activity, and γ is the activity coefficient. Equation (5) can be derived from Equations (3) and (4):
PC AS = PC IF × K a 1 × A H + + PC IF
According to Espinosa et al.’s work [30], Ka can be assumed to be a function of Ø, as shown in Equation (6):
p K a = p K a , E t h + α × ϕ
where Ka,Eth is the dissociation coefficient of phenolic compounds in pure ethanol and α is a slope parameter. Because the ionized form of a phenolic compound is considered to be saturated in the alkaline supernatant, PCIF is equal to the solubility of ionized phenolic compound (S). S is assumed to increase linearly as Ø increases, as shown in Equation (7):
S = S E t h + β × ϕ
where SEth is the solubility of ionized phenolic compound in pure ethanol and β is a slope parameter. Accordingly, Equation (8) can be derived from Equations (5)–(7):
PC AS = ( S Eth + β × ϕ ) ( 1 + A H + 10 ( p K a , E t h + α × ϕ ) )
Equation (8) was applied to calibrate Ka,Eth, α, and β by minimizing the average absolute deviations (AAD) values for the concentrations of four phenolic compounds and total tannin. AAD values were calculated with Equation (9):
AAD = | PC Exp PC Cal | NED × 100 %
where NED is the number of experimental data; the subscripts Exp and Cal refer to experimental values and calculated values, respectively. In the calibration, SEth in Equation (8) was assumed to be zero. The calibrated results are listed in Table 5. Average relative deviations (ARD) values were also calculated with Equation (10) for comparison:
ARD = | PC Exp PC Cal PC Exp | NED × 100 %
AAD values and ARD values are listed in Table 5.
Table 5. Calibrated parameters and deviations.
Phenolic CompoundsDSSPARASaBTT
Ka,Eth4.785.204.885.284.52
α14.710.514.614.216.7
β (mg/g)10.93.752.204.270.836
AAD (mg/g)0.1020.01980.03070.1190.0132
ARD (%)4.372.716.7718.47.32
Ka,Eth values for all the compounds are between 4 and 6. The β value of DSS is higher than that of other phenolic compounds, which means that DSS salt solubility in supernatant increases more rapidly as Ø increased. The ARD values are less than 8% for DSS, PA, RA, and TT, which means satisfactory correlation results were obtained. In this model, Ø, and supernatant pH value are two important parameters affecting the results of the alkaline ethanol precipitation. Therefore these two parameters should be monitored in the alkaline ethanol precipitation process to obtain a high batch-to-batch consistency.
The mass of supernatant obtained from per gram concentrated supernatant (MSPCS) were correlated with ECSR and ACSR using Equations (11) and (12), respectively:
MSPCS = a 0 + a 1 × ECSR + a 2 × ACSR
pH = b 0 + b 1 × ECSR 1 + b 2 × ACSR 1
where a0, a1, a2, b0, b1, and b2 are calibrated parameters. The calibration results are listed in Table 6.
Table 6. Calibration results for the supernatant pH value and MSPCS.
ParametersValuesP valueR2adj
a02.4560.0000.996
a10.7040.000
a2−14.040.000
b012.050.0000.980
b1−2.020.000
b2−0.2490.000
The p values are less than 0.01, indicating the corresponding terms are significant. The positive value of a1 means that higher amount of ethanol added leads to more supernatant. The negative value of a2 means that higher amount of NaOH solution added leads to more precipitation. The values of b1 and b2 are negative, which means that the addition of NaOH solution and ethanol both result in supernatants with higher pH values.
With the obtained parameters Ka,Eth, α, β, a0, a1, a2, b0, b1, and b2, phenolic compound recoveries and total tannin removal can be correlated. RACTT values can also be calculated. The calculation results are shown in Figure 5 and Figure 6. The correlation results showed good agreement with the experimental results. Because of the experimental design, the prediction results of supernatant pH value and MSPCS will not be reliable when the values of ECSR and ACSR change simultaneously, therefore the optimization of parameters is not carried out in this work.

3. Experimental Section

3.1. Materials and Chemicals
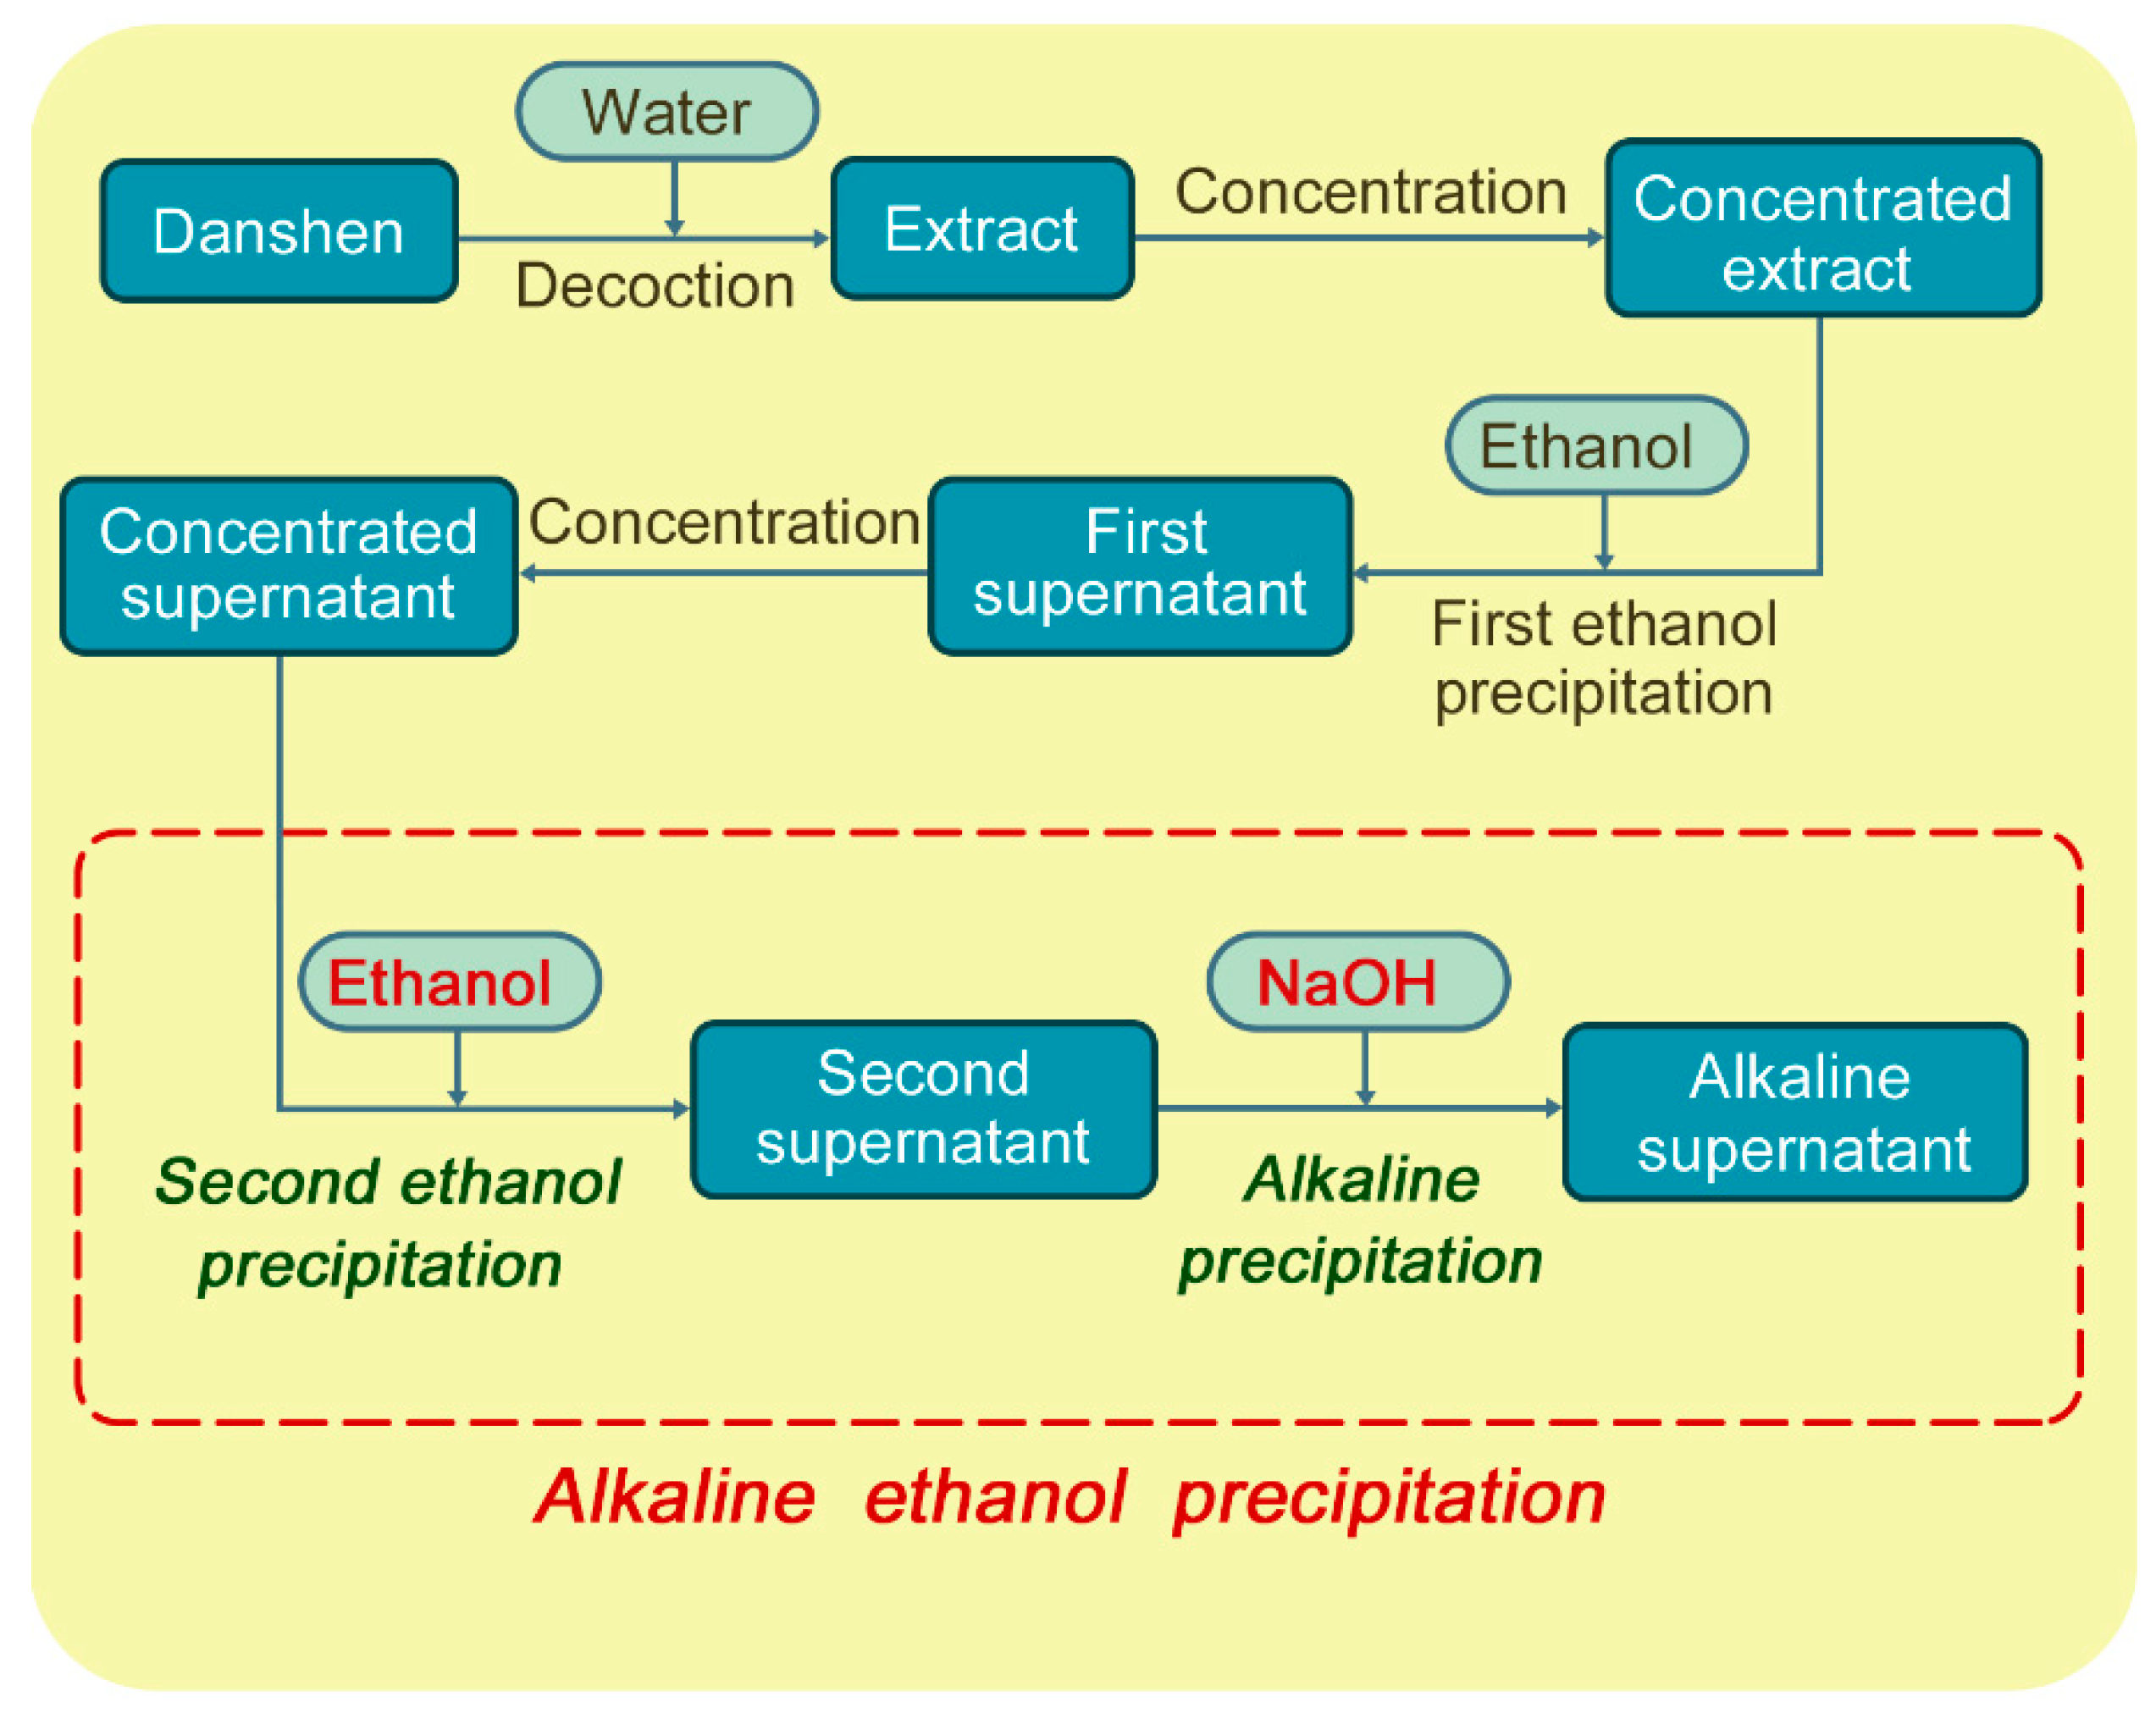
The concentrated supernatant was kindly provided by a Chinese pharmaceutical manufacturer (Qingchunbao, Zhejiang, China). Ethanol (>99.7%) was purchased from Tianjin Damao Chemical Regent Factory (Tianjin, China). Standard substances including DSS and PA were obtained from the National Institute for the Control of Pharmaceutical and Biological Products (Beijing, China). RA and SaB (˃98%) were purchased from Winherb Medical S&T Development Co., Ltd. (Shanghai, China). Casein (AR) and Na2CO3 (AR) were purchased from Sangon Biotech Co., Ltd. (Shanghai, China). Gallic acid (AR) was obtained from Shanghai Chemical Reagent Company (Shanghai, China). HCl solution (36.0%–38.0%) was supplied by Hangzhou Chemical Reagent Co., Ltd. (Zhejiang, China). NaOH (>96.0%) was purchased from Zhongxing Chemical Reagent Co., Ltd. (Zhejiang, China). Folin & Ciocalteu’s phenol reagent was obtained from Shanghai Siji Biological Product Co., Ltd. (Shanghai, China). Formic acid (>99.0%) was purchased from the Tedia Company (Fairfield, OH, USA). Deionized water was produced using a Milli-Q academic water purification system (Millipore, Milford, MA, USA). HPLC-grade acetonitrile was purchased from Merck (Darmstadt, Germany). All materials were used as received without any further purification.

3.2. Procedures

In industry, 95% (v/v) ethanol is usually used to obtain an alkaline supernatant with apparent ethanol content more than 80% (v/v). Therefore 95% (v/v) ethanol is used in this work. Ethanol was added into the concentrated supernatant in a conical flask under magnetic stirring with a flow rate of 3.6 g/min. After the addition of ethanol, a volume of 35% (m/m) NaOH solution was added into the second supernatant. After the addition of NaOH, the stirring continued for 20 min. The flasks then were refrigerated in a low-temperature thermostat bath (THD-1008W, Ningbo Tianheng Instrument Factory, Ningbo, China). The amount of ethanol added, the amount of NaOH solution added, refrigeration temperature and refrigeration time are listed in Table 3. After that, the alkaline supernatant was collected and weighed. The pH values of the alkaline supernatants were determined with a pH meter (S40, Mettler-Toledo Instruments Co., Ltd., Shanghai, China). The alkaline supernatants then were acidified with HCl solution for preservation. The concentrations of phenolic compounds and tannins were determined. The experimental conditions were designed according to industry experiences. All the experiments were repeated three times (n = 3).
The following equations were used to calculate MSPCS, TTR, PCR, RPPC, and RPTT:
MSPCS = MAS MCS
where MAS and MCS are the mass of the alkali supernatant and the mass of the concentrated supernatant, respectively:
TTR = ( 1 TT AS TT CS × MSPCS ) × 100 %
where TT is the total tannin content; subscripts AS and CS refer to the alkaline supernatant and the concentrated supernatant, respectively:
PCR = PC AS PC CS × MSPCS × 100 %
RPPC = PC PRE × MPRE PC CS × MCS × 100 %
where MPRE is the mass of precipitation, and subscript PRE represents the precipitation:
RPTT = TT PRE × MPRE TT CS × MCS × 100 %
Total active constituent (TAC) is defined as the sum of DSS content, PA content, RA content, and SaB content. RACTT value in the supernatant was calculated with Equation (18):
RACTT = TAC TT
Higher RACTT value means smaller risks for patients when the same dosage is used. The difference of RACTT values before and after the alkaline ethanol precipitation process can represent the contribution of the ethanol precipitation process on drug safety. Analysis of Variance (ANOVA) was used to determine the impacts of refrigeration time, refrigeration temperature, ethanol amount, and NaOH solution amount on TTR, PCR, and RACTT, respectively. The results are listed in Table 2.

3.3. Analytical Methods

The HPLC-UV method developed in previous work [31] was used to determine the concentrations of DSS, PA, RA, and SaB. An Agilent 1100 series HPLC apparatus (Agilent Technologies, Waldbronn, Germany) was used to analyze the samples. Chromatographic separations were carried out on a Kromasil 100-5 C18 column (250 mm × 4.6 mm i.d., 5.0 um particle size) purchased from AkzoNobel (Stockholm, Sweden). The mobile phase consisted of solvent A (0.05% trifluoroacetic acid in water) and solvent B (acetonitrile). The gradient elution was as follows: 2.0%–30.0% B at 0–65 min; 30.0%–60.0% B at 65–75 min. The flowrate of mobile phase was 0.8 mL/min and the injection volume was 10 µL. The column temperature was set at 40 °C and detection wavelength was set at 288 nm. Total tannin content was determined using a spectrophotometric method. A mixed NaOH-Na2CO3 solution was prepared by mixing equal volume of NaOH solution (0.03 mol/L) and Na2CO3 solution (wt. 4%). Gallic acid was weighed accurately and dissolved in water to establish a standard curve. The mixed NaOH-Na2CO3 solution, gallic acid solution and Folin Ciocalteu phenol reagent were mixed and shaken for 30 min in a water bath oscillator. Spectrophotometry absorbance was measured at 760 nm. When determining the total phenol content of samples, the mixed NaOH-Na2CO3 solution, sample solution and Folin Ciocalteu phenol reagent were mixed together and measured the spectrophotometry absorbance with a similar process. Casein was applied to adsorb the tannins in samples. After adsorption, the total phenol contents of samples were also determined. The difference of total phenol contents for a sample before and after adsorption by casein was considered as the total tannin content.

4. Conclusions

In this work, the alkaline ethanol precipitation process used in the manufacture of Danshen injection was investigated as an example of tannin removal. More than 90% of the tannins can be removed in the alkaline ethanol precipitation process, however there was a concurrent dramatic loss of phenolic compounds. Higher refrigeration temperature and lower added amount of NaOH solution both led to lower total tannin removal and higher phenolic compound recoveries. High RACTT values were obtained when refrigeration temperature was low. The loss of phenolic compounds and the removal of tannins were both mainly caused by precipitation. A model based on dissociation equilibrium and dissolution equilibrium was established. Three parameters of pKa,Eth, α, and β were calibrated. Average relative deviations for the concentrations of PA, DSS, RA, and total tannin were less than 8%. Supernatant water content and supernatant pH value are two important parameters in the model. They are suggested to be monitored and controlled in the alkaline ethanol precipitation process. The results of this work increase the process understanding for the botanical injections manufactured using alkaline ethanol precipitation to remove tannins, which meets the requirements of QbD concept.

Abbreviations

A
activity
ACSR
the mass ratio of NaOH solution and the concentrated supernatant
AAD
the average absolute deviations [mg/g]
ARD
the average relative deviations [%]
DSS
Danshensu
ECSR
the mass ratio of ethanol and the concentrated supernatant
Ka
dissociation equilibrium
MAS
mass of supernatant [g]
MCS
mass of the concentrated supernatant [g]
MPRE
the mass of precipitation [g]
MSPCS
the mass of supernatant obtained from per gram concentrated supernatant [g/g]
NED
the number of experimental data
PA
protocatechuic aldehyde
PC
phenolic compound content [mg/g]
PCR
phenolic compound recovery [%]
QbD
quality by design
RA
rosmarinic acid
RACTT
the mass ratio of total active constituent and total tannin
RPPC
the ratio of precipitated phenolic compound [%]
RPTT
the ratio of precipitated tannins [%]
S
the solubility of HIPC [mg/g]
SaB
Salvianolic acid B
TAC
total active constituent [mg/g]
TT
total tannin content [mg/g]
TTR
the total tannin removal [%]
TTS
total tannin remained in supernatant [%]
w1
water mass fraction in 95% (v/v) ethanol [%]
w2
water mass fraction in the concentrated supernatant [%]
w3
water mass fraction in NaOH solution [%]
w4
ethanol mass fraction in the concentrated supernatant [%]
a0
parameter calibrated to correlate MSPCS
a1
parameter calibrated to correlate MSPCS
a2
parameter calibrated to correlate MSPCS
b0
parameter calibrated to correlate pH
b1
parameter calibrated to correlate pH
b2
parameter calibrated to correlate pH

Greek Symbols

α
slope parameter for pKa calculation
β
slope parameter for solubility calculation [mg/g]
γ
activity coefficient
Ø
water mass fraction in the mixture of ethanol and water of alkaline supernatant [%]

Subscripts

AS
alkaline supernatant
Cal
calculated values
CS
the concentrated supernatant
Eth
ethanol
Exp
experimental values
IF
ionized phenolic compounds
PRE
precipitation
UF
unionized phenolic compounds

Acknowledgments

The authors like to acknowledge the supports of National Natural Science Foundation (No. 81273992) and Zhejiang Provincial Natural Science Foundation (LQ12H29004) on this work.

Author Contributions

Haibin Qu and Xingchu Gong conceived and designed the experiments; Yao Li performed the experiments; Xingchu Gong, Yao Li, and Haibin Qu analyzed the data; Haibin Qu and Xingchu Gong contributed reagents/materials/analysis tools; Xingchu Gong, Yao Li, and Haibin Qu wrote the paper.

Conflicts of Interest

The authors declare no conflict of interest.

References

  1. Li, S.D.; Li, J. Analysis of adverse reactions of Danshen injection preparations. China J. Chin. Mat. Med. 2004, 29, 270–272. [Google Scholar]
  2. Wang, Z.Y.; Wang, Y.Q.; Li, M. Analysis of 302 ADR cases caused by Danshen injection. China Pharm. 2010, 21, 3035–3037. [Google Scholar]
  3. Meng, R.; Ren, X.Y.; Lan, P.Y. Analysis on problems of TCM injection included in national essential drugs list: A case study of Danshen injection. China Pharm. 2010, 21, 2606–2608. [Google Scholar]
  4. Sun, Y.; Li, A.M.; Zhang, Q.X.; Chen, J.L.; Fu, D.F.; Wang, S.H. Adsorptive separation of tannic acid from aqueous solution by polymeric resins. Sep. Sci. Technol. 2008, 43, 389–402. [Google Scholar] [CrossRef]
  5. Buso, A.; Balbo, L.; Giomo, M.; Farnia, G.; Sandona, G. Electrochemical removal of tannins from aqueous solutions. Ind. Eng. Chem. Res. 2000, 39, 494–499. [Google Scholar] [CrossRef]
  6. Murugananthan, M.; Raju, G.B.; Prabhakar, S. Removal of tannins and polyhydroxy phenols by electro-chemical techniques. J. Chem. Technol. Biot. 2005, 80, 1188–1197. [Google Scholar] [CrossRef]
  7. Gnanamani, A.; Sekaran, G.; Babu, M. Removal of tannin from cross-linked and open chain polymeric tannin substrates using heme peroxidases of Phanerochaete chrysosporium. Bioproc. Biosyst. Eng. 2001, 24, 211–217. [Google Scholar] [CrossRef]
  8. Boye, B.; Farnia, G.; Sandona, G.; Buso, A.; Giomo, M. Removal of vegetal tannins from wastewater by electroprecipitation combinedwith electrogenerated Fenton oxidation. J. Appl. Electrochem. 2005, 35, 369–374. [Google Scholar] [CrossRef]
  9. Anirudhan, T.S.; Suchithra, P.S. Adsorptive characteristics of tannin removal from aqueous solutions and coir industry effluents using calcined and uncalcined hydrotalcites. Ind. Eng. Chem. Res. 2007, 46, 4606–4613. [Google Scholar] [CrossRef]
  10. Sreeram, K.J.; Saravanabhavan, S.; Rao, J.R.; Nair, B.U. Use of chromium-collagen wastes for the removal of tannins from wastewaters. Ind. Eng. Chem. Res. 2004, 43, 5310–5317. [Google Scholar] [CrossRef]
  11. Anirudhan, T.S.; Ramachandran, M. Adsorptive removal of tannin from aqueous solutions by cationic surfactant-modified bentonite clay. J. Colloid Interf. Sci. 2006, 299, 116–124. [Google Scholar] [CrossRef]
  12. Liao, X.P.; Shi, B. Selective removal of tannins from medicinal plant extracts using a collagen fiber adsorbent. J. Sci. Food Agr. 2005, 85, 1285–1291. [Google Scholar] [CrossRef]
  13. Ma, L. Quality Evaluation and Study on Quality Standards of Guanxinning Injection. Master’s Thesis, Zhejiang University, Hangzhou, China, 2012. [Google Scholar]
  14. Zhang, L.; Gong, X.; Qu, H. Optimizing the alcohol precipitation of Danshen by response surface methodology. Sep. Sci. Technol. 2013, 48, 977–983. [Google Scholar] [CrossRef]
  15. Zhang, L.; Yan, B.J.; Gong, X.C.; Yu, L.X.; Qu, H.B. Application of quality by design to the process development of botanical drug products: A case study. Aaps PharmSciTech 2013, 14, 277–286. [Google Scholar] [CrossRef] [PubMed]
  16. Soares, P.A.G.; Vaz, A.F.M.; Correia, M.T.S.; Pessoa, A.; Carneiro-da-Cunha, M.G. Purification of bromelain from pineapple wastes by ethanol precipitation. Sep. Purif. Technol. 2012, 98, 389–395. [Google Scholar] [CrossRef]
  17. Gong, X.C.; Wang, S.S.; Qu, H.B. Comparison of Two Separation Technologies Applied in the Manufacture of Botanical Injections: Second Ethanol Precipitation and Solvent Extraction. Ind. Eng. Chem. Res. 2011, 50, 7542–7548. [Google Scholar] [CrossRef]
  18. Golunski, S.; Astolfi, V.; Carniel, N.; de Oliveira, D.; di Luccio, M.; Mazutti, M.A.; Treichel, H. Ethanol precipitation and ultrafiltration of inulinases from Kluyveromyces marxianus. Sep. Purif. Technol. 2011, 78, 261–265. [Google Scholar] [CrossRef]
  19. Gong, X.; Li, Y.; Guo, Z.; Qu, H. Control the effects caused by noise parameter fluctuations to improve pharmaceutical process robustness: A case study of design space development for an ethanol precipitation process. Sep. Purif. Technol. 2014, 132, 126–137. [Google Scholar] [CrossRef]
  20. Vogt, F.G.; Kord, A.S. Development of Quality-By-Design Analytical Methods. J. Pharm. Sci. 2011, 100, 797–812. [Google Scholar] [CrossRef] [PubMed]
  21. Xu, M.; Han, J.; Li, H.F.; Fan, L.; Liu, A.H.; Guo, D.A. Analysis on the stability of total phenolic acids and salvianolic acid B from Salvia miltiorrhiza by HPLC and HPLC-MSn. Nat. Prod. Commun. 2008, 3, 669–676. [Google Scholar]
  22. Xia, X.H.; Liu, M.; Zhang, Z.M.; Wu, Z.J.; Pan, S.Y. Antioxidant activity of hydrophilic components of danshen root in vitro. Chin. Arch. .Trad. Chin. Med. 2009, 27, 1085–1087. [Google Scholar]
  23. Cheng, T.O. Cardiovascular effects of Danshen. Int. J. Cardiol. 2007, 121, 9–22. [Google Scholar] [CrossRef] [PubMed]
  24. Zhao, D.; Han, D.E.; Li, N.; Lu, Y.; Li, T.T.; Yang, S.Y.; He, J.K.; Chen, X.J. Simultaneous determination of six phenolic constituents of Danshen injection in rat plasma by LC-ESI-MS and its application to a pharmacokinetic study. Eur. J. Mass Spectrom. 2011, 17, 395–403. [Google Scholar] [CrossRef]
  25. Zhou, G.J.; Wang, W.; Xie, X.M.; Qin, M.J.; Kuai, B.K.; Zhou, T.S. Post-harvest induced production of salvianolic acids and significant promotion of antioxidant properties in roots of Salvia miltiorrhiza (Danshen). Molecules 2014, 19, 7207–7222. [Google Scholar] [CrossRef] [PubMed]
  26. Lee, H.S.; Son, W.C.; Ryu, J.E.; Koo, B.A.; Kim, Y.S. Standardized Salvia miltiorrhiza Extract Suppresses Hepatic Stellate Cell Activation and Attenuates Steatohepatitis Induced by a Methionine-Choline Deficient Diet in Mice. Molecules 2014, 19, 8189–8211. [Google Scholar] [CrossRef] [PubMed]
  27. Xu, J.Z.; Shen, J.; Cheng, Y.Y.; Qu, H.B. Simultaneous detection of seven phenolic acids in Danshen injection using HPLC with ultraviolet detector. J. Zhejiang Univ. Sci. B 2008, 9, 728–733. [Google Scholar] [CrossRef] [PubMed]
  28. Gong, X.C.; Wang, S.S.; Li, Y.; Qu, H.B. Separation characteristics of ethanol precipitation for the purification of the water extract of medicinal plants. Sep. Purif. Technol. 2013, 107, 273–280. [Google Scholar] [CrossRef]
  29. Getaz, D.; Butte, A.; Morbidelli, M. Model-based design space determination of peptide chromatographic purification processes. J. Chromatogr. A 2013, 1284, 80–87. [Google Scholar] [CrossRef]
  30. Espinosa, S.; Bosch, E.; Roses, M.; Valko, K. Change of mobile phase pH during gradient reversed-phase chromatography with 2,2,2-trifluoroethanol-water as mobile phase and its effect on the chromatographic hydrophobicity index determination. J. Chromatogr. A 2002, 954, 77–87. [Google Scholar] [CrossRef] [PubMed]
  31. Gong, X.C.; Yan, A.Y.; Qu, H.B. Optimization for the Ethanol Precipitation Process of Botanical Injection: Indicator Selection and Factor Influences. Sep. Sci. Technol. 2014, 49, 619–626. [Google Scholar] [CrossRef]
  • Sample Availability: Samples of the compounds are available from the authors.

