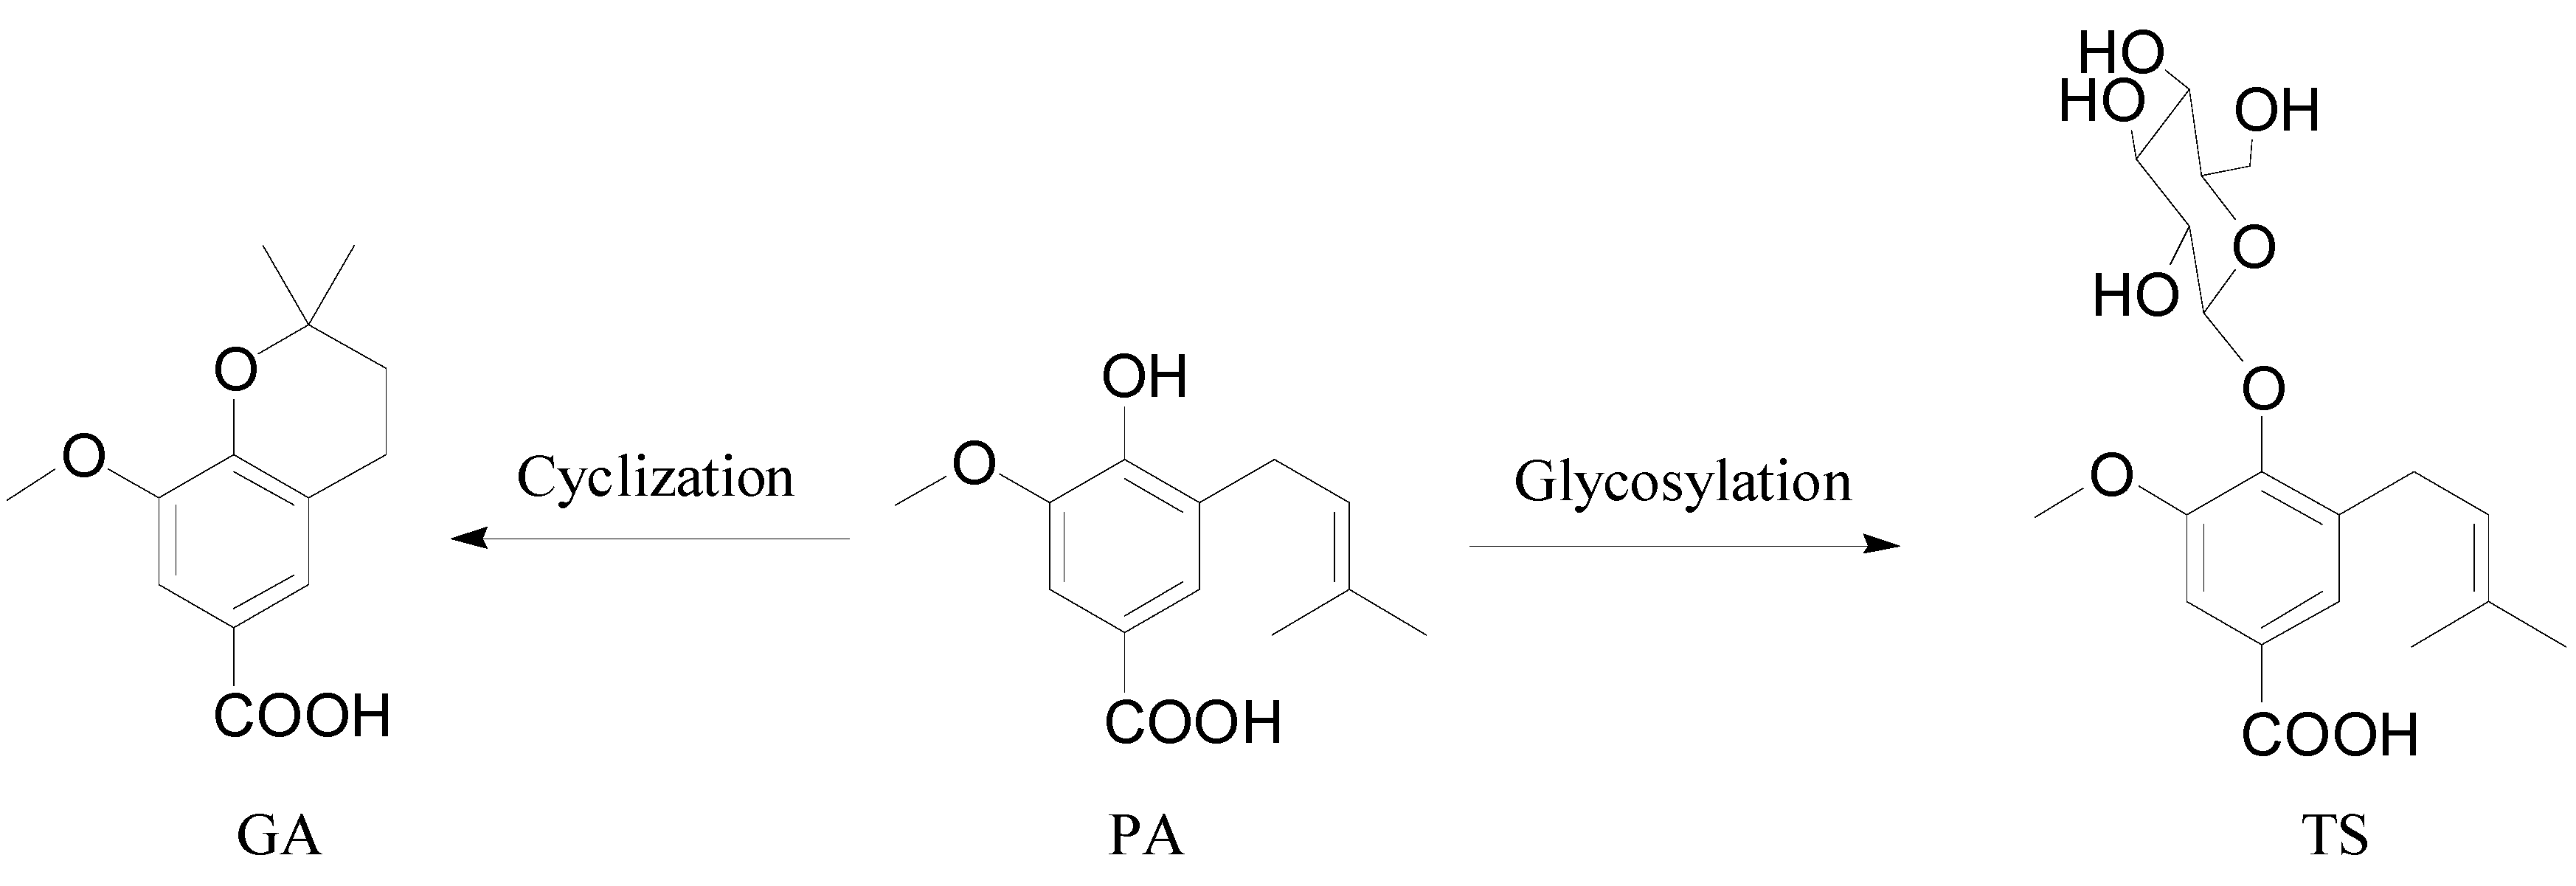
Absorbability, Mechanism and Structure-Property Relationship of Three Phenolic Acids from the Flowers of Trollius chinensis

Abstract
:1. Introduction
2. Results and Discussion
2.1. Results
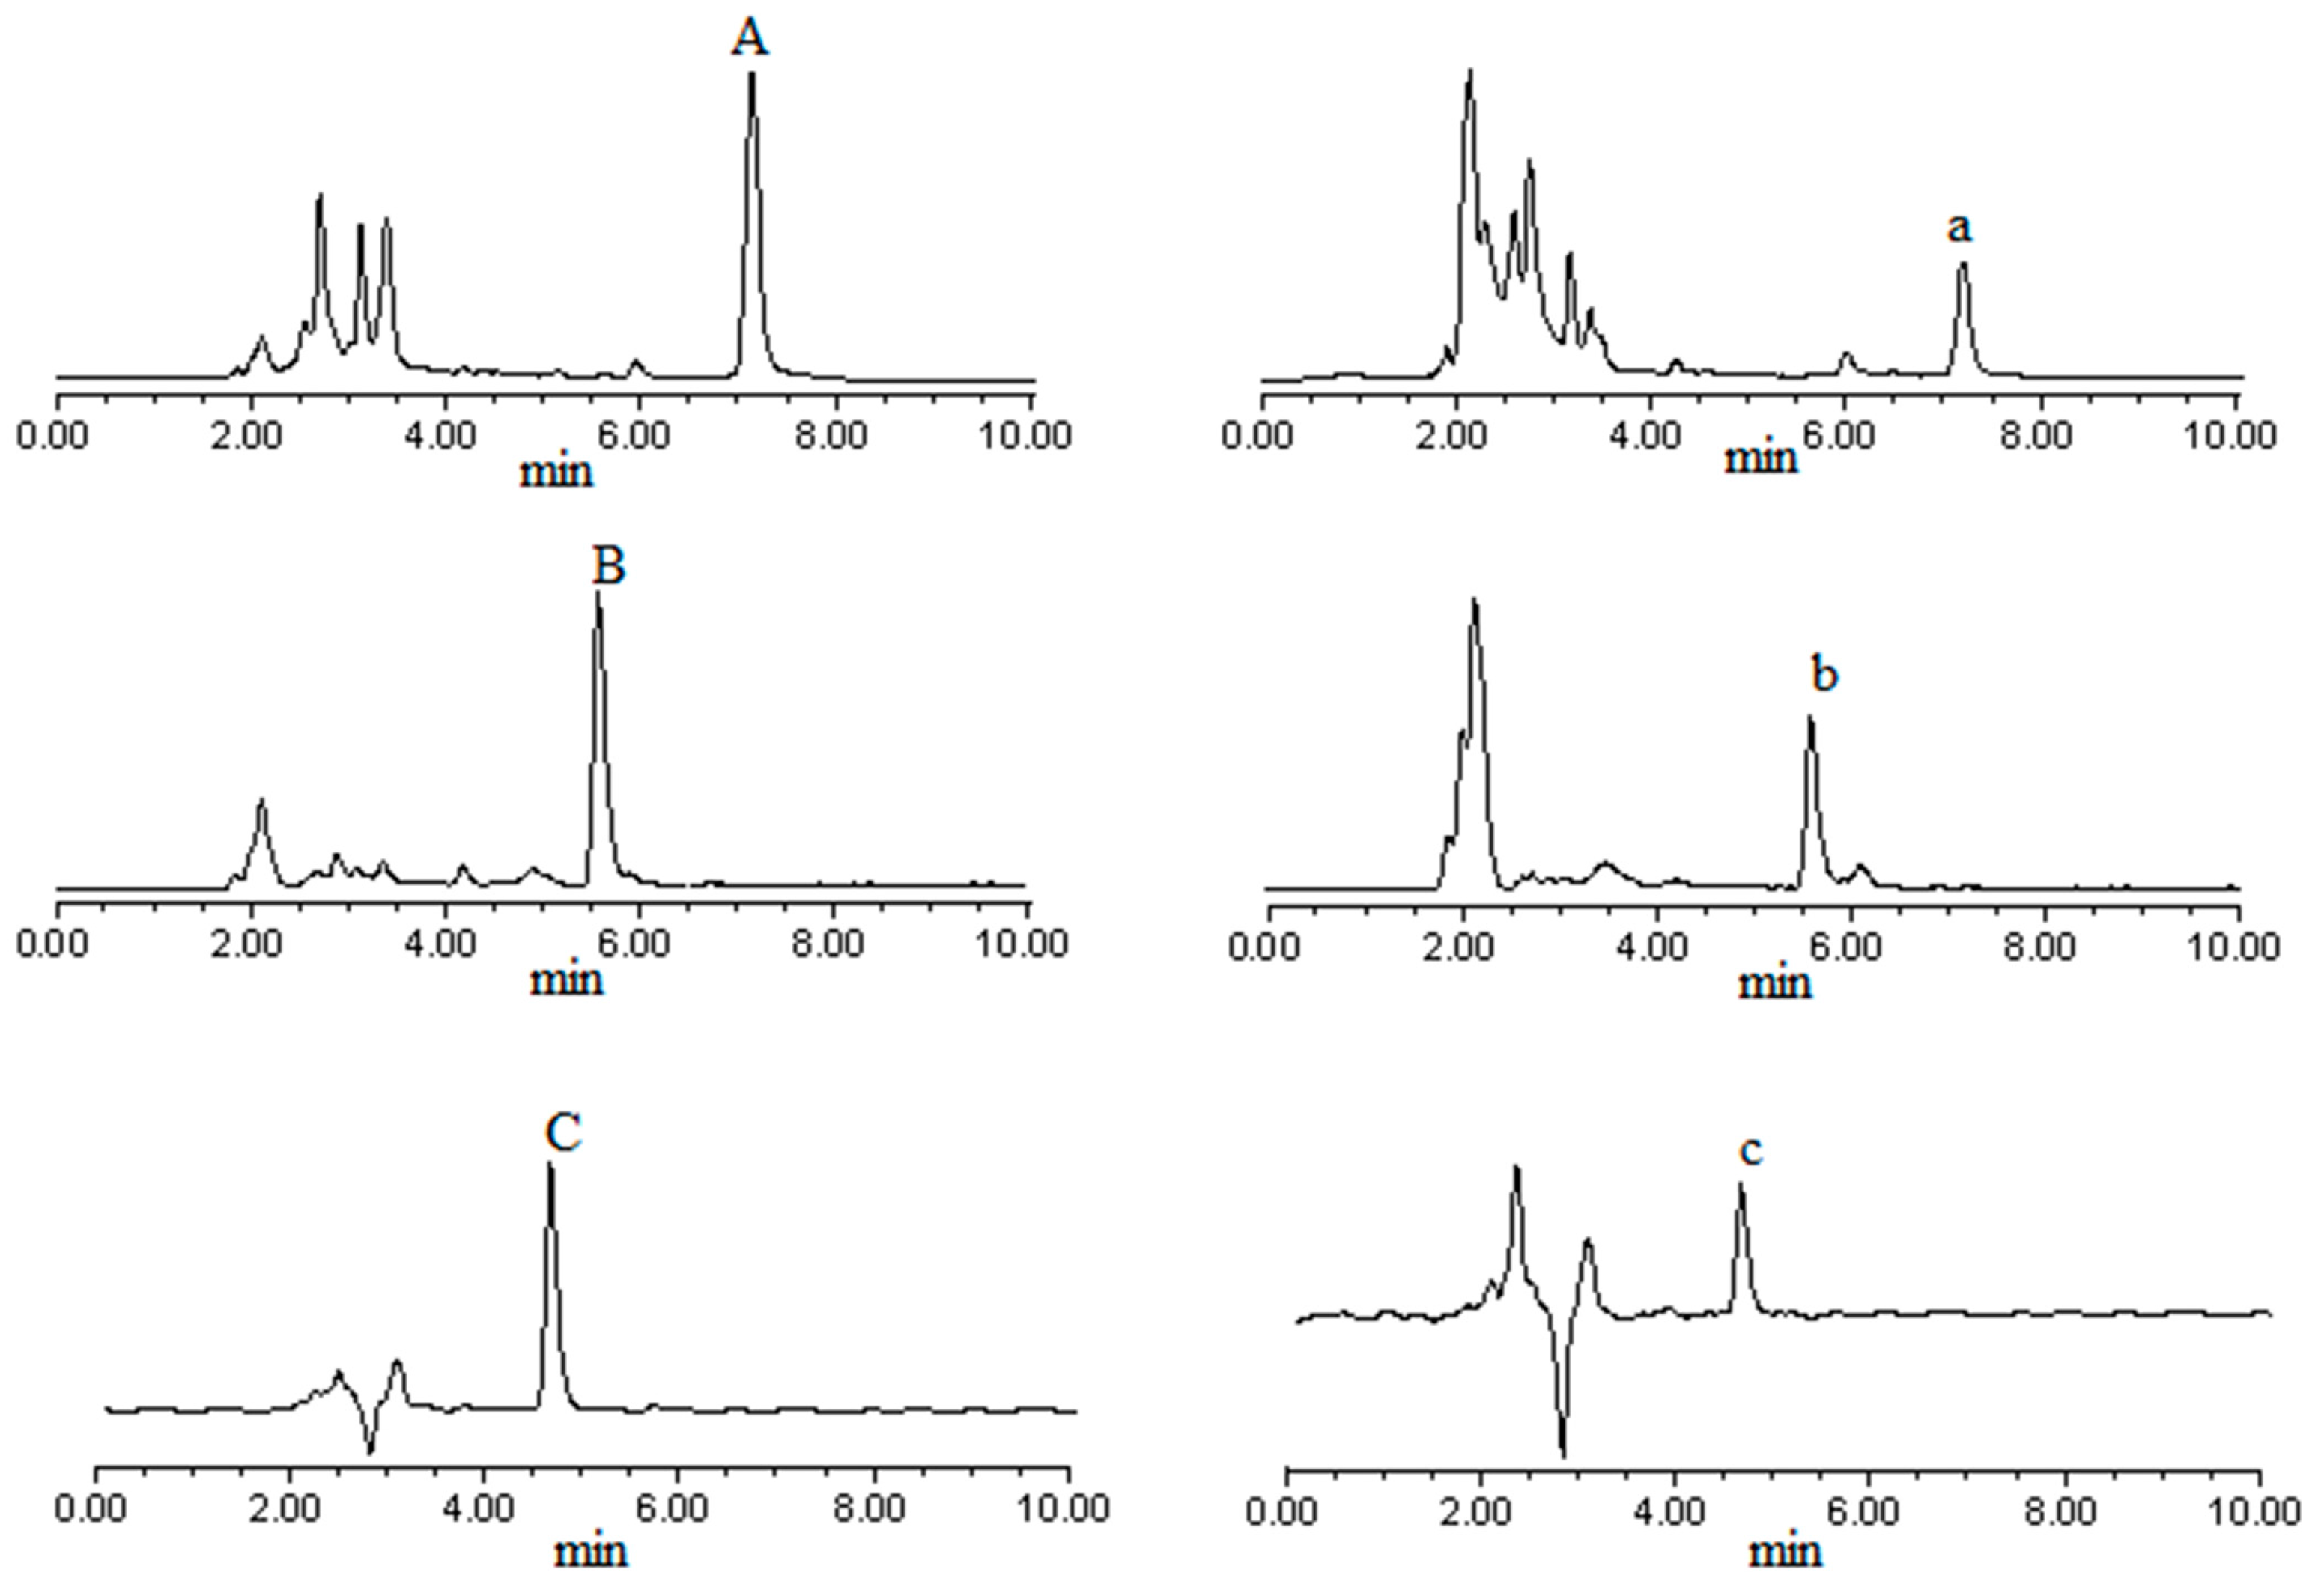
2.1.1. Validation of HPLC Analytical Method
2.1.2. Validation of Caco-2 Monolayer Model
2.1.3. Non-Toxic Dose Range of Test Compounds

| Compounds | Survival Rate: % | ||
|---|---|---|---|
| 25 μmol/L | 50 μmol/L | 100 μmol/L | |
| PA | 118.8 ± 11.6 | 110.5 ± 3.8 | 124.5 ± 2.2 |
| GA | 107.1 ± 5.7 | 118.9 ± 13.7 | 123.6 ± 6.2 |
| TS | 98.9 ± 4.3 | 107.3 ± 7.0 | 118.2 ± 8.1 |
| Paclitaxel | 67.3 ± 8.2 | 45.5 ± 6.7 | 37.4 ± 3.5 |
2.1.4. Transport of Test Compounds
| Concentration (μmol/L) | Papp AP→BL (×10−5 cm/s) | Papp BL→AP (×10−5 cm/s) | Pratio (Papp AP→BL/Papp BL→AP) | |
|---|---|---|---|---|
| PA | 25 | 3.17 ± 0.04 | 2.54 ± 0.22 | 1.25 |
| 50 | 2.80 ± 0.13 | 2.56 ± 0.19 | 1.1 | |
| 100 | 2.96 ± 0.11 | 2.59 ± 0.14 | 1.14 | |
| average | 2.98 ± 0.13 | 2.56 ± 0.18 | 1.16 | |
| GA | 25 | 2.14 ± 0.20 | 2.21 ± 0.08 | 0.96 |
| 50 | 1.59 ± 0.02 | 2.00 ± 0.07 | 0.8 | |
| 100 | 1.70 ± 0.12 | 1.94 ± 0.10 | 0.88 | |
| average | 1.81 ± 0.11 | 2.05 ± 0.08 | 0.88 | |
| TS | 25 | 0.86 ± 0.16 | 0.86 ± 0.04 | 1 |
| 50 | 1.06 ± 0.03 | 1.08 ± 0.06 | 0.98 | |
| 100 | 0.77 ± 0.09 | 0.80 ± 0.03 | 0.96 | |
| average | 0.89 ± 0.09 | 0.91 ± 0.04 | 0.98 | |
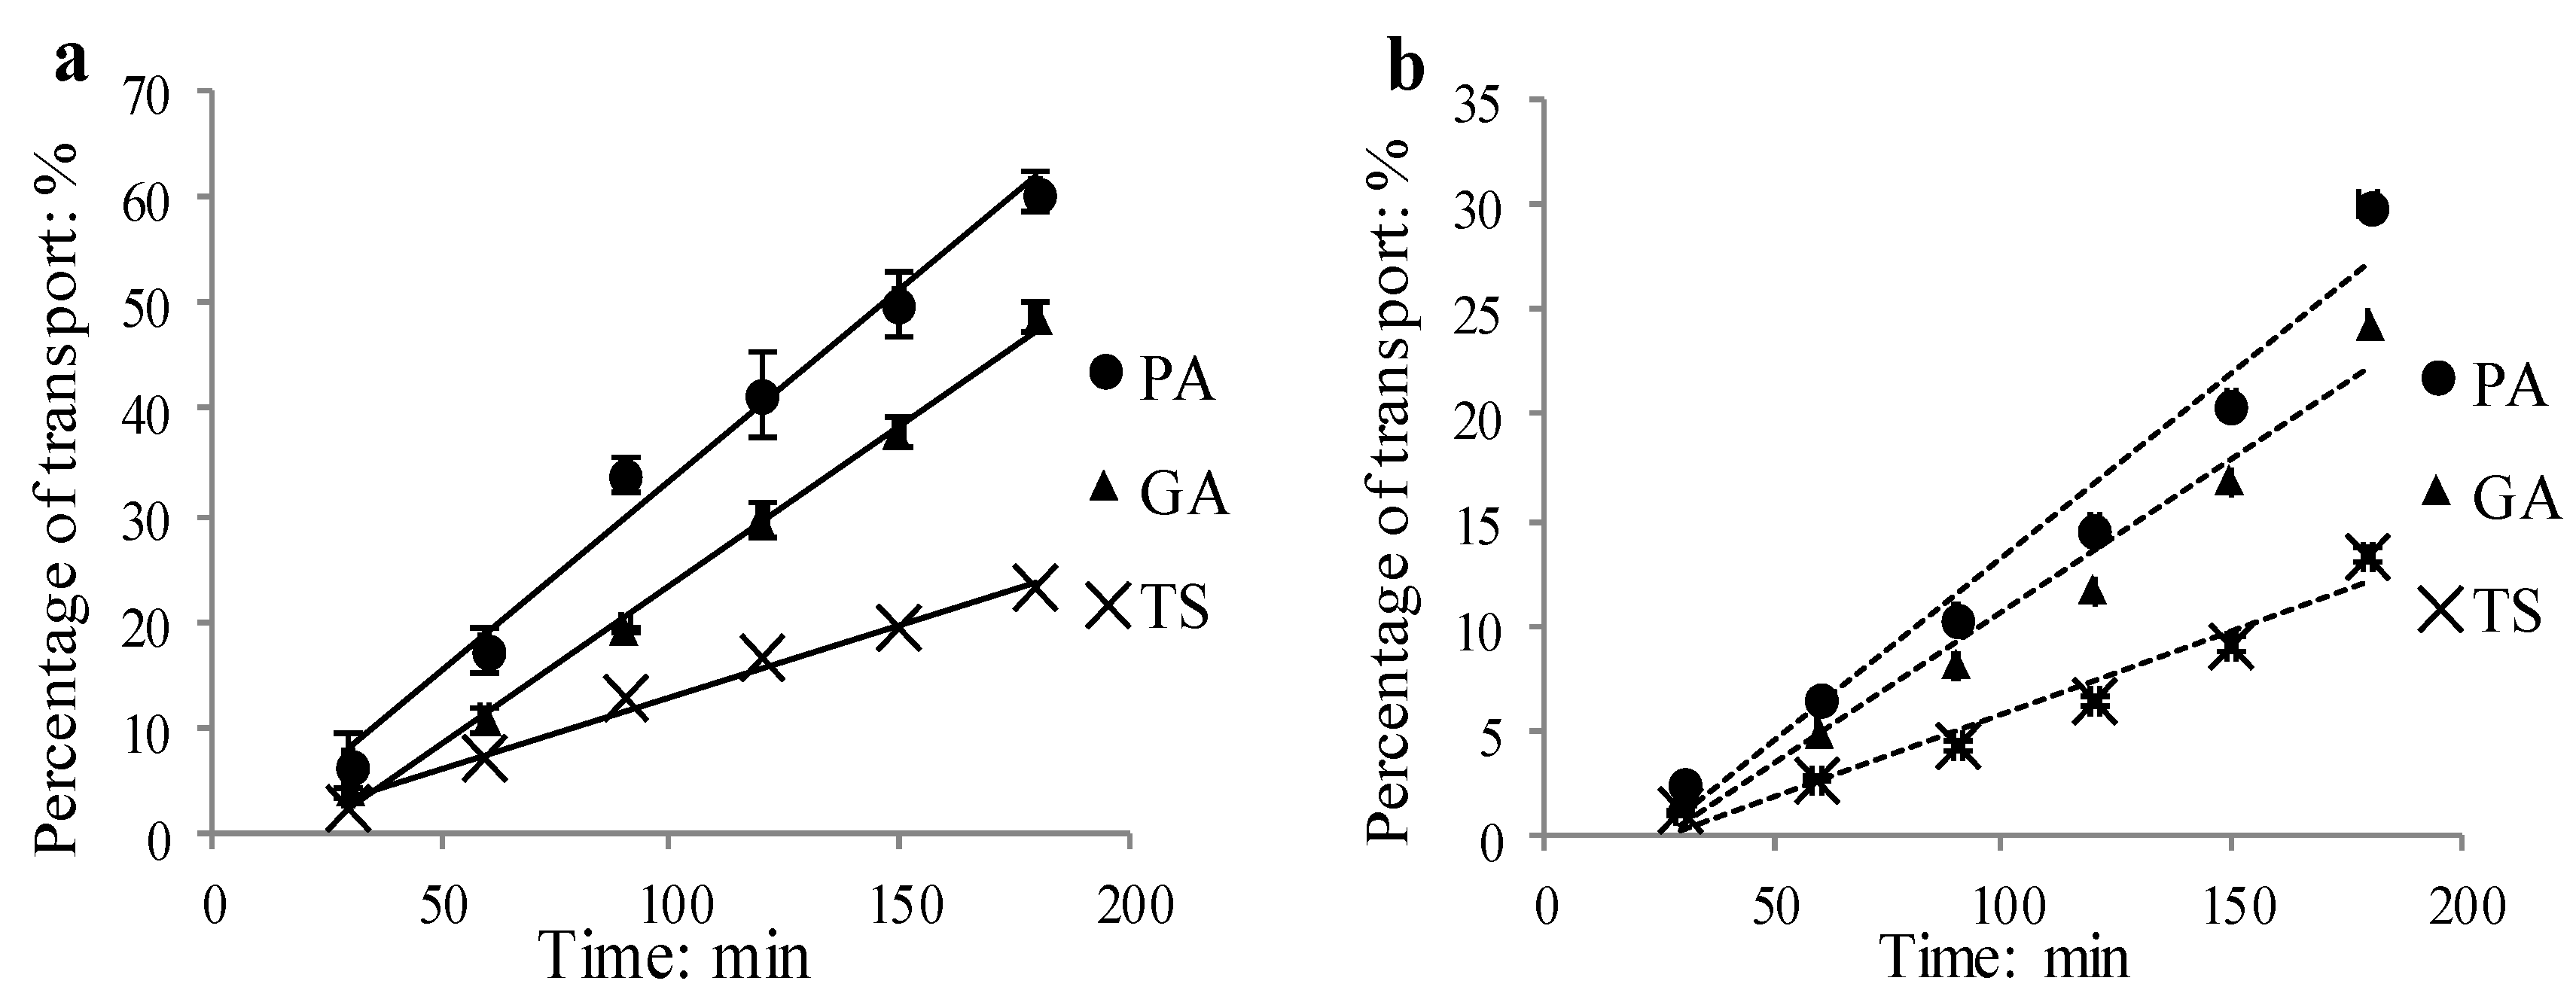
2.1.5. Time Course
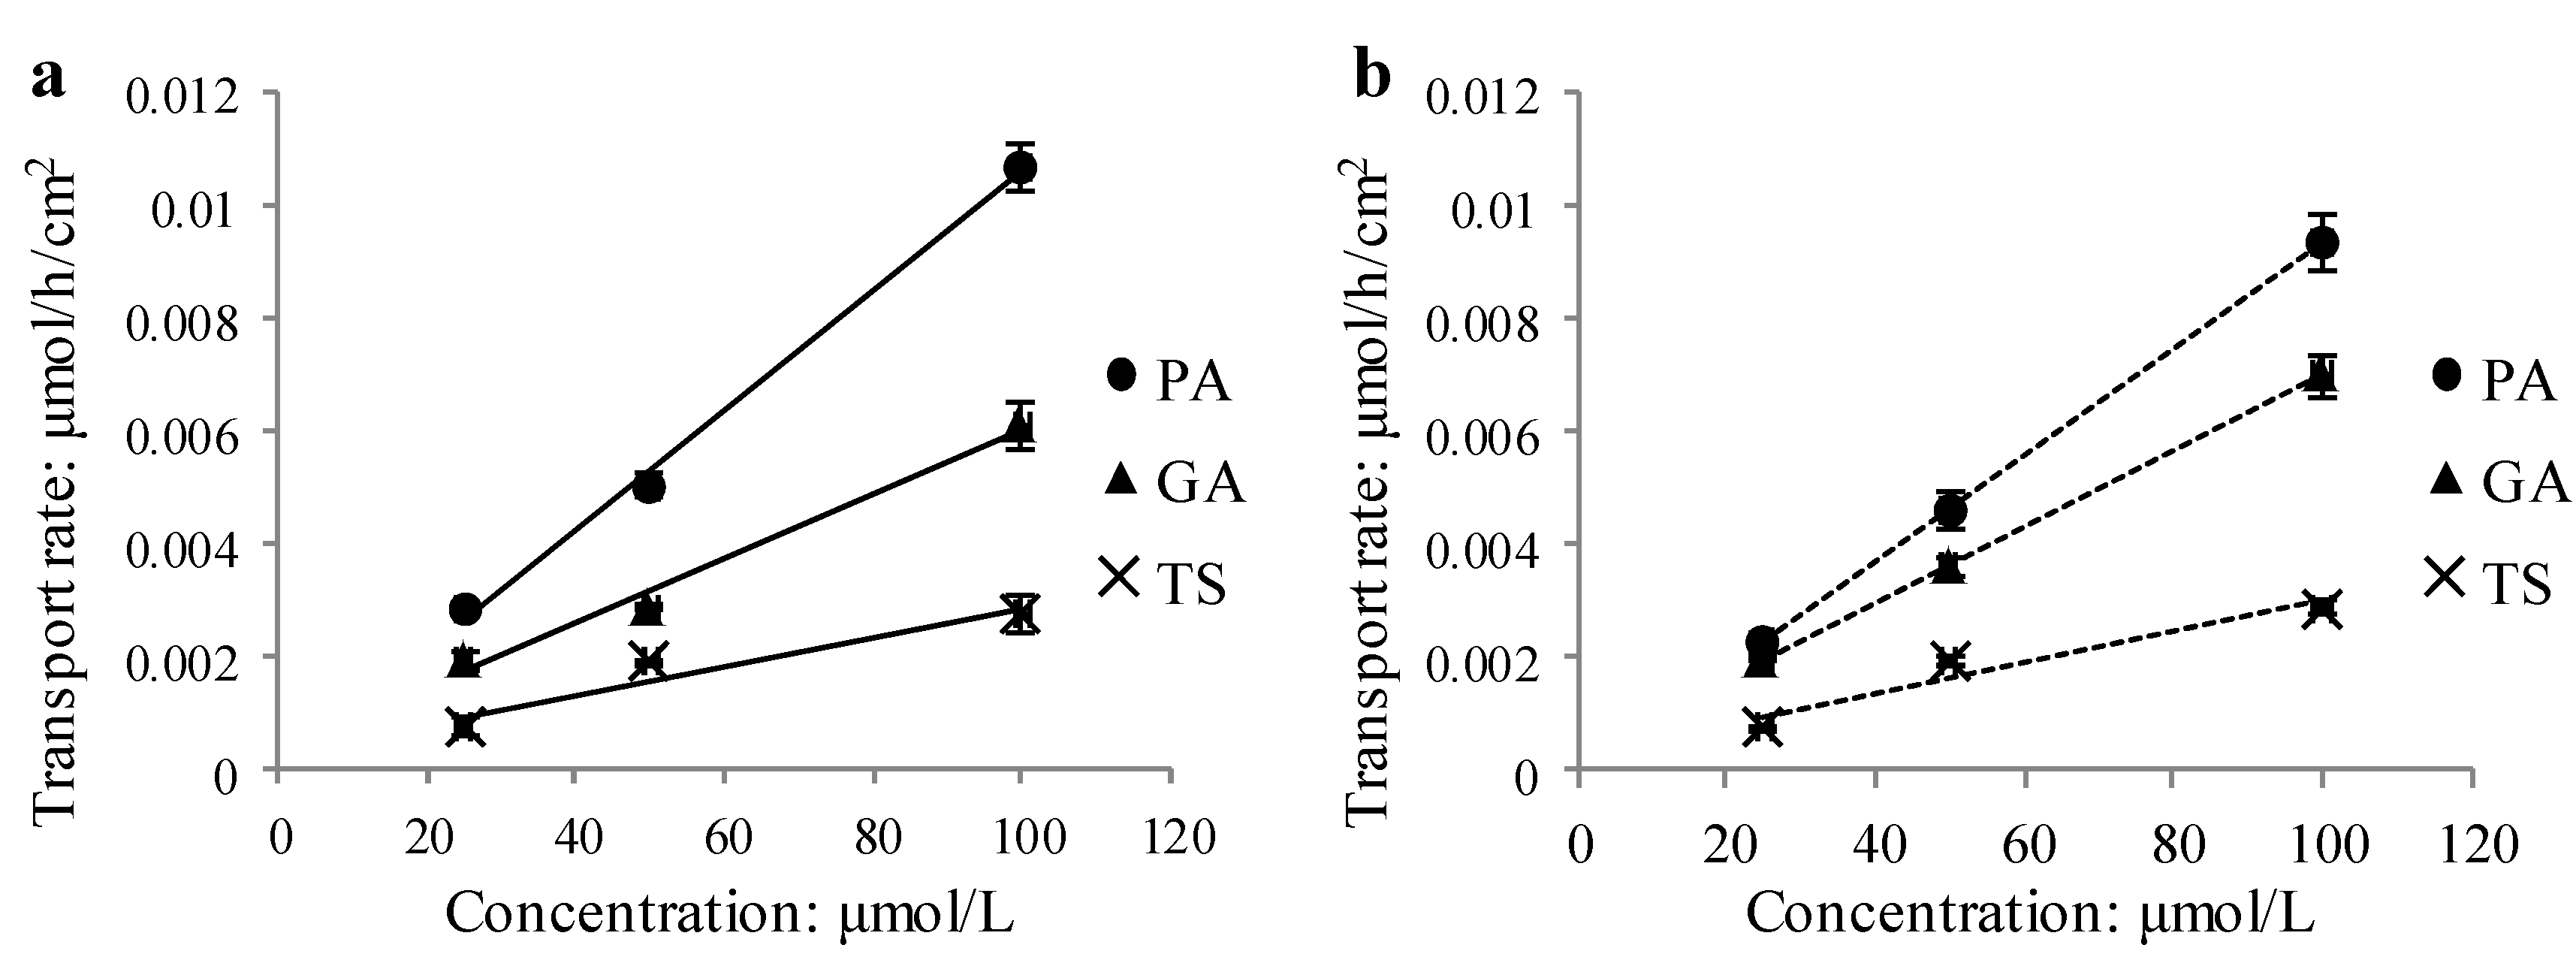
2.1.6. Concentration Dependence
2.1.7. Molecular Properties
| Compound | Molecular Mass | LogP | TPSA | Hd | Hr | R | V |
|---|---|---|---|---|---|---|---|
| PA | 236.26 | 2.67 | 66.761 | 2 | 4 | 4 | 0 |
| GA | 236.26 | 2.27 | 55.767 | 1 | 4 | 2 | 0 |
| TS | 398.4 | 0.83 | 145.913 | 5 | 9 | 7 | 0 |
2.2. Discussion
3. Experimental
3.1. General
3.2. Plant Material
3.3. Extraction and Isolation of GA, PA and TS
3.4. Cell Culture
3.5. MTT Assay
3.6. Cell Differentiation
3.7. Transport Experiment
3.8. HPLC Analysis
3.8.1. Chromatographic Condition
3.8.2. Linearity, Precision and Stability
3.9. Calculation of Molecular Properties
3.10. Data Analysis
4. Conclusions
Acknowledgments
Author Contributions
Conflicts of Interest
References
- Wang, R.F.; Yang, X.W.; Ma, C.M.; Liu, H.Y.; Shang, M.Y.; Zhang, Q.Y.; Cai, S.Q.; Park, J. Trollioside, a new compound from the flowers of Trollius chinensis. J. Asian Nat. Prod. Res. 2004, 6, 139–144. [Google Scholar]
- Liu, Y.; Wang, R.F.; Yuan, M.; An, Y.N.; Wu, X.W. HPLC Assay of trollioside in flowers of Trollius chinensis. Chin. J. Exp. Tradit. Med. Formulae 2012, 18, 73–75. [Google Scholar]
- Yuan, M.; Wang, R.F.; Wu, X.W.; An, Y.N.; Yang, X. Investigation on Flos Trollii: Constituents and bioactivities. Chin. J. Nat. Med. 2013, 11, 1–7. [Google Scholar]
- Li, Y.L.; Ma, S.C.; Yang, Y.T.; Ye, S.M.; But, P.P. Antiviral activities of flavonoids and organic acid from Trollius chinensis Bunge. J. Ethnopharmacol. 2002, 79, 365–368. [Google Scholar]
- Yuan, M. The Transformation Production of the Constituents in the Flowers of Trollius Chinensis by Human Intestinal Bacteria and Their Antibacterial Activity. Master thesis, Beijing University of Chinese Medicine, Beijing, China, 2013. [Google Scholar]
- Li, Q.F.; Feng, S.Q.; Li, Y.L.; Cen, Y.Z.; Yang, Y.T.; Wang, L.Y. Study on the antibacterial and antiviral activity compositions of Trollius chinensis Bunge. J. Zhejiang Univ. (Sci. Ed.) 2004, 31, 412–415. [Google Scholar]
- Wang, R.F. The Constituents and Bioactivities of Jinlianhua and Pangdahai. Doctoral Thesis, Peking University, Bejing, China, 2003. [Google Scholar]
- Yang, X.W.; Yang, X.D.; Wang, Y.; Ma, L.; Zhang, Y.; Yang, X.G.; Wang, K. Establishment of Caco-2 cell monolayer model and standard operation procedure for assessing intestinal absorption of chemical components of traditional Chinese medicine. J. Chin. Integr. Med. 2007, 5, 634–641. [Google Scholar]
- Artursson, P.; Karlsson, J. Correlation between oral drug absorption in humans and apparent drug permeability coefficients in human intestinal epithelial (Caco-2) cells. Biochem. Biophys. Res. Commun. 1991, 175, 880–885. [Google Scholar]
- Yee, S.Y. In vitro permeability across Caco-2 cells (colonic) can predict in vivo (small intestinal) absorption in man-fact or myth. Pharm. Res. 1997, 14, 763–766. [Google Scholar]
- Kerns, E.H.; Di, L. Drug-like Properties: Concepts,Structural Design and Methods; Science Press: Beijing, China, 2011; pp. 33–41. [Google Scholar]
- Sample Availability: Samples of the compounds PA, GA and TS are available from the authors.
© 2014 by the authors. Licensee MDPI, Basel, Switzerland. This article is an open access article distributed under the terms and conditions of the Creative Commons Attribution license ( http://creativecommons.org/licenses/by/4.0/).
Share and Cite
Wu, X.-W.; Wang, R.-F.; Liu, L.-J.; Guo, L.-N.; Zhao, C. Absorbability, Mechanism and Structure-Property Relationship of Three Phenolic Acids from the Flowers of Trollius chinensis. Molecules 2014, 19, 18129-18138. https://doi.org/10.3390/molecules191118129
Wu X-W, Wang R-F, Liu L-J, Guo L-N, Zhao C. Absorbability, Mechanism and Structure-Property Relationship of Three Phenolic Acids from the Flowers of Trollius chinensis. Molecules. 2014; 19(11):18129-18138. https://doi.org/10.3390/molecules191118129
Chicago/Turabian StyleWu, Xiu-Wen, Ru-Feng Wang, Li-Jia Liu, Li-Na Guo, and Can Zhao. 2014. "Absorbability, Mechanism and Structure-Property Relationship of Three Phenolic Acids from the Flowers of Trollius chinensis" Molecules 19, no. 11: 18129-18138. https://doi.org/10.3390/molecules191118129
APA StyleWu, X.-W., Wang, R.-F., Liu, L.-J., Guo, L.-N., & Zhao, C. (2014). Absorbability, Mechanism and Structure-Property Relationship of Three Phenolic Acids from the Flowers of Trollius chinensis. Molecules, 19(11), 18129-18138. https://doi.org/10.3390/molecules191118129