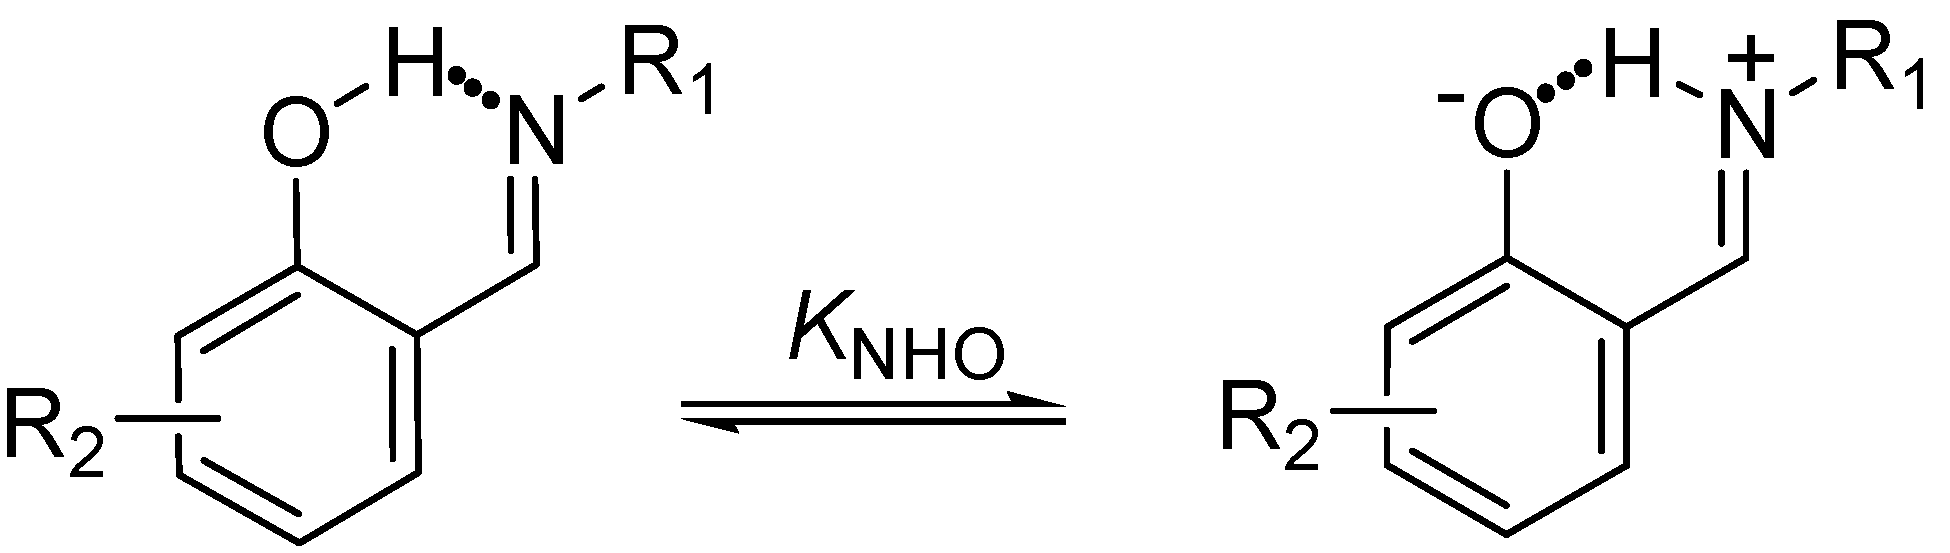
NMR Structural Study of the Prototropic Equilibrium in Solution of Schiff Bases as Model Compounds

 , ,
, , 
Abstract
: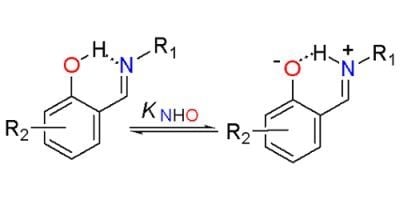
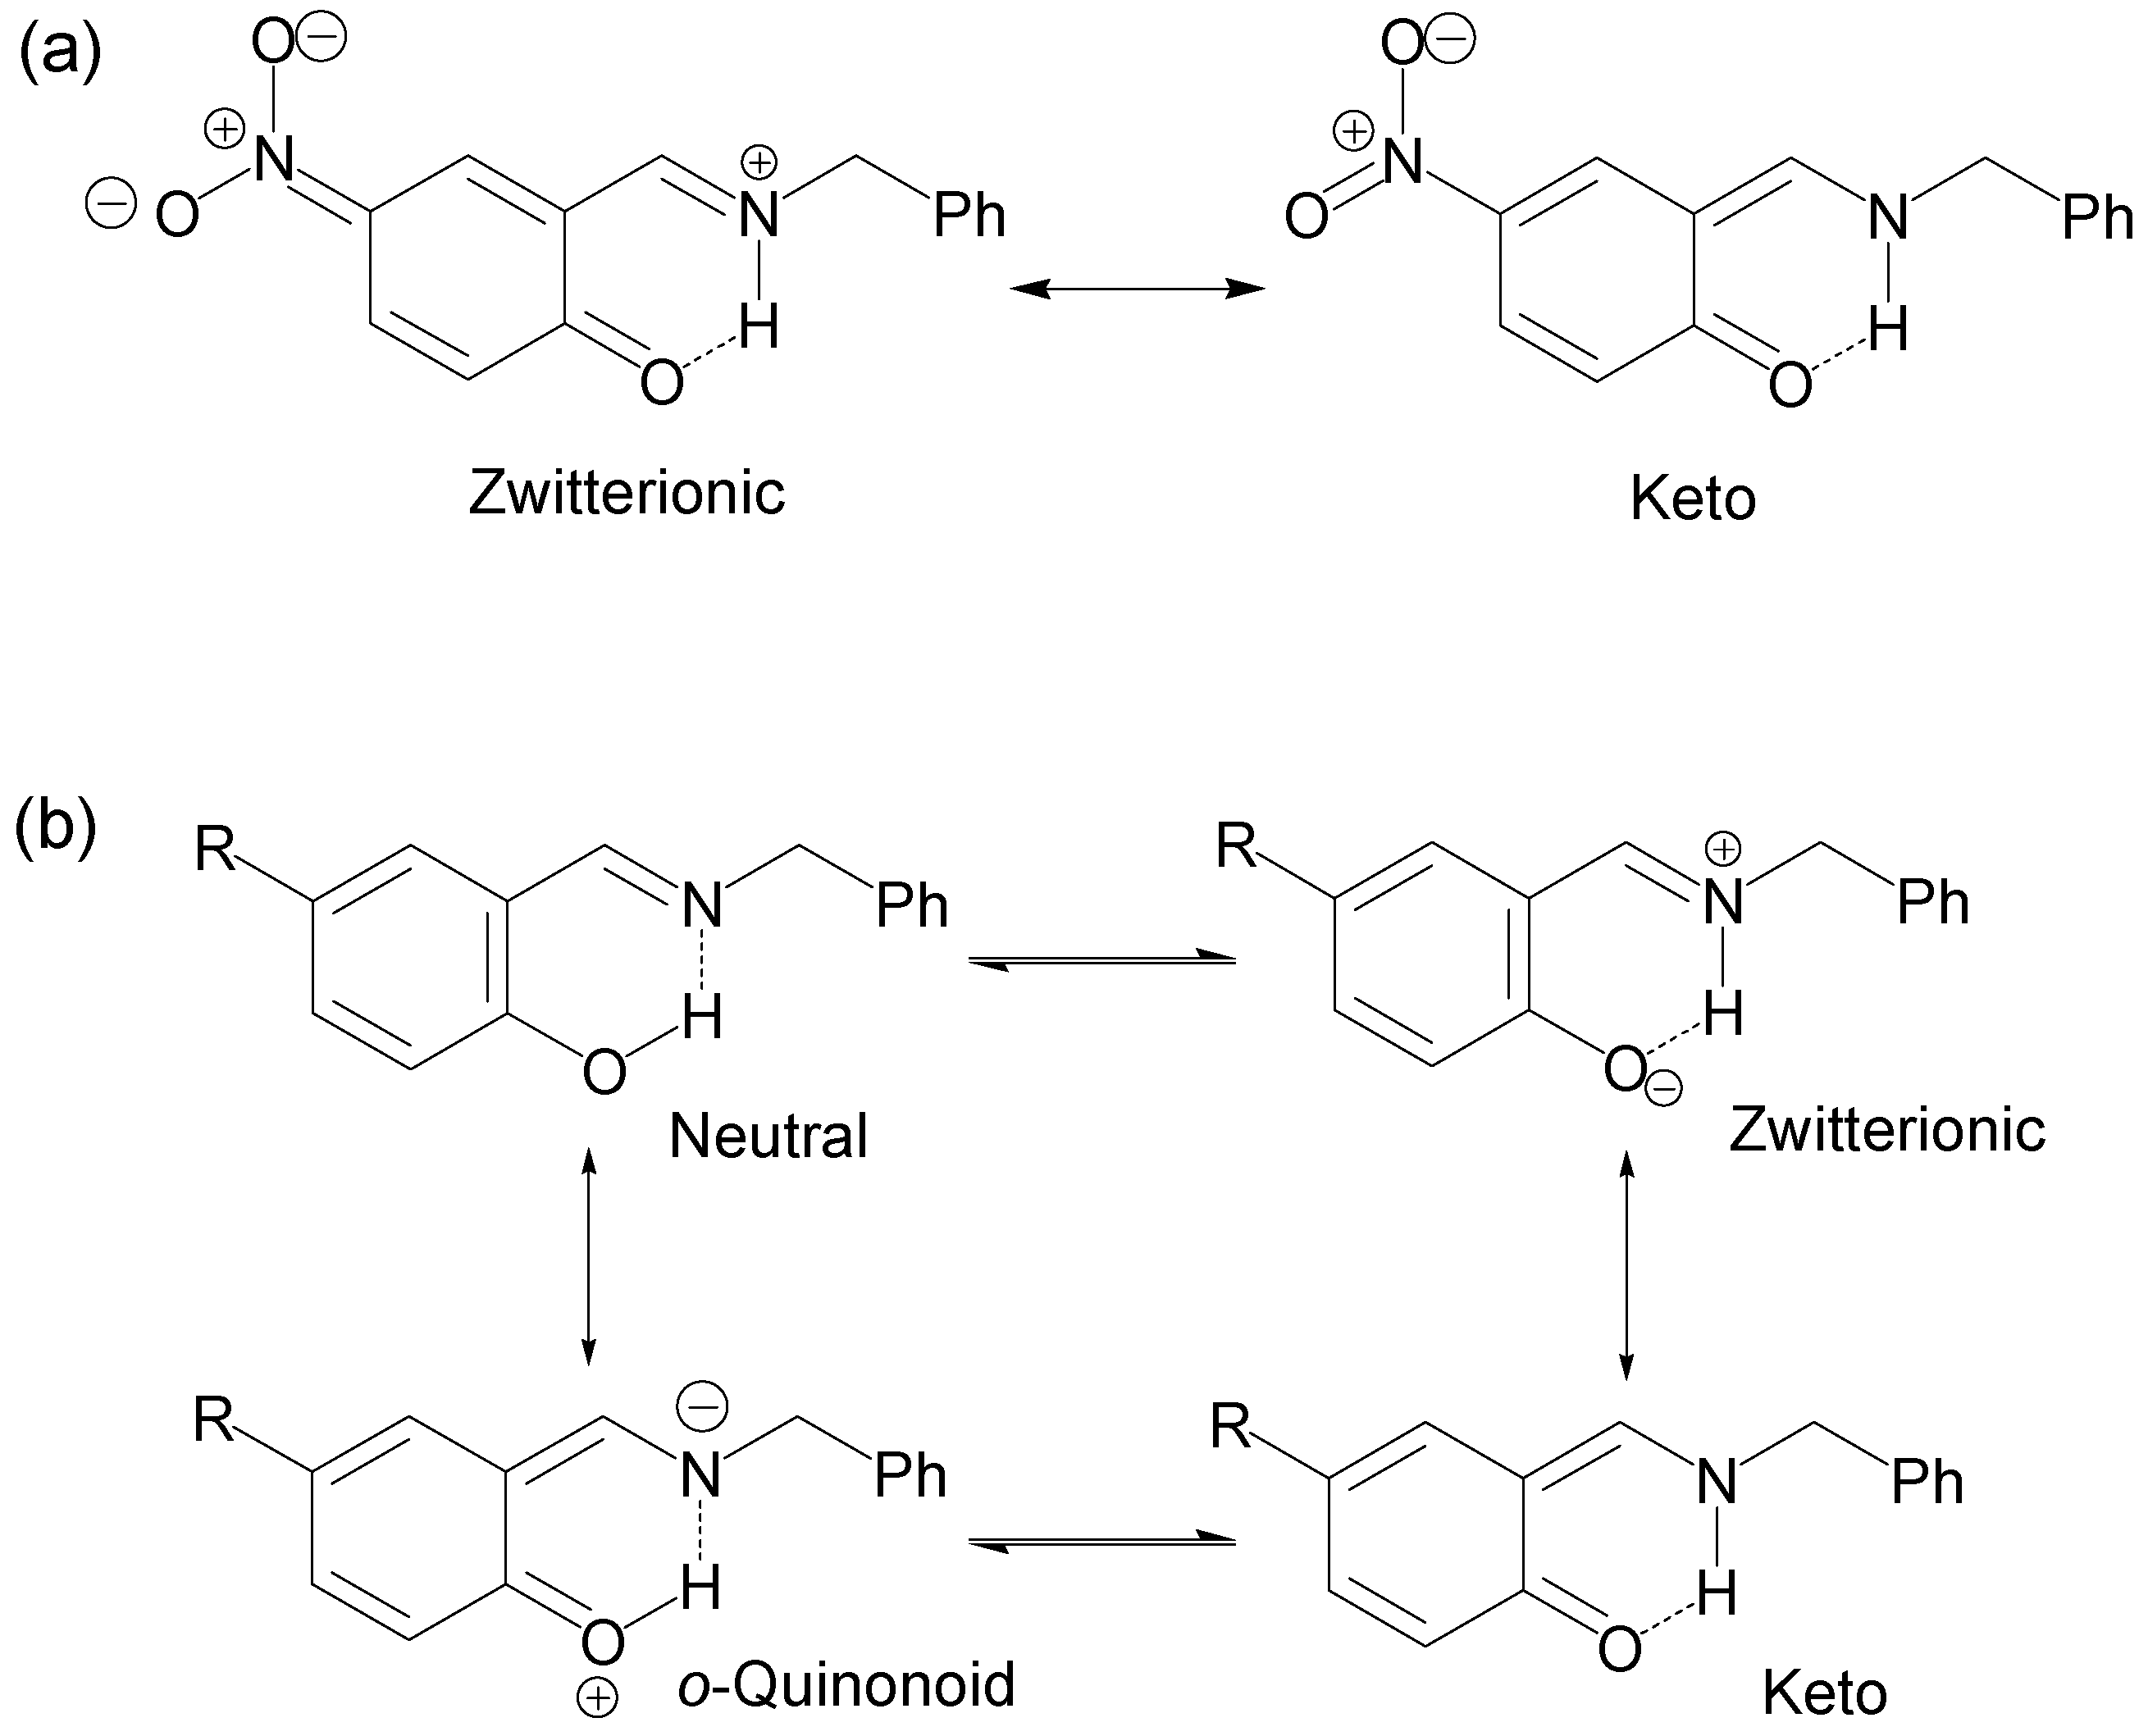
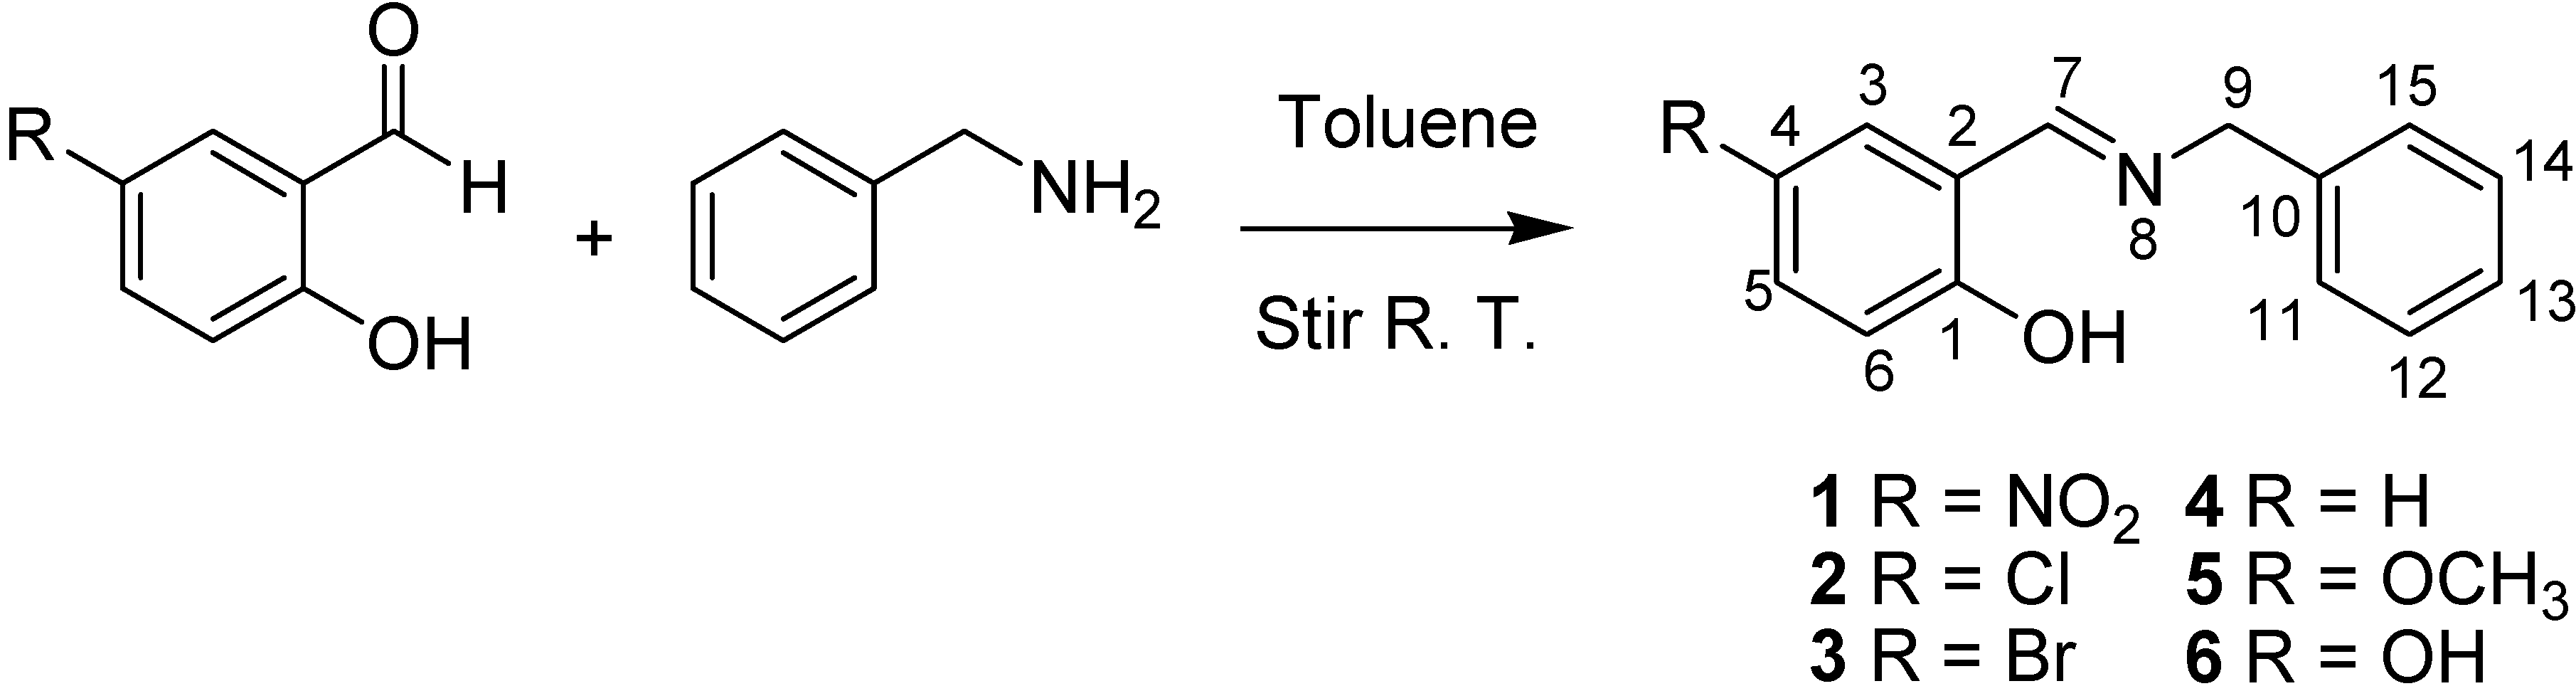
1. Introduction
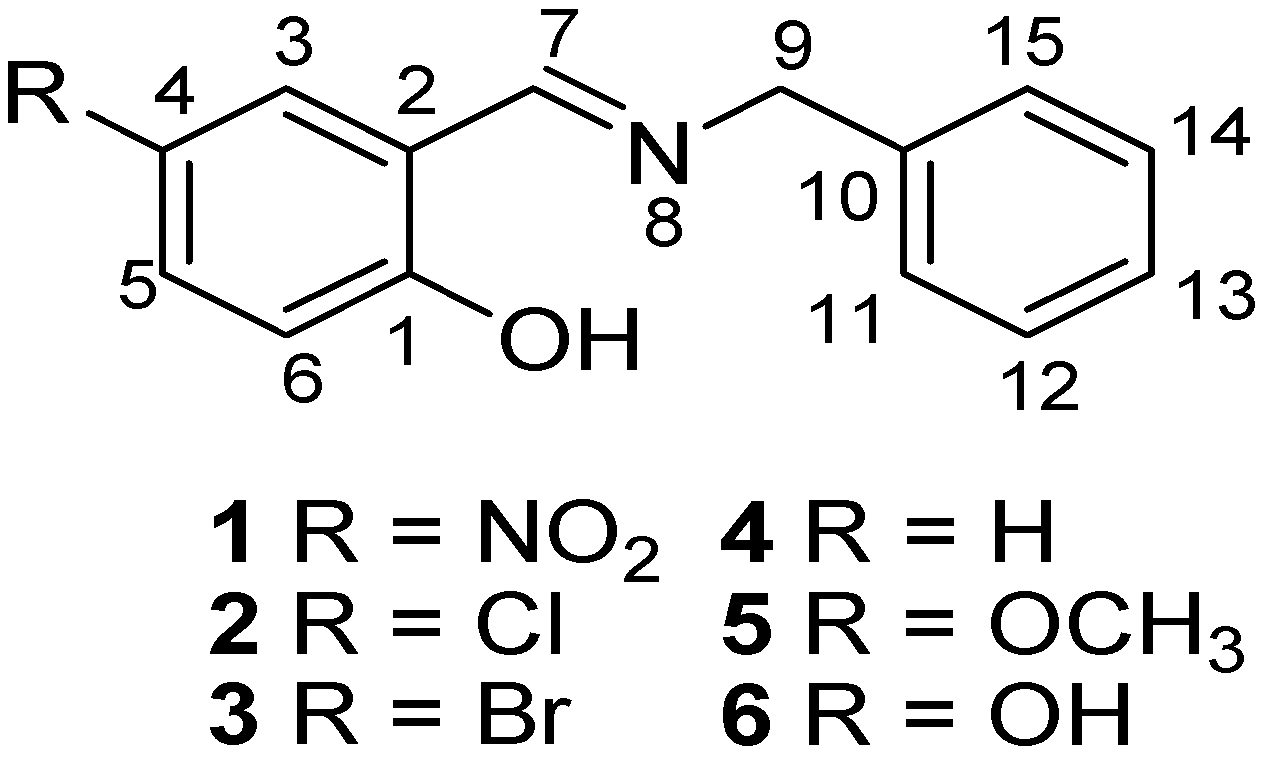
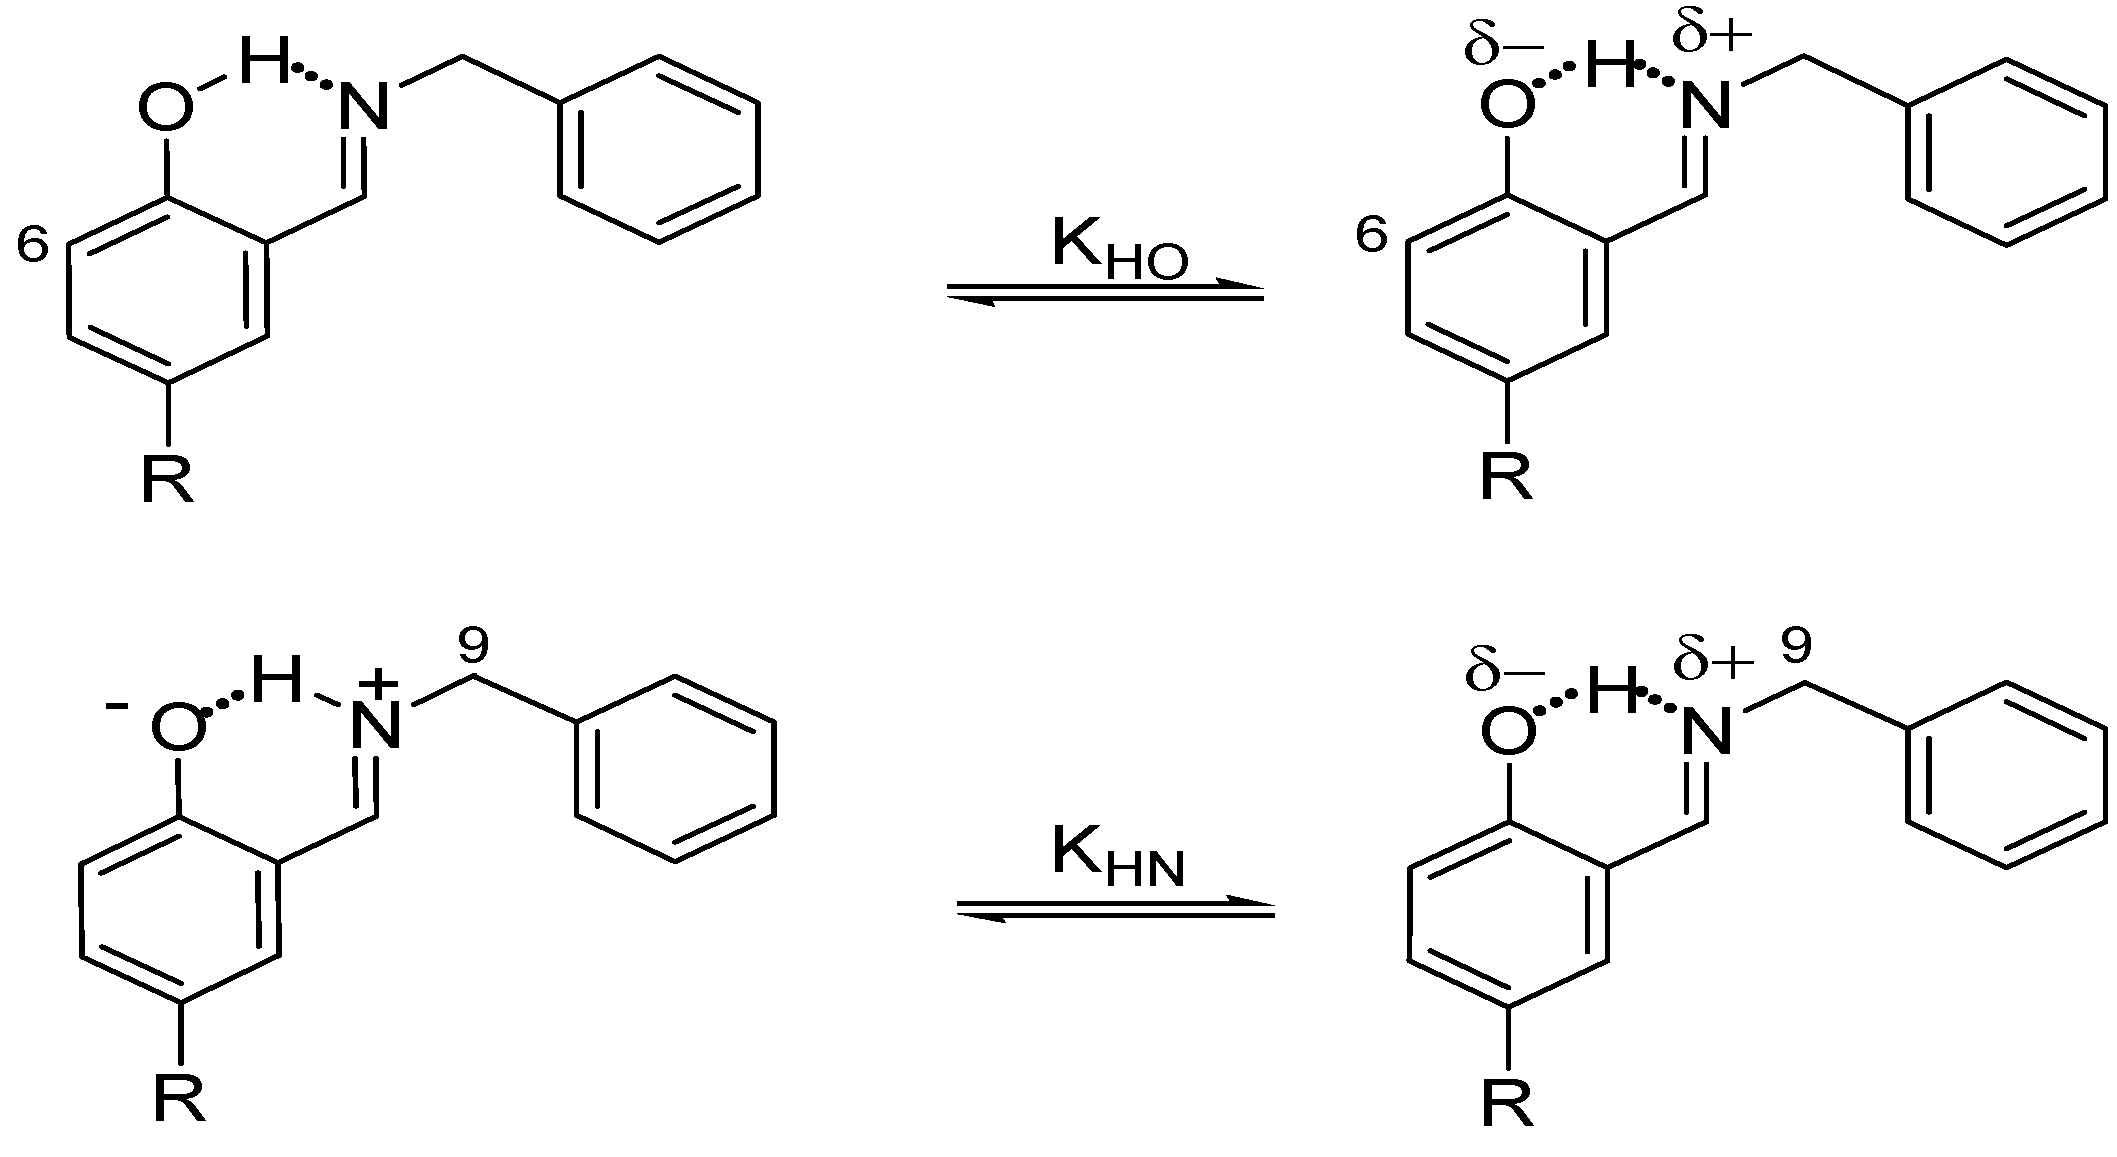
2. Results and Discussion
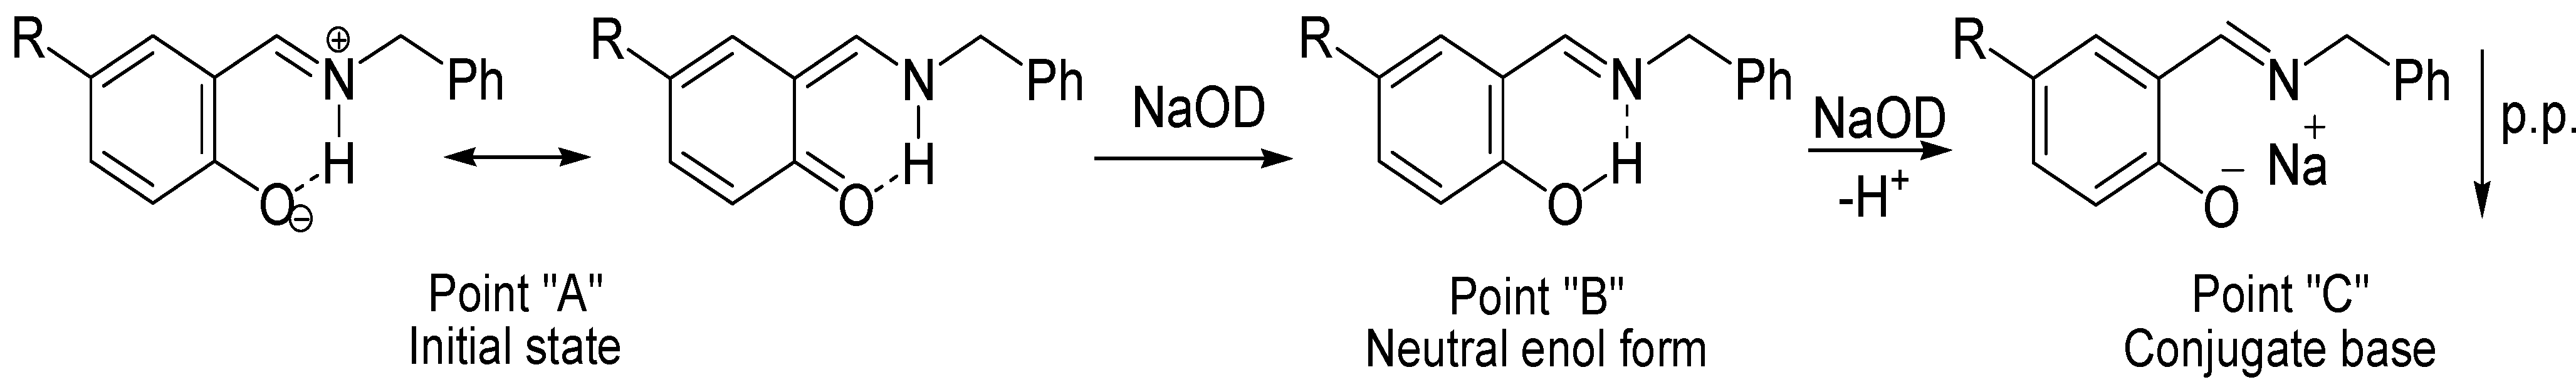
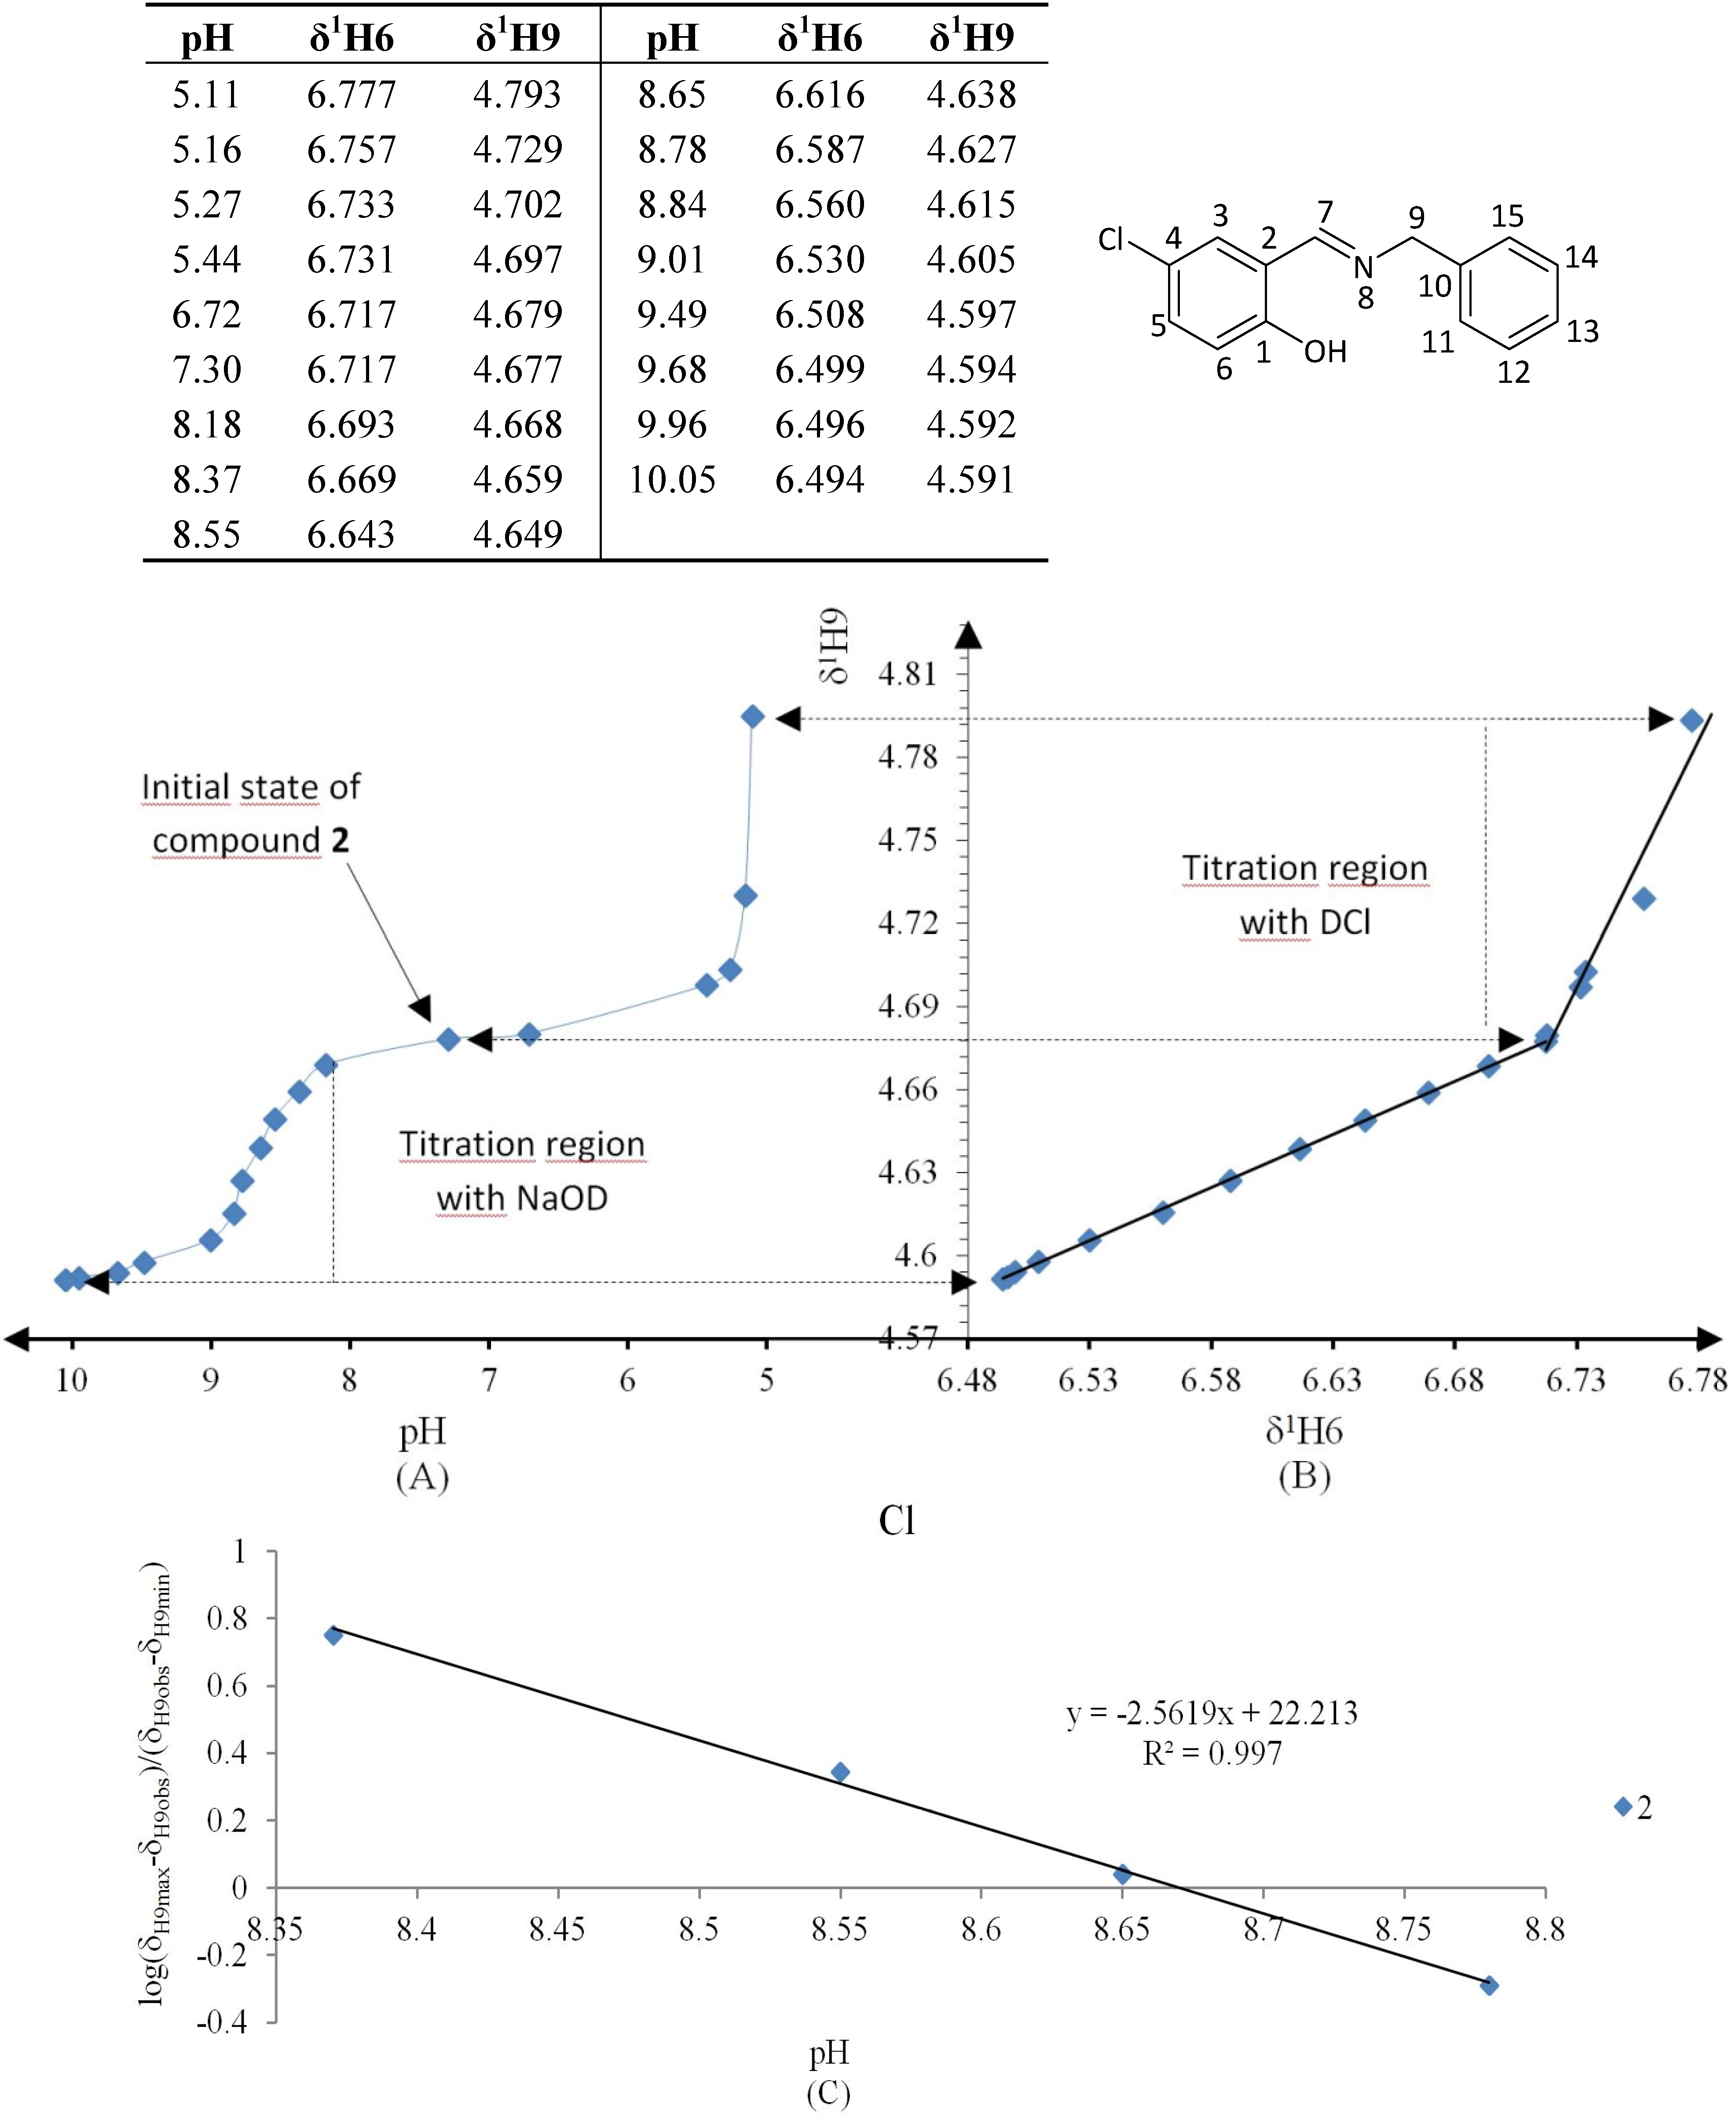
2.1. NMR Spectra

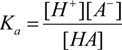
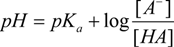
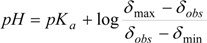
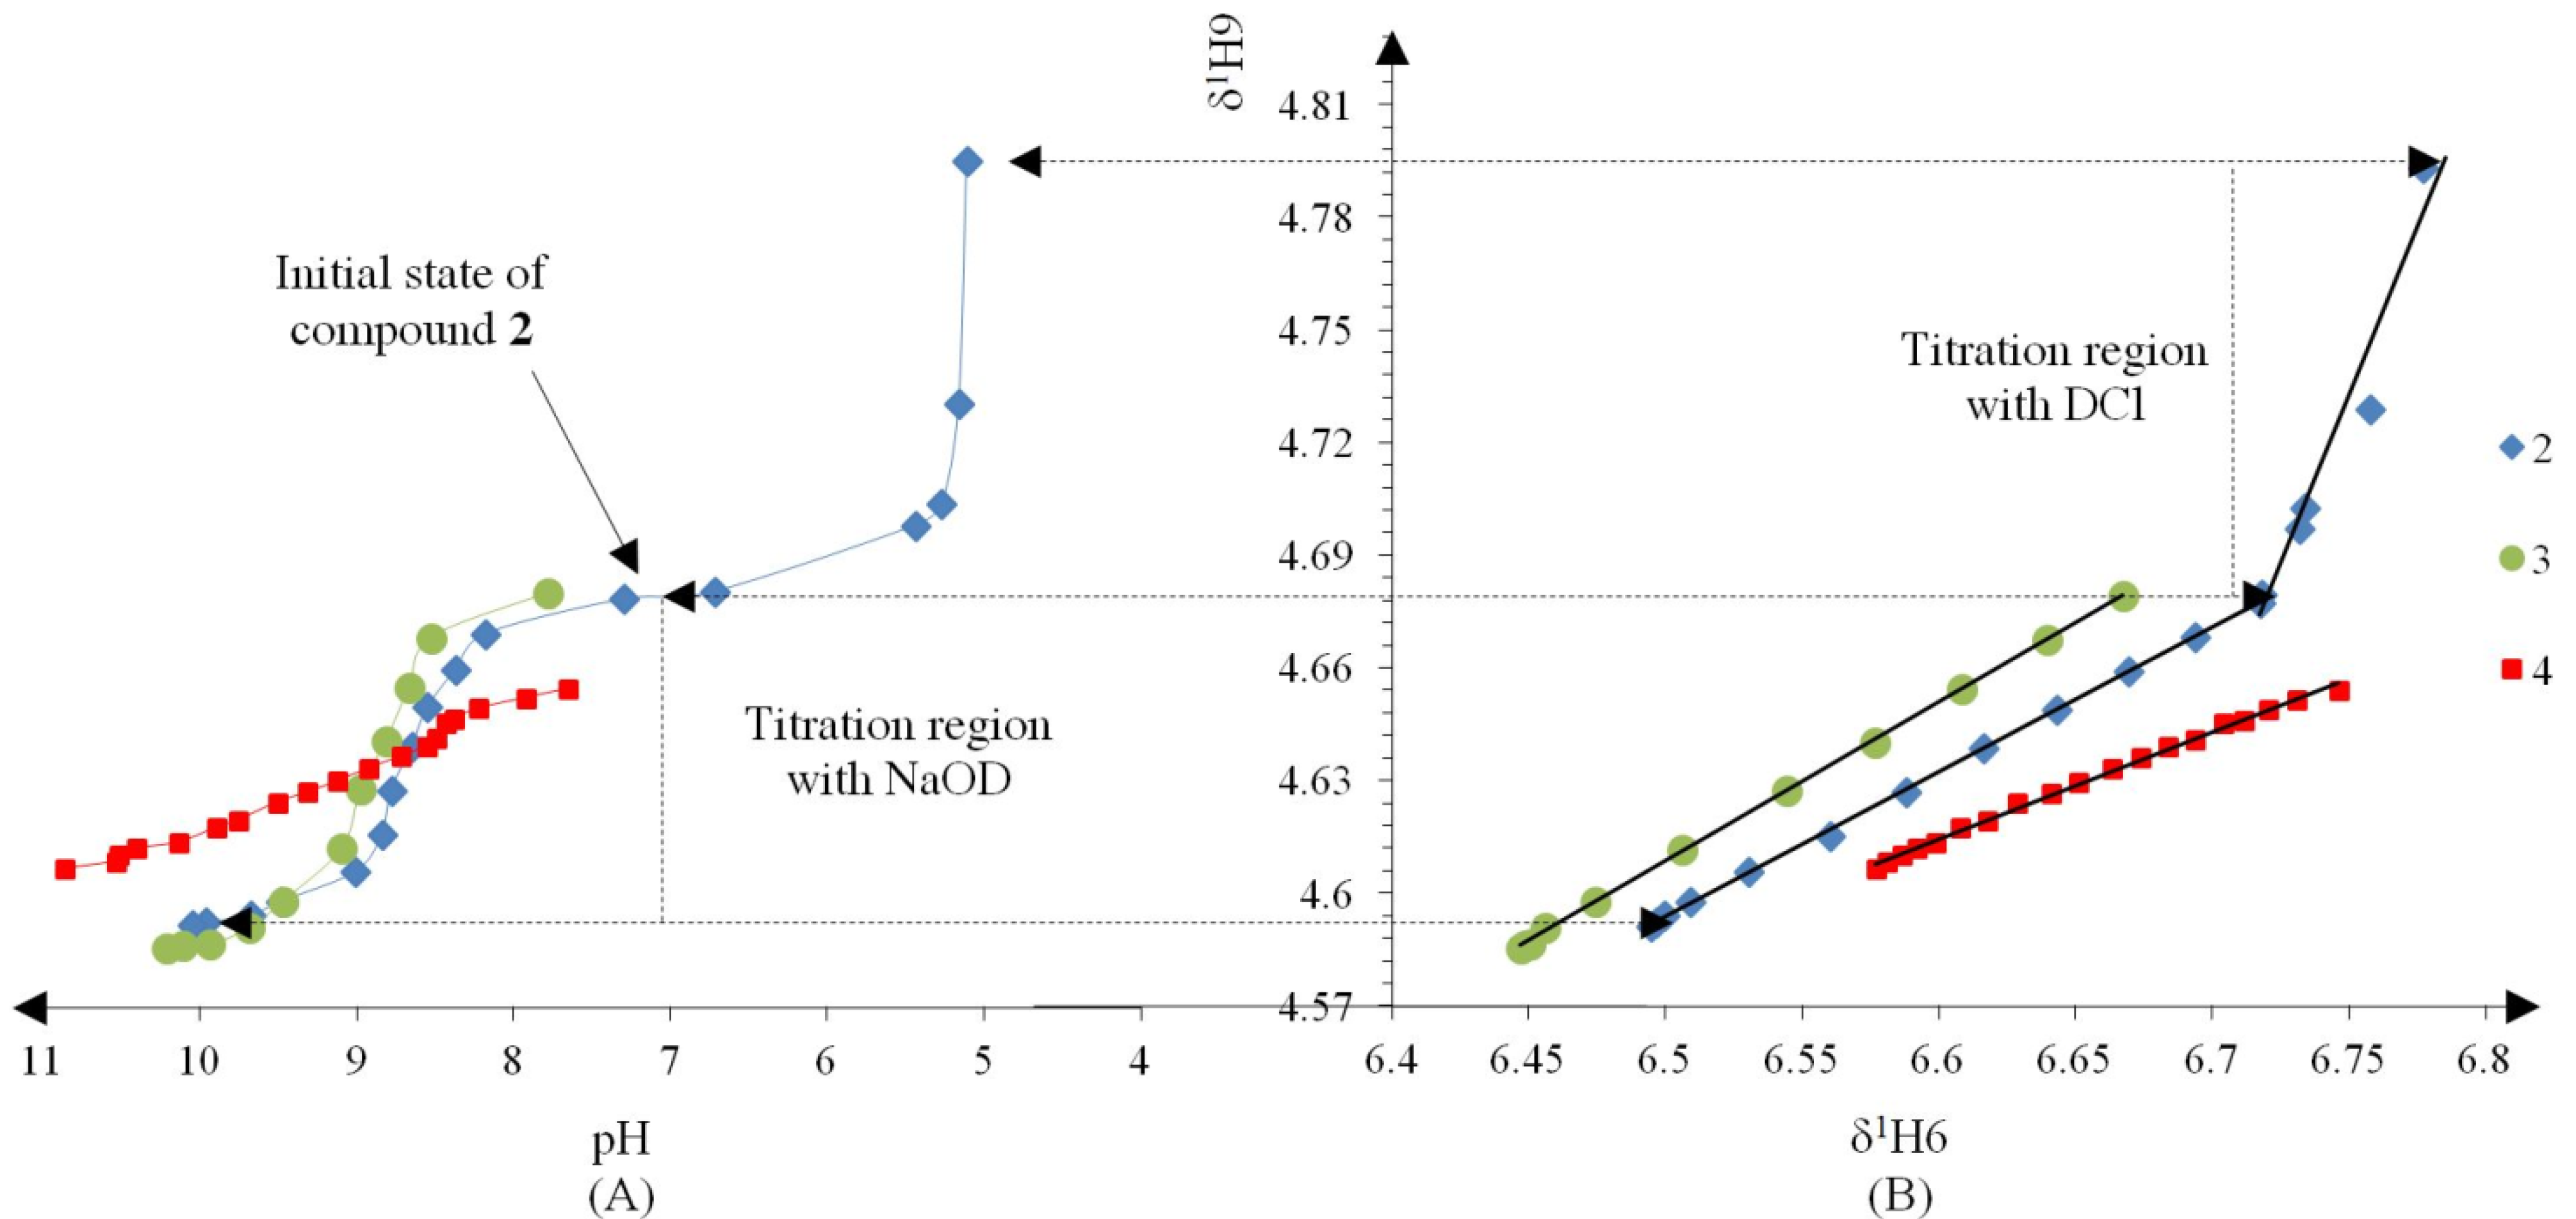
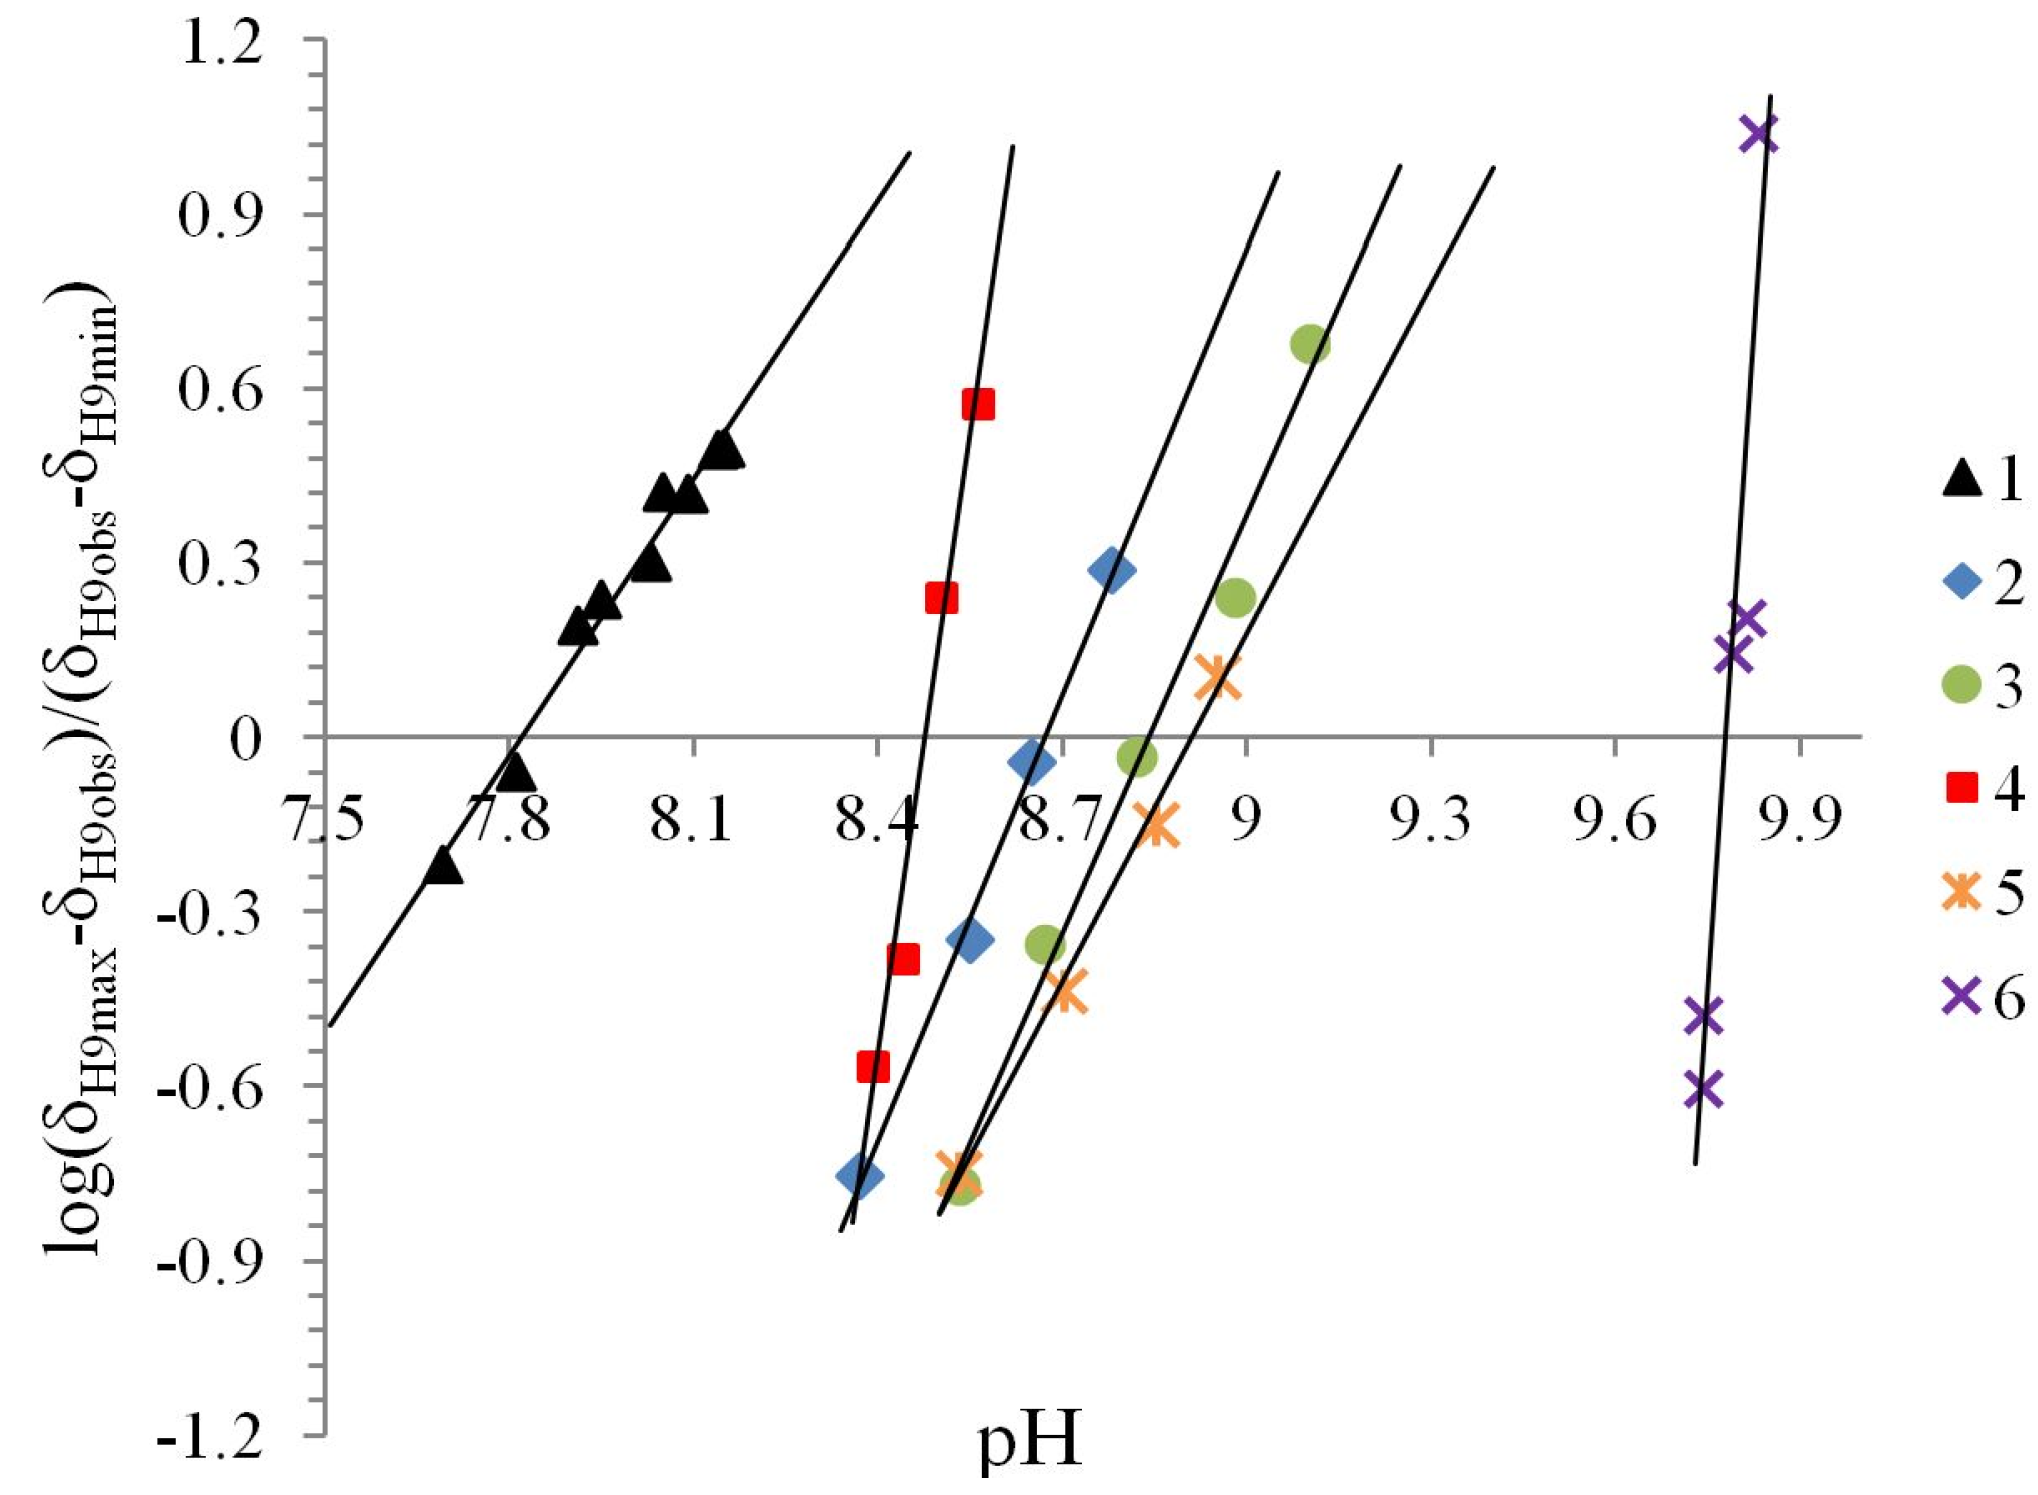
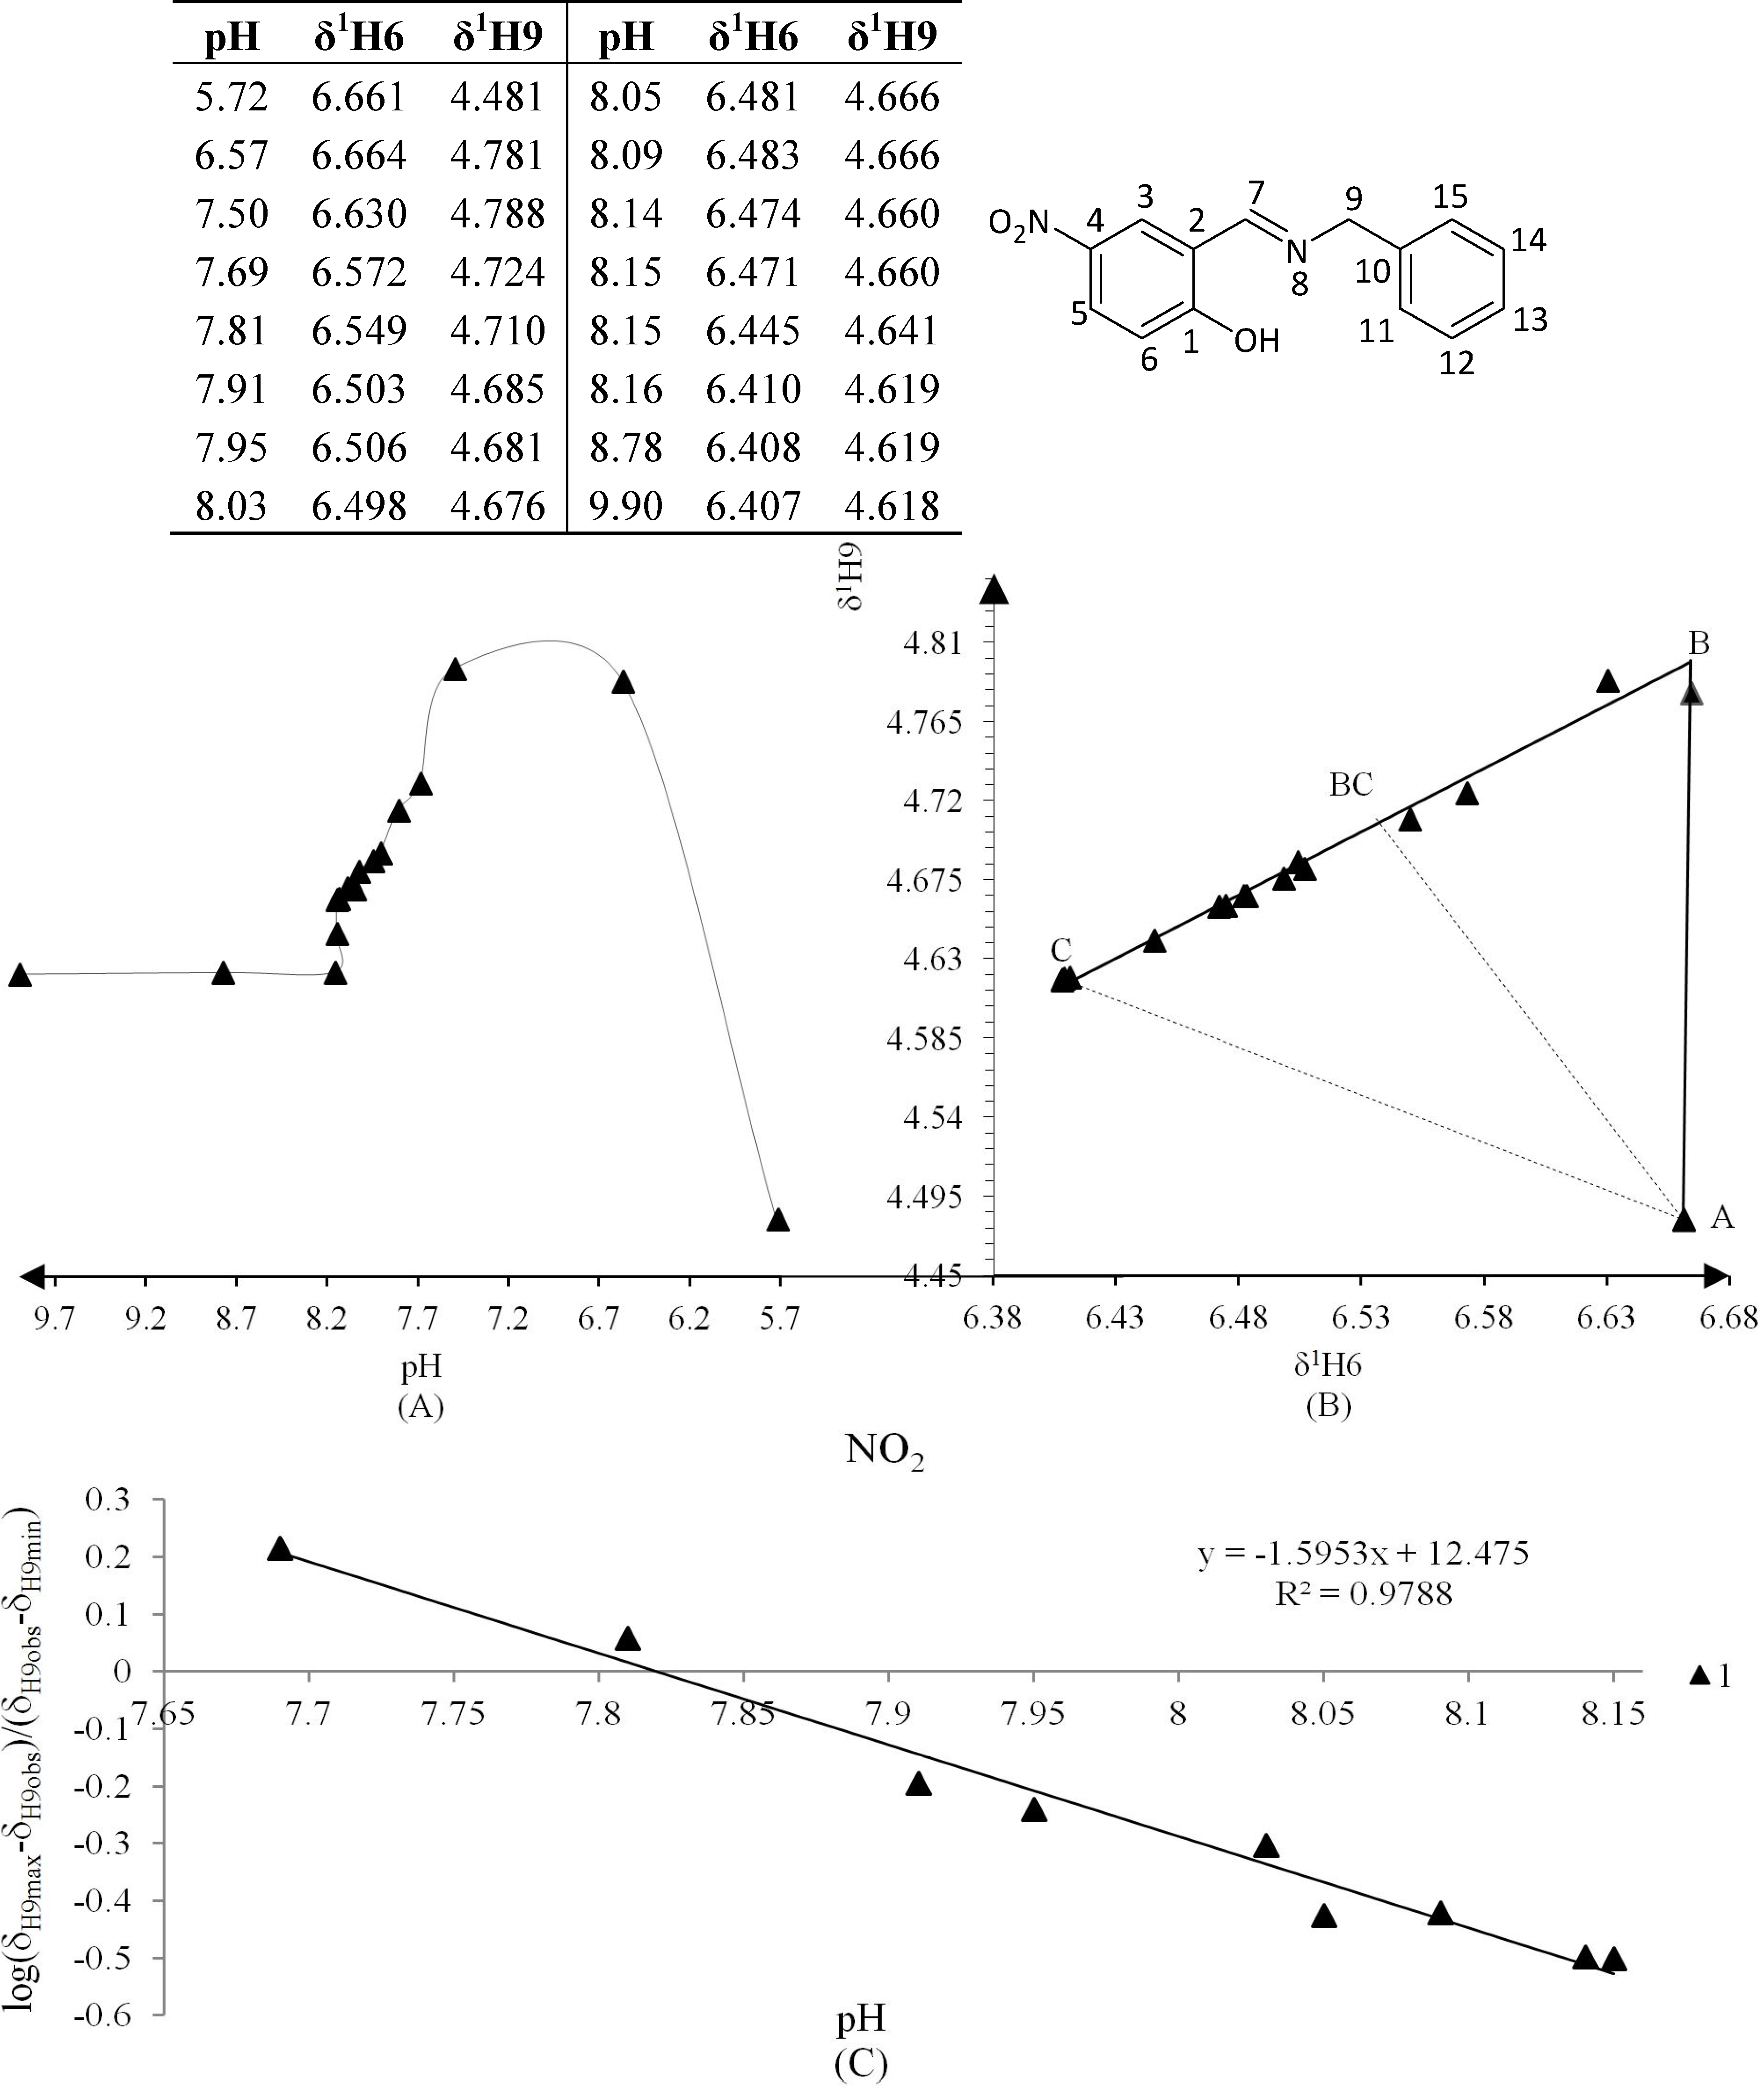
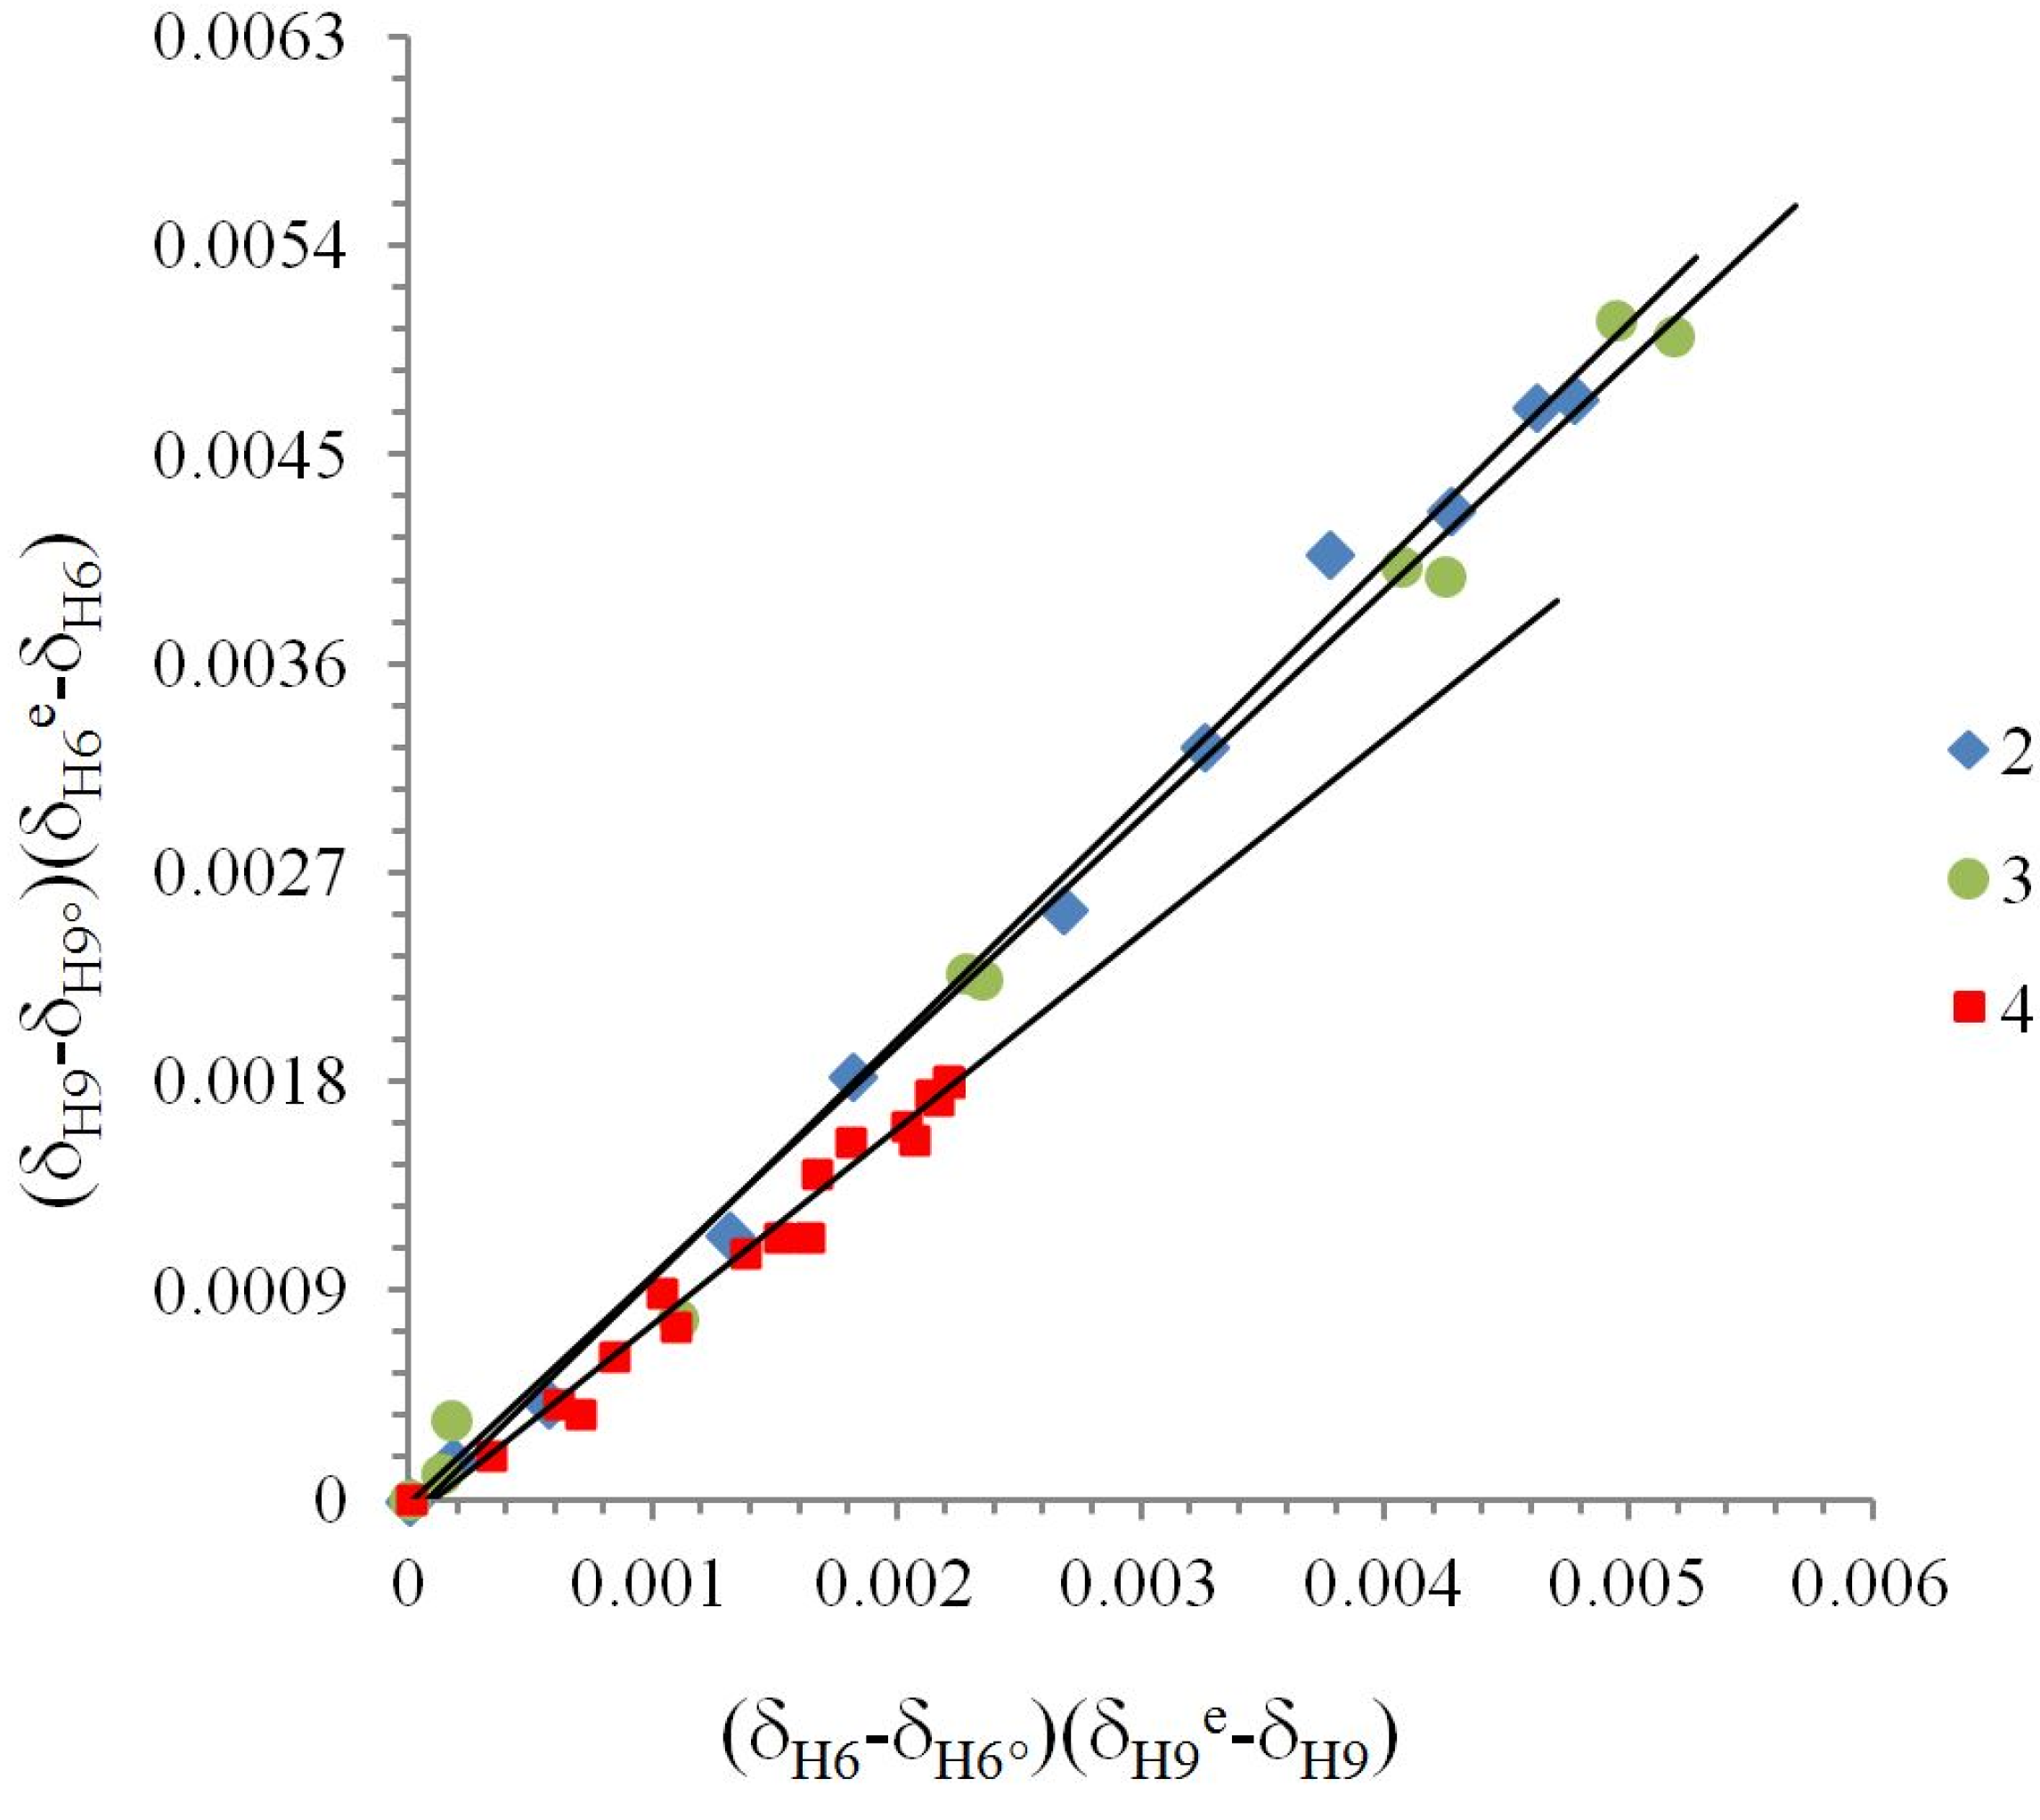
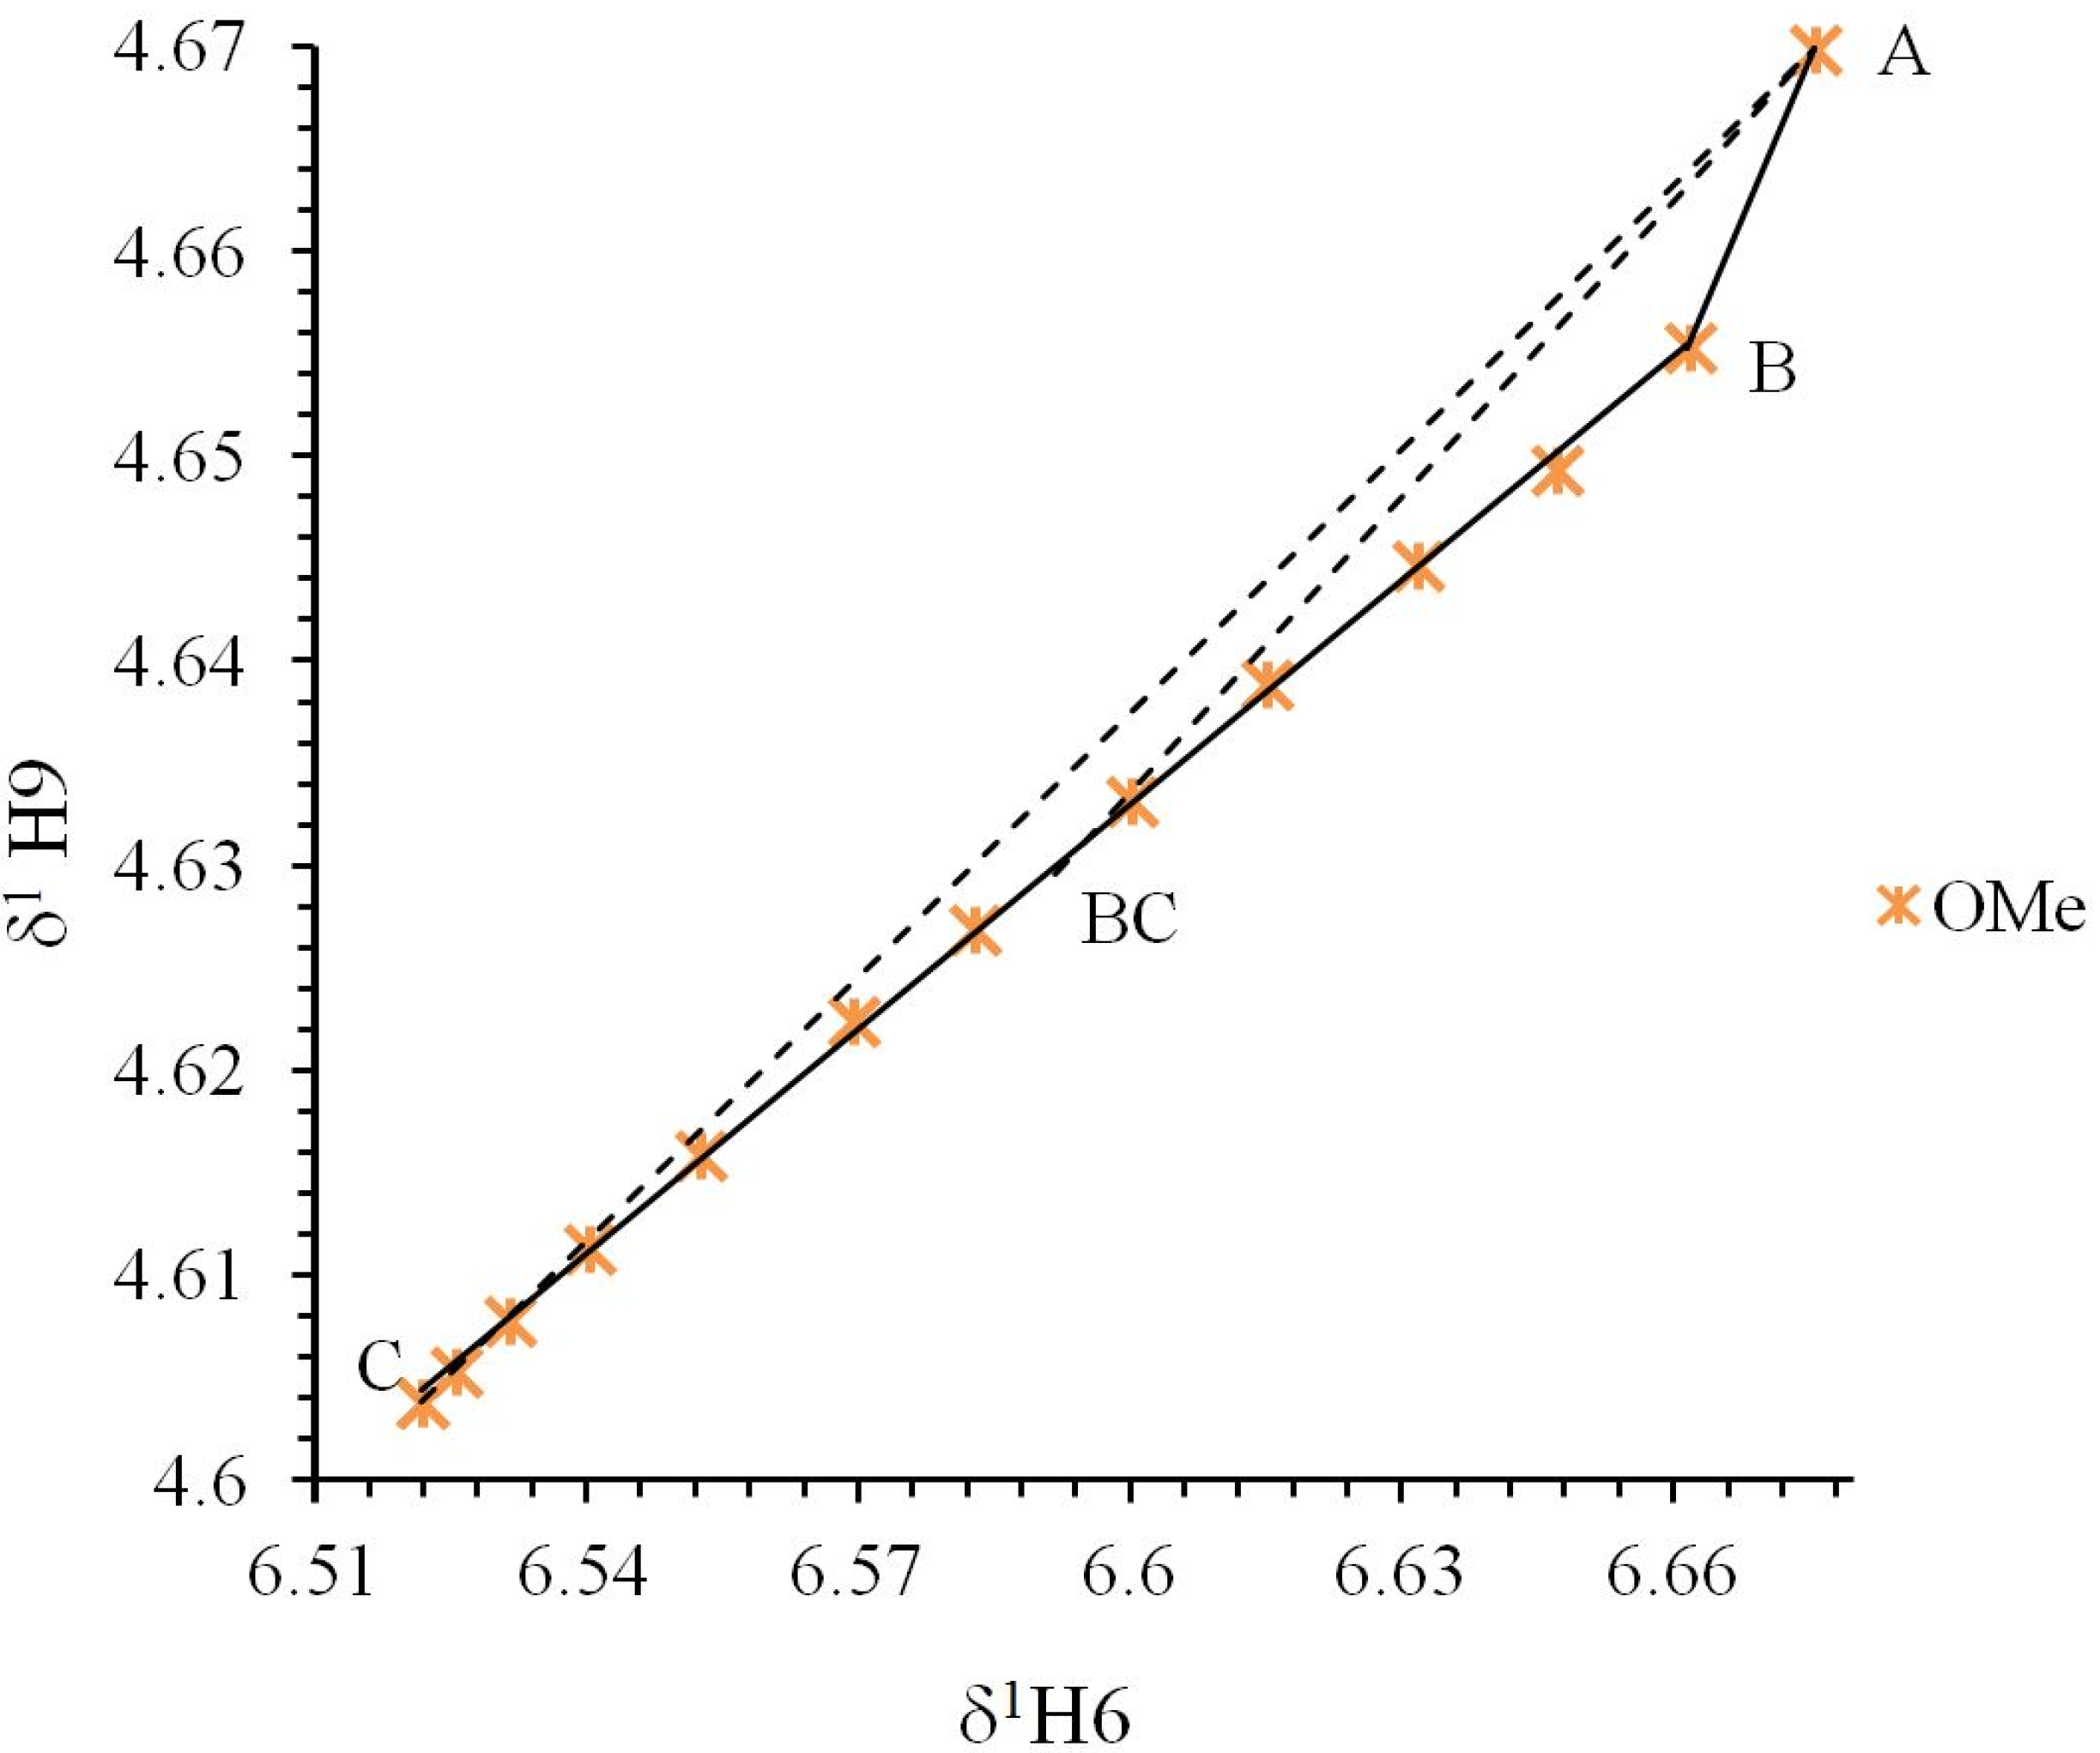
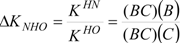
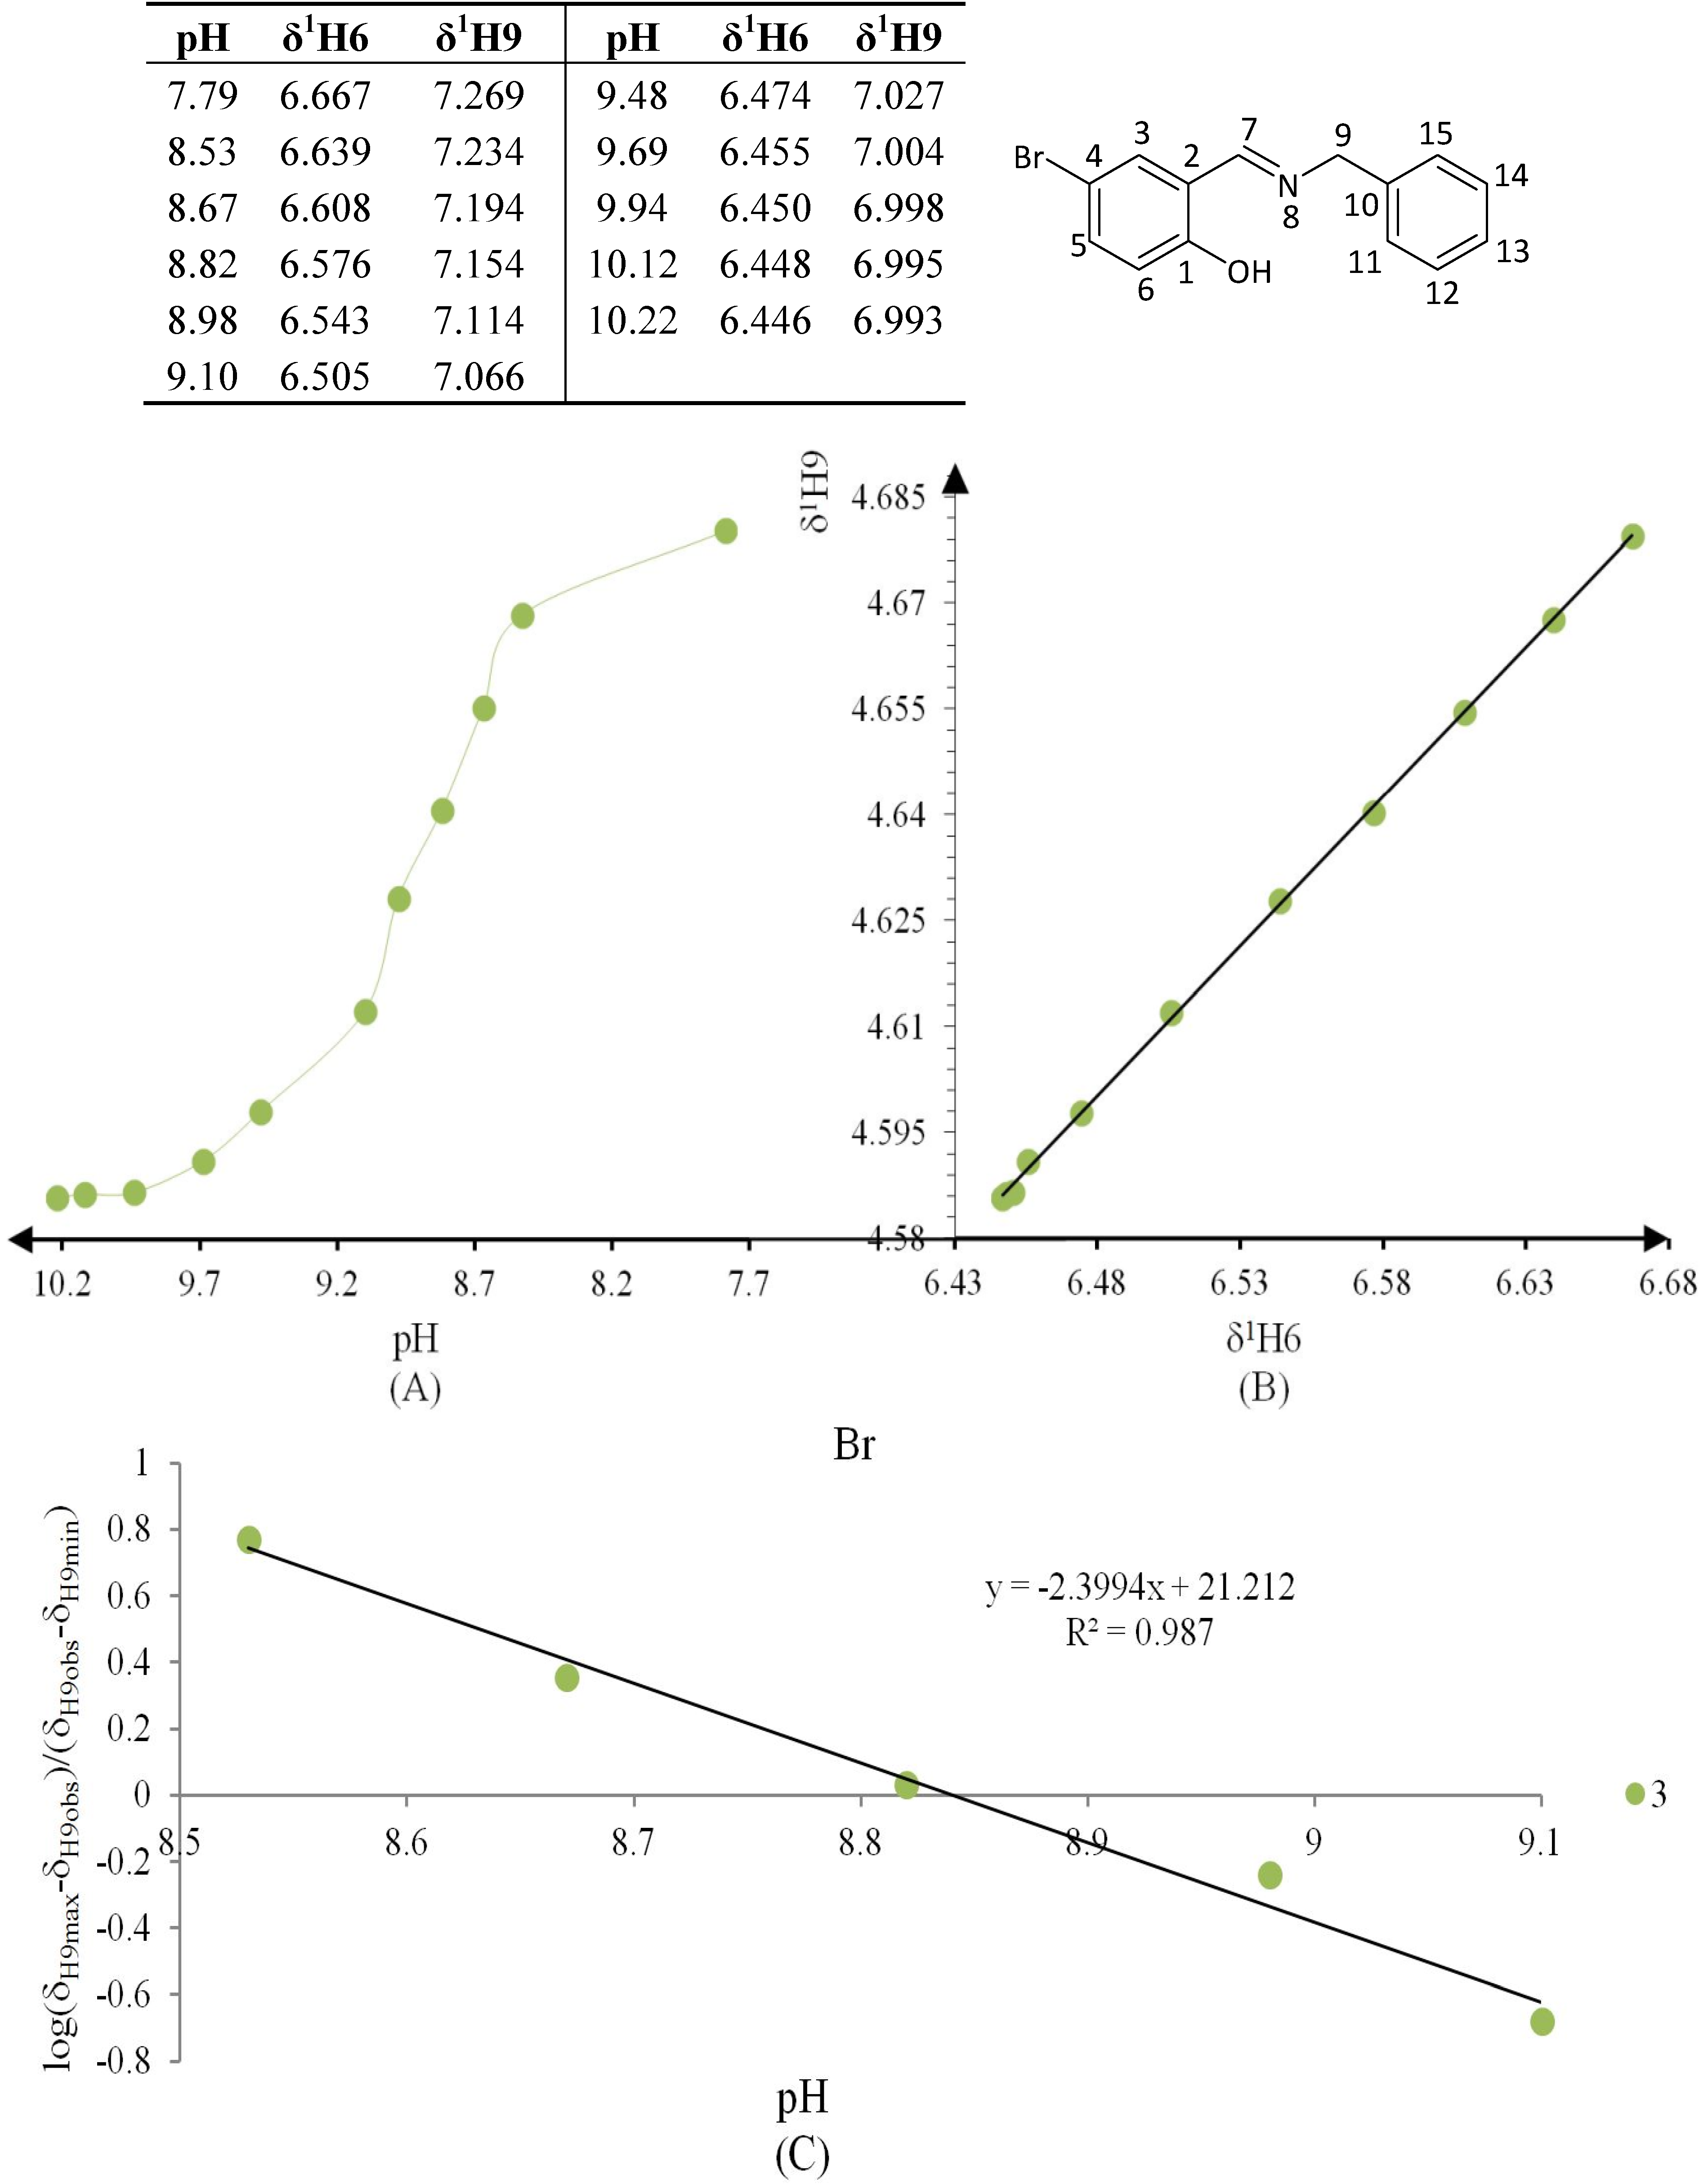
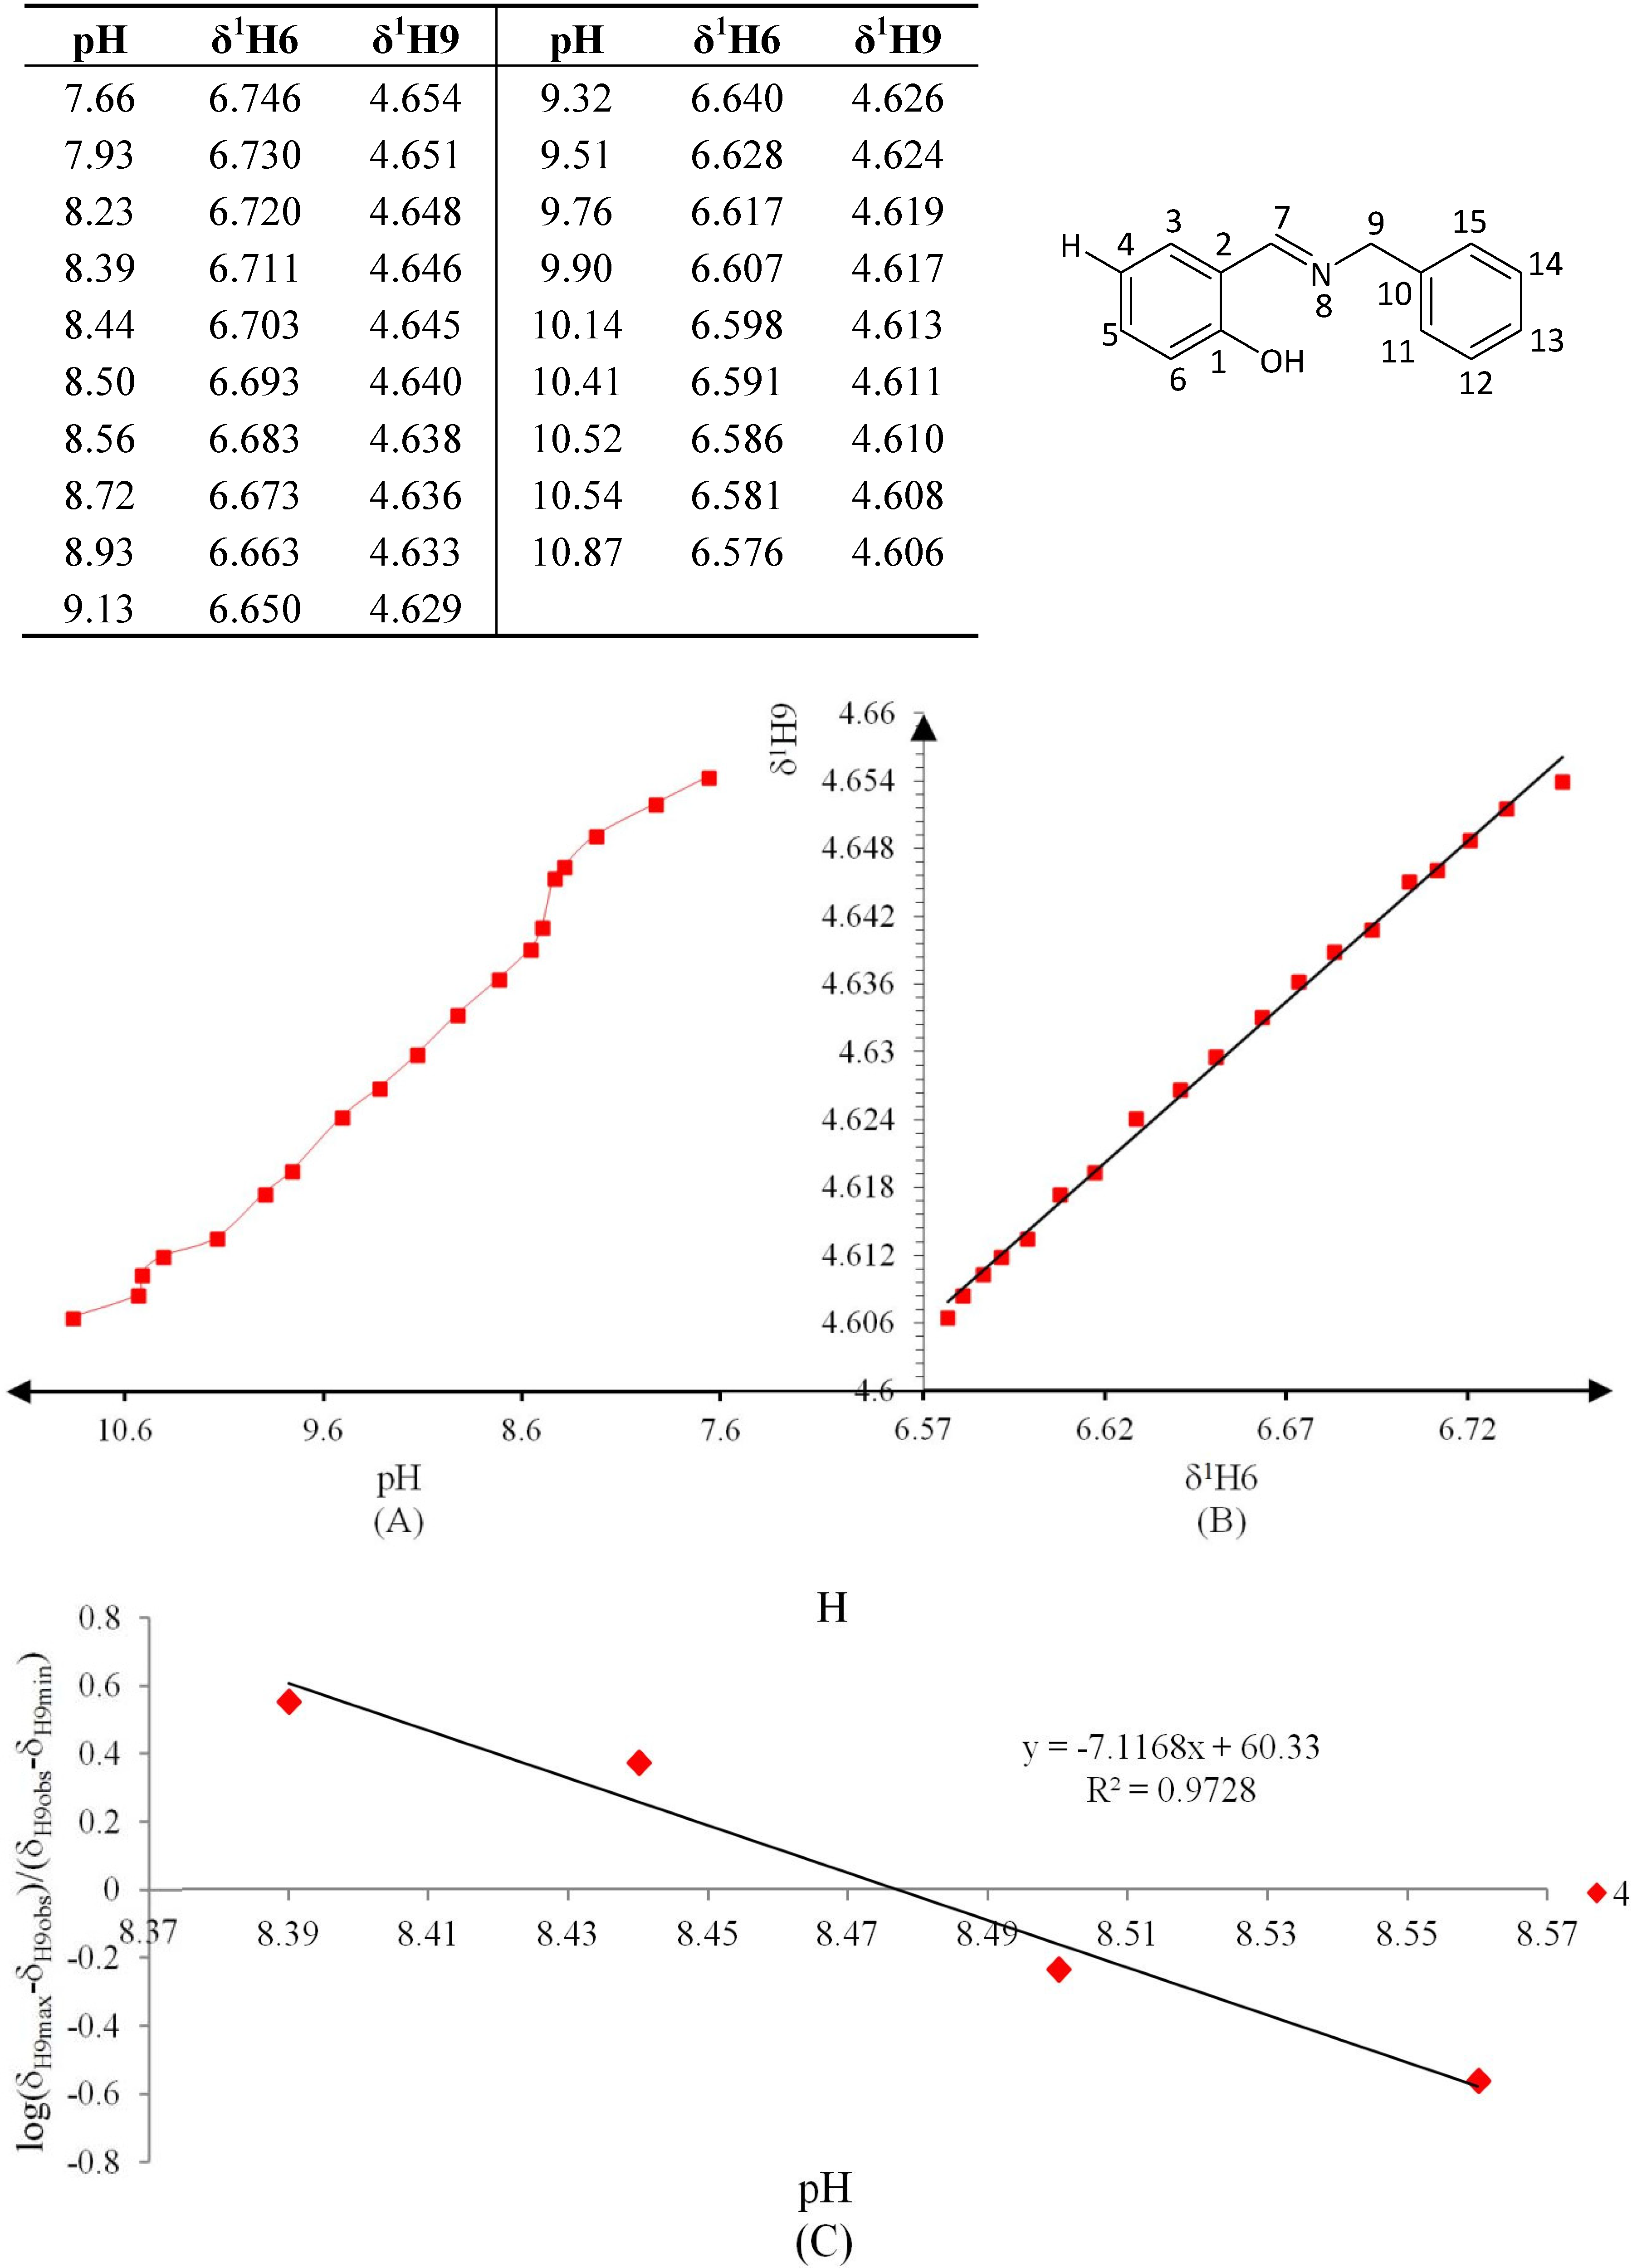
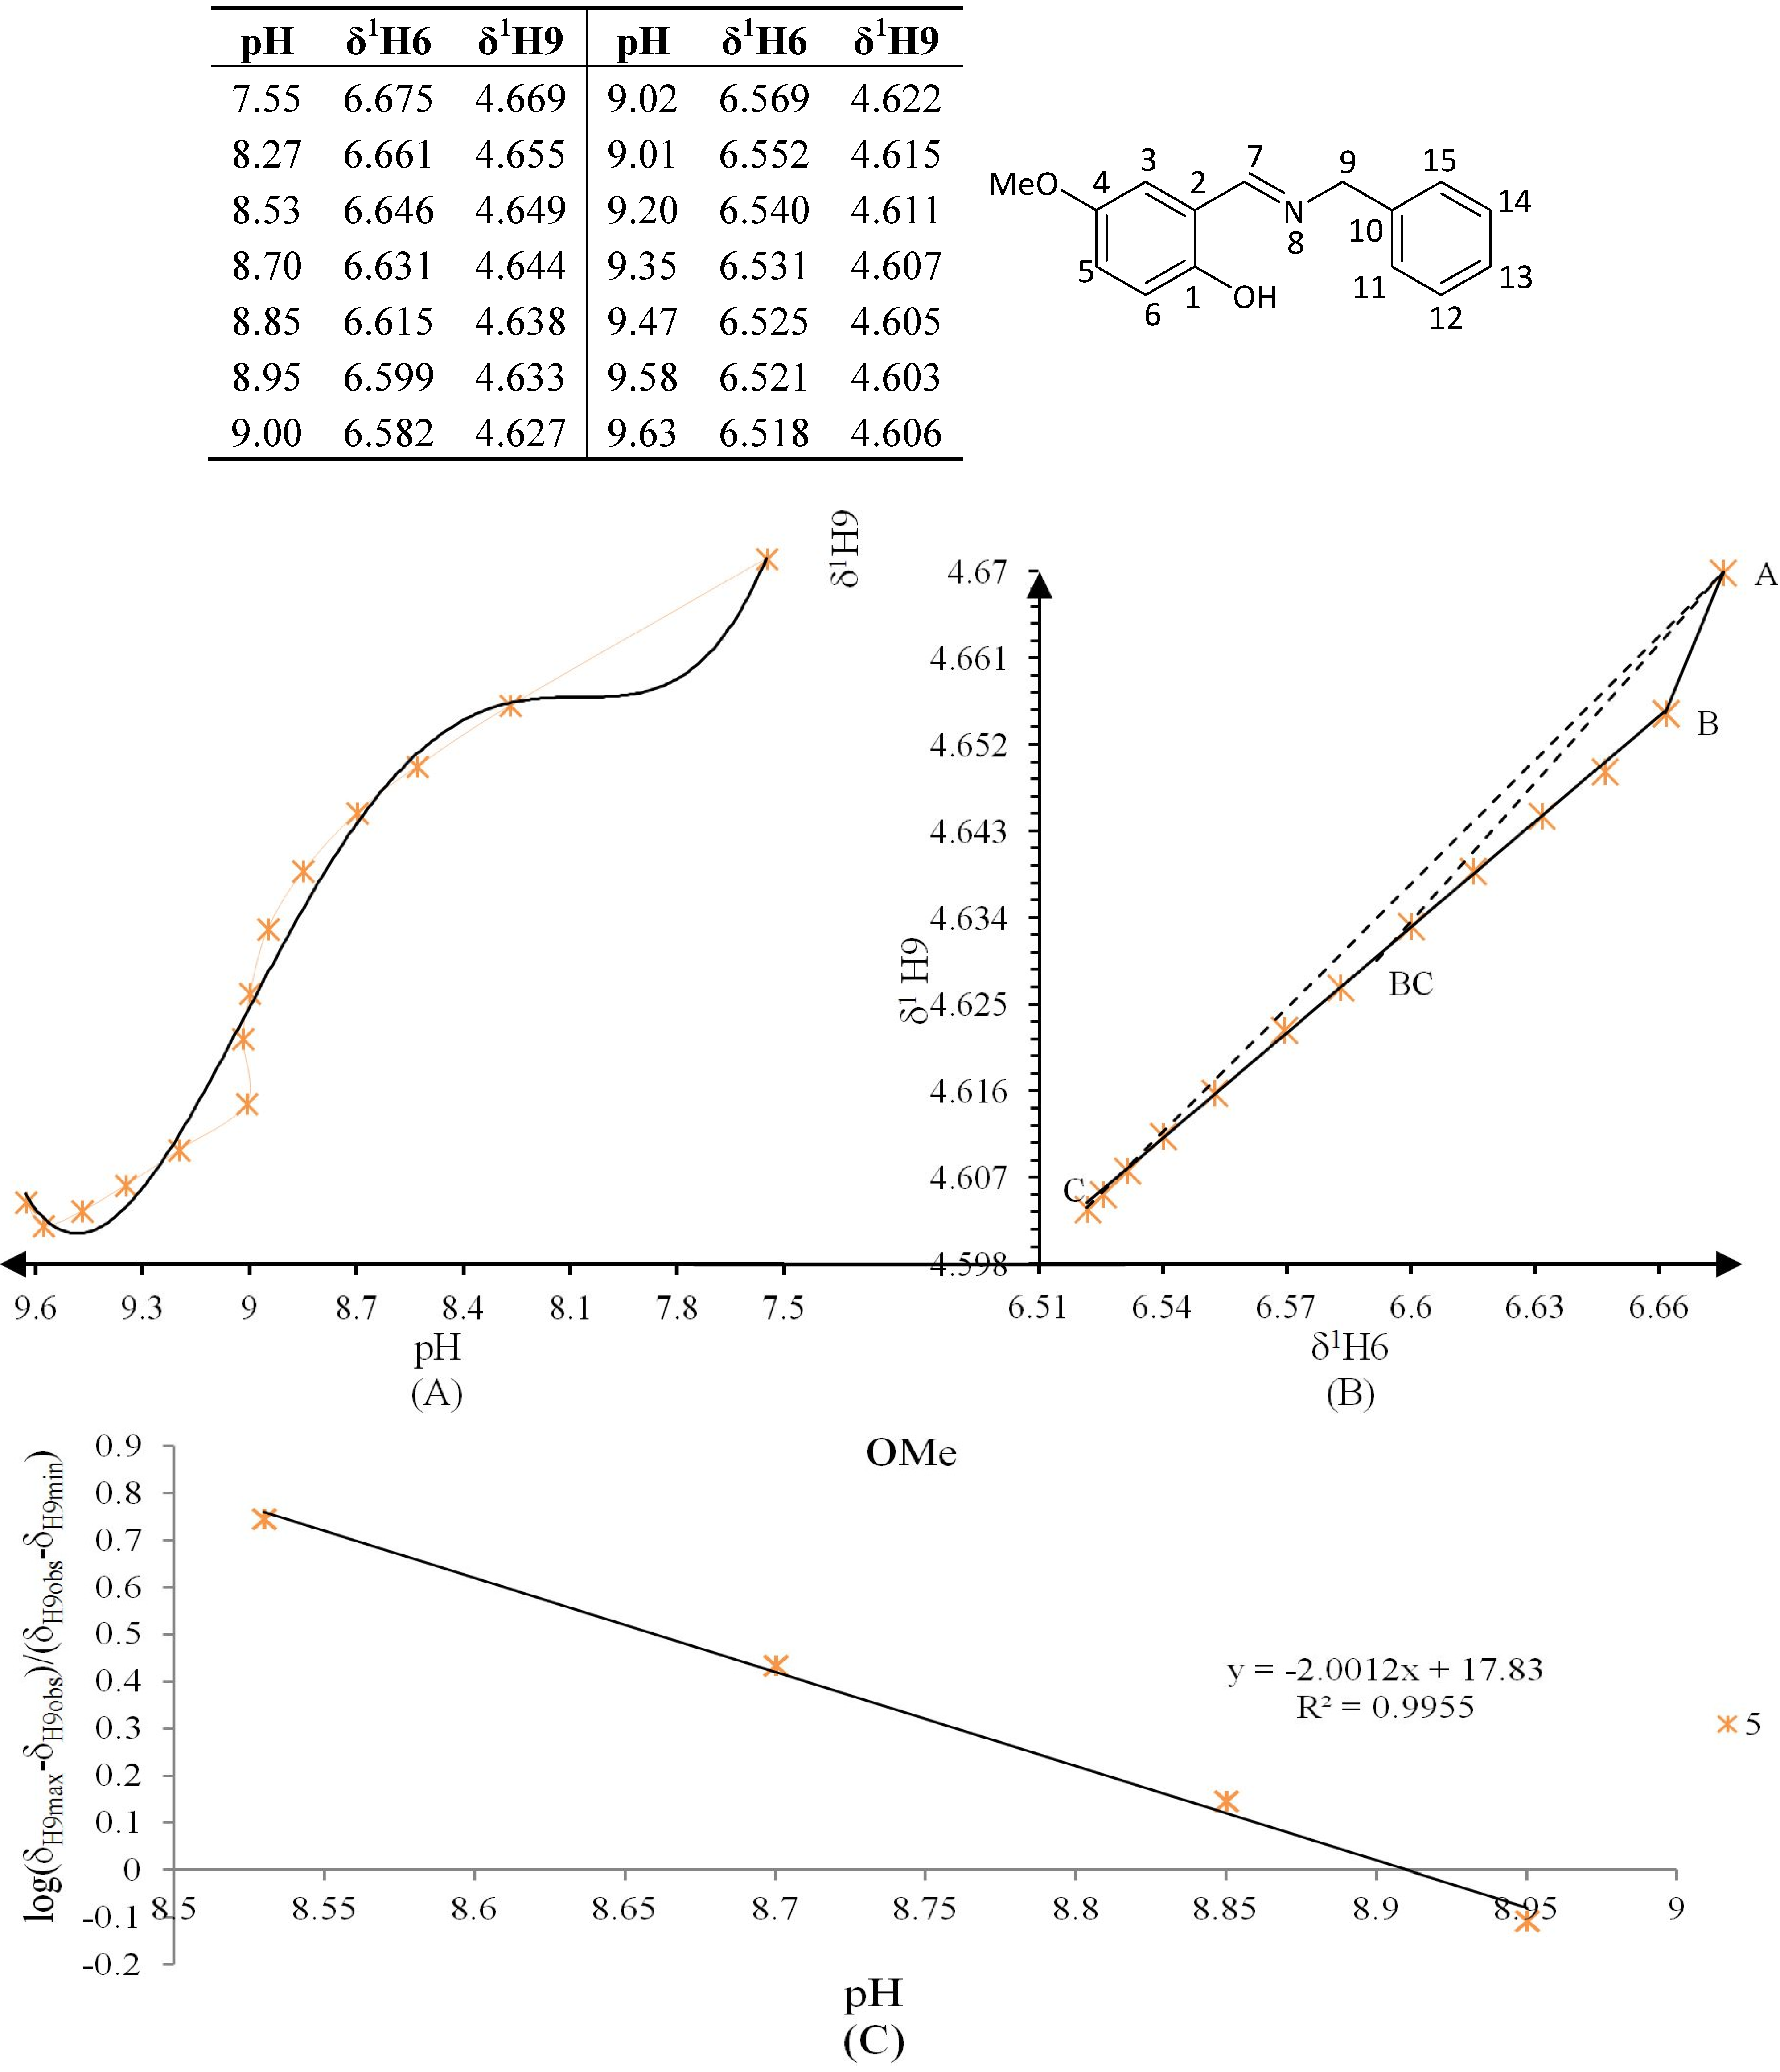
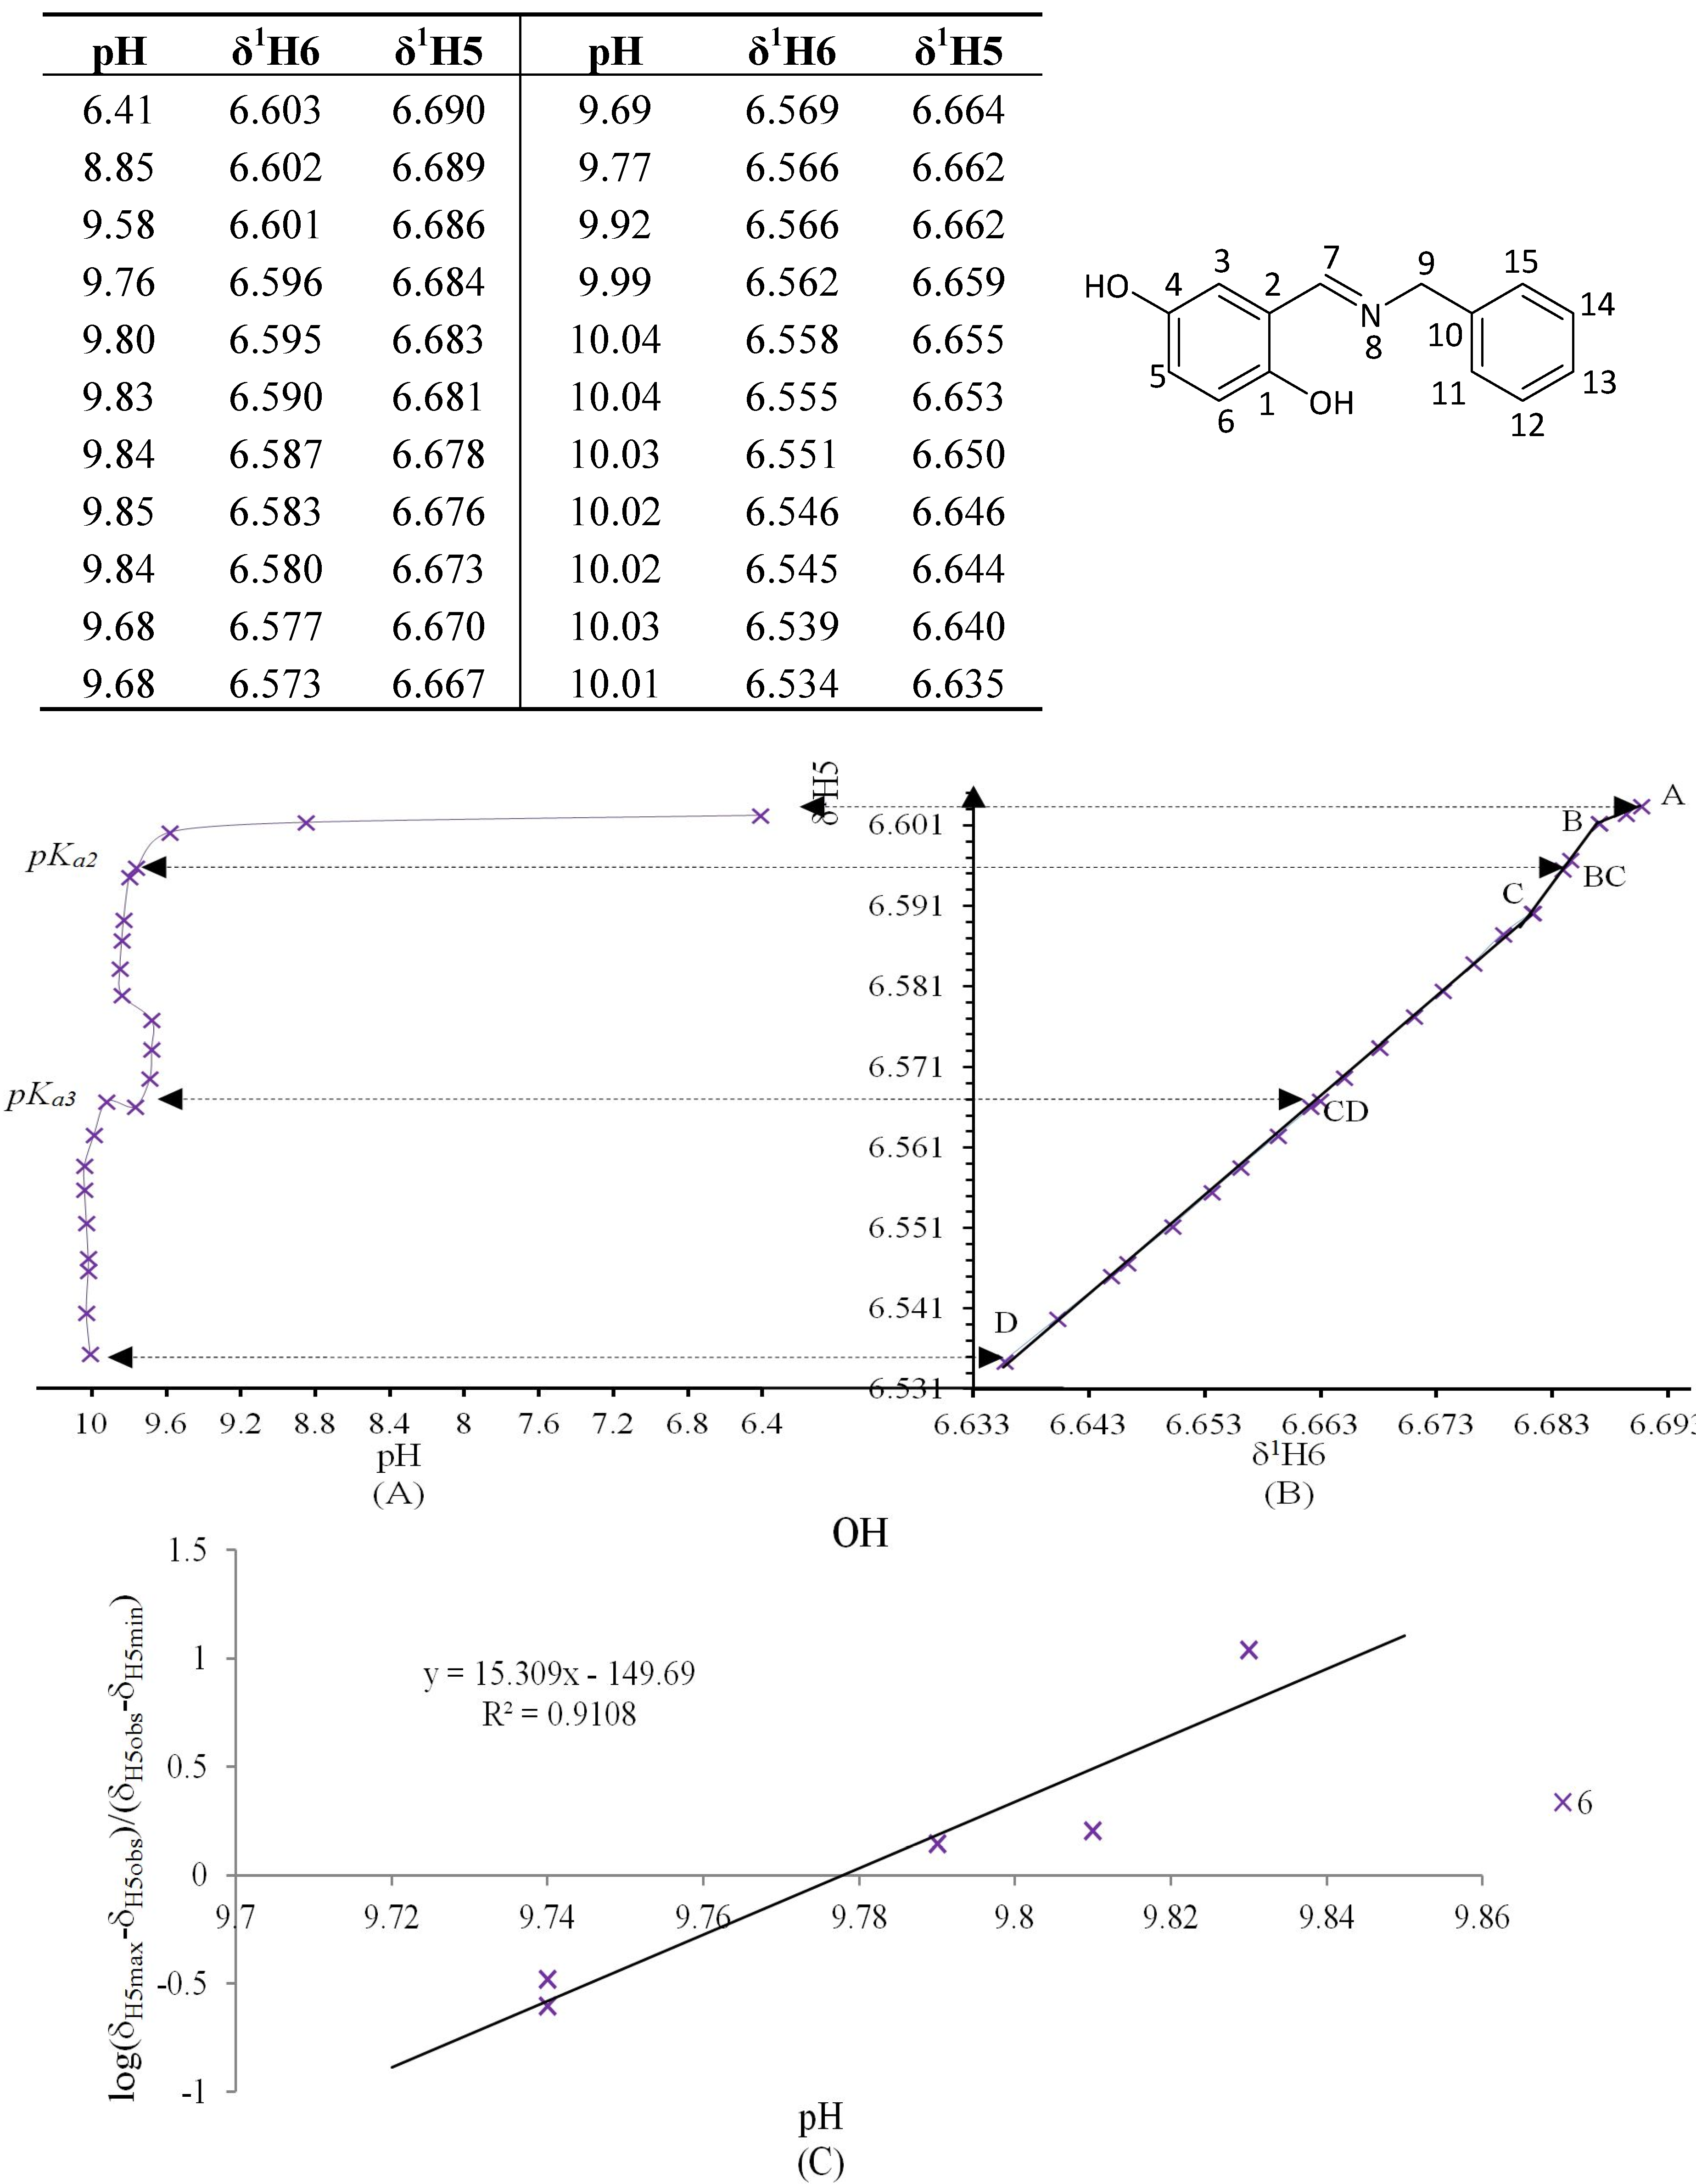
2.2. NMR Titration

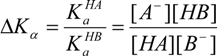
| Compound | Ka/10−9 | pKa | ΔKNHO | ΔpKNHO | ΔΔG° [a] |
|---|---|---|---|---|---|
| 1 | 15.1 | 7.8 | 1.04(±0.05) | −0.017 | −0.097 |
| 2 | 2.13 | 8.6 | 1.031(±0.002) | −0.0133 | −0.075 |
| 3 | 1.44 | 8.8 | 0.986(±0.002) | 0.006 | 0.036 |
| 4 | 3.33 | 8.4 | 0.841(±0.005) | 0.0754 | 0.426 |
| 5 | 1.23 | 8.9 | 1.021(±0.014) | −0.01 | −0.052 |
| 6 | 0.17 | 9.7 | 1.02(±0.02) | −0.001 | −0.004 |

3. Experimental
3.1. General Remarks

3.2. Sample Preparation, Titrant Solution and pH Meter
3.3. NMR Spectrometric Titration
3.4. NMR Titration Graphics (Figure 6, Figure 7, Figure 8, Figure 9, Figure 10 and Figure 11)

3.5. Data Analysis
4. Conclusions
Acknowledgments
Conflicts of Interest
References
- Hodnett, E.M.; Mooney, P.D. Antitumor activities of some Schiff bases. J. Med. Chem. 1970, 13, 786. [Google Scholar] [CrossRef]
- Hodnett, E.M.; Dunn, W.J. Cobalt derivatives of Schiff bases of aliphatic amines as antitumor agents. J. Med. Chem. 1972, 15, 339. [Google Scholar] [CrossRef]
- Huang, S.C. New Schiff Bases of Aminohydroxyguanidine as Inhibitors of Tumor Cells and QSAR Analysis. M.S. Thesis, University of the Southern California, Los Angeles, CA, USA, 2001. [Google Scholar]
- Ren, S. Design, Synthesis, Biological Testing and QSAR Analysis of new Schiff bases of N-Hydroxysemicarbazide as Inhibitors of Tumor Cells. Ph.D. Thesis, University of Southern California, Los Angeles, CA, USA, 2001. [Google Scholar]
- Gacche, R.N.; Gond, D.S.; Dhole, N.A.; Dawane, B.S. Coumarin Schiff-bases: As antioxidant and possibly anti-inflammatory agents. J. Enzym. Inhib. Med. Chem. 2006, 21, 157–161. [Google Scholar] [CrossRef]
- Krause, M.; Rouleau, A.; Stark, H.; Luger, P.; Lipp, R.; Garbarg, M.; Schwartz, J.-C.; Schunack, W. Synthesis, X-ray crystallography, and pharmacokinetics of novel azomethine prodrugs of (r)-α-methylhistamine: Highly potent and selective histamine h3 receptor agonists. J. Med. Chem. 1995, 38, 4070–4079. [Google Scholar] [CrossRef]
- Kaplan, J.P.; Raizon, B.M.; Desarmenien, M.; Feltz, P.; Headley, P.M.; Worms, P.; Lloyd, K.G.; Bartholini, G. New anticonvulsants: Schiff bases of γ-aminobutyric acid and γ-aminobutyramide. J. Med. Chem. 1980, 23, 702–704. [Google Scholar] [CrossRef]
- Koneru, P.B.; Lien, E.J.; Avramis, V.I. Synthesis and testing of new antileukemic Schiff bases of N-hydroxy-N'-aminoguanidine against CCRF-CEM/0 human leukemia cells in vitro and synergism studies with cytarabine (Ara-C). Pharm. Res. 1993, 10, 515–520. [Google Scholar] [CrossRef]
- Gangani, B.J.; Parsania, P.H. Microwave-irradiated and classical syntheses of symmetric double Schiff bases of 1,1'-bis(4-aminophenyl)cyclohexane and their physicochemical characterization. Spectrosc. Lett. 2007, 40, 97–112. [Google Scholar] [CrossRef]
- Parekh, J.; Inamdhar, P.; Nair, R.; Baluja, S.; Chanda, S. Synthesis and antibacterial activity of some Schiff bases derived from 4-aminobenzoic acid. J. Serb. Chem. Soc. 2005, 70, 1155–1161. [Google Scholar] [CrossRef]
- Shi, L.; Fang, R.; Xue, J.; Xiao, Z.; Tan, S.; Zhu, H. Synthesis, characterization, and antibacterial and cytotoxic study of metal complexes with Schiff base ligands. Aust. J. Chem. 2008, 61, 288–296. [Google Scholar] [CrossRef]
- Shi, L.; Ge, H.M.; Tan, S.H.; Li, H.Q.; Song, Y.C.; Zhu, H.L.; Tan, R.X. Synthesis and antimicrobial activities of Schiff bases derived from 5-chloro-salicylaldehyde. Eur. J. Med. Chem. 2007, 42, 558–564. [Google Scholar] [CrossRef]
- Venugopala, K.N.; Jayashree, B.S. Microwave-induced synthesis of Schiff bases of aminothiazolyl bromocoumarins as antibacterials. Indian J. Pharm. Sci. 2008, 70, 88–91. [Google Scholar] [CrossRef]
- Zheng, B.; Brett, S.J.; Tite, J.P.; Lifely, M.R.; Brodie, T.A.; Rhodes, J. Galactose oxidation in the design of immunogenic vaccines. Science 1992, 256, 1560–1563. [Google Scholar]
- Vazzana, I.; Terranova, E.; Mattioli, F.; Sparatore, F. Aromatic Schiff bases and 2,3-disubstituted-1,3-thiazolidin-4-one derivatives as antiinflammatory agents. Arkivoc 2004, 364–374. [Google Scholar]
- Sharif, S.; Powell, D.R.; Schagen, D.; Steiner, T.; Toney, M.D.; Fogle, E.; Limbach, H.H. X-ray crystallographic structures of enamine and amine Schiff bases of pyridoxal and its 1:1 hydrogen-bonded complexes with benzoic acid derivatives: Evidence for coupled inter- and intramolecular proton transfer. Acta Crystallogr. 2006, B62, 480–487. [Google Scholar]
- Golubev, N.S.; Smirnov, S.N.; Tolstoy, P.M.; Sharif, S.; Toney, M.D.; Denisov, G.S.; Limbach, H.H. Observation by NMR of the tautomerism of an intramolecular OHOHN-charge relay chain in a model Schiff base. J. Mol. Struct. 2007, 319–327. [Google Scholar]
- Sharif, S.; Denisov, G.S.; Toney, M.D.; Limbach, H.H. NMR studies of coupled low- and high-barrier hydrogen bonds in pyridoxal-5'-phosphate model systems in polar solution. J. Am. Chem. Soc. 2007, 129, 6313–6327. [Google Scholar] [CrossRef]
- Sharif, S.; Huot, M.C.; Tolstoy, P.M.; Toney, M.D.; Jonsson, K.H.M.; Limbach, H.H. 15N nuclear magnetic resonance studies of acid-base properties of pyridoxal-5'-phosphate aldimines in aqueous solution. J. Phys. Chem. B 2007, 111, 3869–3876. [Google Scholar] [CrossRef]
- Lin, Y.L.; Gao, J. Internal proton transfer in the external pyridoxal 5'-phosphate Schiff base in dopa decarboxylase. Biochemistry 2010, 49, 84–94. [Google Scholar] [CrossRef]
- Day, J.H. Thermochromism. Chem. Rev. 1962, 63, 65–80. [Google Scholar] [CrossRef]
- Minkin, V.I. Photo-, Thermo-, Solvato-, and Electrochromic spiroheterocyclic compounds. Chem. Rev. 2004, 104, 2751–2776. [Google Scholar] [CrossRef]
- Hoshino, N.; Inabe, T.; Mitani, T.; Maruyama, Y. Structure and optical properties of a thermochromic Schiff base. Thermally induced intramolecular proton transfer in the N,N'-bis(salicylidene)-p-phenylenediamine crystals. Bull. Chem. Soc. Jpn. 1988, 61, 4207–4214. [Google Scholar]
- Takeda, S.; Chihara, H.; Inabe, T.; Mitani, T.; Maruyama, Y. NMR study of proton dynamics in the NHO hydrogen in the thermochromic crystals of N-salicylideneanilines. Chem. Phys. Lett. 1992, 189, 13–17. [Google Scholar] [CrossRef]
- Lambi, E.; Gegiou, D.; Hadjoudis, E. Thermochromism and photochromism of N-salicylidene-benzylamines and N-salicylidene-2-aminomethylpyridine. J. Photochem. Photobiol. A Chem. 1995, 86, 241–246. [Google Scholar] [CrossRef]
- Hadjoudis, E.; Rontoyianni, A.; Ambroziak, K.; Dziembowska, T.; Mavridis, I.M. Photochromism and thermochromism of solid trans-N.,N'-bis-(salicylidene)-1,2-cyclohexane-diamines and trans-N.,N'-bis-(2-hydroxynaphylidene)-1,2-cyclohexanediamine. J. Photochem. Photobiol. A Chem. 2004, 162, 521–530. [Google Scholar] [CrossRef]
- Amimoto, K.; Kawato, T. Photochromism of organic compounds in the crystal state. J. Photochem. Photobiol. C 2005, 6, 207–226. [Google Scholar] [CrossRef]
- Akitsu, T.; Einaga, Y. A chiral photochromic Schiff base: (R)-4-Bromo-2-[(1-phenylethyl)-iminomethyl]phenol. Acta Crystallogr. 2006, E62, o4315–o4317. [Google Scholar]
- Bolz, I.; May, C.; Spange, S. Solvatochromic properties of Schiff bases derived from 5-amino-barbituric acid: Chromophores with hydrogen bonding patterns as components for coupled structures. New J. Chem. 2007, 31, 1568–1571. [Google Scholar] [CrossRef]
- Gegiou, D.; Lambi, E.; Hadjoudis, E. Solvatochromism in N-(2-Hydroxybenzylidene)aniline, N-(2-Hydroxybenzylidene)benzylamine, and N-(2-Hydroxybenzylidene)-2-phenylethylamine. J. Phys. Chem. 1996, 100, 17762–17765. [Google Scholar] [CrossRef]
- Raczynska, E.D.; Kosinska, W.; Osmiałowski, B.; Gawinecki, R. Tautomeric equilibria in relation to pi-electron delocalization. Chem. Rev. 2005, 105, 3561–3612. [Google Scholar] [CrossRef]
- Schilf, W. Intramolecular hydrogen bond investigations in some Schiff bases using C-C and N-C coupling constants. J. Mol. Struct. 2004, 689, 245–249. [Google Scholar] [CrossRef]
- Schilf, W.; Kamienski, B.; Szady-Chelmieniecka, A.; Grech, E.; Makal, A.; Wozniak, K. NMR and X-ray studies of 2,6-bis(alkylimino)phenol Schiff bases. J. Mol. Struct. 2007, 94–101. [Google Scholar]
- Schilf, W.; Cmoch, P.; Szady-Chelmieniecka, A.; Grech, E. Deprotonation of hydrogen bonded Schiff bases by three strong nitrogen bases. J. Mol. Struct. 2009, 921, 34–37. [Google Scholar] [CrossRef]
- Claramunt, R.M.; López, C.; Santa María, M.D.; Sanz, D.; Elguero, J. The use of NMR spectroscopy to study tautomerism. Prog. Nucl. Magn. Reson. Spectrosc. 2006, 49, 169–206. [Google Scholar] [CrossRef]
- Dziembowska, T.; Ambroziak, K.; Majerz, I. Analysis of the vibrational spectra of trans-N.,N'-bis-salicylidene-1',2'-cyclohexanediamine tautomers. J. Mol. Struct. 2005, 738, 15–24. [Google Scholar] [CrossRef]
- Filarowski, A. Intramolecular hydrogen bonding in o-hydroxyaryl Schiff bases. J. Phys. Org. Chem. 2005, 18, 686–698. [Google Scholar] [CrossRef]
- Filarowski, A.; Koll, A.; Rospenk, M.; Krol-Starzomska, I.; Hansen, P.E. Tautomerism of sterically hindered Schiff bases. Deuterium isotope effects on 13C chemical shifts. J. Phys. Chem. A 2005, 109, 4464–4473. [Google Scholar] [CrossRef]
- Raczynska, E.D.; Krygowski, T.M.; Zachara, J.E.; Osmiałowski, B.; Gawinecki, R. Tautomeric equilibria, H-bonding and π-electron delocalization in o-nitrosophenol. A B3LYP/6–311+G(2df,2p) study. J. Phys. Org. Chem. 2005, 18, 892–897. [Google Scholar] [CrossRef]
- Osmiałowski, B.; Raczynska, E.D.; Krygowski, T.M. Tautomeric equilibria and pi electron delocalization for some monohydroxyarenes-quantum chemical studies. J. Org. Chem. 2006, 71, 3727–3736. [Google Scholar] [CrossRef]
- Filarowski, A.; Kochel, A.; Kluba, M.; Kamounah, F.S. Structural and aromatic aspects of tautomeric equilibrium in hydroxyaryl Schiff bases. J. Phys. Org. Chem. 2008, 21, 939–944. [Google Scholar] [CrossRef]
- Kluba, M.; Lipkowski, P.; Filarowski, A. Theoretical investigation of tautomeric equilibrium in ortho-hydroxy phenyl Schiff bases. Chem. Phys. Lett. 2008, 463, 426–430. [Google Scholar] [CrossRef]
- Salman, S.R.; Lindon, J.C.; Farrant, R.D.; Carpenter, T.A. Tautomerism in 2-hydroxy-1-naphthaldehyde Schiff bases in solution and the solid state investigated using 13C-NMR spectroscopy. Magn. Reson. Chem. 1993, 31, 991–994. [Google Scholar] [CrossRef]
- Salman, S.R.; Kamounah, F.S. Tautomerism in 1-hydroxy-2-naphthaldehyde Schiff bases: Calculation of tautomeric isomers using carbon-13 NMR. Spectrosc.-Int. J. 2003, 17, 747–752. [Google Scholar] [CrossRef]
- Santos-Contreras, R.J.; Ramos-Organillo, A.; Garcia-Baez, E.V.; Padilla-Martinez, I.I.; Martinez-Martinez, F.J. The zwitterion of 4-nitro-2-{(E)-[2-(piperidin-1-yl)ethyl]iminomethyl}phenol. Acta Crystallogr. 2009, C65, o8–o10. [Google Scholar]
- Pyta, K.; Przybylski, P.; Schilf, W.; Kolodziej, B.; Szady-Chelmieniecka, A.; Grech, E.; Brzezinski, B. Spectroscopic and theoretical studies of the protonation of N-(5-nitrosalicylidene)-ethylamine. J. Mol. Struct. 2010, 967, 140–146. [Google Scholar] [CrossRef]
- Filarowski, A.; Glowiaka, T.; Koll, A. Strengthening of the intramolecular O…H…N hydrogen bonds in Schiff bases as a result of steric repulsion. J. Mol. Struct. 1999, 484, 75–89. [Google Scholar] [CrossRef]
- Przybylski, P.; Schroeder, G.; Brzezinski, B.; Bartl, F. 1H-NMR, FT-IR and MS studies and PM5 semiempirical calculations of complexes between the Schiff base of gossypol with 2-(aminomethyl)-15-crown-5 and Ca2+, Pb2+ and Ba2+ cations. J. Phys. Org. Chem. 2003, 16, 289–297. [Google Scholar] [CrossRef]
- Dziembowska, T.; Rozwadowski, Z.; Filarowski, A.; Hansen, P.E. NMR study of proton transfer equilibrium in Schiff bases derived from 2-hydroxy-1-naphthaldehyde and 1-hydroxy-2-acetonaphthone. Deuterium isotope effects on 13C and 15N chemical shifts. Magn. Reson. Chem. 2001, 39, S67–S80. [Google Scholar] [CrossRef]
- Sharif, S.; Denisov, G.S.; Toney, M.D.; Limbach, H.H. NMR studies of solvent-assisted proton transfer in a biologically relevant Schiff base: Toward a distinction of geometric and equilibrium H-bond isotope effects. J. Am. Chem. Soc. 2006, 128, 3375–3387. [Google Scholar] [CrossRef]
- Rozwadowski, Z.; Nowak-Wydra, B. Chiral recognition of Schiff bases by 15N-NMR spectroscopy in the presence of a dirhodium complex. Deuterium isotope effect on 15N chemical shift of the optically active Schiff bases and their dirhodium tetracarboxylate adducts. Magn. Reson. Chem. 2008, 46, 974–978. [Google Scholar] [CrossRef]
- Kamounah, F.S.; Salman, S.R.; Mahmoud, A.A.K. Substitution and solvent effect of some substituted hydroxy schiff bases. Spectrosc. Lett. 1998, 31, 1557–1567. [Google Scholar] [CrossRef]
- Irle, S.; Krygowski, T.M.; Niu, J.E.; Schwarz, W.H.E. Substituent effects of -NO and -NO2 groups in aromatic systems. J. Org. Chem. 1995, 60, 6744–6755. [Google Scholar]
- Krygowski, T.M.; Stepien, B.T. Sigma- and pi-electron delocalization: Focus on substituent effects. Chem. Rev. 2005, 105, 3482–3512. [Google Scholar] [CrossRef]
- Otto, E.; Stanislav, B. Substituent effects of the alkyl groups: Polarity vs. Polarizability. Eur. J. Org. Chem. 2007, 2007, 2870–2876. [Google Scholar]
- Ozeryanskii, V.A.; Pozharskii, A.F.; Schilf, W.; Kamieński, B.; Sawka-Dobrowolska, W.; Sobczyk, L.; Grech, E. Novel polyfunctional tautomeric systems containing salicylideneamino and proton sponge moieties. Eur. J. Org. Chem. 2006, 2006, 782–790. [Google Scholar] [CrossRef]
- Gilli, G.; Bellucci, F.; Ferretti, V.; Bertolasi, V. Evidence for resonance-assisted hydrogen bonding from crystal-structure correlations on the enol form of the β-diketone fragment. J. Am. Chem. Soc. 1989, 111, 1023–1028. [Google Scholar]
- Gilli, P.; Bertolasi, V.; Ferretti, V.; Gilli, G. Towards an unified hydrogen-bond theory. J. Am. Chem. Soc. 2000, 122, 10405–10417. [Google Scholar] [CrossRef]
- Gilli, P.; Bertolasi, V.; Pretto, L.; Antonov, L.; Gilli, G. Variable-temperature X-ray crystallographic and DFT computational study of the N-H···O/N···H-O tautomeric competition in 1-(Arylazo)-2-naphthols. Outline of a transiton-state hydrogen-bond theory. J. Am. Chem. Soc. 2005, 127, 4943–4953. [Google Scholar] [CrossRef]
- Dominiak, P.M.; Grech, E.; Barr, G.; Teat, S.; Mallinson, P.; Wozniak, K. Neutral and ionic hydrogen bonding in Schiff bases. Chem. Eur. J. 2003, 9, 963–970. [Google Scholar] [CrossRef]
- Krygowski, T.M.; Wozniak, K.; Anulewicz, R.; Pawlak, D.; Kolodziejski, W.; Grech, E.; Szady, A. Through-resonance assisted ionic hydrogen bonding in 5-Nitro-N-salicylideneethylamine. J. Phys. Chem. A 1997, 101, 9399–9404. [Google Scholar] [CrossRef]
- Polster, J.; Lachmann, H. Spectrometric Titration: Analysis of Chemical Equilibria; VCH Verlagsgesellschaft: Weinheim, Germany, 1989; pp. 33–132. [Google Scholar]
- Macomber, R.S. An introduction to NMR titration for studying rapid reversible complexation. J. Chem. Educ. 1992, 69, 375. [Google Scholar] [CrossRef]
- Breitmaier, E.; Spohn, K.-H. PH-abhängigkeit der 13C-chemischen verschiebungen sechsgliedriger stickstoff-heteroaromaten. Tetrahedron 1973, 29, 1145. [Google Scholar] [CrossRef]
- Breitmaier, E.; Voelter, W. Carbon-13 NMR Spectroscopy: High Resolution Methods and Applications in Organic Chemistry and Biochemistry, 3rd ed.; VCH Verlagsgesellschaft GbBH: New York, NY, USA, 1990; pp. 107–123. [Google Scholar]
- Szakács, Z.; Hägele, G. Accurate determination of low pK values by 1H-NMR titration. Talanta 2004, 62, 819–825. [Google Scholar] [CrossRef]
- Berger, S. A 13C magnetic resonance study. Tetrahedron 1977, 33, 1587–1589. [Google Scholar]
- Gobber, F.; Polster, J. Determination of relative pK values of dibasic protolytes by regression analysis of absorbance diagrams. Anal. Chem. 1976, 48, 1546–1550. [Google Scholar] [CrossRef]
- Perrin, C.L.; Thoburn, J.D. Evidence for a double-minimum potential for intramolecular hydrogen bonds of aqueous hydrogen maleate and hydrogen phthalate anions. J. Am. Chem. Soc. 1989, 111, 8010–8012. [Google Scholar] [CrossRef]
- Miles, A.F.; Perrin, C.L.; Sinnott, M.L. Absence of reverse anomeric effect: Conformational analysis of glucosylimidazolium and glucosylimidazole. J. Am. Chem. Soc. 1994, 116, 8398–8399. [Google Scholar] [CrossRef]
- Perrin, C.L.; Fabian, M.A.; Armstrong, K.B. Solvation effect on steric bulk of ionic substituents: Imidazolium vs. imidazole. J. Org. Chem. 1994, 59, 5246–5253. [Google Scholar] [CrossRef]
- Perrin, C.L.; Fabian, M.A. Multicomponent NMR titration for simultaneous measurement of relative pKas. Anal. Chem. 1996, 68, 2127–2134. [Google Scholar] [CrossRef]
- Makal, A.; Schilf, W.; Kamienski, B.; Szady-Chelmieniecka, A.; Grech, E.; Wozniak, K. Hydrogen bonding in Schiff bases-NMR, structural and experimental charge density studies. Dalton Trans. 2011, 40, 421–430. [Google Scholar] [CrossRef]
- Sample Availability: Samples of the compounds 1–6 are available from the authors.
© 2013 by the authors. Licensee MDPI, Basel, Switzerland. This article is an open access article distributed under the terms and conditions of the Creative Commons Attribution license ( http://creativecommons.org/licenses/by/3.0/).
Share and Cite
Ortegón-Reyna, D.; Garcías-Morales, C.; Padilla-Martínez, I.; García-Báez, E.; Aríza-Castolo, A.; Peraza-Campos, A.; Martínez-Martínez, F. NMR Structural Study of the Prototropic Equilibrium in Solution of Schiff Bases as Model Compounds. Molecules 2014, 19, 459-481. https://doi.org/10.3390/molecules19010459
Ortegón-Reyna D, Garcías-Morales C, Padilla-Martínez I, García-Báez E, Aríza-Castolo A, Peraza-Campos A, Martínez-Martínez F. NMR Structural Study of the Prototropic Equilibrium in Solution of Schiff Bases as Model Compounds. Molecules. 2014; 19(1):459-481. https://doi.org/10.3390/molecules19010459
Chicago/Turabian StyleOrtegón-Reyna, David, Cesar Garcías-Morales, Itzia Padilla-Martínez, Efren García-Báez, Armando Aríza-Castolo, Ana Peraza-Campos, and Francisco Martínez-Martínez. 2014. "NMR Structural Study of the Prototropic Equilibrium in Solution of Schiff Bases as Model Compounds" Molecules 19, no. 1: 459-481. https://doi.org/10.3390/molecules19010459
APA StyleOrtegón-Reyna, D., Garcías-Morales, C., Padilla-Martínez, I., García-Báez, E., Aríza-Castolo, A., Peraza-Campos, A., & Martínez-Martínez, F. (2014). NMR Structural Study of the Prototropic Equilibrium in Solution of Schiff Bases as Model Compounds. Molecules, 19(1), 459-481. https://doi.org/10.3390/molecules19010459