Characterization of Nucleosides and Nucleobases in Natural Cordyceps by HILIC–ESI/TOF/MS and HILIC–ESI/MS

Abstract
:1. Introduction
2. Results and Discussion
2.1. Optimization of HILIC-ESI-MS/MS Conditions


| Peak No. | Compounds | Precursor ions (m/z) | Product ions (m/z) | Monitoring mode | Collision energy(V) |
|---|---|---|---|---|---|
| 1 | Thymine | 127.1 [M+H]+ | SIM | - | |
| 2 | Uracil | 113.1 [M+H]+ | SIM | - | |
| 3 | Thymidine | 243.1 [M+H]+ | 127.2 [M−116+H]+ | MRM | 14 |
| 4 | 2'-Deoxyuridine | 250.9 [M+Na]+ | SIM | - | |
| 5 | Cordycepin | 252.2 [M+H]+ | 136.1 [M−116+H]+ | MRM | 20 |
| 6 | Uridine | 245 [M+H]+ | 113 [M−132+H]+ | MRM | 8 |
| 7 | Hypoxanthine | 137 [M+H]+ | SIM | - | |
| 8 | Adenine | 136.1 [M+H]+ | SIM | - | |
| 9 | Adenosine | 268.2 [M+H]+ | 136.1 [M−132+H]+ | MRM | 20 |
| 10 | Xanthine | 153.1 [M+H]+ | SIM | - | |
| 11 | Inosine | 269 [M+H]+ | 137.1 [M−132+H]+ | MRM | 22 |
| 12 | Cytosine | 112.1 [M+H]+ | SIM | - | |
| 13 | Guanine | 152 [M+H]+ | SIM | - | |
| 14 | Cytidine | 244.1 [M+H]+ | 112.1 [M−132+H]+ | MRM | 16 |
| 15 | Guanosine | 284 [M+H]+ | 152 [M−132+H]+ | MRM | 14 |
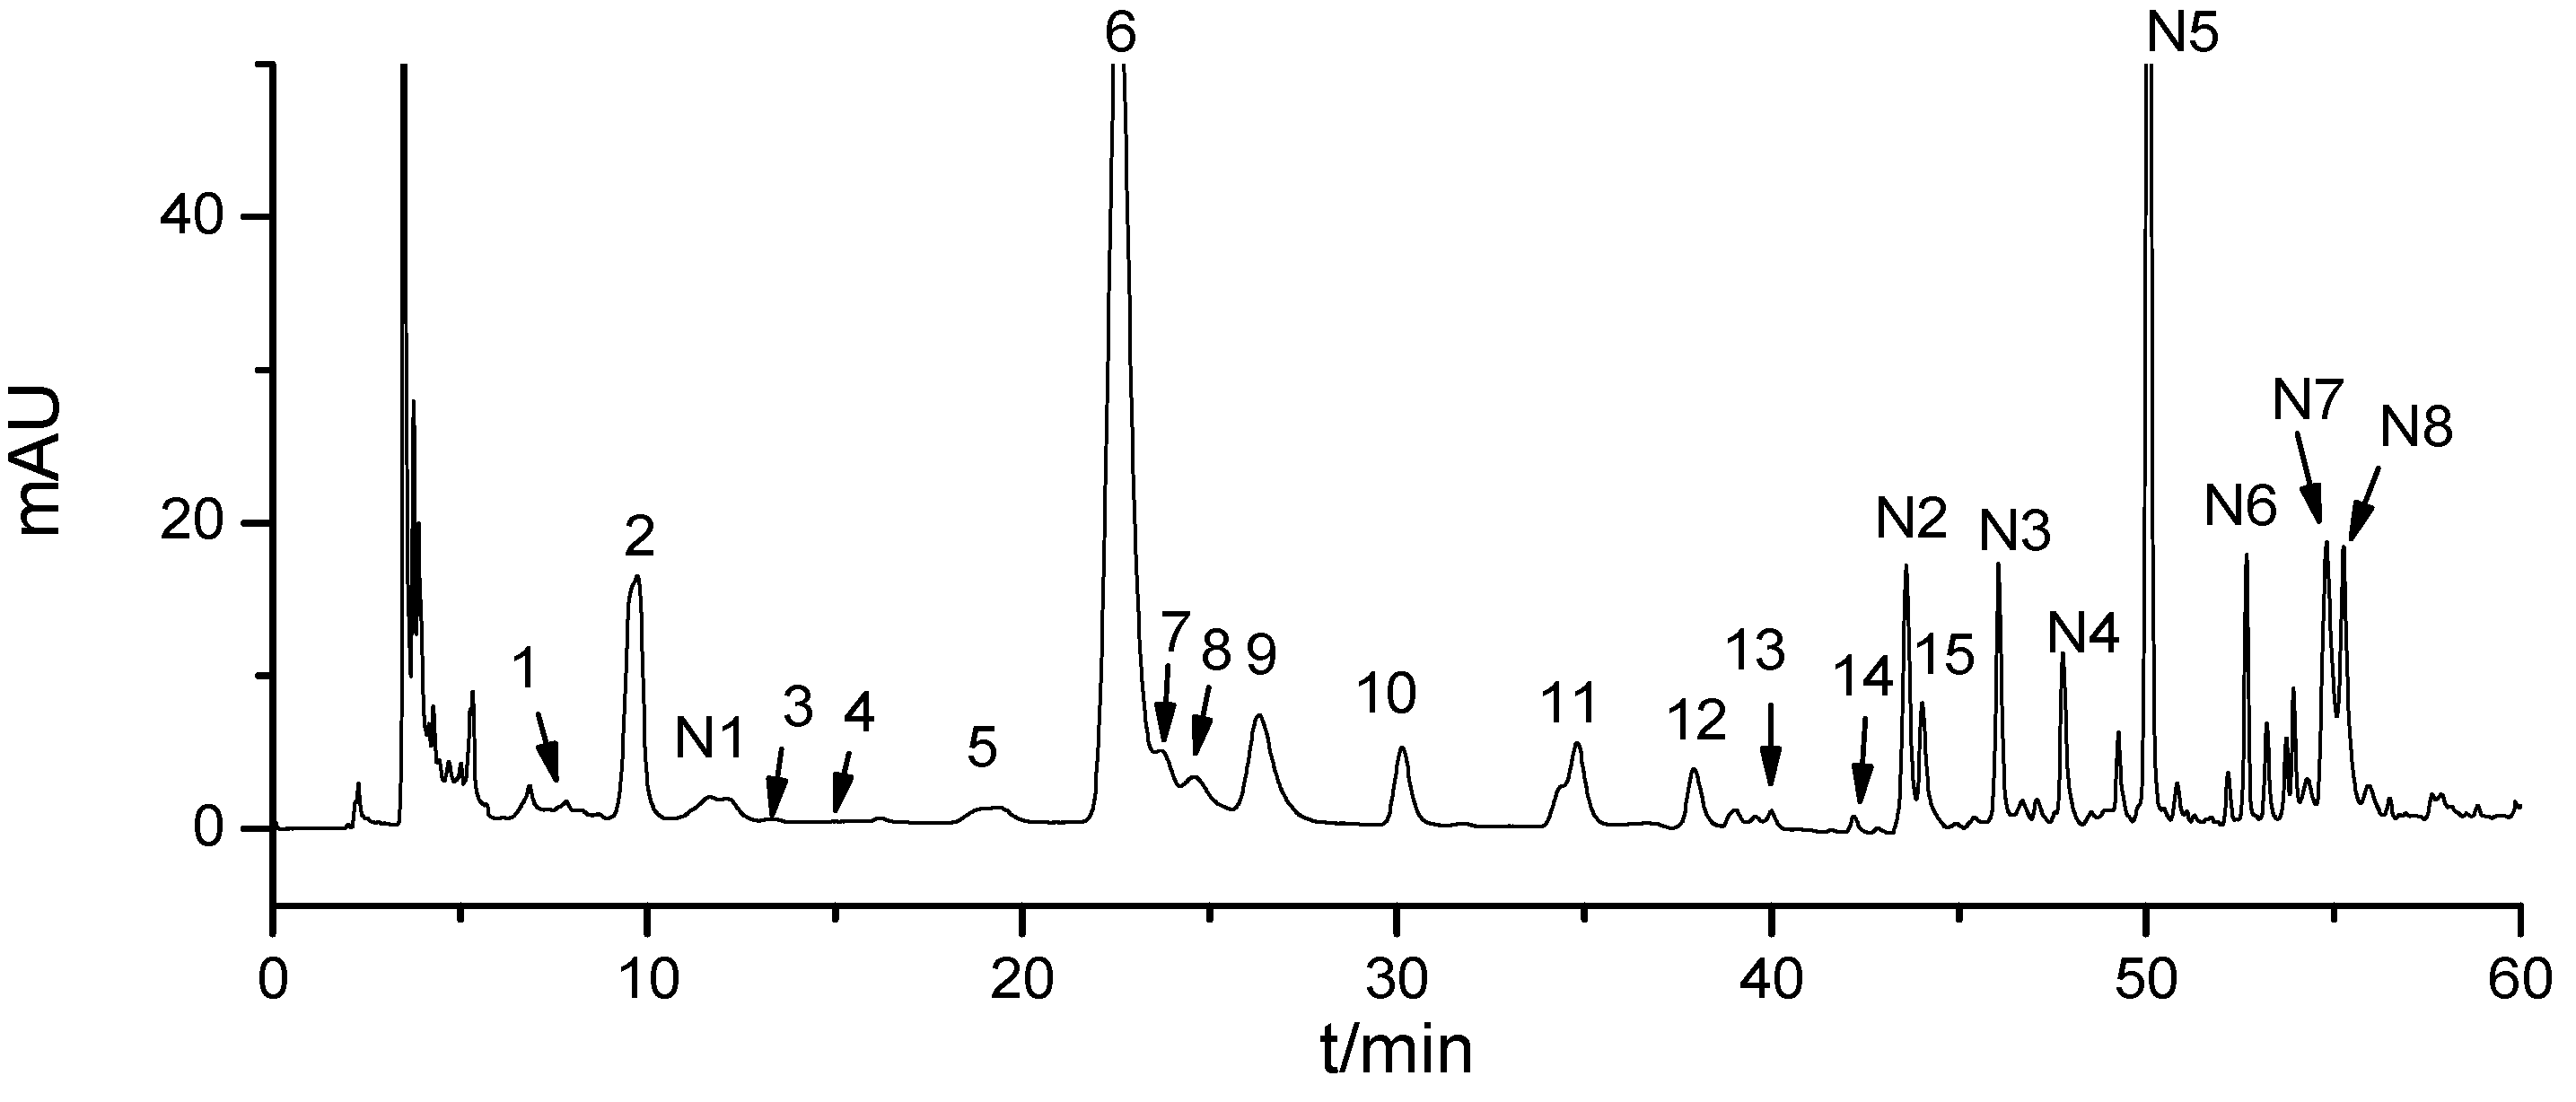
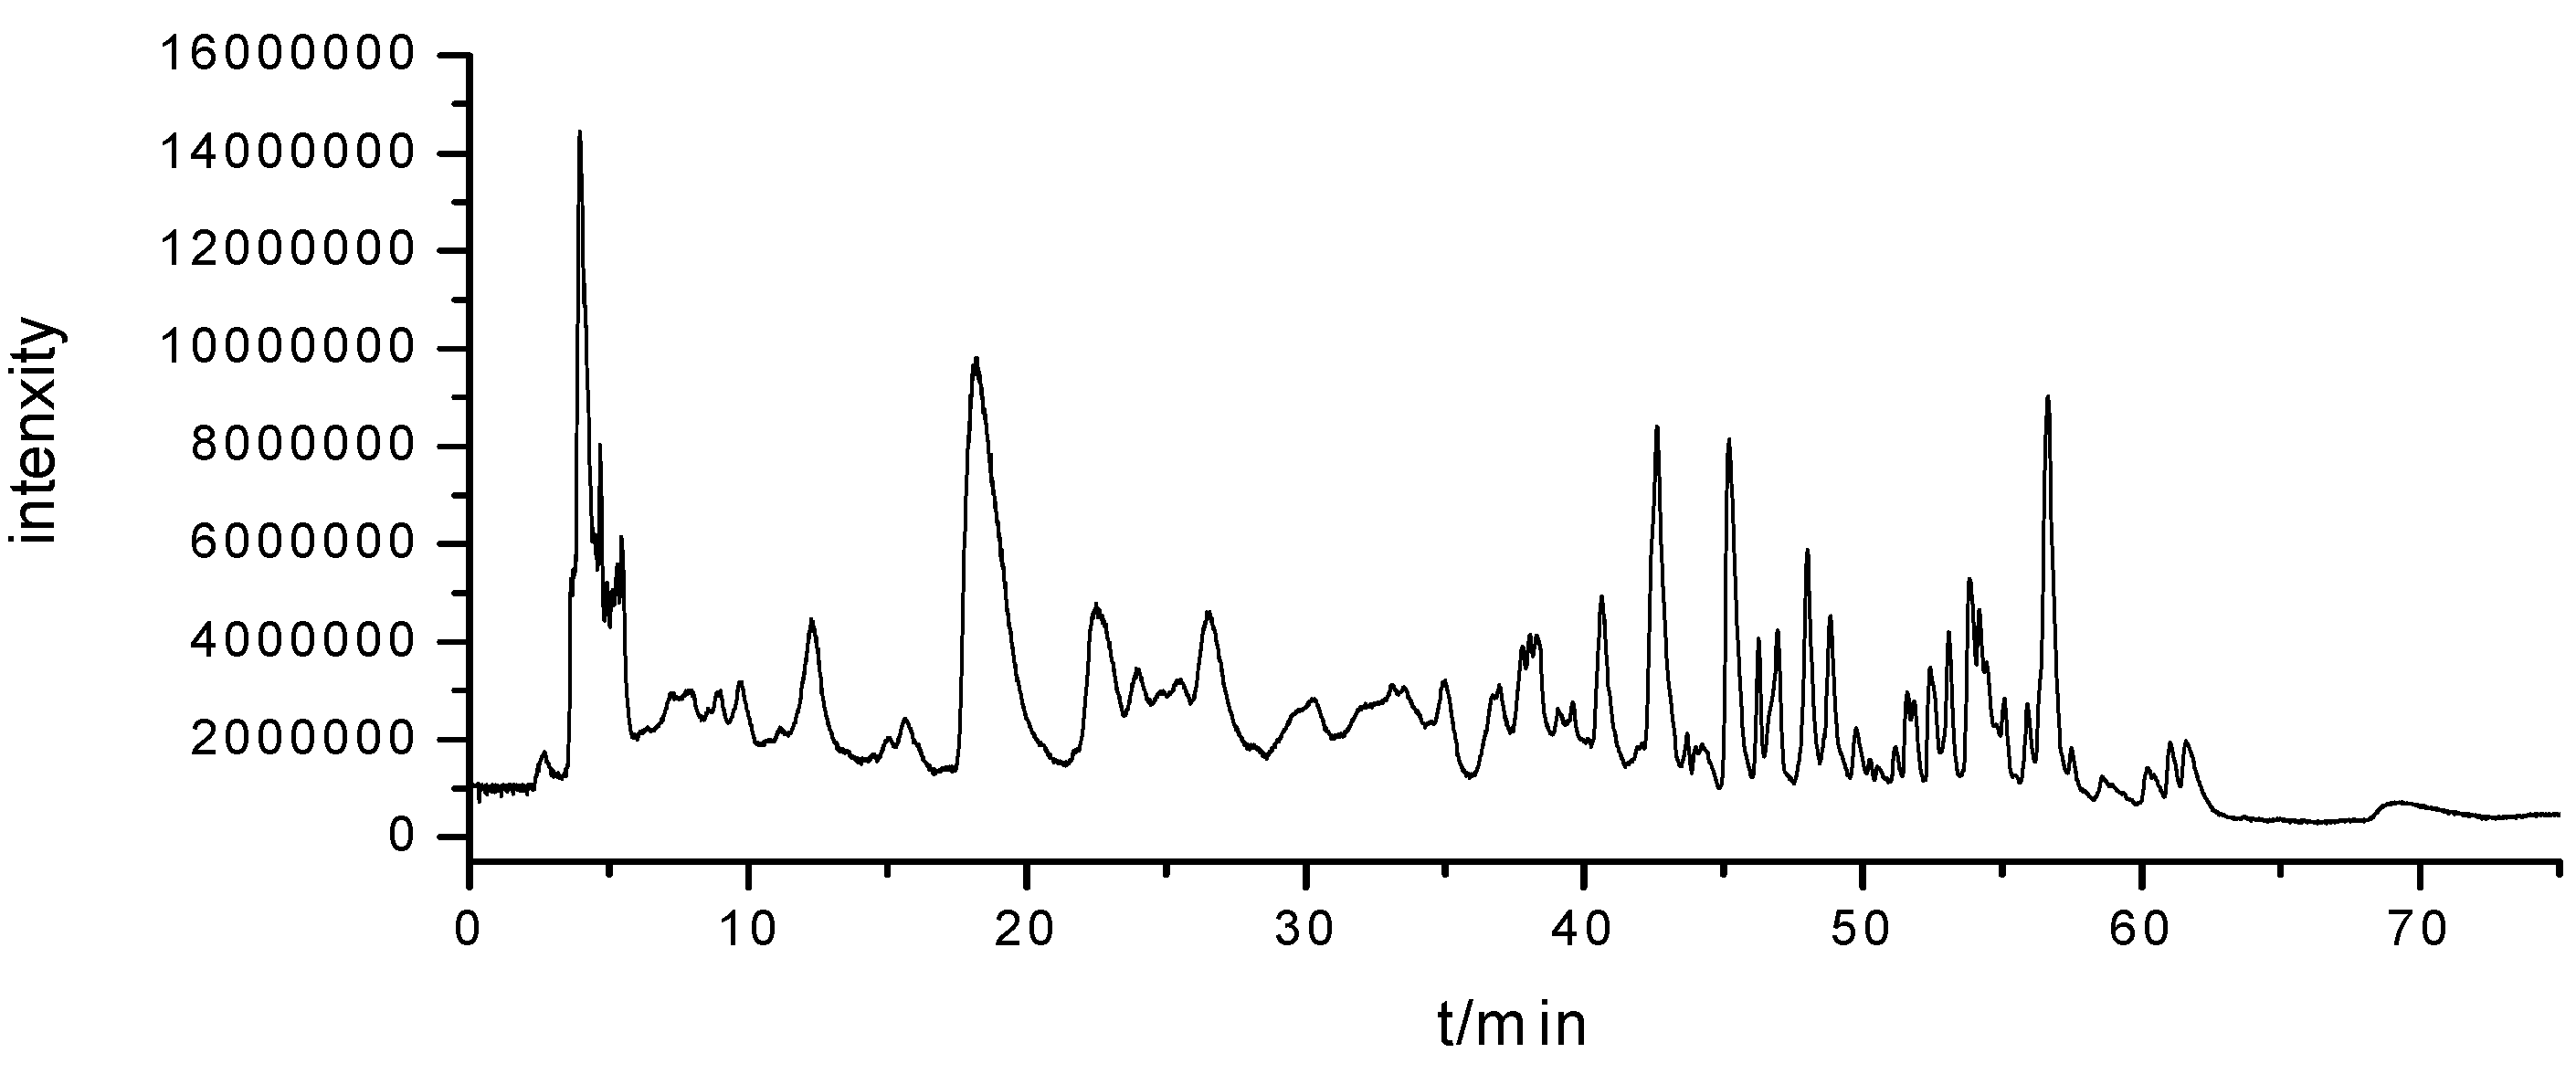
2.2. Qualitative Analysis for Cordyceps Extracts by HILIC-DAD-ESI-TOF/MS
| Peak No. | Retention time (min) | Compounds | Proposal ions | Elemental composition | Theoretical value m/z | Experimental m/z | Error (ppm) | UV λmax (nm) |
|---|---|---|---|---|---|---|---|---|
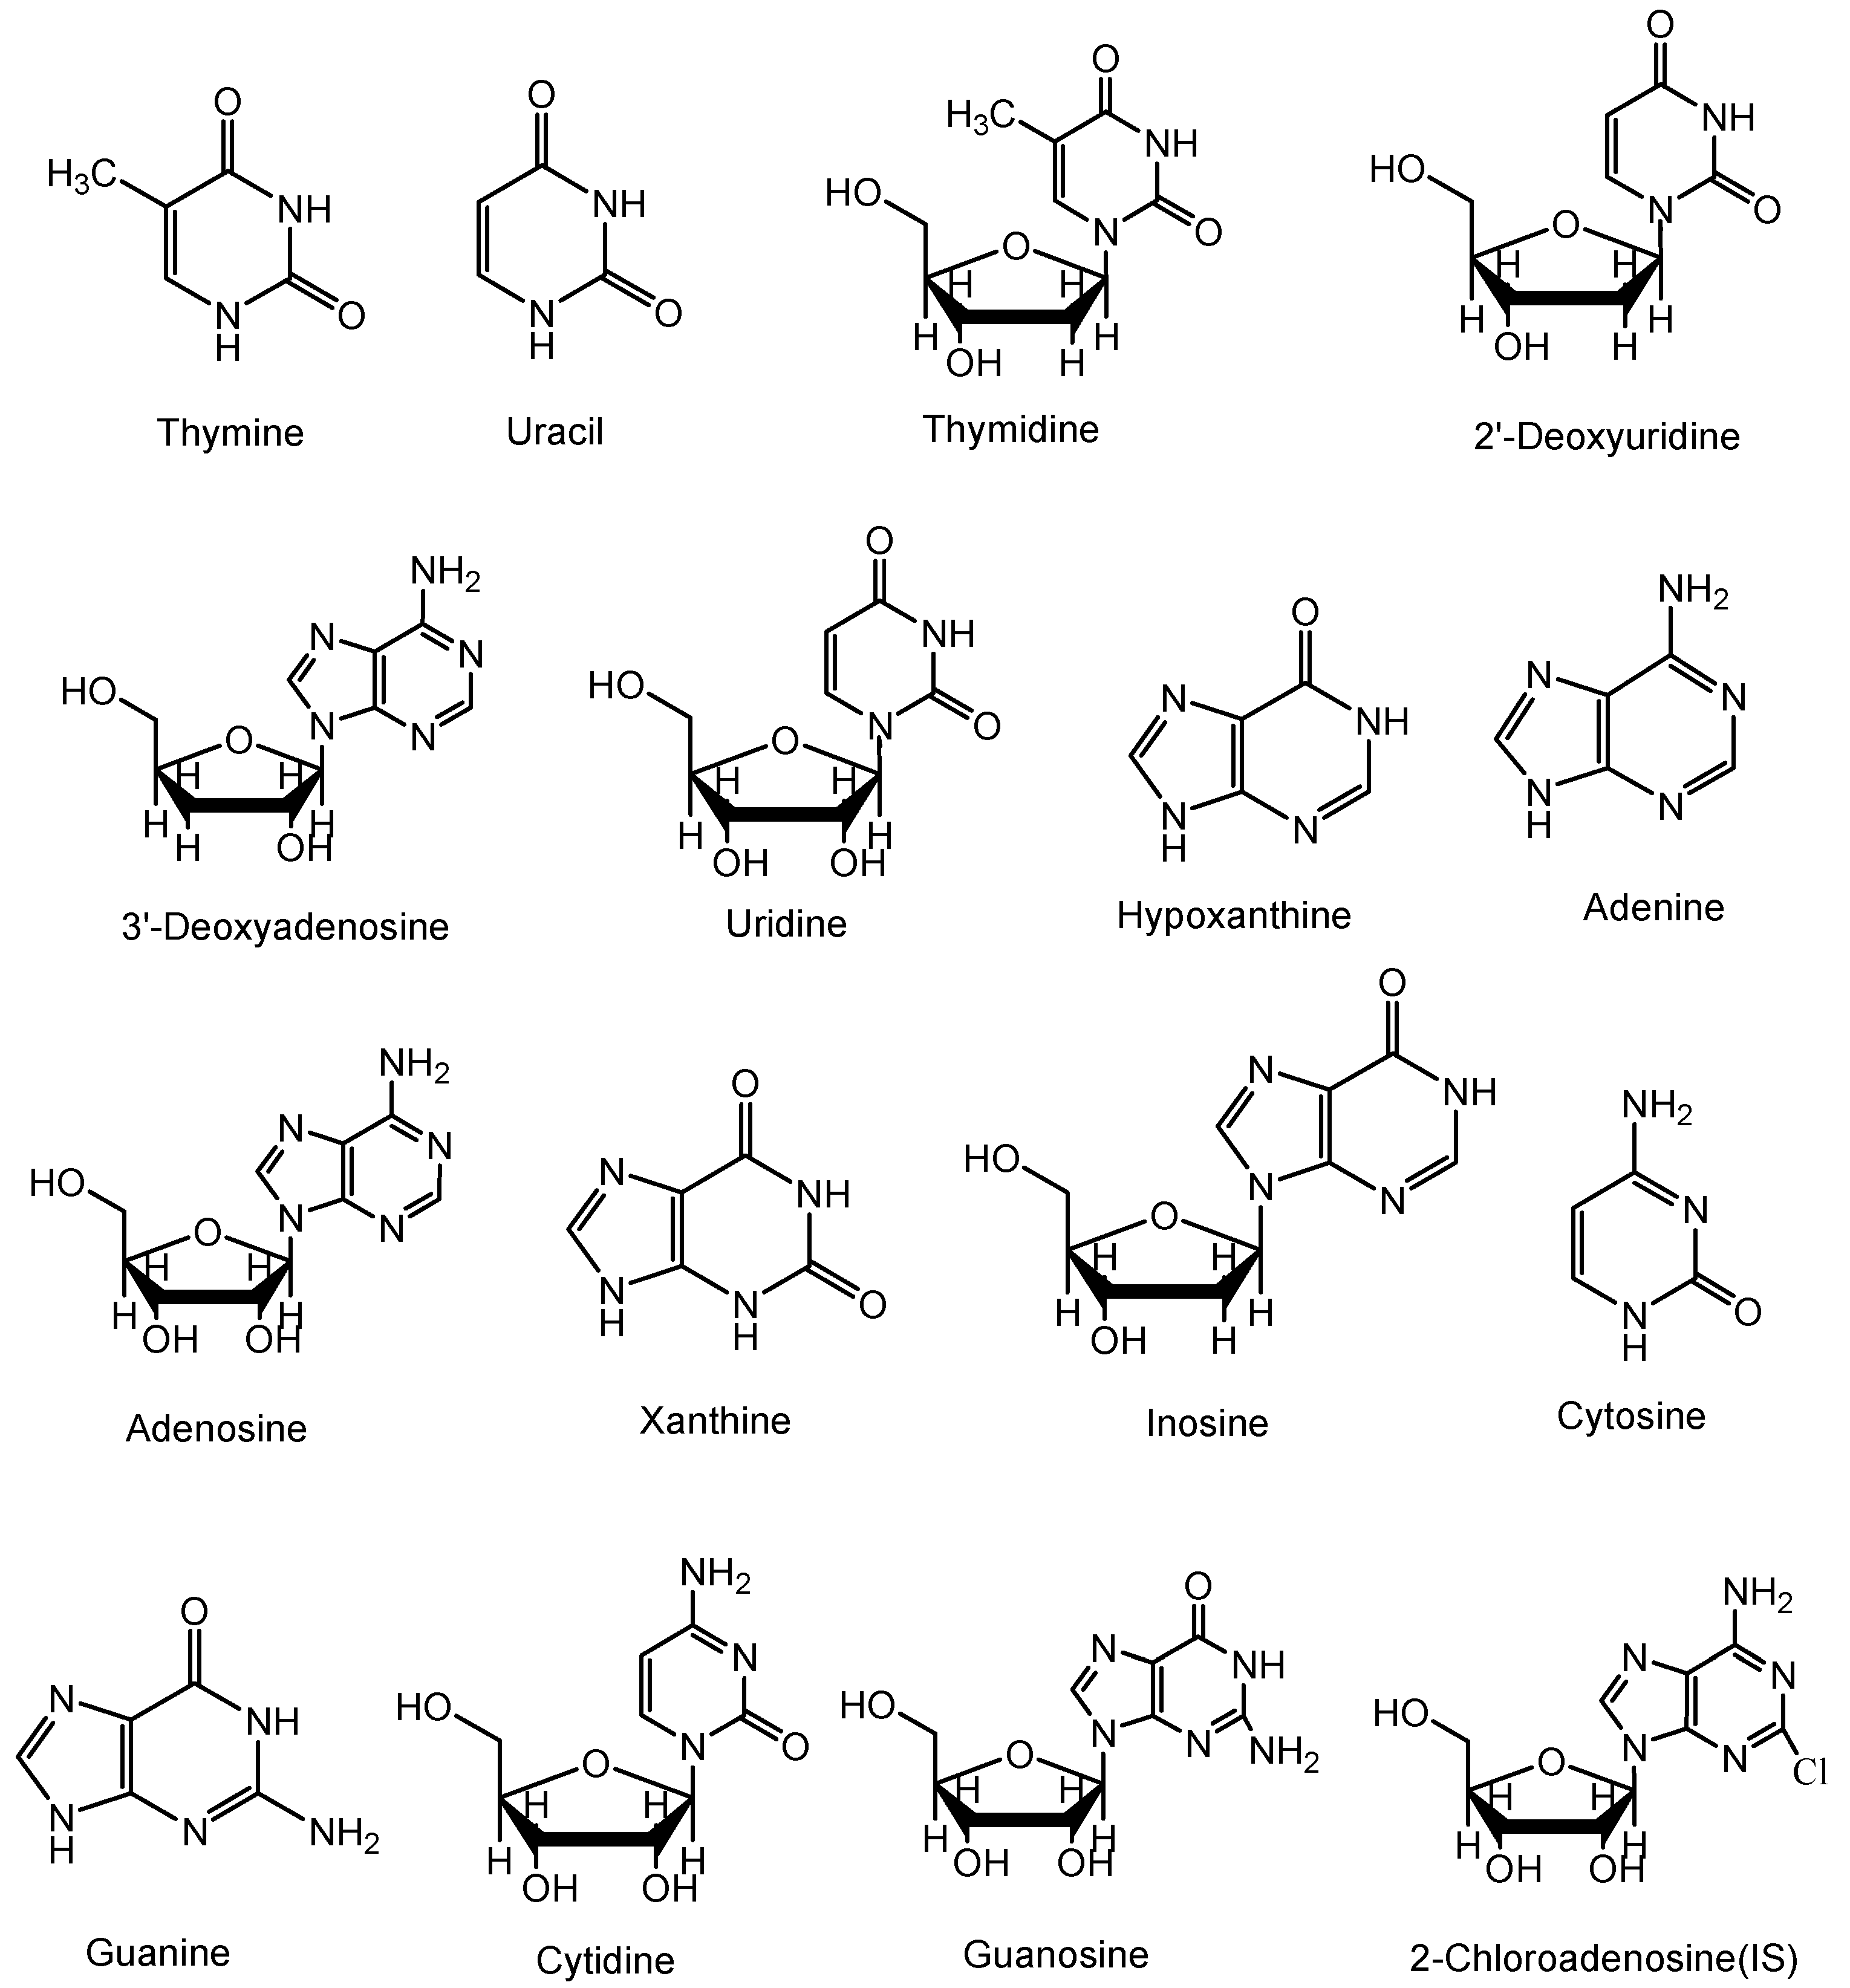
| 1 | 8.1 | Thymine | [M+H]+ | C5H7N2O2 | 127.0502 | 127.0504 | 1.5742 | 260 |
| 2 | 9.8 | Uracil | [M+H]+ | C4H5N2O2 | 113.0346 | 113.0348 | 1.7694 | 262 |
| 3 | 13.8 | Thymidine | [M+H]+ | C10H15N2O5 | 243.0976 | 243.0979 | 1.2341 | 263 |
| [M−C5H8O3+H]+ | C5H7N2O2 | 127.0502 | 127.0500 | −1.5742 | ||||
| 4 | 15.7 | 2'-Deoxyadenosine | [M+H]+ | C10H14N5O3 | 252.1091 | 252.1088 | −1.9000 | 263 |
| [M+Na]+ | C10H13N5O3Na | 274.0911 | 274.0915 | 1.4593 | ||||
| [M−C5H8O3+H]+ | C5H6N5 | 136.0618 | 136.0621 | 2.2049 | ||||
| 5 | 19.3 | Cordycepin | [M+H]+ | C10H14N5O3 | 252.1091 | 252.1096 | 1.9833 | 265 |
| 6 | 23.4 | Uridine | [M+H]+ | C9H13N2O6 | 245.0768 | 245.0771 | 1.2241 | 260 |
| [M−C5H8O4+H]+ | C4H5N2O2 | 113.0346 | 113.0350 | 3.5387 | ||||
| 7 | 24.2 | Hypoxanthine | [M+H]+ | C5H5N4O | 137.0458 | 137.0460 | 1.4594 | 257 |
| [2M+H]+ | C10H9N8O2 | 273.0843 | 273.0841 | −0.7324 | ||||
| 8 | 24.9 | Adenine | [M+H]+ | C5H6N5 | 136.0618 | 136.0621 | 2.2049 | 260 |
| 9 | 26.7 | Adenosine | [M+H]+ | C10H14N5O4 | 268.1040 | 268.1043 | 1.1190 | 262 |
| [M-C5H8O4+H]+ | C5H6N5 | 136.0618 | 136.0622 | 2.9398 | ||||
| 10 | 30.4 | Xanthine | [M+H]+ | C5H5N4O2 | 153.0407 | 153.0405 | −1.3068 | 262 |
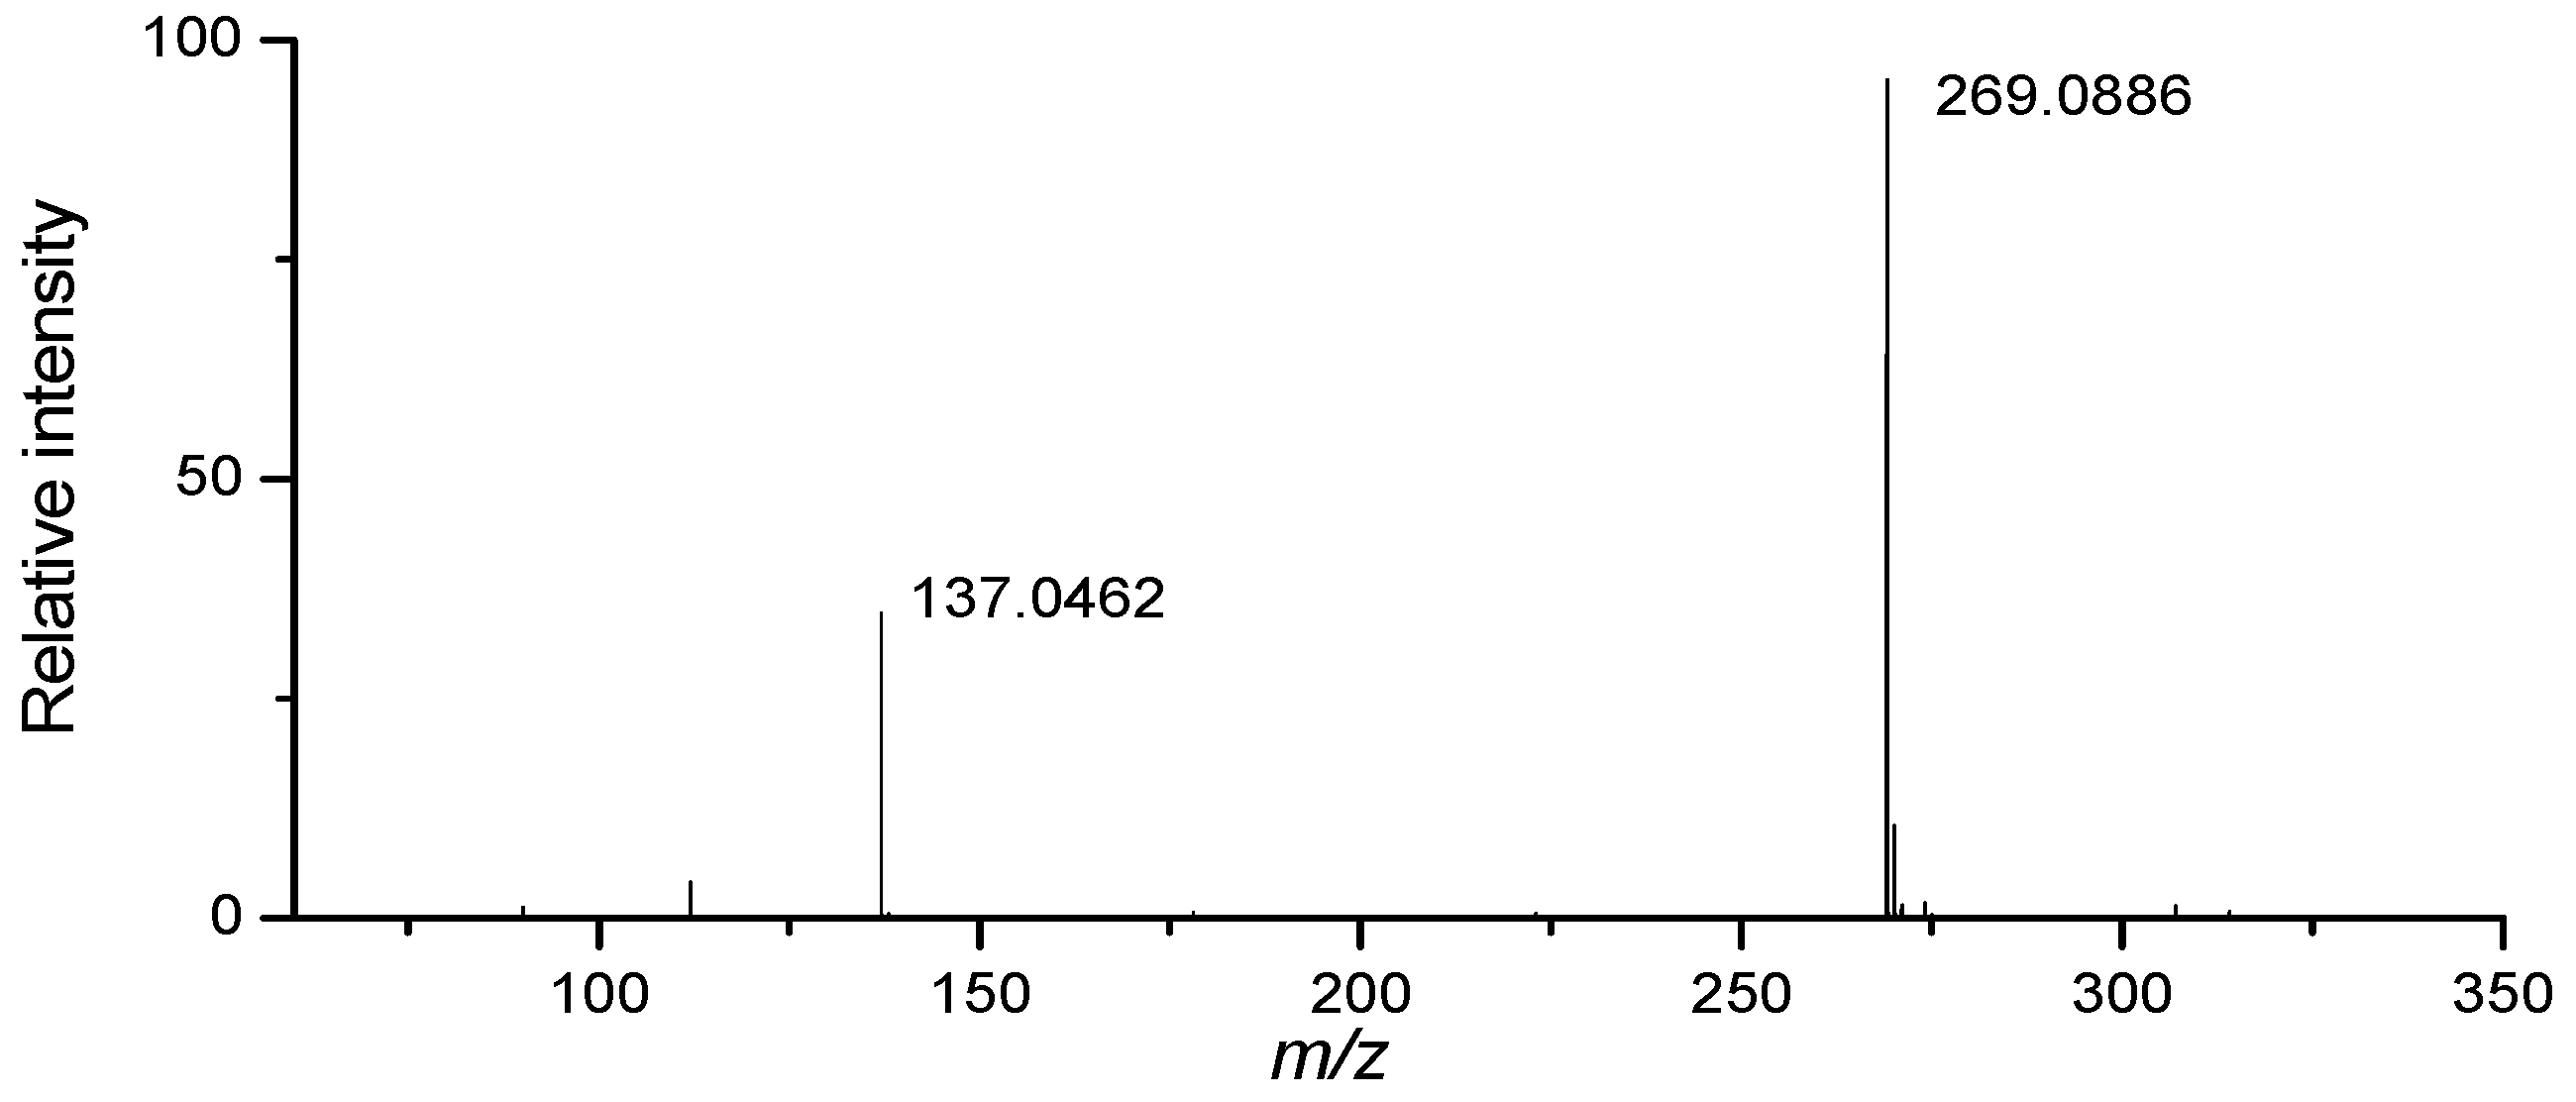
| 11 | 35.2 | Inosine | [M+H]+ | C10H13N4O5 | 269.0881 | 269.0884 | 1.1149 | 263 |
| [M−C5H8O4+H]+ | C5H5N4O | 137.0458 | 137.0455 | −2.1890 | ||||
| 12 | 38.1 | Cytosine | [M+H]+ | C4H6N3O | 112.0505 | 112.0507 | 1.7849 | 257 |
| [2M+H]+ | C8H11N6O2 | 223.0938 | 223.0941 | 1.3447 | ||||
| 13 | 40.2 | Guanine | [M+H]+ | C5H6N5O | 152.0567 | 152.0571 | 2.6306 | 257 |
| [2M+H]+ | C10H11N10O2 | 303.1061 | 303.1064 | 0.9898 | ||||
| 14 | 42.2 | Cytidine | [M+H]+ | C9H14N3O5 | 244.0928 | 244.0931 | 1.2290 | 262 |
| [M−C5H8O4+H]+ | C4H6N3O | 112.0505 | 112.0507 | 1.7849 | ||||
| 15 | 44.1 | Guanosine | [M+H]+ | C10H14N5O5 | 284.0990 | 284.0994 | 1.4080 | 260 |
| [M−C5H8O4+H]+ | C5H6N5O | 152.0567 | 152.0570 | 1.9729 | ||||
| N1 | 12.1 | Unknown | [M+H]+ | C17H23N10O8 | 495.1695 | 495.1687 | −1.6156 | |
| N2 | 43.6 | Unknown | [M+H]+ | C11H21N2O3 | 229.1547 | 229.1553 | 2.6183 | |
| N3 | 46.2 | Unknown | [M+H]+ | C13H23N2O6 | 303.1551 | 303.1549 | −0.6597 | |
| [M+K]+ | C13H22N2O6K | 341.1109 | 341.1112 | 0.8795 | ||||
| [2M+Na]+ | C26H44N4O12Na | 627.2848 | 627.2852 | 0.6377 | ||||
| N4 | 47.8 | Unknown | [M+H]+ | C11H21N2O5 | 261.1445 | 261.1441 | 1.5317 | |
| N5 | 50.1 | Unknown | [M+H]+ | C12H12N3O2 | 230.0924 | 230.0929 | 2.1730 | |
| [M+Na]+ | C12H11N3O2 Na | 252.0743 | 252.0749 | 2.3803 | ||||
| N6 | 52.3 | Unknown | [M+H]+ | C7H16NO3 | 162.1125 | 162.1121 | −2.4674 | |
| [M+Na]+ | C7H15NO3Na | 184.0944 | 184.0939 | 2.7160 | ||||
| N7 | 54.9 | Unknown | [M+H]+ | C11H12N7O | 258.1098 | 258.1101 | 1.1623 | |
| [M+Na]+ | C11H11N7ONa | 280.0917 | 280.0922 | 1.7851 | ||||
| N8 | 55.3 | Unknown | [M+H]+ | C21H21O7 | 385.1282 | 385.1286 | 1.0386 |

2.3. Validation of the Method
| Peak No. | Compounds | Regression equation | R2 | Linear range (µg/mL) | LOD (ng/mL) | LOQ (ng/mL) |
|---|---|---|---|---|---|---|
| 1 | Thymine | y = 0.1312 x − 0.0034 | 0.9974 | 0.050–5.000 | 2.50 | 8.33 |
| 2 | Uracil | y = 0.0491 x + 0.0005 | 0.9976 | 0.010–1.000 | 2.14 | 7.14 |
| 3 | Thymidine | y = 0.0241 x + 0.0002 | 0.9999 | 0.050–5.000 | 10.00 | 33.33 |
| 4 | 2'-Deoxyuridine | y = 0.1368 x + 0.0011 | 0.9999 | 0.050–1.000 | 3.75 | 12.50 |
| 5 | Cordycepin | y = 4.2277 x + 0.0670 | 0.9980 | 0.005–1.000 | 0.21 | 0.71 |
| 6 | Uridine | y = 0.2125 x + 0.0008 | 0.9999 | 0.010–1.000 | 1.50 | 5.00 |
| 7 | Hypoxanthine | y = 0.5223 x + 0.0220 | 0.9992 | 0.005–5.000 | 0.38 | 1.25 |
| 8 | Adenine | y = 4.7164 x + 0.0783 | 0.9982 | 0.001–1.000 | 0.15 | 0.50 |
| 9 | Adenosine | y = 2.0966 x + 0.1344 | 0.9980 | 0.010–5.000 | 0.60 | 2.00 |
| 10 | Xanthine | y = 0.0752 x + 0.0008 | 0.9999 | 0.050–1.000 | 5.00 | 16.67 |
| 11 | Inosine | y = 0.6156 x + 0.0717 | 0.9965 | 0.010–5.000 | 1.50 | 5.00 |
| 12 | Cytosine | y = 1.7112 x − 0.0082 | 0.9993 | 0.010–1.000 | 0.86 | 2.86 |
| 13 | Guanine | y = 0.2710 x + 0.0013 | 0.9997 | 0.010–5.000 | 2.50 | 8.33 |
| 14 | Cytidine | y = 0.0829 x − 0.0001 | 0.9999 | 0.020–5.000 | 5.13 | 17.10 |
| 15 | Guanosine | y = 0.0395 x + 0.0004 | 0.9974 | 0.050–10.000 | 7.50 | 25.00 |
| Peak No. | Compounds | Precision (RSD, %; n = 6) | Stability (R.S.D, %) | Recovery (n = 3, %) | |
|---|---|---|---|---|---|
| Intra-day | Inter-day | ||||
| 1 | Thymine | 3.65 | 4.42 | 4.27 | 93.2 |
| 2 | Uracil | 3.71 | 3.29 | 3.95 | 87.5 |
| 3 | Thymidine | 2.89 | 4.61 | 4.11 | 96.7 |
| 4 | 2'-Deoxyuridine | 2.45 | 5.27 | 4.38 | 105.3 |
| 5 | Cordycepin | 3.79 | 4.75 | 5.01 | 115.2 |
| 6 | Uridine | 2.95 | 3.31 | 3.85 | 92.1 |
| 7 | Hypoxanthine | 3.18 | 6.27 | 4.18 | 114.5 |
| 8 | Adenine | 3.60 | 4.59 | 3.89 | 107.3 |
| 9 | Adenosine | 4.58 | 5.33 | 4.53 | 84.6 |
| 10 | Xanthine | 4.21 | 5.72 | 5.27 | 105.7 |
| 11 | Inosine | 5.23 | 6.73 | 5.69 | 116.5 |
| 12 | Cytosine | 2.79 | 4.54 | 3.25 | 93.9 |
| 13 | Guanine | 4.17 | 5.18 | 4.93 | 83.6 |
| 14 | Cytidine | 4.25 | 4.65 | 5.31 | 117.3 |
| 15 | Guanosine | 4.83 | 5.89 | 4.57 | 92.1 |
| Peak No. | Compounds | 1# | 2# | 3# | 4# | 5# | 6# | 7# | 8# | 9# | 10# | 11# | 12# |
|---|---|---|---|---|---|---|---|---|---|---|---|---|---|
| 1 | Thymine | 1.88 | 2.42 | 1.54 | 5.16 | 5.27 | 5.89 | 4.43 | 2.31 | 16.10 | 5.39 | 2.26 | 3.49 |
| 2 | Uracil | 1.47 | 3.78 | 2.80 | 43.09 | 37.98 | 35.69 | 17.37 | 2.46 | 116.53 | 116.21 | 2.83 | 2.53 |
| 3 | Thymidine | 2.97 | 6.24 | 229.75 | 222.42 | 154.24 | 192.66 | 163.48 | 127.82 | 170.05 | 148.97 | 113.54 | 209.86 |
| 4 | 2'-Deoxyuridine | 0.98 | + b | + | 3.19 | 3.23 | 3.54 | 3.82 | 2.42 | 2.58 | 4.86 | 2.09 | 1.49 |
| 5 | Cordycepin | 0.06 | 0.58 | 0.29 | 0.14 | 12.68 | 1.61 | 0.22 | 0.29 | 1.20 | 0.61 | 0.09 | 0.56 |
| 6 | Uridine | 161.30 | 39.49 | 190.09 | 190.99 | 273.30 | 119.11 | 160.69 | 59.44 | 22.85 | 23.68 | 72.08 | 124.01 |
| 7 | Hypoxanthine | 22.14 | 24.72 | 29.98 | 461.72 | 259.85 | 352.64 | 323.52 | 20.60 | 347.87 | 324.04 | 18.02 | 133.65 |
| 8 | Adenine | 23.24 | 46.95 | 59.45 | 31.16 | 33.99 | 15.58 | 29.59 | 29.33 | 22.90 | 16.63 | 29.21 | 37.24 |
| 9 | Adenosine | 123.77 | 393.74 | 480.25 | 147.87 | 157.59 | 93.12 | 151.30 | 354.05 | 92.37 | 46.40 | 250.47 | 203.09 |
| 10 | Xanthine | 2.09 | + | + | 121.19 | 102.46 | 194.46 | 172.88 | 0.78 | 638.78 | 747.31 | 1.28 | 5.99 |
| 11 | Inosine | 13.33 | 143.01 | 187.69 | 112.88 | 145.24 | 187.78 | 148.75 | 73.39 | 71.35 | 59.03 | 50.99 | 103.42 |
| 12 | Cytosine | + | 10.27 | 11.08 | 24.40 | 16.22 | 12.76 | 14.42 | 5.38 | + | 7.28 | + | + |
| 13 | Guanine | 1.05 | 0.86 | 0.50 | 33.01 | 13.39 | 7.82 | 12.85 | 4.93 | 18.82 | 60.38 | 2.42 | 8.08 |
| 14 | Cytidine | 2.06 | 23.90 | 4.97 | 2.88 | + | + | 4.76 | 6.89 | 10.52 | 5.70 | 6.74 | + |
| 15 | Guanosine | 32.10 | 34.69 | 146.42 | 123.79 | 123.42 | 139.01 | 128.67 | 54.073 | 49.67 | 56.35 | 41.25 | 80.16 |
| total | 388.43 | 730.64 | 1344.80 | 1523.89 | 1338.85 | 1361.69 | 1336.75 | 744.16 | 1581.59 | 1622.84 | 593.27 | 913.58 |
2.4. Quantitative Analysis of Investigated Compounds in Natural Cordyceps by HILIC-ESI/MS/MS
3. Experimental
3.1. Materials and Standards
| Sample | Region | Sample | Region |
|---|---|---|---|
| 1 | Dawu Town, Qinghai Province | 7 | Manzhang Town, Qinghai Province |
| 2 | Dawu Town, Qinghai Province | 8 | Duogongma Town, Qinghai Province |
| 3 | Xueshan Town, Qinghai Province | 9 | Baiyu Town, Qinghai Province |
| 4 | Xueshan Town, Qinghai Province | 10 | Suohumari Town, Qinghai Province |
| 5 | Xiamagong Town, Qinghai Province | 11 | Lajishankou, Qinghai province |
| 6 | Jianshe Town, Qinghai Province | 12 | Naqu, Tibet |

3.2. Sample Preparation
3.3. HILIC-DAD
3.4. HILIC-ESI-TOF/MS Analysis
3.5. HILIC-ESI-MS/MS Analysis
3.6. Calibration Solutions
4. Conclusions
Acknowledgments
Conflicts of Interest
References
- Zhou, X.W.; Gong, Z.H.; Su, Y.; Lin, J.; Tang, K.X. Cordyceps fungi: natural products, pharmacological functions and developmental products. J. Pharm. Pharmac. 2009, 61, 279–291. [Google Scholar] [CrossRef]
- Yu, R.M.; Song, L.Y.; Zhao, Y.; Bin, W.; Wang, L.; Zhang, H.; Wu, Y.H.; Ye, W.C.; Yao, X.S. Isolation and biological properties of polysaccharide CPS-1 from cultured Cordyceps militaris. Fitoter 2004, 75, 465–472. [Google Scholar] [CrossRef]
- Won, S.Y.; Park, E.H. Anti-inflammatory and related pharmacological activities of cultured mycelia and fruiting bodies of Cordyceps militaris. J. Ethnopharmacol. 2005, 96, 555–561. [Google Scholar] [CrossRef]
- Yu, R.M.; Wang, L.; Zhang, H.; Zhou, C.X.; Zhao, Y. Isolation, Purification and identification of polysaccharides from cultured Cordyceps militaris. Fitoter. 2004, 75, 662–666. [Google Scholar] [CrossRef]
- Huang, H.Y.; Zhong, J.L.; Xie, Q.F. Review of quality control methods for Cordyceps. China Pharm. 2010, 19, 88–90. [Google Scholar]
- Li, S.P.; Yang, F.Q.; Tsim, K.W.K. Quality control of Cordyceps sinensis, a valued traditional Chinese medicine. J. Pharm. Biomed. Anal. 2006, 41, 1571–1584. [Google Scholar] [CrossRef]
- Chen, P.X.; Wang, S.A.; Nie, S.P.; Marcone, M. Properties of Cordyceps Sinensis: A review. J. Funct. Foods 2013, 5, 550–569. [Google Scholar] [CrossRef]
- Jacobson, K.A.; Jarvis, M.F.; Williams, M. Purine and Pyrimidine (P2) receptors as drug targets. J. Med. Chem. 2002, 45, 4057–4093. [Google Scholar] [CrossRef]
- Ralevic, V.; Burnstock, G. Receptors for purines and pyrimidines. Pharmacol. Rev. 1998, 50, 413–492. [Google Scholar]
- Guo, S.; Duan, J.A.; Qian, D.W.; Wang, H.Q.; Tang, Y.P.; Qian, Y.F.; Wu, D.W.; Su, S.L.; Shang, E.X. Hydrophilic interaction ultra-high performance liquid chromatography coupled with triple quadrupole mass spectrometry for determination of nucleotides, Nucleosides and nucleobases in Ziziphus plants. J. Chromatogr. A 2013, 1301, 147–155. [Google Scholar]
- Sánchez-Pozo, A.; Gil, A. Nucleotides as semiessential nutritional components. Br. J. Nutr. 2002, 87, 135–137. [Google Scholar] [CrossRef]
- Schmidt, A.P.; Lara, D.R.; Maraschin, J.F.; Perla, A.S.; Souza, D.O. Guanosine and GMP prevent seizures induced by quinolinic acid in mice. Brain Res. 2000, 864, 40–43. [Google Scholar] [CrossRef]
- Anfossi, G.; Russo, I.; Massucco, P.; Mattiello, L.; Cavalot, F.; Balbo, A.; Trovati, M. Adenosine increases human platelet levels of 3′,5′-cGMP through nitric oxide: Possible role in its antiaggregating effect. Thromb Res. 2002, 105, 71–78. [Google Scholar] [CrossRef]
- Wang, J.; Huang, Z.G.; Cao, H.; Wang, Y.T.; Hui, P.; Hoo, C.; Li, S.P. Screening of anti-platelet aggregation agents from Panax notoginseng using human platelet extraction and HPLC–DAD–ESI-MS/MS. J. Sep. Sci. 2008, 31, 1173–1180. [Google Scholar] [CrossRef]
- Liebich, H.M.; Stefano, C.D.; Wixforth, A.; Schmid, H.R. Quantitation of urinary nucleosides by high-performance liquid chromatography. J. Chromatogr. A 1997, 763, 193–197. [Google Scholar] [CrossRef]
- Wang, Z.B.; Li, N.; Wang, M.; Wang, Y.; Du, L.; Ji, X.F.; Yu, A.M.; Zhang, H.Q.; Qiu, F.P. Simultaneous determination of nucleosides and their bases in Cordyceps sinensis and its substitutes by matrix solid-phase dispersion extraction and HPLC. J. Sep. Sci. 2013, 36, 2348–2357. [Google Scholar] [CrossRef]
- Yang, F.Q.; Guan, J.; Li, S.P. Fast simultaneous determination of 14 nucleosides and nucleobases in cultured Cordyceps using ultra-performance liquid chromatography. Talanta 2007, 73, 269–273. [Google Scholar] [CrossRef]
- Viñas, P.; Campillo, N.; Melgarejo, G.F.; Vasallo, M.I.; López-García, I.; Hernández-Córdoba, M. Ion-pair high-performance liquid chromatography with diode array detection coupled to dual electrospray atmospheric pressure chemical ionization time-of-flight mass spectrometry for the determination of nucleotides in baby foods. J. Chromatogr. A 2010, 1217, 5197–5203. [Google Scholar]
- Yang, F.Q.; Li, D.Q.; Feng, K.; Hu, D.J.; Li, S.P. Determination of nucleotides, nucleosides and their transformation products in Cordyceps by ion-pairing reversed-phase liquid chromatography–mass spectrometry. J. Chromatogr. A 2010, 1217, 5501–5510. [Google Scholar]
- Gao, J.L.; Leung, K.S.Y.; Wang, Y.T.; Lai, C.M.; Li, S.P.; Hu, L.F.; Lu, G.H.; Jiang, Z.H.; Yu, Z.L. Qualitative and quantitative analyses of nucleosides and nucleobases in Ganoderma spp. by HPLC-DAD-MS. J. Pharm. Biomed. Anal. 2007, 44, 807–811. [Google Scholar] [CrossRef]
- Guo, F.Q.; Li, A.; Huang, L.F.; Liang, Y.Z.; Chen, B.M. Identification and determination of nucleosides in Cordyceps sinensis and its substitutes by high performance liquid chromatography with mass spectrometric detection. J. Pharm. Biomed. Anal. 2006, 40, 623–630. [Google Scholar] [CrossRef]
- Gong, Y.X.; Li, S.P.; Li, P.; Liu, J.J.; Wang, Y.T. Simultaneous determination of six main nucleosides and bases in natural and cultured Cordyceps by capillary electrophoresis. J. Chromatogr. A 2004, 1055, 215–221. [Google Scholar]
- Rao, Y.K.; Chou, C.H.; Tzeng, Y.M. A simple and rapid method for identification and determination of cordycepin in Cordyceps militaris by capillary electrophoresis. Anal. Chim. Acta 2006, 566, 253–258. [Google Scholar]
- Yang, F.Q.; Ge, L.Y.; Yong, J.W.H.; Tan, S.N.; Li, S.P. Determination of nucleosides and nucleobases in different species of Cordyceps by capillary electrophoresis–mass spectrometry. J. Pharm. Biomed. Anal. 2009, 50, 307–314. [Google Scholar] [CrossRef]
- Alpert, A.J. Hydrophilic-interaction chromatography for the separation of peptides, nucleic acids and other polar compounds. J. Chromatogr. A 1990, 499, 177–196. [Google Scholar] [CrossRef]
- Jin, Y.; Liang, T.; Fu, Q.; Xiao, Y.S.; Feng, J.T.; Ke, Y.X.; Liang, X.M. Fingerprint analysis of Ligusticum chuanxiong using hydrophilic interaction chromatography and reversed-phase liquid chromatography. J. Chromatogr. A 2009, 1216, 2136–2141. [Google Scholar]
- Zhao, H.Q.; Chen, J.H.; Shi, Q.; Li, X.; Zhou, W.H.; Zhang, D.L.; Zheng, L.; Cao, W.; Wang, X.R.; Lee, F.S.C. Simultaneous determination nucleosides in marine organisms using ultrasound-assisted extraction followed by hydrophilic interaction liquid chromatography–electrospray ionization time-of-flight mass spectrometry. J. Sep. Sci. 2011, 34, 2594–2601. [Google Scholar] [CrossRef]
- Fan, H.; Li, S.P.; Xiang, J.J.; Lai, C.M.; Yang, F.Q.; Gao, J.L.; Wang, Y.T. Qualitative and quantitative determination of nucleosides, bases and their analogues in natural and cultured Cordyceps by pressurized liquid extraction and high performance liquid chromatography-electrospray ionization tandem mass spectrometry (HPLC–ESI–MS/MS. Anal. Chim. Acta 2006, 567, 218–228. [Google Scholar] [CrossRef]
- Yang, F.Q.; Li, S.P. Effects of sample preparation methods on the quantification of nucleosides in natural and cultured Cordyceps. J. Pharm. Biomed. Anal. 2008, 48, 231–235. [Google Scholar] [CrossRef]
- Sample Availability: Samples of the compounds 1–15 are available from the authors.
© 2013 by the authors; licensee MDPI, Basel, Switzerland. This article is an open access article distributed under the terms and conditions of the Creative Commons Attribution license (http://creativecommons.org/licenses/by/3.0/).
Share and Cite
Zhao, H.-Q.; Wang, X.; Li, H.-M.; Yang, B.; Yang, H.-J.; Huang, L. Characterization of Nucleosides and Nucleobases in Natural Cordyceps by HILIC–ESI/TOF/MS and HILIC–ESI/MS. Molecules 2013, 18, 9755-9769. https://doi.org/10.3390/molecules18089755
Zhao H-Q, Wang X, Li H-M, Yang B, Yang H-J, Huang L. Characterization of Nucleosides and Nucleobases in Natural Cordyceps by HILIC–ESI/TOF/MS and HILIC–ESI/MS. Molecules. 2013; 18(8):9755-9769. https://doi.org/10.3390/molecules18089755
Chicago/Turabian StyleZhao, Heng-Qiang, Xiao Wang, Hong-Mei Li, Bin Yang, Hong-Jun Yang, and Luqi Huang. 2013. "Characterization of Nucleosides and Nucleobases in Natural Cordyceps by HILIC–ESI/TOF/MS and HILIC–ESI/MS" Molecules 18, no. 8: 9755-9769. https://doi.org/10.3390/molecules18089755
APA StyleZhao, H.-Q., Wang, X., Li, H.-M., Yang, B., Yang, H.-J., & Huang, L. (2013). Characterization of Nucleosides and Nucleobases in Natural Cordyceps by HILIC–ESI/TOF/MS and HILIC–ESI/MS. Molecules, 18(8), 9755-9769. https://doi.org/10.3390/molecules18089755