Antioxidant Capacity and HPLC-DAD-MS Profiling of Chilean Peumo (Cryptocarya alba) Fruits and Comparison with German Peumo (Crataegus monogyna) from Southern Chile


Abstract
:
1. Introduction
2. Results and Discussion
2.1. Total Phenolic, Total Flavonoid Content and Antioxidant Power of Peumo Fruits and Aerial Parts
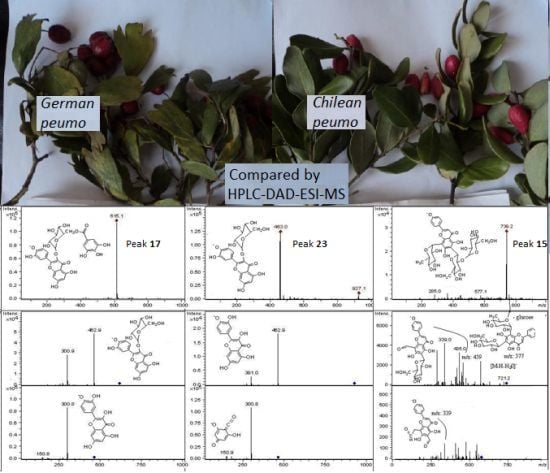
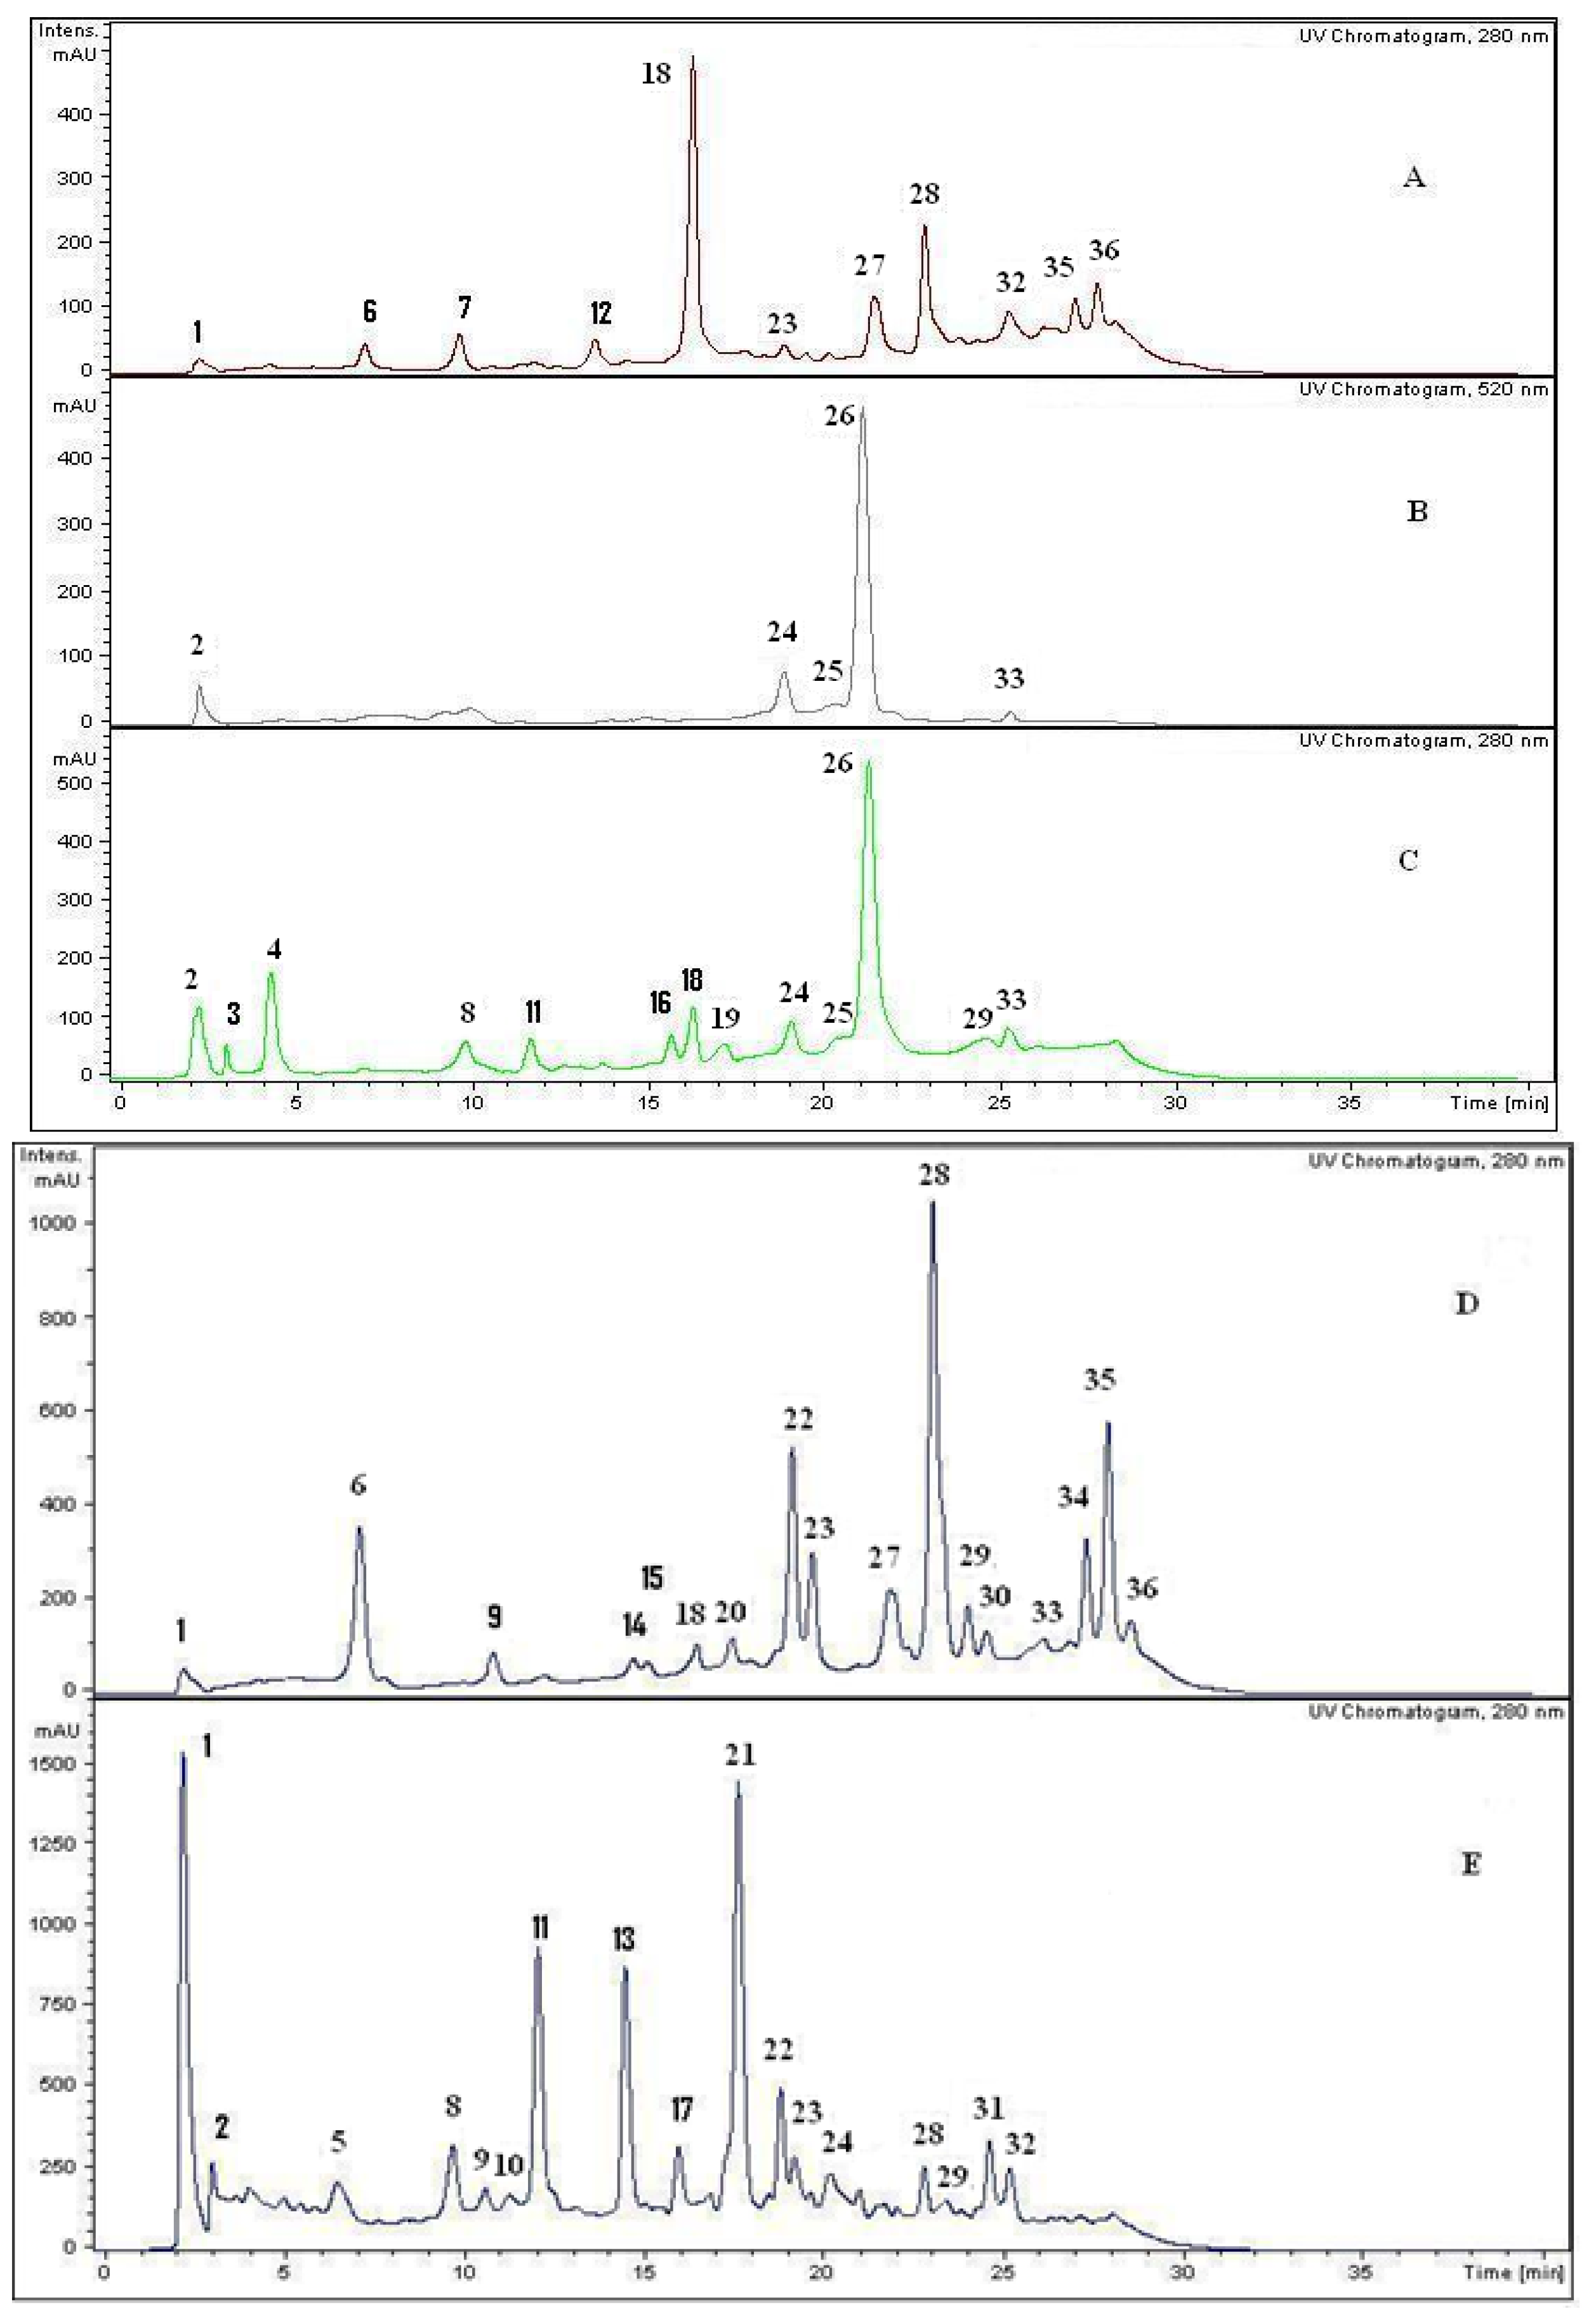
2.2. HPLC DAD and MS Analysis of Phenolic Compounds from Edible Peumo Fruits and Aerial Parts
2.2.1. Phenolic Acids and Related Phenolic Compounds
2.2.2. Flavan-3-ols (Catechins and Proanthocyanidins)
2.2.3. Flavonoids
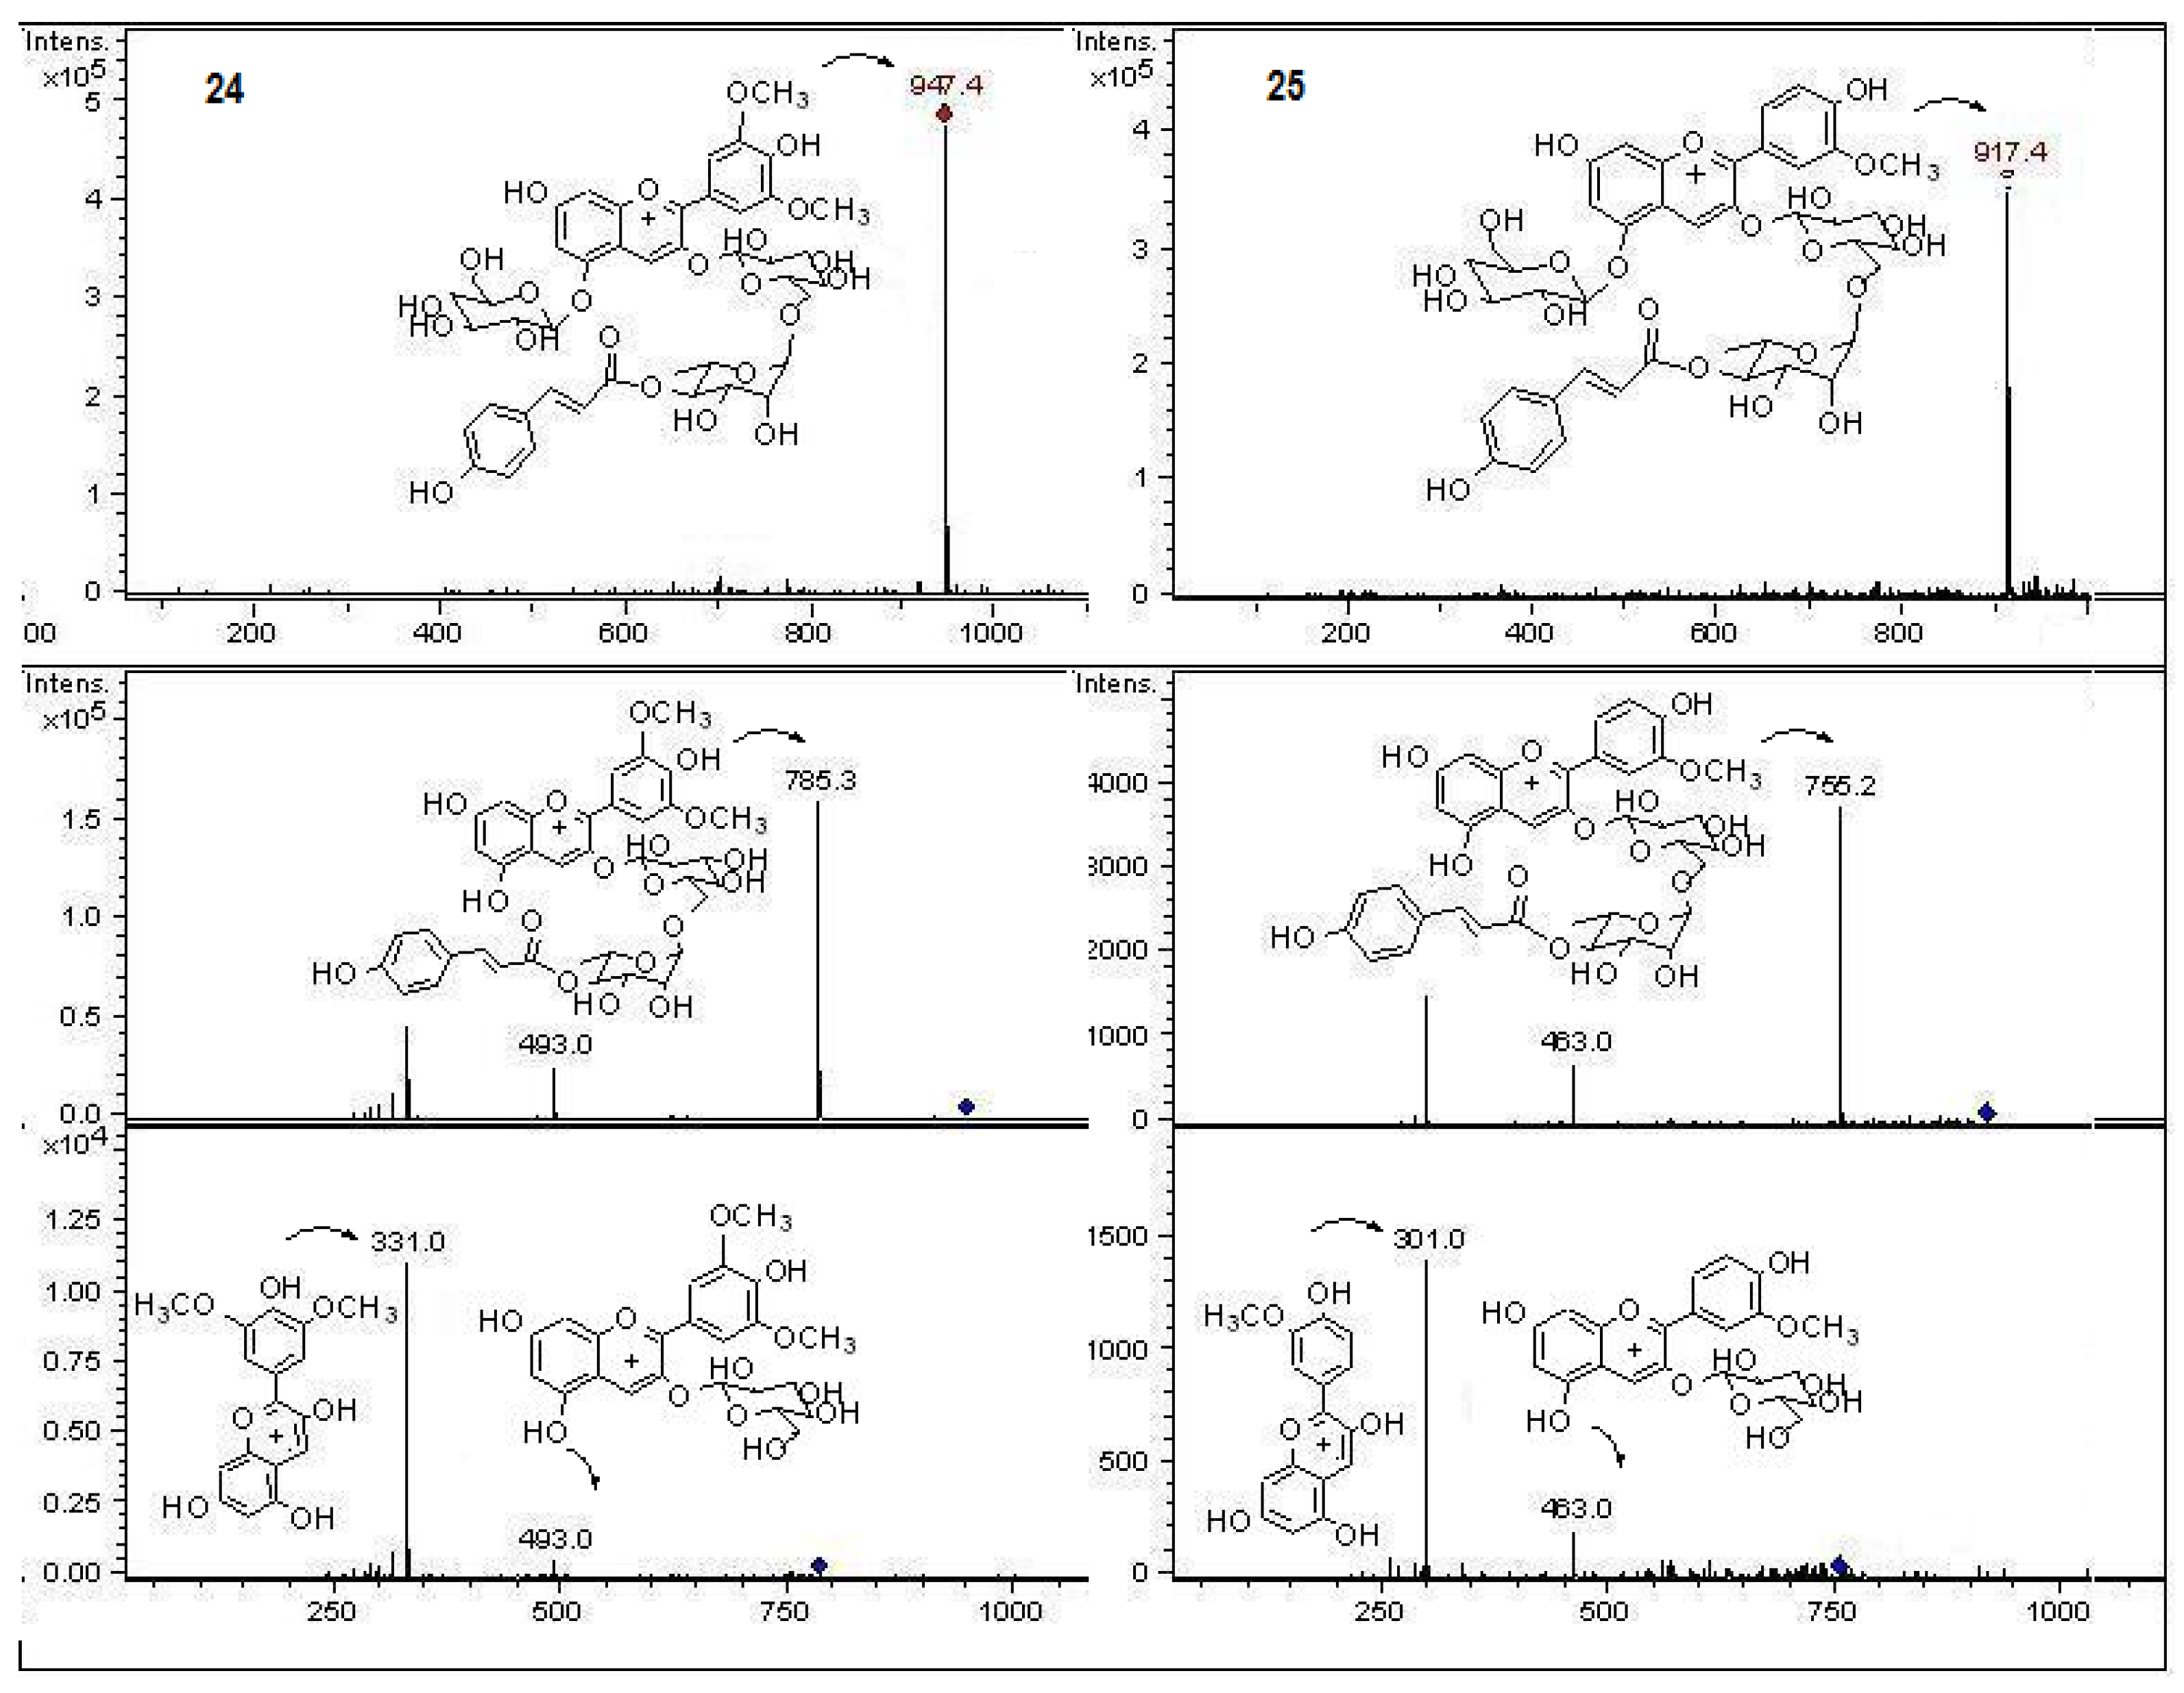
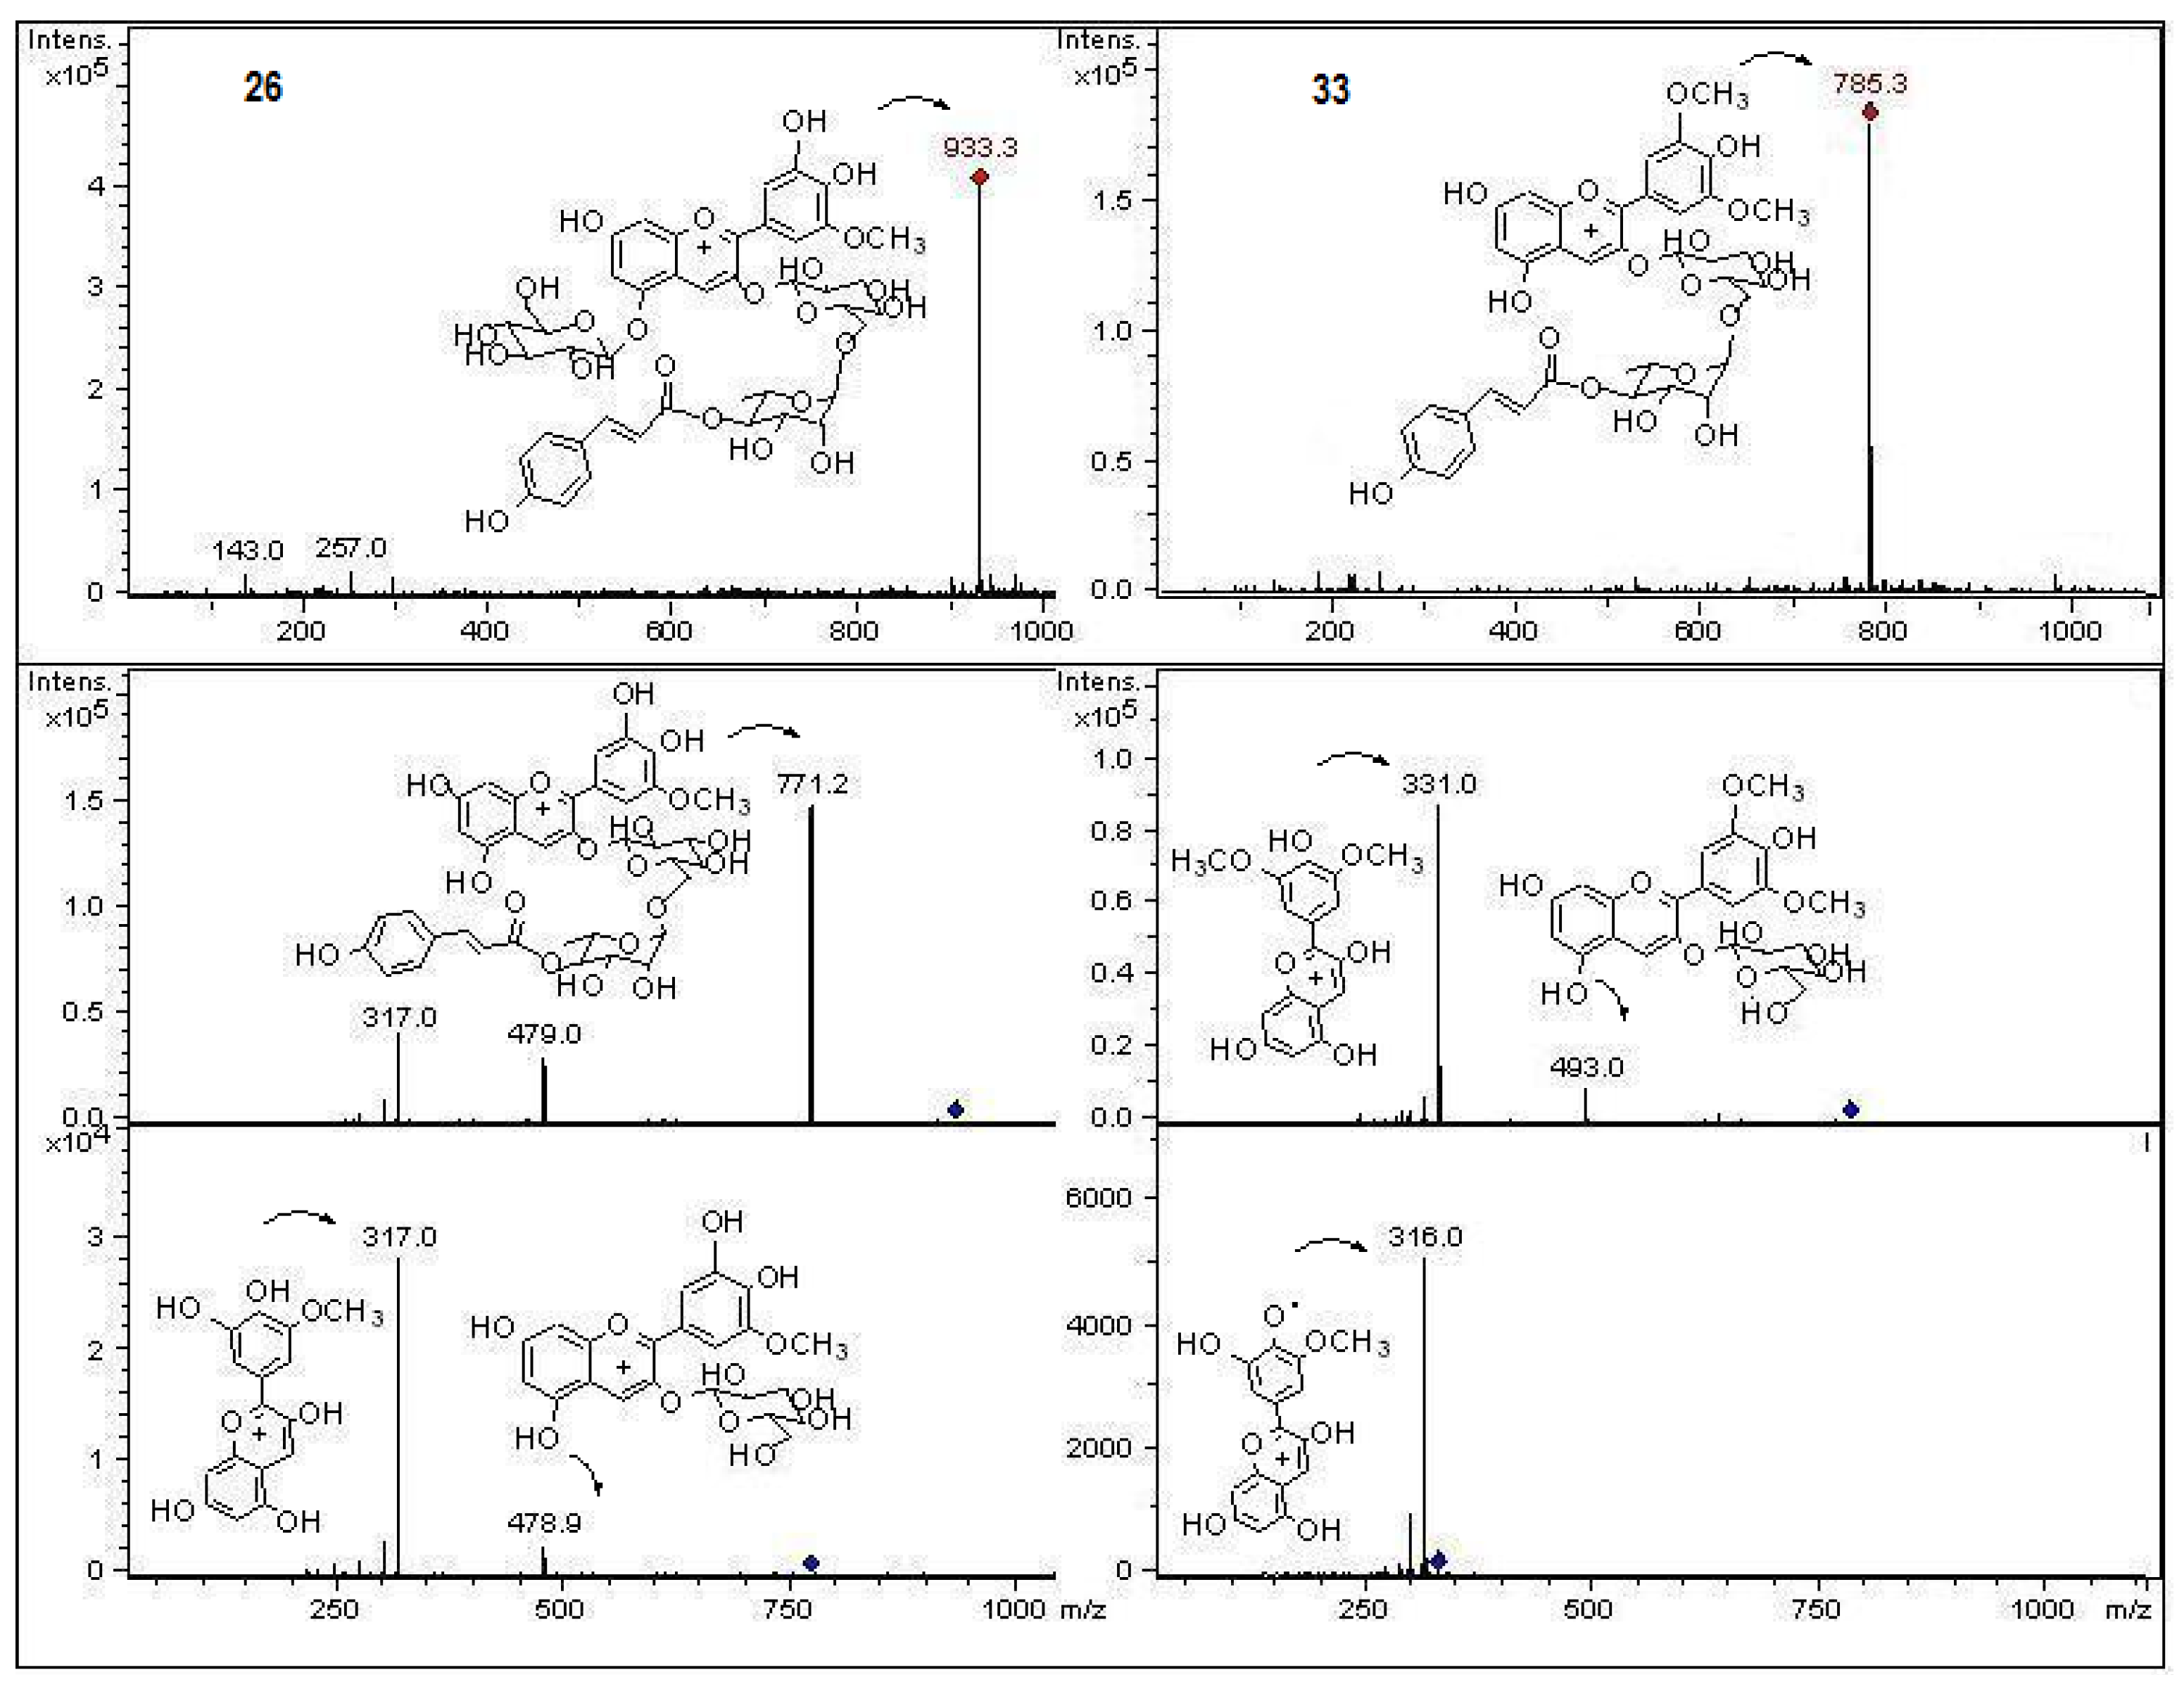
2.2.4. Anthocyanins
2.2.5. Unidentified Compounds
3. Experimental
3.1. General
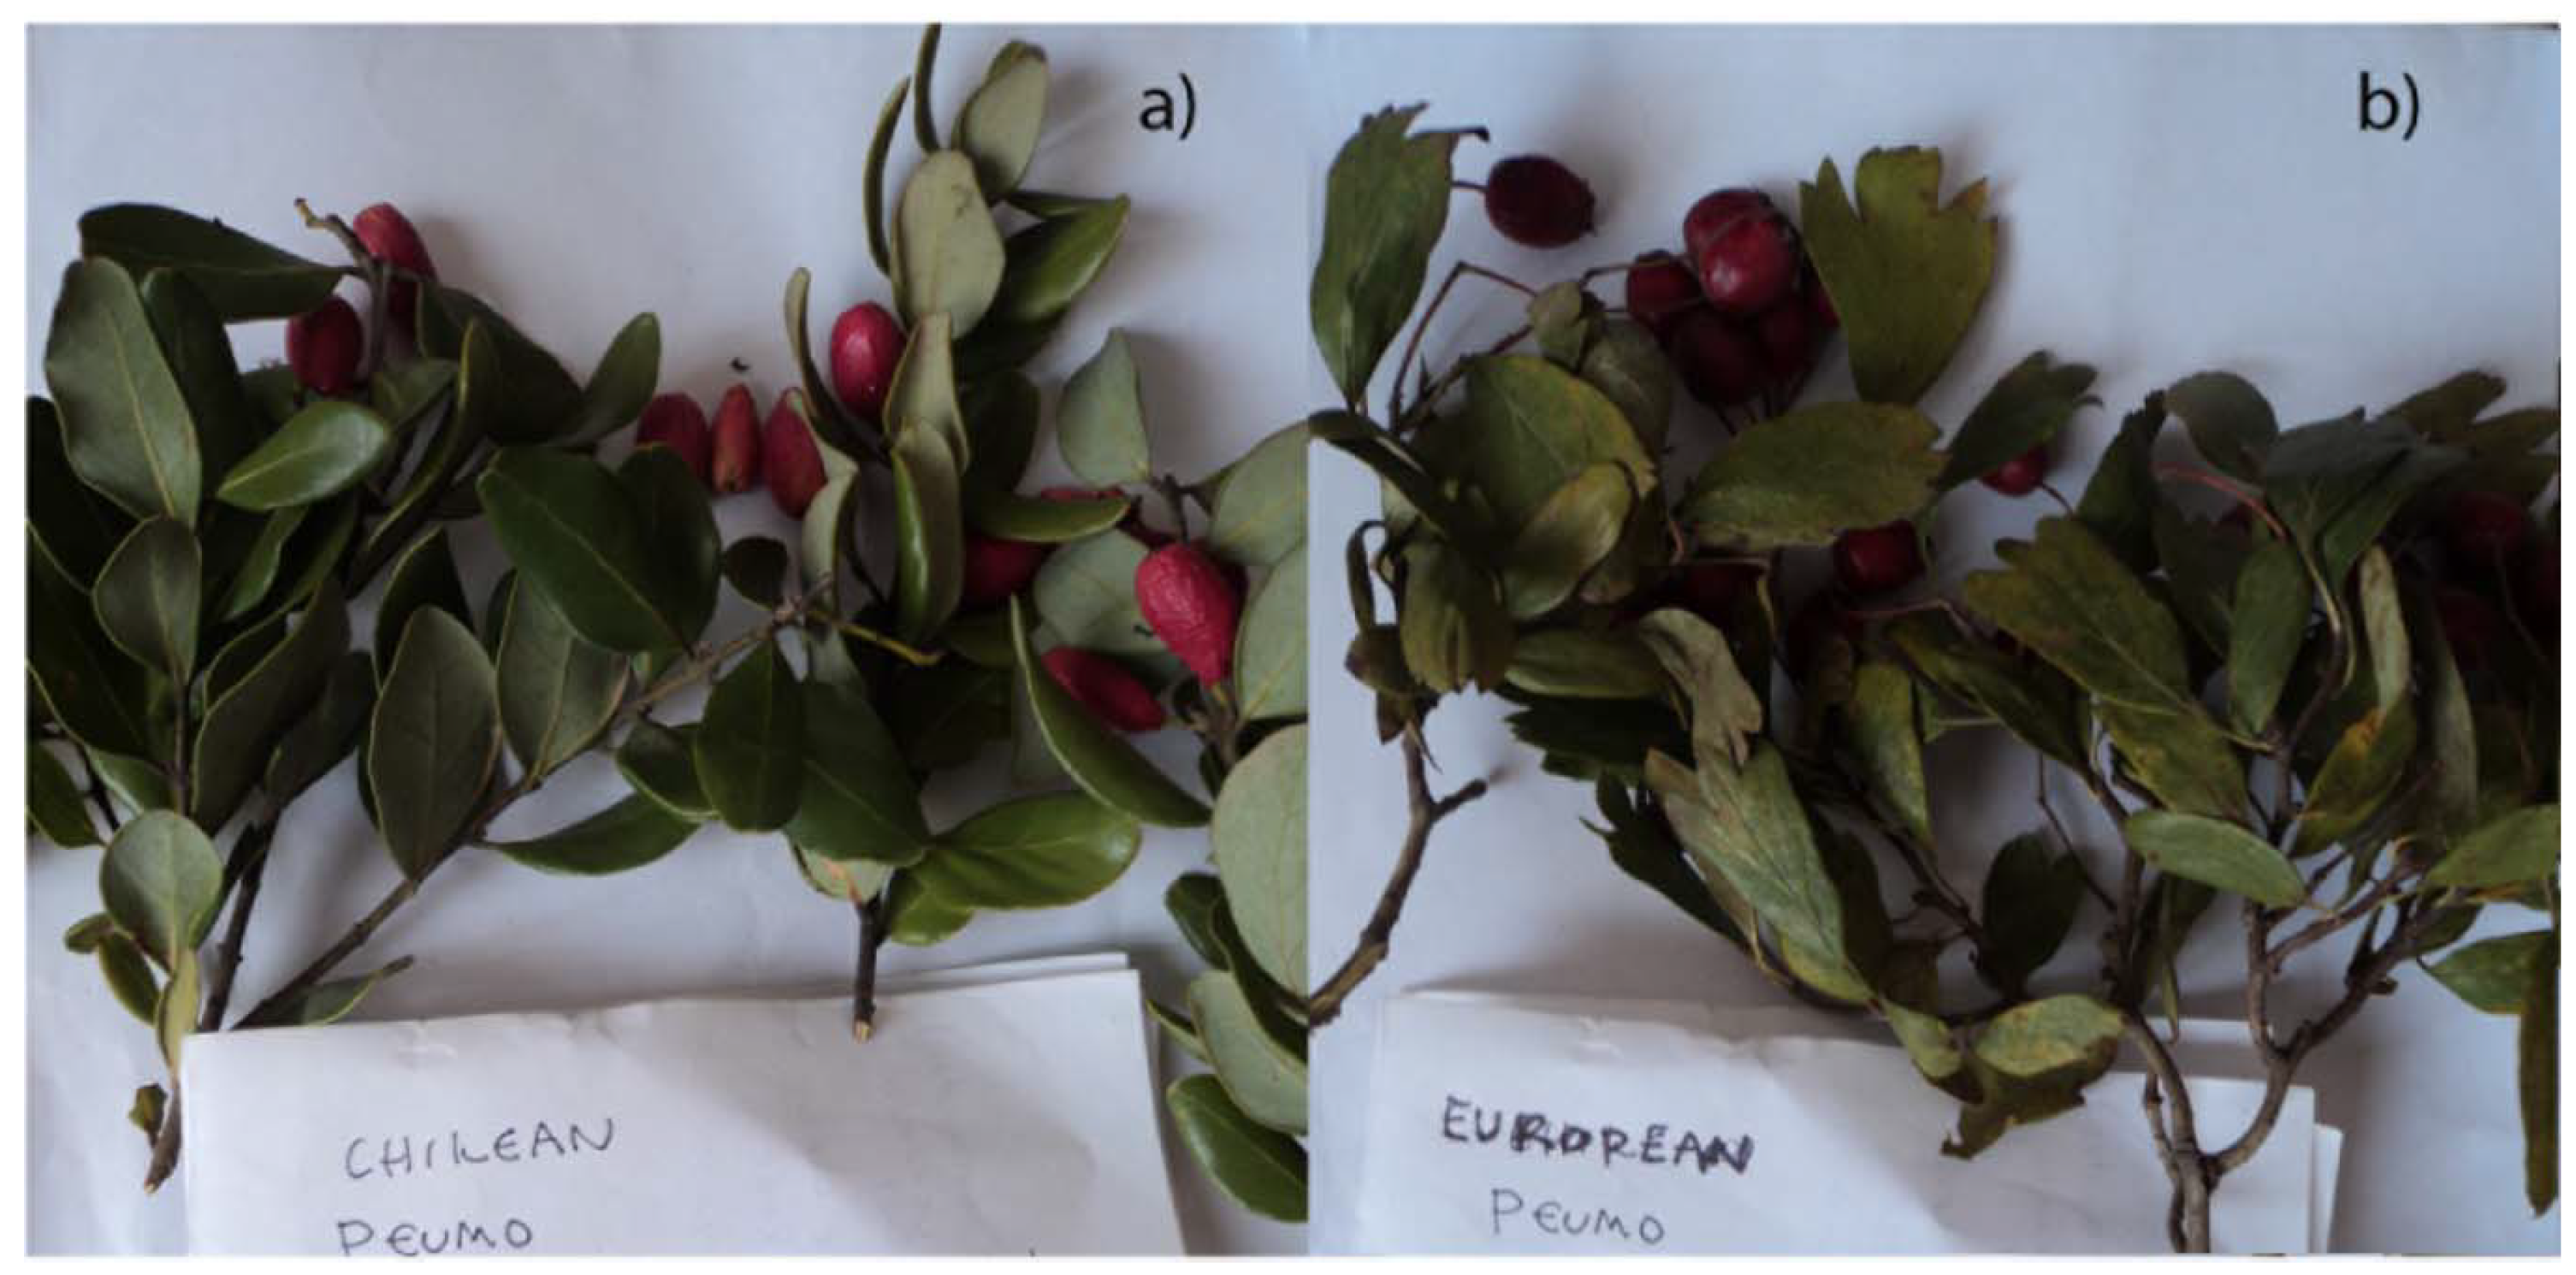
3.2. Plant Material
3.3. Sample Preparation
3.4. Polyphenolic Content
3.5. Antioxidant Assessment
3.5.1. Bleaching of the 2,2-diphenyl-1-picrylhydrazyl (DPPH) Radical Assay
3.5.2. Ferric Reducing Antioxidant Power (FRAP) Assay
3.6. Statistical Analysis
4. Conclusions
Acknowledgments
References
- Fuentes-Ramírez, A.; Pauchard, A.; Cavieres, L.A.; García, R.A. Survival and growth of Acacia dealbata vs. native trees across an invasion front in south-central Chile. Forest Ecol. Manag. 2011, 261, 1003–1009. [Google Scholar] [CrossRef]
- Avello Lorca, M.; López Canales, C.; GaticaValenzuela, C.; Bustos Concha, E.; Chait, A.B.; Pastene Navarrete, C.E.; Bittner Berner, C.M. Antimicrobial effects of extracts from Chilean plants of Lauraceae and Atherospermataceae families. Rev. Cub. Plant. Med. 2012, 17, 73–83. [Google Scholar]
- Schmeda-Hirschmann, G.; Astudillo, L.; Bastida, J.; Codina, C.; Rojas De Arias, A.; Ferreira, M.E.; Inchaustti, A.; Yaluff, G. Cryptofolione derivatives from Cryptocarya alba fruits. J. Pharm. Pharmacol. 2001, 53, 563–567. [Google Scholar] [CrossRef] [PubMed]
- Serce, S.; Simsek, O.; Toplu, C.; Kamiloglu, O.; Caliskan, O.; Gunduz, K.; Ozgen, M.; Kacar, Y.A. Relationships among Crataegus accessions sampled from Hatay, Turkey, as assessed by fruit characteristics and RAPD. Gen. Res. Crop Evol. 2011, 58, 933–942. [Google Scholar] [CrossRef]
- Ding, X.P.; Wang, X.T.; Chen, L.L.; Qi, J.; Xu, T.; Yu, B.-Y. Quality and antioxidant activity detection of Crataegus leaves using on-line high-performance liquid chromatography with diode array detector coupled to chemiluminescence detection. Food Chem. 2010, 120, 929–933. [Google Scholar] [CrossRef]
- Prinza, S.; Ringla, A.; Huefnerb, A.; Pempa, E.; Kopp, B. 4′′′-Acetylvitexin-2′′-O-rhamnoside, isoorientin, orientin, and 8-methoxykaempferol-3-O-glucoside as markers for the differentiation of Crataegus monogyna and Crataegus pentagyna from Crataegus laevigata (Rosaceae). Chem. Biodivers. 2007, 4, 2920–2931. [Google Scholar] [CrossRef] [PubMed]
- Participants in the WHO Consultation on Medicinal Plants Commonly Used in NIS, Folium cum Flore Crataegi. In WHO Monographs on Medicinal Plants Commonly Used in the Newly Independent States; WHO Library Cataloguing-in-Publication Data: Paris, France, 2010; pp. 91–111.
- Rodrigues, S.; Calhelha, R.C.; Barreira, J.C.M.; Dueñas, M.; Carvalho, A.M.; Abreu, R.M.V.; Santos-Buelga, C.; Ferreira, I.C.F.R. Crataegus monogyna buds and fruits phenolic extracts: Growth inhibitory activity on human tumor cell lines and chemical characterization by HPLC–DAD–ESI/MS. Food Res. Int. 2012, 49, 516–523. [Google Scholar] [CrossRef]
- Halliwell, B.; Aeschbach, R.; Loliger, J.; Aruoma, O.I. The characterization of antioxidants. Food Chem. Toxicol. 1995, 33, 601–617. [Google Scholar] [CrossRef]
- Pietta, P.G. Flavonoids as antioxidants. J. Nat. Prod. 2000, 63, 1035–1042. [Google Scholar] [CrossRef] [PubMed]
- Wang, H.; Cao, G.; Prior, R.L. Total antioxidant capacity of fruits. J. Agric. Food Chem. 1996, 44, 701–705. [Google Scholar] [CrossRef]
- Riboli, E.; Norat, T. Epidemiological evidence of the protective effects of fruits and vegetables on cancer risk. Am. J. Clin. Nutr. 2003, 78, 559–569. [Google Scholar] [CrossRef] [PubMed]
- Hertog, M.G.; Sweetnam, P.M.; Fehily, A.M.; Elwood, P.C.; Kromhout, D. Antioxidant flavonols and ischemic heart disease in a Welsh population of men: The Caterphilly Study. Am. J. Clin. Nutr. 1997, 65, 1489–1494. [Google Scholar] [CrossRef] [PubMed]
- Hertog, M.G.; Kromhout, D.; Aravanis, C.; Blackburn, H.; Buzina, R.; Fidanza, F.; Giampaoli, S.; Jansen, A.; Menotti, A.; Nedeljkovic, S. Flavonoid intake and long-term risk of coronary heart disease and cancer in the seven countries study. Arch. Int. Med. 1995, 155, 381–386. [Google Scholar] [CrossRef]
- Wootton-Beard, P.C.; Ryan, L. Combined use of multiple methodologies for the measurement of total antioxidant capacity in uk commercially available vegetable juices. Plant Foods Hum. Nutr. 2012, 67, 142–147. [Google Scholar] [CrossRef] [PubMed]
- Hinneburg, I.; Damien Dorman, H.J.; Hiltunen, R. Antioxidant activities of extracts from selected culinary herbs and spices. Food Chem. 2006, 97, 122–129. [Google Scholar] [CrossRef]
- Thaipong, K.; Boonprakob, U.; Crosby, K.; Cisneros-Zevallos, L.; Hawkins Byrne, D. Comparison of ABTS, DPPH, FRAP, and ORAC assays for estimating antioxidant activity from guava fruit extracts. J. Food Comp. Anal. 2006, 19, 669–675. [Google Scholar] [CrossRef]
- Sun, T.; Powers, J.R.; Tang, J. Evaluation of the antioxidant activity of asparagus, broccoli and their juices. Food Chem. 2007, 105, 101–106. [Google Scholar] [CrossRef]
- Barreira, J.C.M.; Rodrigues, S.; Carvalho, A.M.; Ferreira, I.C.F.R. Development of hydrosoluble gels with Crataegus monogyna extracts for topical application: Evaluation of antioxidant activity of the final formulations. Ind. Crops Prod. 2013, 42, 175–180. [Google Scholar] [CrossRef]
- He, X.G. On-line identification of phytochemical constituents in botanical extracts by combined high-performance liquid chromatographic-diode array detection-mass spectrometric techniques. J. Chromatogr. A 2000, 880, 203–232. [Google Scholar] [CrossRef]
- Zhou, J.-L.; Qi, L.-W.; Li, P. Herbal medicine analysis by liquid chromatography/time-of-flight mass spectrometry. J. Chromatogr. A 2009, 1216, 7582–7594. [Google Scholar] [CrossRef] [PubMed]
- Simirgiotis, M.J.; Schmeda-Hirschmann, G. Determination of phenolic composition and antioxidant activity in fruits, rhizomes and leaves of the white strawberry (Fragaria chiloensis spp. chiloensis form chiloensis) using HPLC-DAD-ESI-MS and free radical quenching techniques. J. Food Comp. Anal. 2010, 23, 545–553. [Google Scholar] [CrossRef]
- Simirgiotis, M.J.; Caligari, P.D.S.; Schmeda-Hirschmann, G. Identification of phenolic compounds from the fruits of the mountain papaya Vasconcellea pubescens A. DC. grown in Chile by liquid chromatography-UV detection-mass spectrometry. Food Chem. 2009, 115, 775–784. [Google Scholar] [CrossRef]
- Simirgiotis, M.J.; Schmeda-Hirschmann, G. Direct identification of phenolic constituents in Boldo Folium (Peumus boldus Mol.) infusions by high-performance liquid chromatography with diode array detection and electrospray ionization tandem mass spectrometry. J. Chromatogr. A 2010, 1217, 443–449. [Google Scholar] [CrossRef] [PubMed]
- Cuyckens, F.; Claeys, M. Optimization of a liquid chromatography method based on a simultaneous electrospray mass spectrometric and ultraviolet photodiode array detection for analysis of flavonoid glycosides. Rapid Commun. Mass Spectrom. 2002, 16, 2341–2348. [Google Scholar] [CrossRef] [PubMed]
- Djoukeng, J.D.; Arbona, V.; Argamasilla, R.; Gomez-Cadenas, A. Flavonoid profiling in leaves of Citrus genotypes under different environmental situations. J. Agric. Food Chem. 2008, 56, 11087–11097. [Google Scholar] [CrossRef] [PubMed]
- Simirgiotis, M.J.; Silva, M.; Becerra, J.; Schmeda-Hirschmann, G. Direct characterisation of phenolic antioxidants in infusions from four Mapuche medicinal plants by liquid chromatography with diode array detection (HPLC-DAD) and electrospray ionisation tandem mass spectrometry (HPLC-ESI–MS). Food Chem. 2012, 131, 318–327. [Google Scholar] [CrossRef]
- Ma, C.-M.; Nakamura, N.; Hattori, M. Inhibitory effects on HIV-1 protease of Tri-p-coumaroylspermidine from Artemisia caruifolia and related amides. Chem. Pharm. Bull. 2001, 49, 915–917. [Google Scholar] [CrossRef] [PubMed]
- Stehle, F.; Brandt, W.; Schmidt, J.; Milkowski, C.; Strack, D. Activities of Arabidopsis sinapoylglucose:malate sinapoyltransferase shed light on functional diversification of serine carboxypeptidase-like acyltransferases. Phytochemistry 2008, 69, 1826–1831. [Google Scholar] [CrossRef] [PubMed]
- Stoggl, W.M.; Huck, C.W.; Bonn, G.N.K. Structural elucidation of catechin and epicatechin in sorrel leaf extracts using liquid-chromatography coupled to diode array-, fluorescence-, and mass spectrometric detection. J. Sep. Sci. 2004, 27, 524–528. [Google Scholar] [CrossRef] [PubMed]
- Markowicz Bastos, D.H.; Saldanha, L.A.; Catharino, R.R.; Sawaya, A.C.H.F.; Cunha, I.B.S.; Carvalho, P.O.; Eberlin, M.N. Phenolic antioxidants identified by ESI-MS from Yerba Maté (Ilex paraguariensis) and green tea (Camelia sinensis) extracts. Molecules 2007, 12, 423–432. [Google Scholar] [CrossRef]
- Hollecker, L.; Pinna, M.; Filippino, G.; Scrugli, S.; Pinna, B.; Argiolas, F.; Murru, M. Simultaneous determination of polyphenolic compounds in red and white grapes grown in Sardinia by high performance liquid chromatography–electron spray ionisation-mass spectrometry. J. Chromatogr. A 2009, 1216, 3402–3408. [Google Scholar] [CrossRef] [PubMed]
- Figueirinha, A.; Paranhos, A.; Pérez-Alonso, J.J.; Santos-Buelga, C.; Batista, M.T. Cymbopogon citratus leaves: Characterization of flavonoids by HPLC–PDA–ESI/MS/MS and an approach to their potential as a source of bioactive polyphenols. Food Chem. 2008, 110, 718–728. [Google Scholar] [CrossRef]
- Wang, X.; Liang, Y.; Zhu, L.; Xie, H.; Li, H.; He, J.; Pan, M.; Zhang, T.; Ito, Y. Preparative isolation and purification of flavone C-glycosides from the leaves of Ficus microcarpa L. f by medium-pressure liquid chromatography, High-speed countercurrent chromatography, and preparative liquid chromatography. J. Liq. Chrom. Rel. Tech. 2010, 33, 462–480. [Google Scholar] [CrossRef] [PubMed]
- Romani, A.; Campo, M.; Pinelli, P. HPLC/DAD/ESI-MS analyses and anti-radical activity of hydrolyzable tannins from different vegetal species. Food Chem. 2012, 130, 214–221. [Google Scholar] [CrossRef]
- Kite, G.C.; Stoneham, C.A.; Veitch, N.C. Flavonol tetraglycosides and other constituents from leaves of Styphnolobium japonicum (Leguminosae) and related taxa. Phytochemistry 2007, 68, 1407–1416. [Google Scholar] [CrossRef] [PubMed]
- Piccinelli, A.L.; De Simone, F.; Passi, S.; Rastrelli, L. Phenolic constituents and antioxidant activity of Wendita calysina leaves (Burrito), a folk paraguayan tea. J. Agric. Food Chem. 2004, 52, 5863–5868. [Google Scholar] [CrossRef] [PubMed]
- Gutzeit, D.; Wray, V.; Winterhalter, P.; Jerz, G. Preparative isolation and purification of flavonoids and protocatechuic acid from Sea Buckthorn juice concentrate (Hippophae rhamnoides L. ssp. rhamnoides) by high-speed counter-current chromatography. Chromatographia 2007, 65, 1–7. [Google Scholar] [CrossRef]
- Sannomiya, M.; Campaner dos Santos, L.; Carbone, V.; Napolitano, A.; Piacente, S.; Pizza, C.; Souza-Brito, A.R.M.; Vilegas, W. Liquid chromatography/electrospray ionization tandem mass spectrometry profiling of compounds from the infusion of Byrsonima fagifolia Niedenzu. Rap. Commun. Mass Spectrom. 2007, 21, 1393–1400. [Google Scholar] [CrossRef] [PubMed]
- Barakat, H.H.; Souleman, A.M.; Hussein, S.A.M.; Ibrahiem, O.A.; Nawwar, M.A.M. Flavonoid galloyl glucosides from the pods of Acacia farnesiana. Phytochemistry 1999, 51, 139–142. [Google Scholar] [CrossRef]
- Eichhorn, S.; Winterhalter, P. Anthocyanins from pigmented potato (Solanum tuberosum L.) varieties. Food Res. Int. 2005, 38, 943–948. [Google Scholar] [CrossRef]
- Yildirim, A.; Mavi, A.; Kara, A. Determination of antioxidant and antimicrobial activities of Rumex crispus L. extracts. J. Agric. Food Chem. 2001, 49, 4083–4089. [Google Scholar] [CrossRef] [PubMed]
- Simirgiotis, M.J.; Adachi, S.; To, S.; Yang, H.; Reynertson, K.A.; Basile, M.J.; Gil, R.R.; Weinstein, I.B.; Kennelly, E.J. Cytotoxic chalcones and antioxidants from the fruits of Syzygium samarangense (Wax Jambu). Food Chem. 2008, 107, 813–819. [Google Scholar] [CrossRef] [PubMed]
- Benzie, I.F.F.; Strain, J.J. The ferric reducing ability of plasma (FRAP) as a measure of “Antioxidant Power”: The FRAP assay. Anal. Biochem. 1996, 239, 70–76. [Google Scholar] [CrossRef] [PubMed]
Sample Availability: Samples of the extracts and plant samples are available from the author. |


| Species and plant part a | TPC b (mgGAE/g) | TFC b (mgQE/g) | FRAP b (µmolTE/g) | DPPH b (IC50, µg/mL) | w/w extraction yield (%) |
|---|---|---|---|---|---|
| C. alba fruits | 17.70 ± 0.02 | 8.22± 0.04 | 39.65 ± 0.04 | 9.12 ± 0.01 | 15.43 |
| C. monogyna fruits | 28.30 ± 0.02 | 8.77 ± 0.00 | 85.65 ± 0.09 | 3.61 ± 0.01 | 12.36 |
| C. alba aerial parts | 100.12 ± 0.83 | 15.7 ± 0.01 | 29.22 ± 0.04 | 3.92 ± 0.02 | 13.32 |
| C. monogyna aerial parts | 114.38 ± 1.62 | 64.9 ± 0.00 | 95.05 ± 0.15 | 3.34 ± 0.38 | 8.90 |
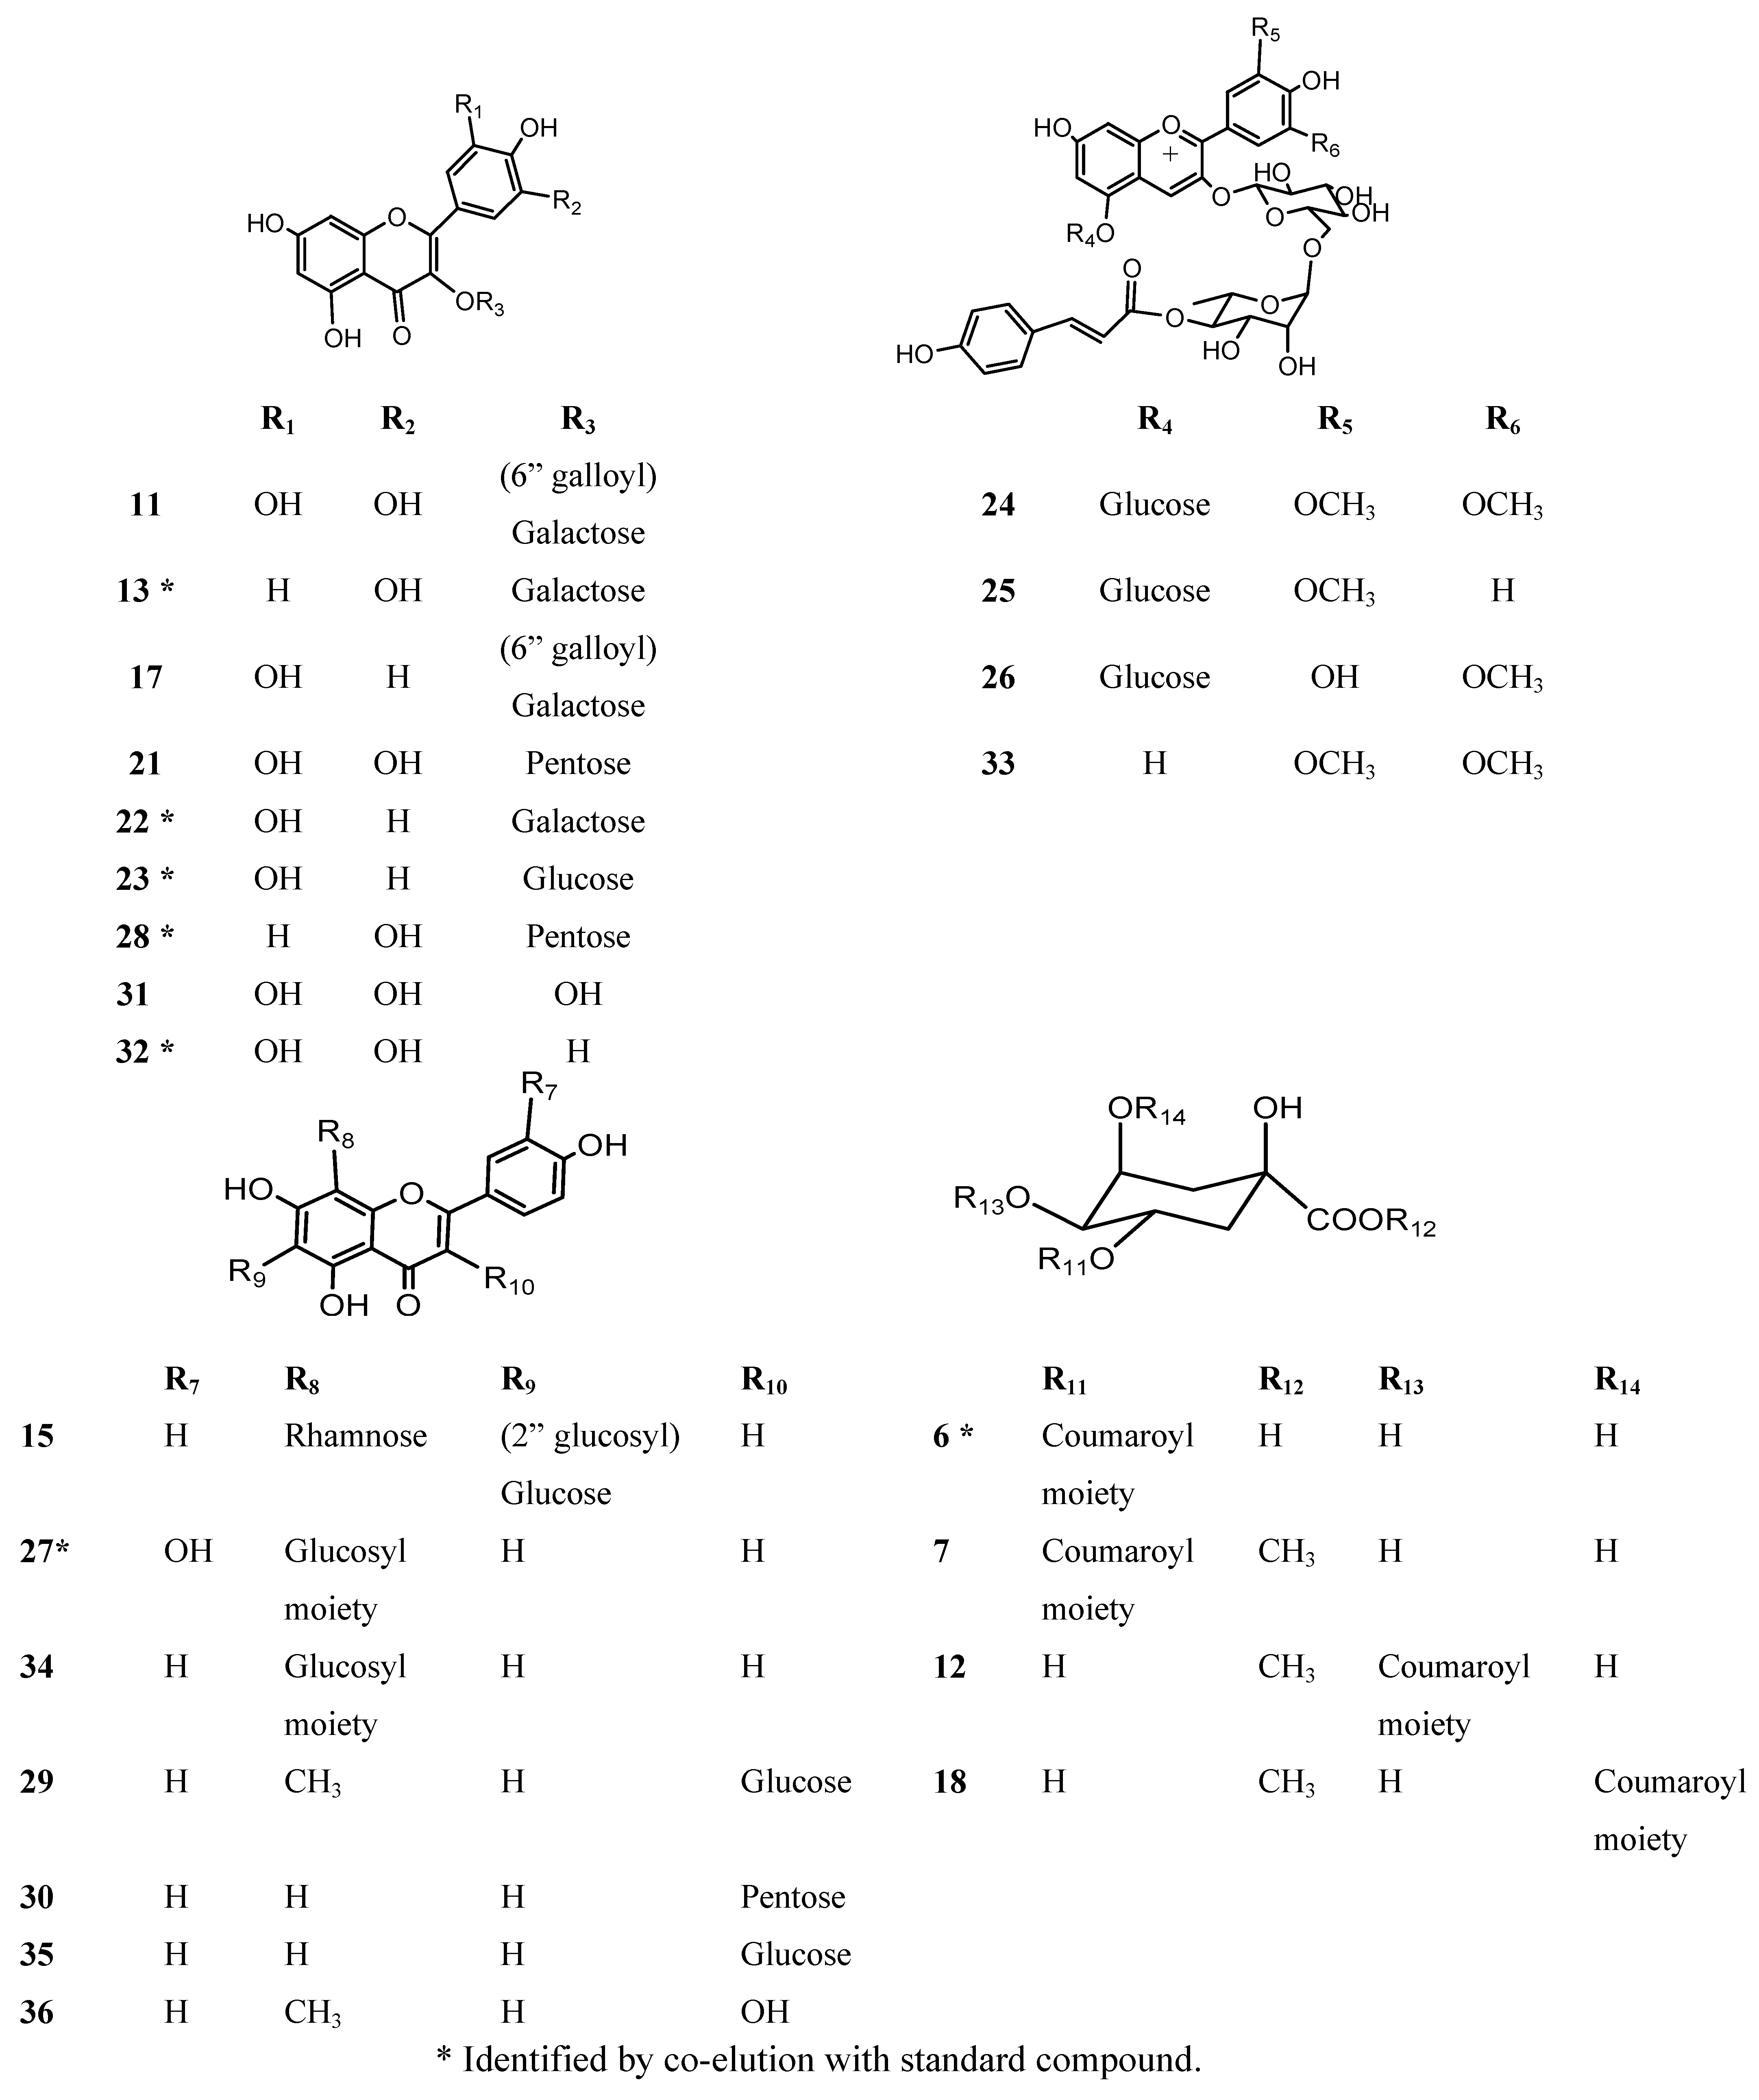
| Peak # | Rt (min) | λ max (nm) | +/− ions | [M−H]− (m/z) | [2M-H]− (m/z) | Fragment ions (m/z) | POLYPHENOLS IDENTITY | SPECIES/PART |
|---|---|---|---|---|---|---|---|---|
| 1 | 2.3 | 280 | − | 593 | 425, 289 | Epigallocatechin-catechin dimer | Cral, Cryl, Cryf | |
| 2 | 3.0 | - | − | 191 | 110 | Quinic acid | Cral, Craf | |
| 3 | 3.0 | 280 | − | 381 | 191, 110 | quinic acid derivative | Cral, Craf | |
| 4 | 3.9 | 265 | − | 169 | 137, 125, 97 | Gallic acid* | Craf | |
| 5 | 6.5 | 278 | − | 280 | 245, 205, 179 | Catechin * | Cral | |
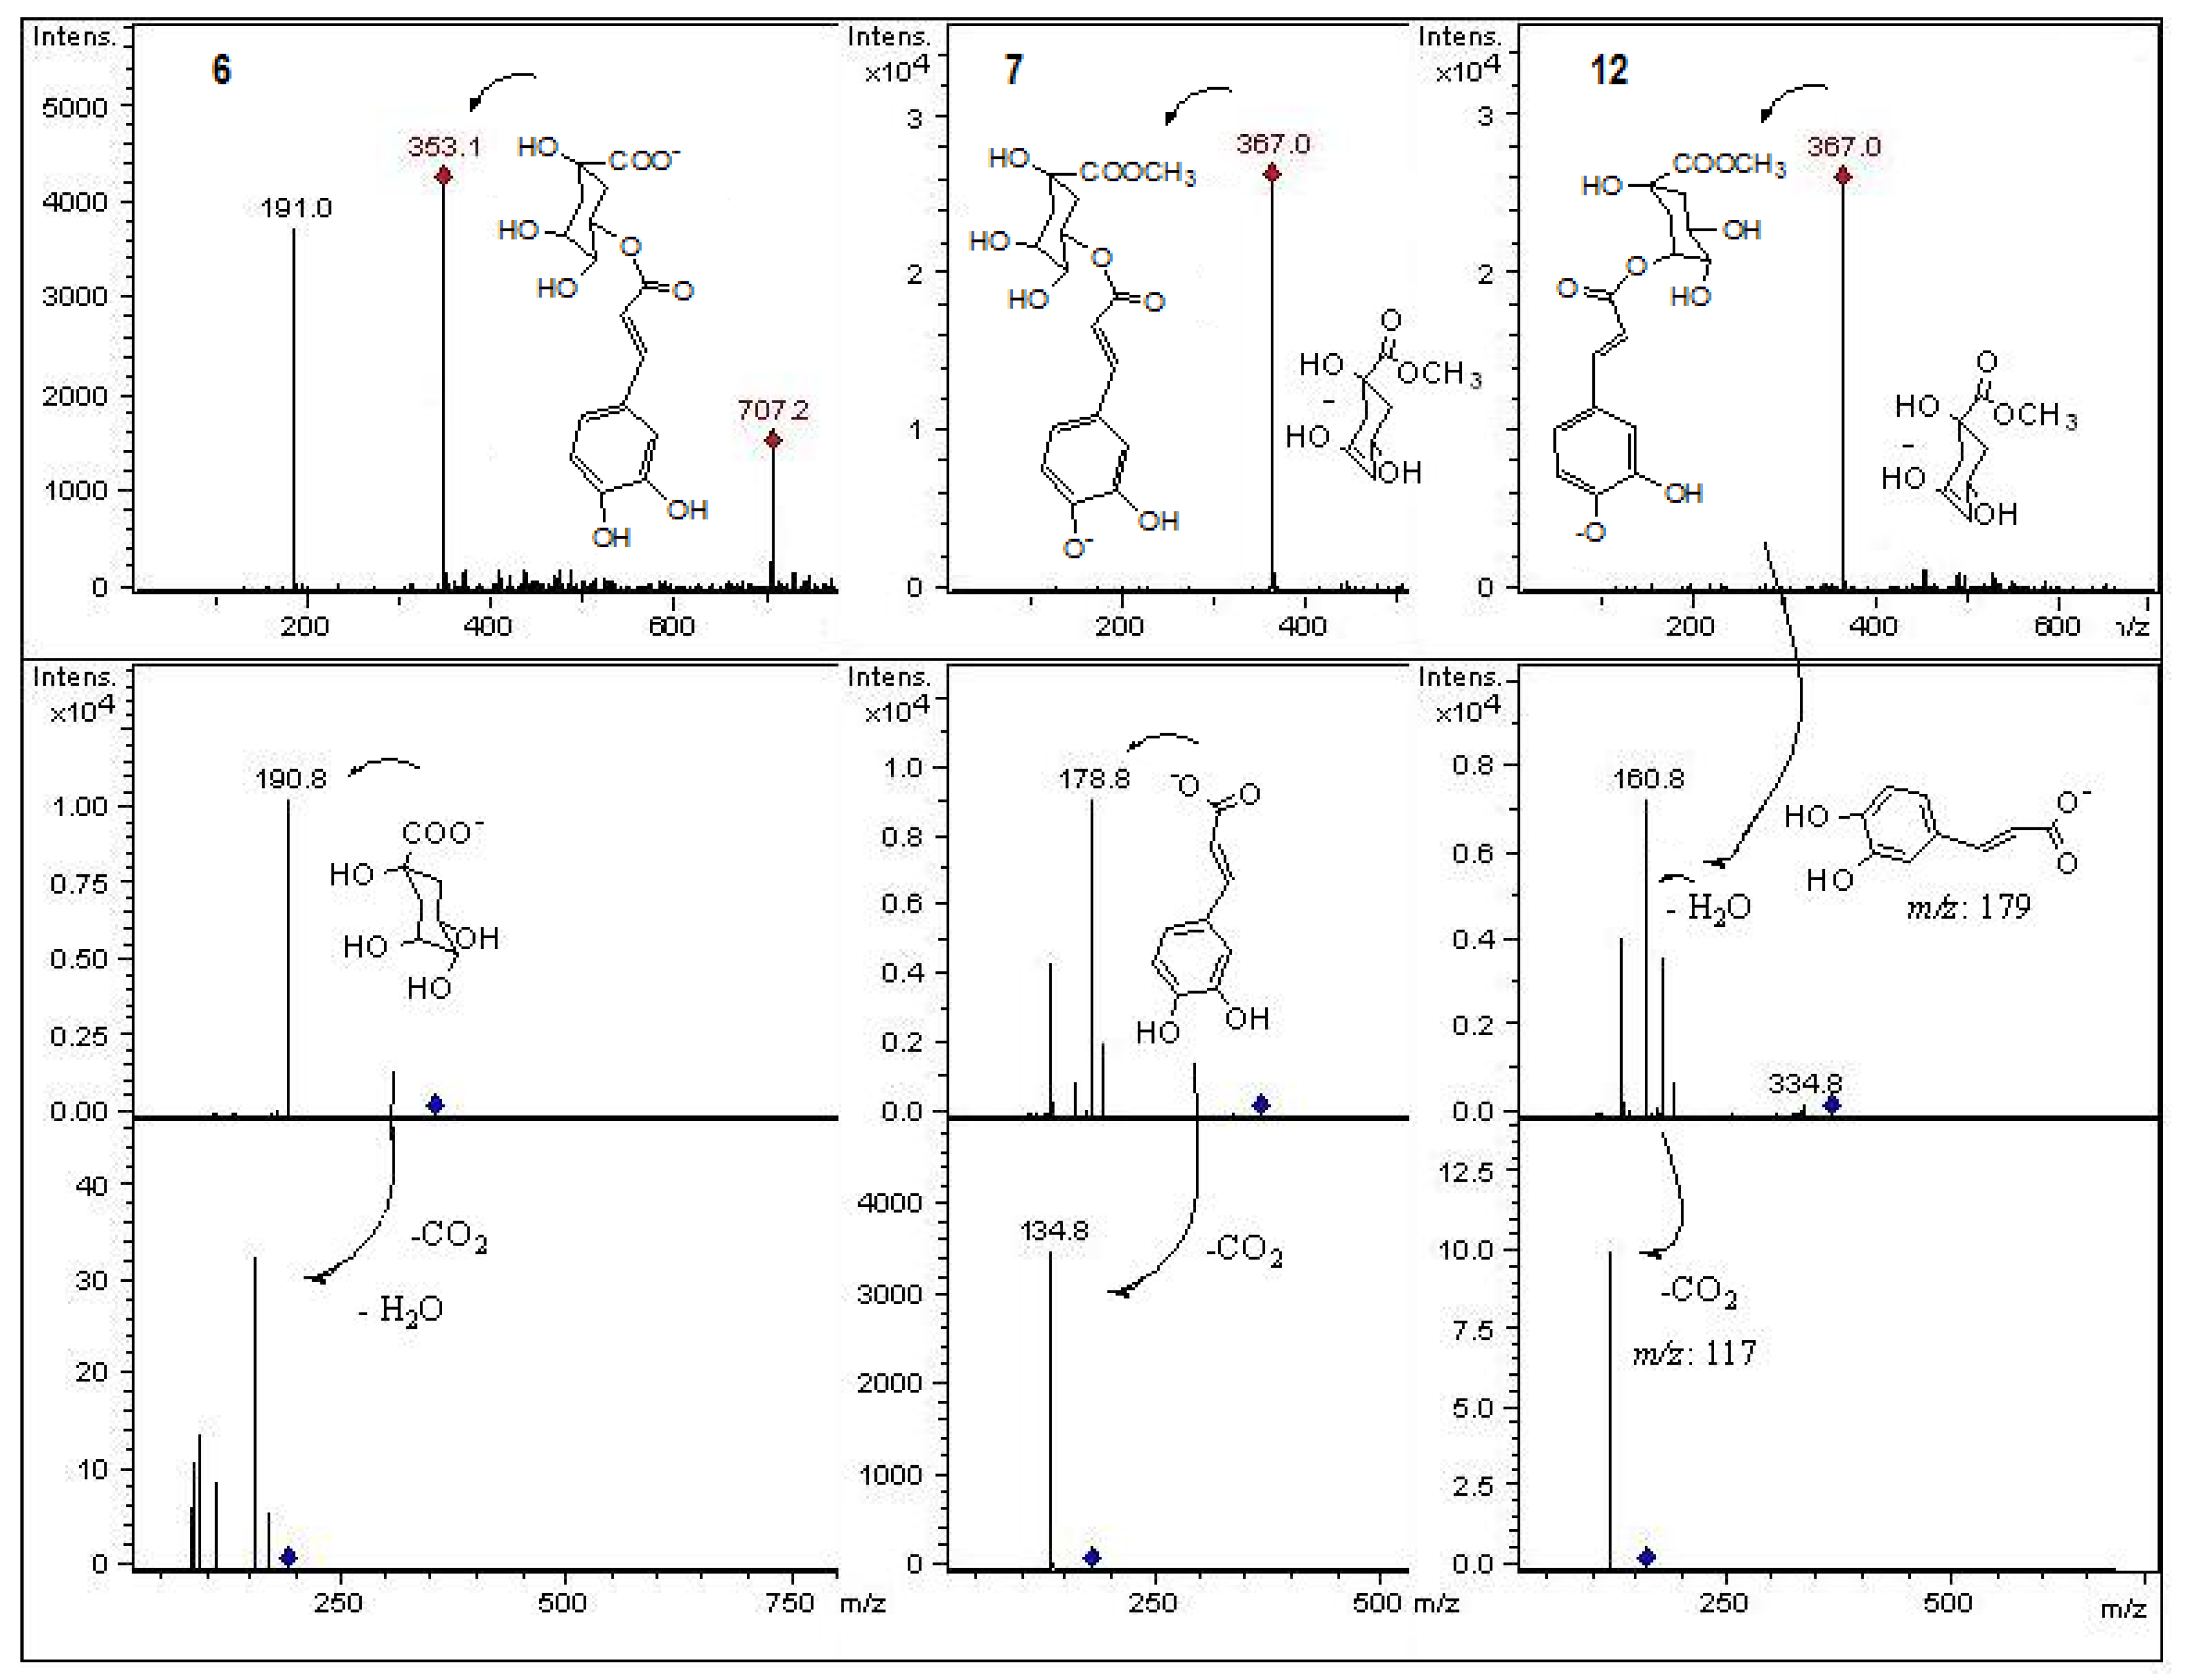
| 6 | 7.1 | 242, 300sh, 325 | − | 353 | 191, 110 | Chlorogenic acid * | Cryl, Cryf | |
| 7 | 9.6 | 240, 295sh, 332 | − | 367 | 179, 135 | Methyl -(5-caffeoyl)-quinate | Cryf | |
| 8 | 9.5 | 272 | − | 457 | 915 | 305 | Epigallocatechin gallate * | Cral, Craf |
| 9 | 10.7 | 280 | − | 289 | 245, 205, 179 | Epicatechin * | Cryl | |
| 10 | 11.5 | 234, 295sh, 325 | − | 385 | 223, 205, | 1-O-sinapoyl-β-D-glucose | Cral | |
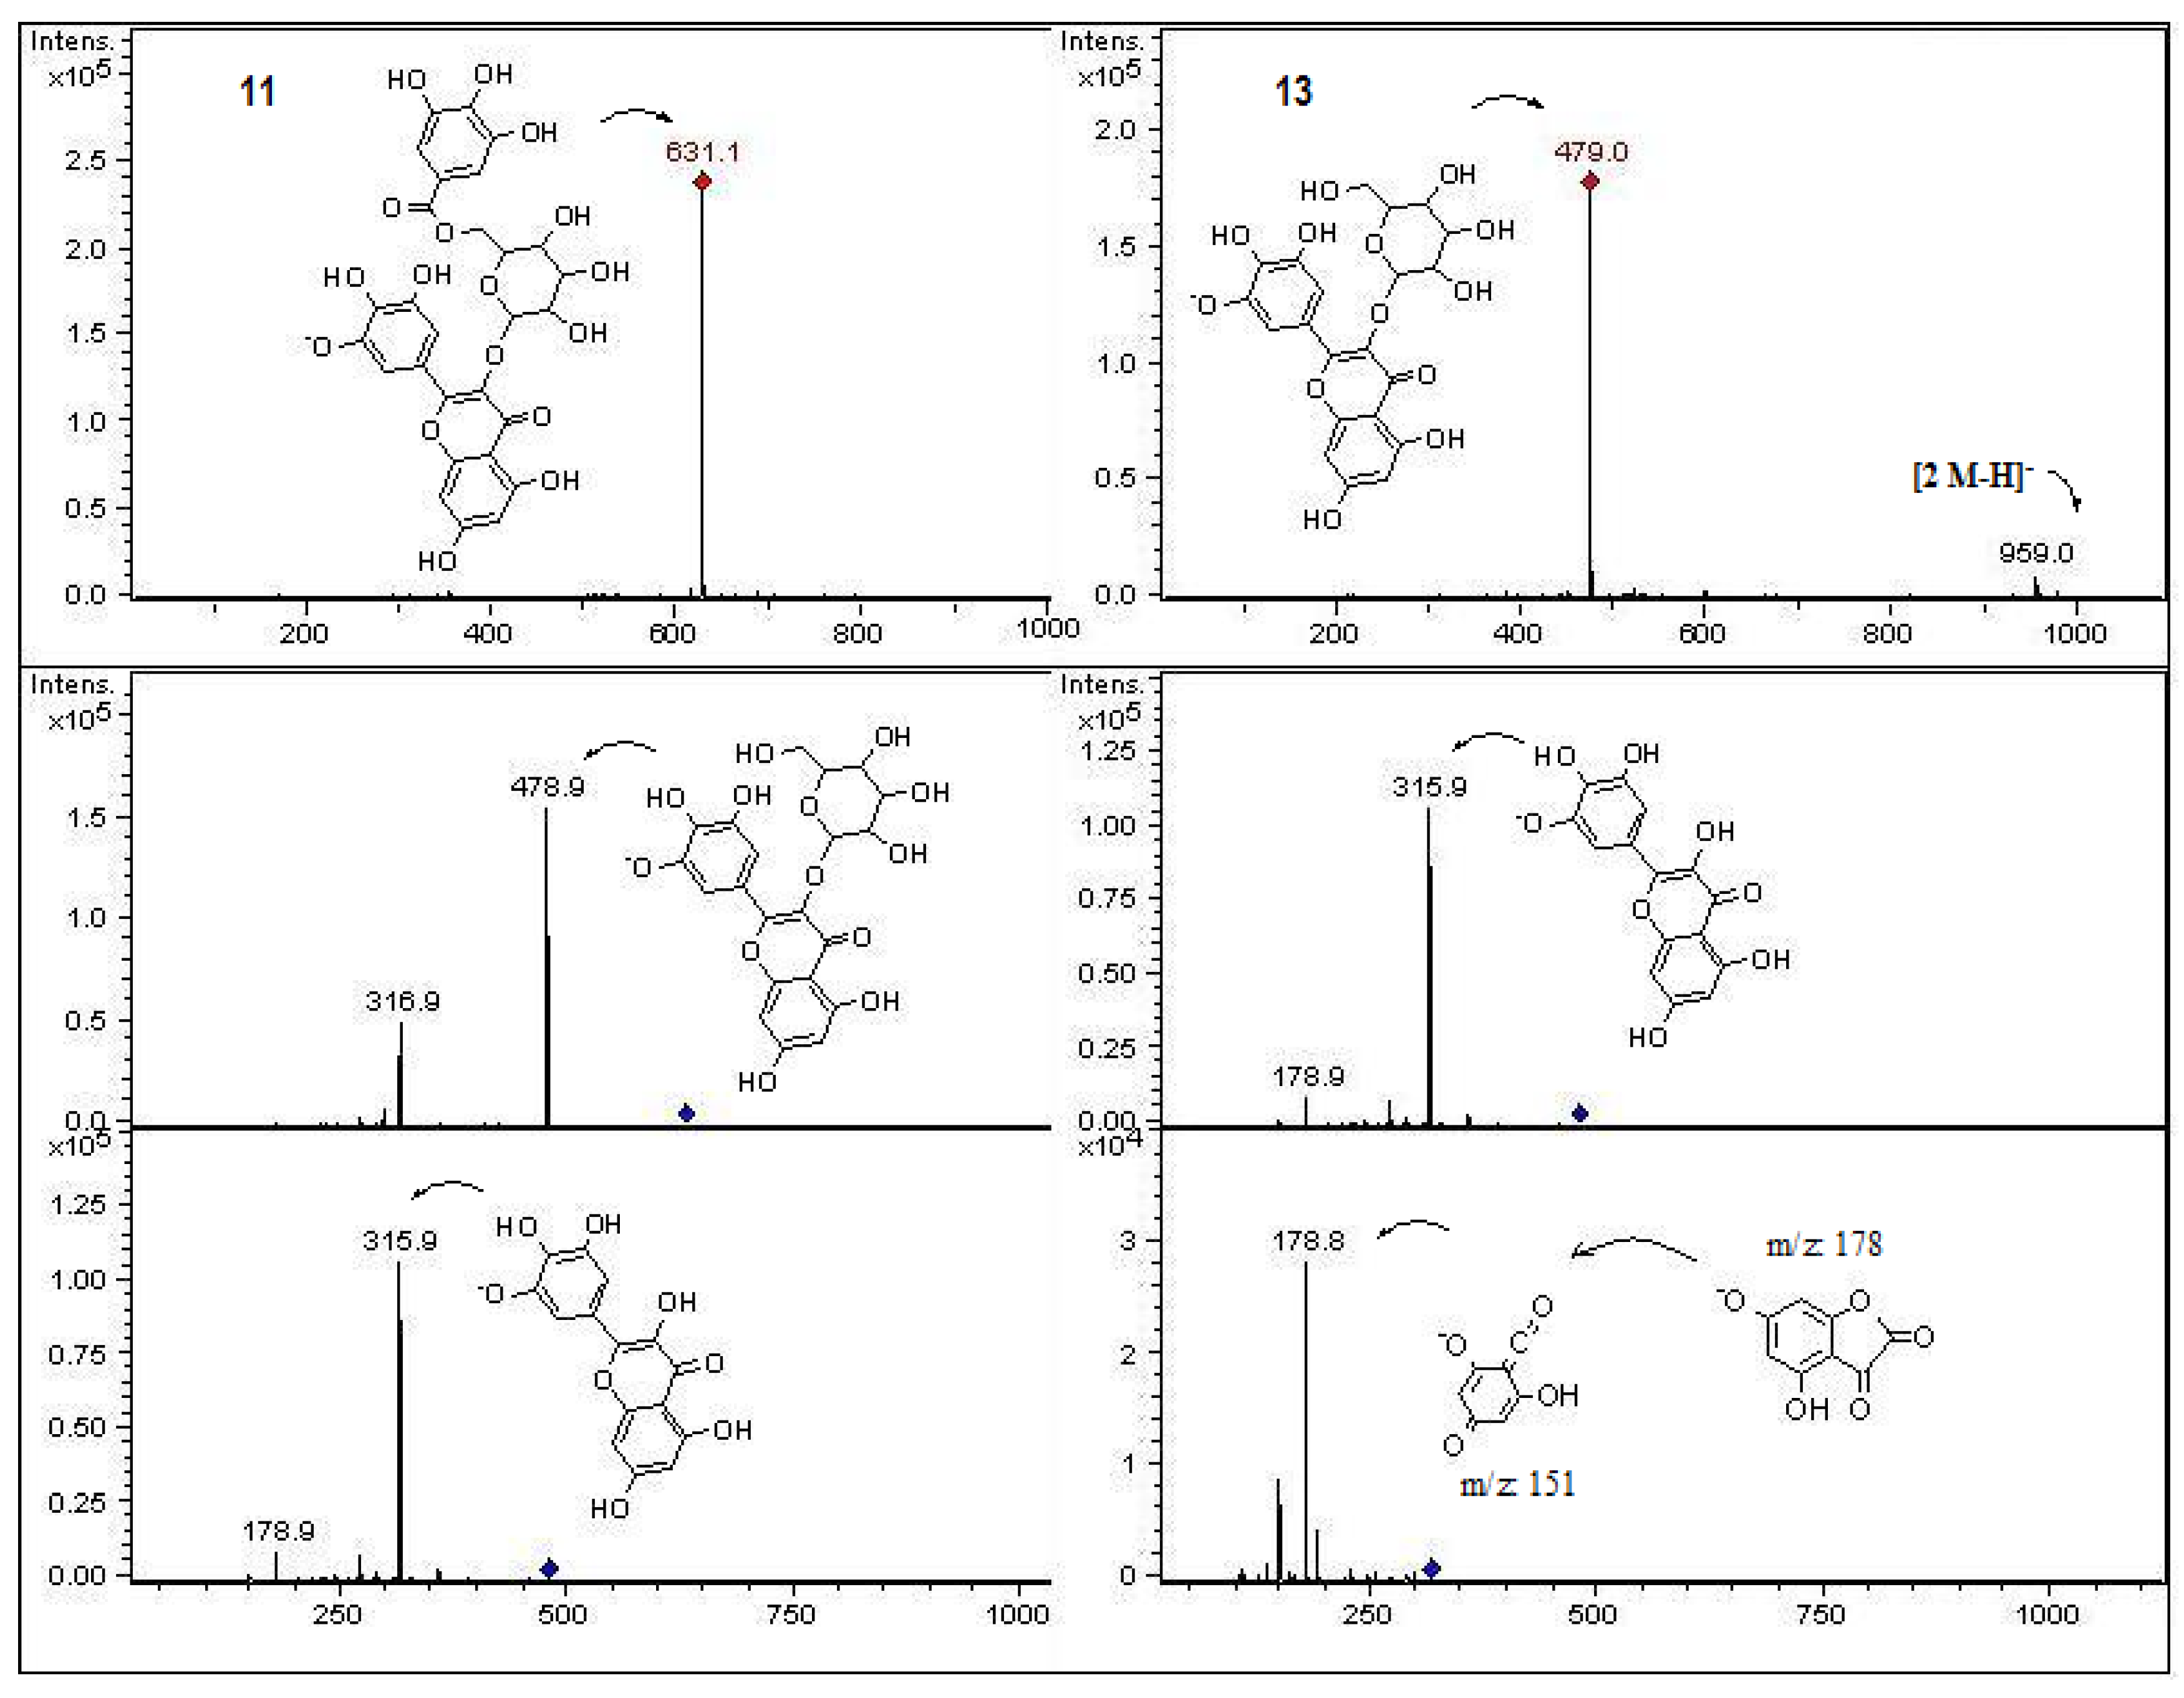
| 11 | 12.0 | 255, 293sh, 358 | − | 631 | 479, 316,179 | Myricetin-3-O-(6′′ galloyl) galactose | Cral, Craf | |
| 12 | 13.6 | 240, 295sh, 332 | − | 367 | 735 | 179, 161 | Methyl (3-caffeoyl)-quinate | Cryf |
| 13 | 14.4 | 254–362 | − | 479 | 959 | 316, 179 | Myricetin -3-O-galactose (myricitrin) * | Cral |
| 14 | 14.7 | 254, 360 | − | 761 | 609, 471, 361 | Unknown flavonoid glycoside | Cryl | |
| 15 | 15.1 | 264, 335 | − | 739 | 721, 577, 435, 339 | (Apigenin (2′′ hexoside) 6-C- hexosyl, 8-C-rhamnoside) | Cryl | |
| 16 | 15.6 | 254, 354 | − | 637 | 491, 329, 179, 151 | Quercetin 7,4′-dimethyl ether- 3-O- rutinose | Craf | |
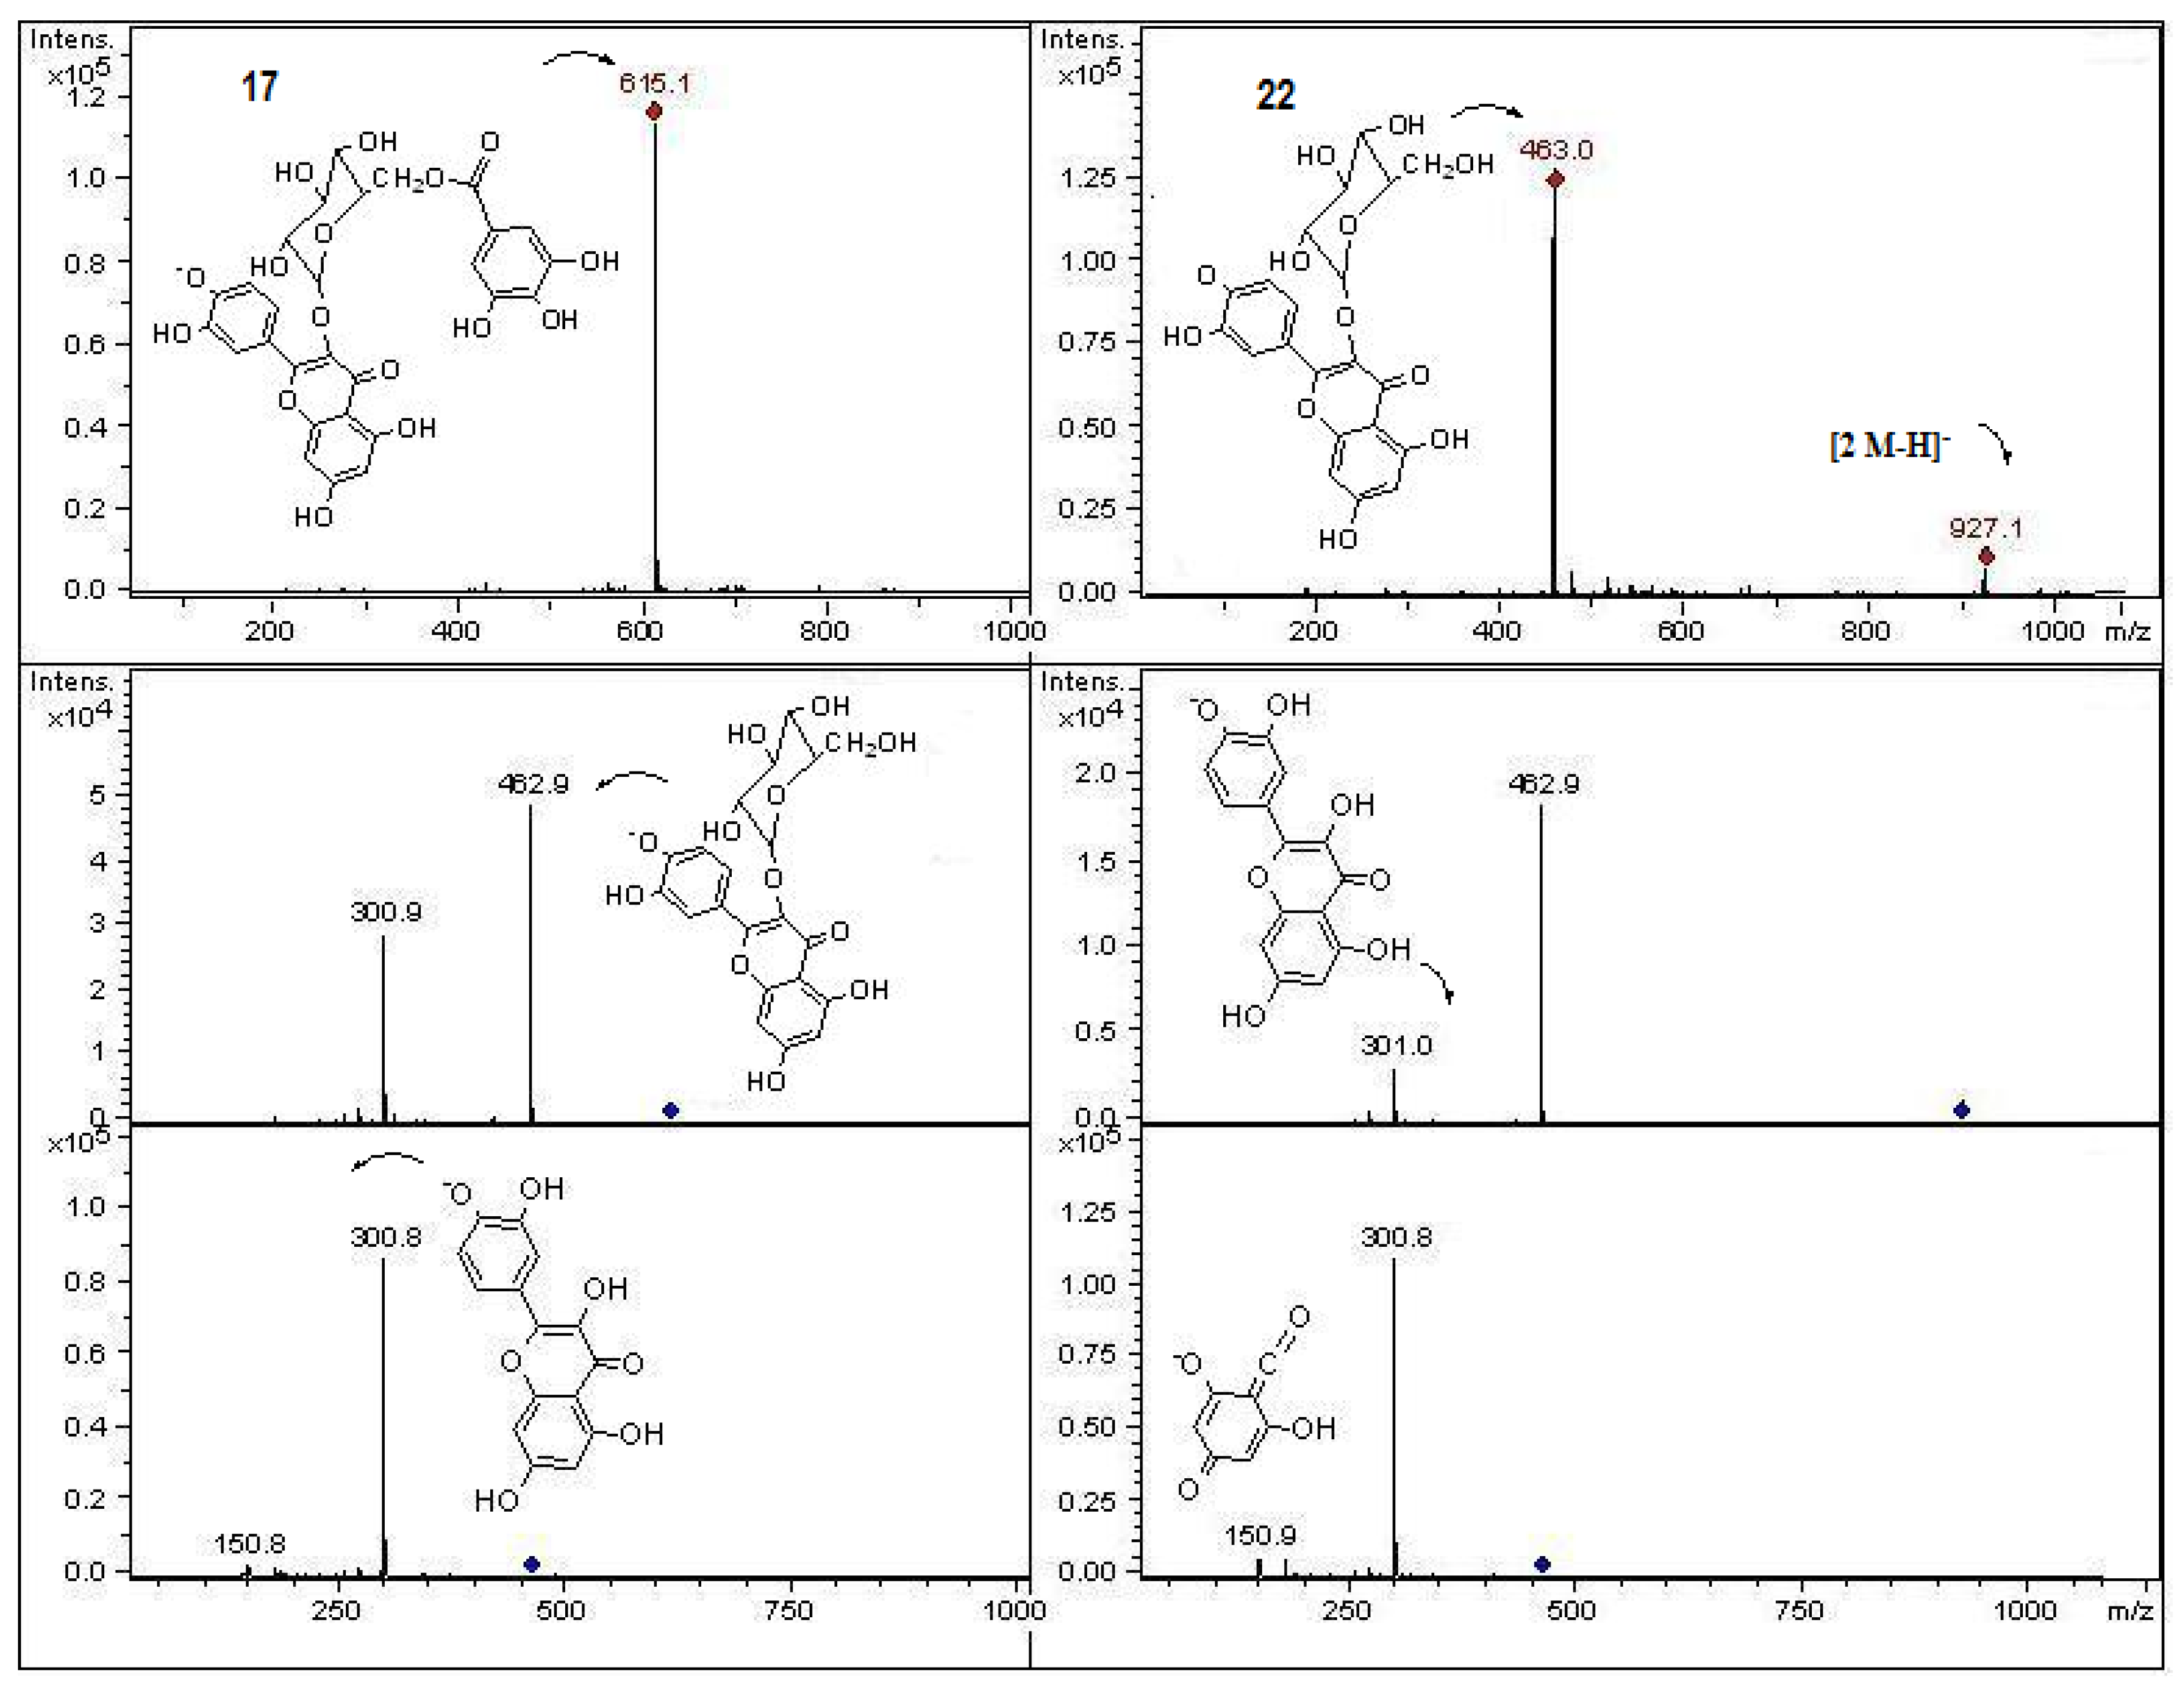
| 17 | 15.9 | 254, 290sh, 360 | − | 615 | 463, 301 | Quercetin-3-O-(6′′ galloyl) glucoside | Cral | |
| 18 | 16.2 | 240, 295sh, 332 | − | 367 | 735 | 179, 135 | Methyl (4-caffeoyl)-quinate | Craf |
| 19 | 17.0 | 246, 265 | − | 733 | 671, 601 | Unknown | Craf | |
| 20 | 17.4 | 278 | − | 577 | 451, 425, 407, 289 | Procyanidin B1 * | Cryl | |
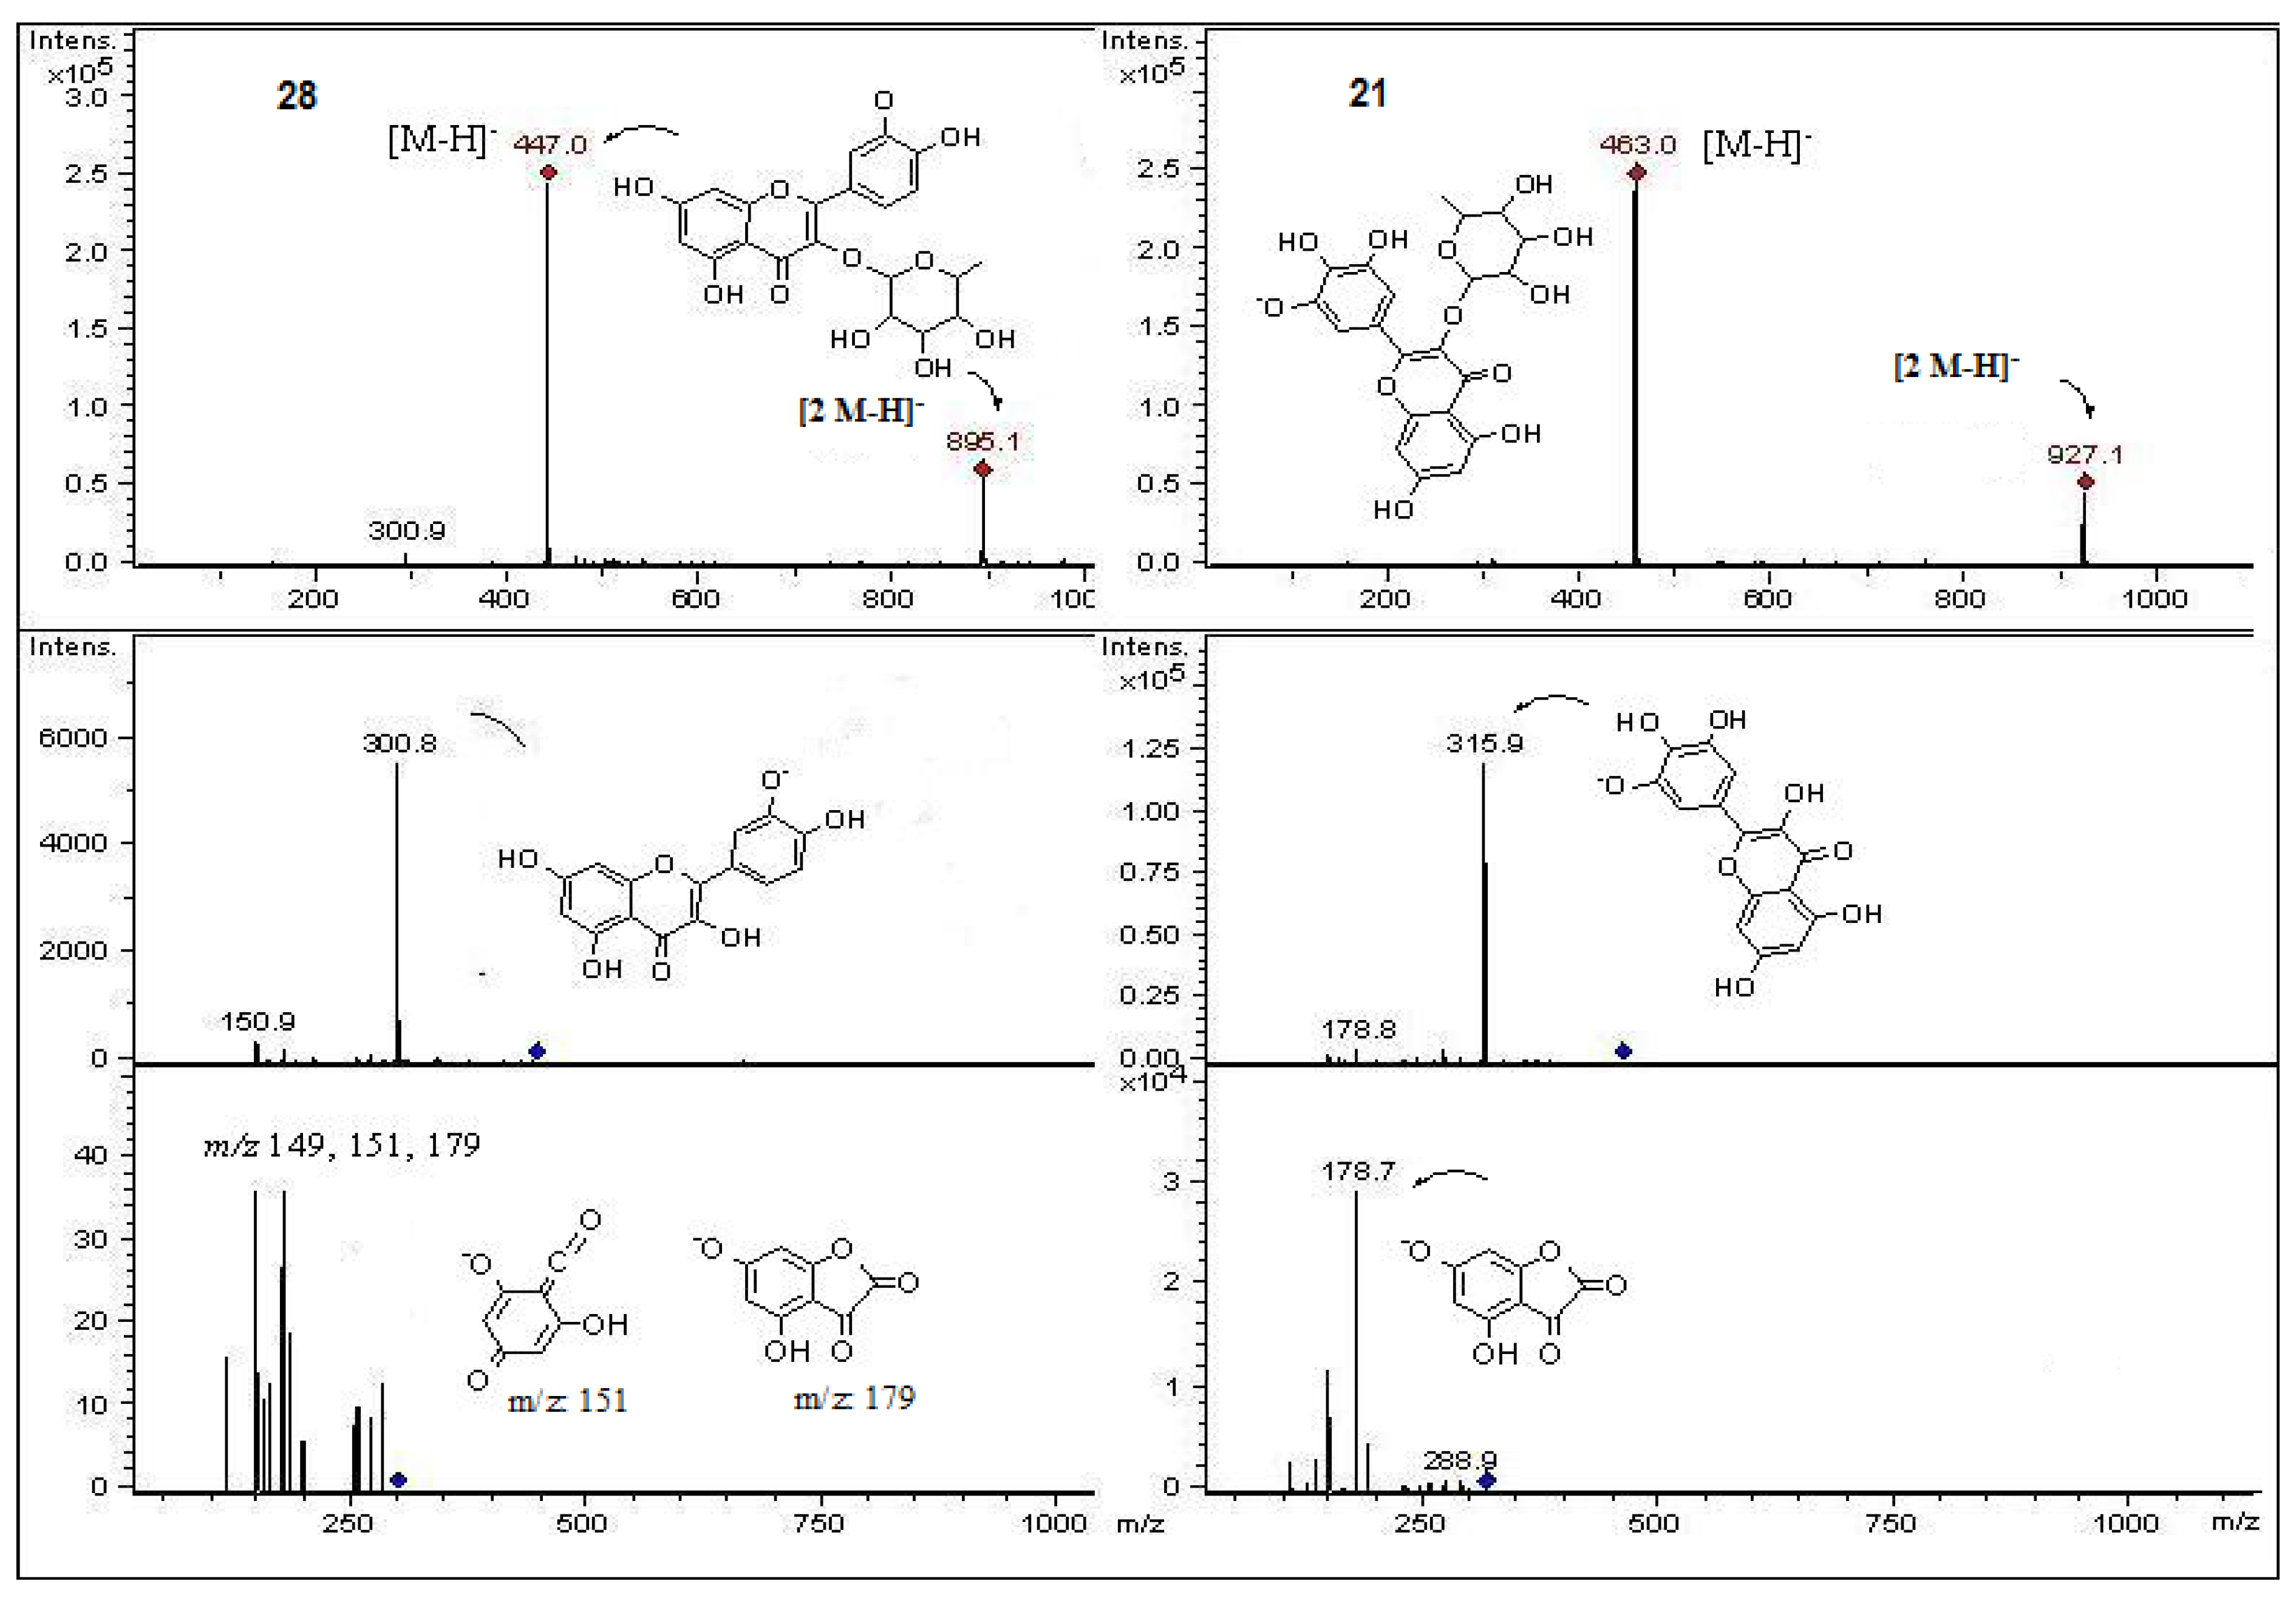
| 21 | 17.6 | 253, 365 | − | 463 | 927 | 316, 178 | Myricetin 3-O- rhamnose | Cral |
| 22 | 18.8 | 254, 363 | − | 463 | 927 | 301, 179, 151 | Hyperoside * | Cral, Cryf |
| 23 | 20.5 | 254, 360 | − | 463 | 927 | 301, 179, 151 | Isoquercitrin * | Cral, Cryf, Cryl |
| 24 | 20.7 | 275, 292sh, 343sh, 512 | + | 947 | 785, 493, 331 | Malvidin-3-O-(4′′′coumaroyl)-rutinose-5-O- glucose | Cral, Craf | |
| 25 | 21.0 | 268, 290sh, 357sh, 503 | + | 917 | 755, 463, 301 | Peonidin-3-O- (4′′′coumaroyl)-rutinose-5-O- glucose | Craf | |
| 26 | 18.7 | 275, 290sh, 343sh, 512 | + | 933 | 771, 479, 317 | Petunidin-3-O- (4′′′coumaroyl)-rutinose-5-O- glucose | Craf | |
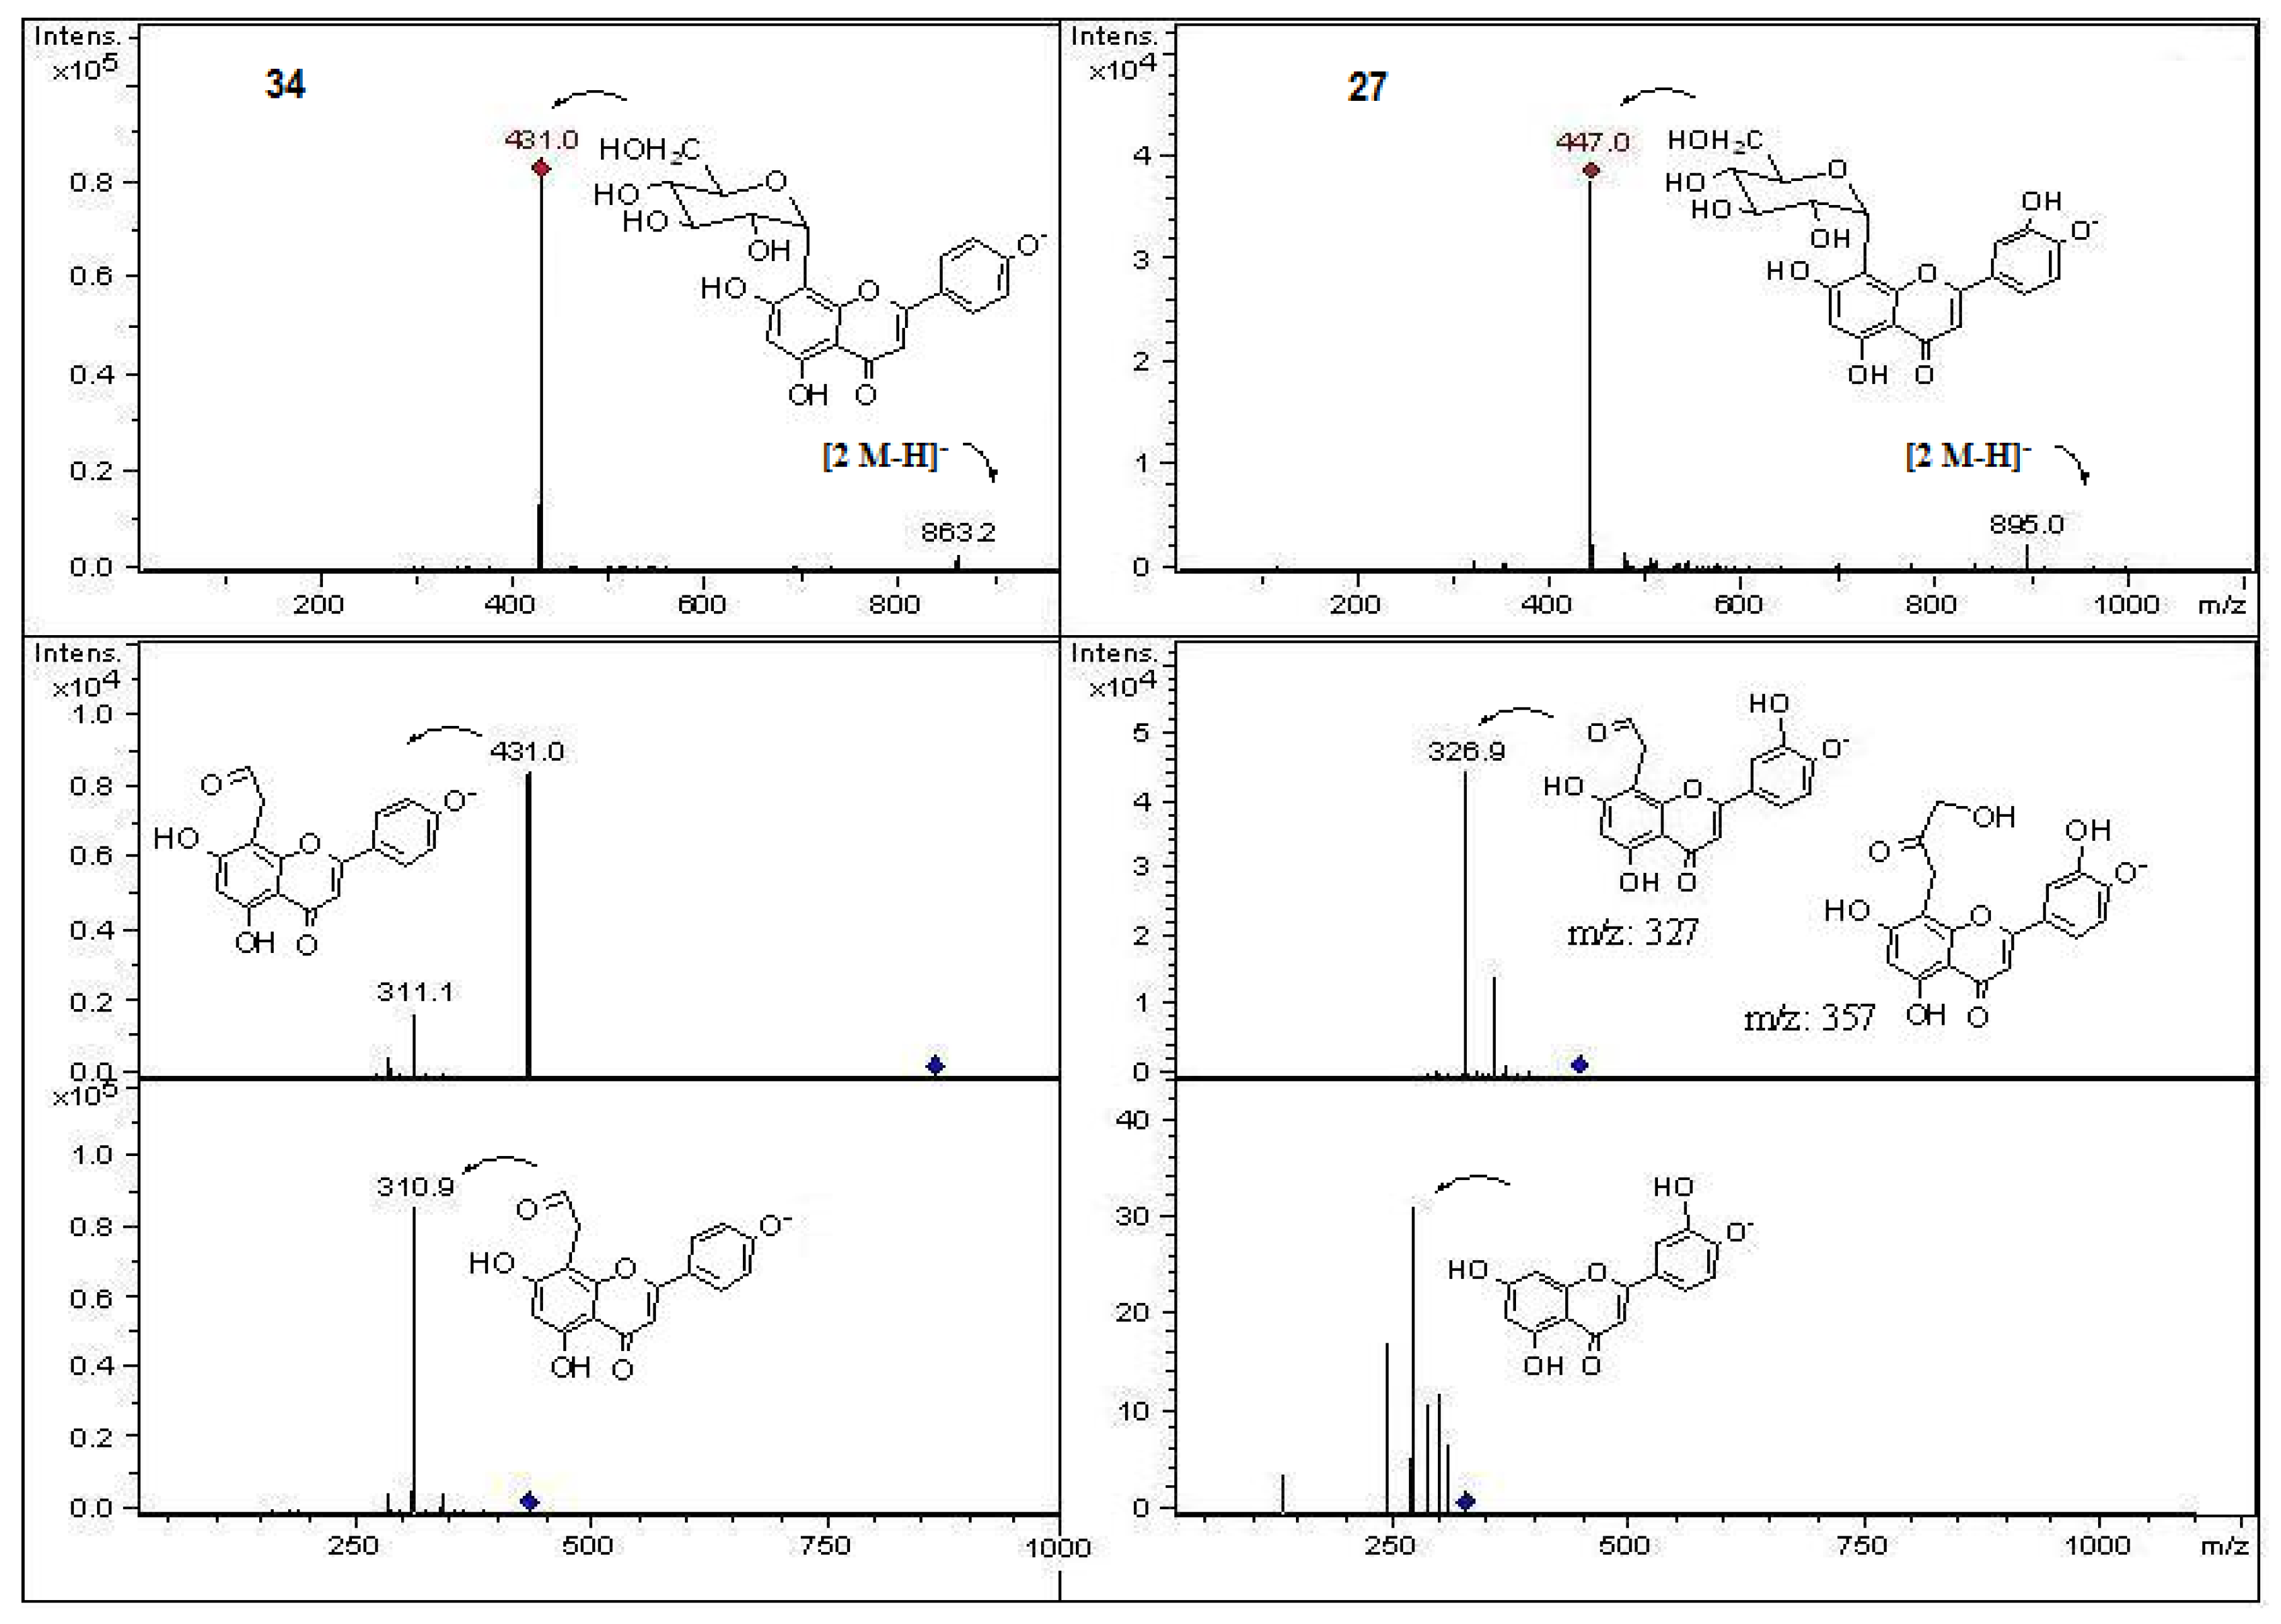
| 27 | 21.4 | 266, 292sh, 352 | − | 447 | 895 | 327 | Luteolin 8-C-glucose (orientin) * | Cryl, Cryf |
| 28 | 22.9 | 254, 364 | − | 447 | 895 | 300,179, 151 | Quercetin -3-O-pentoside | Cral, Cryl, Cryf |
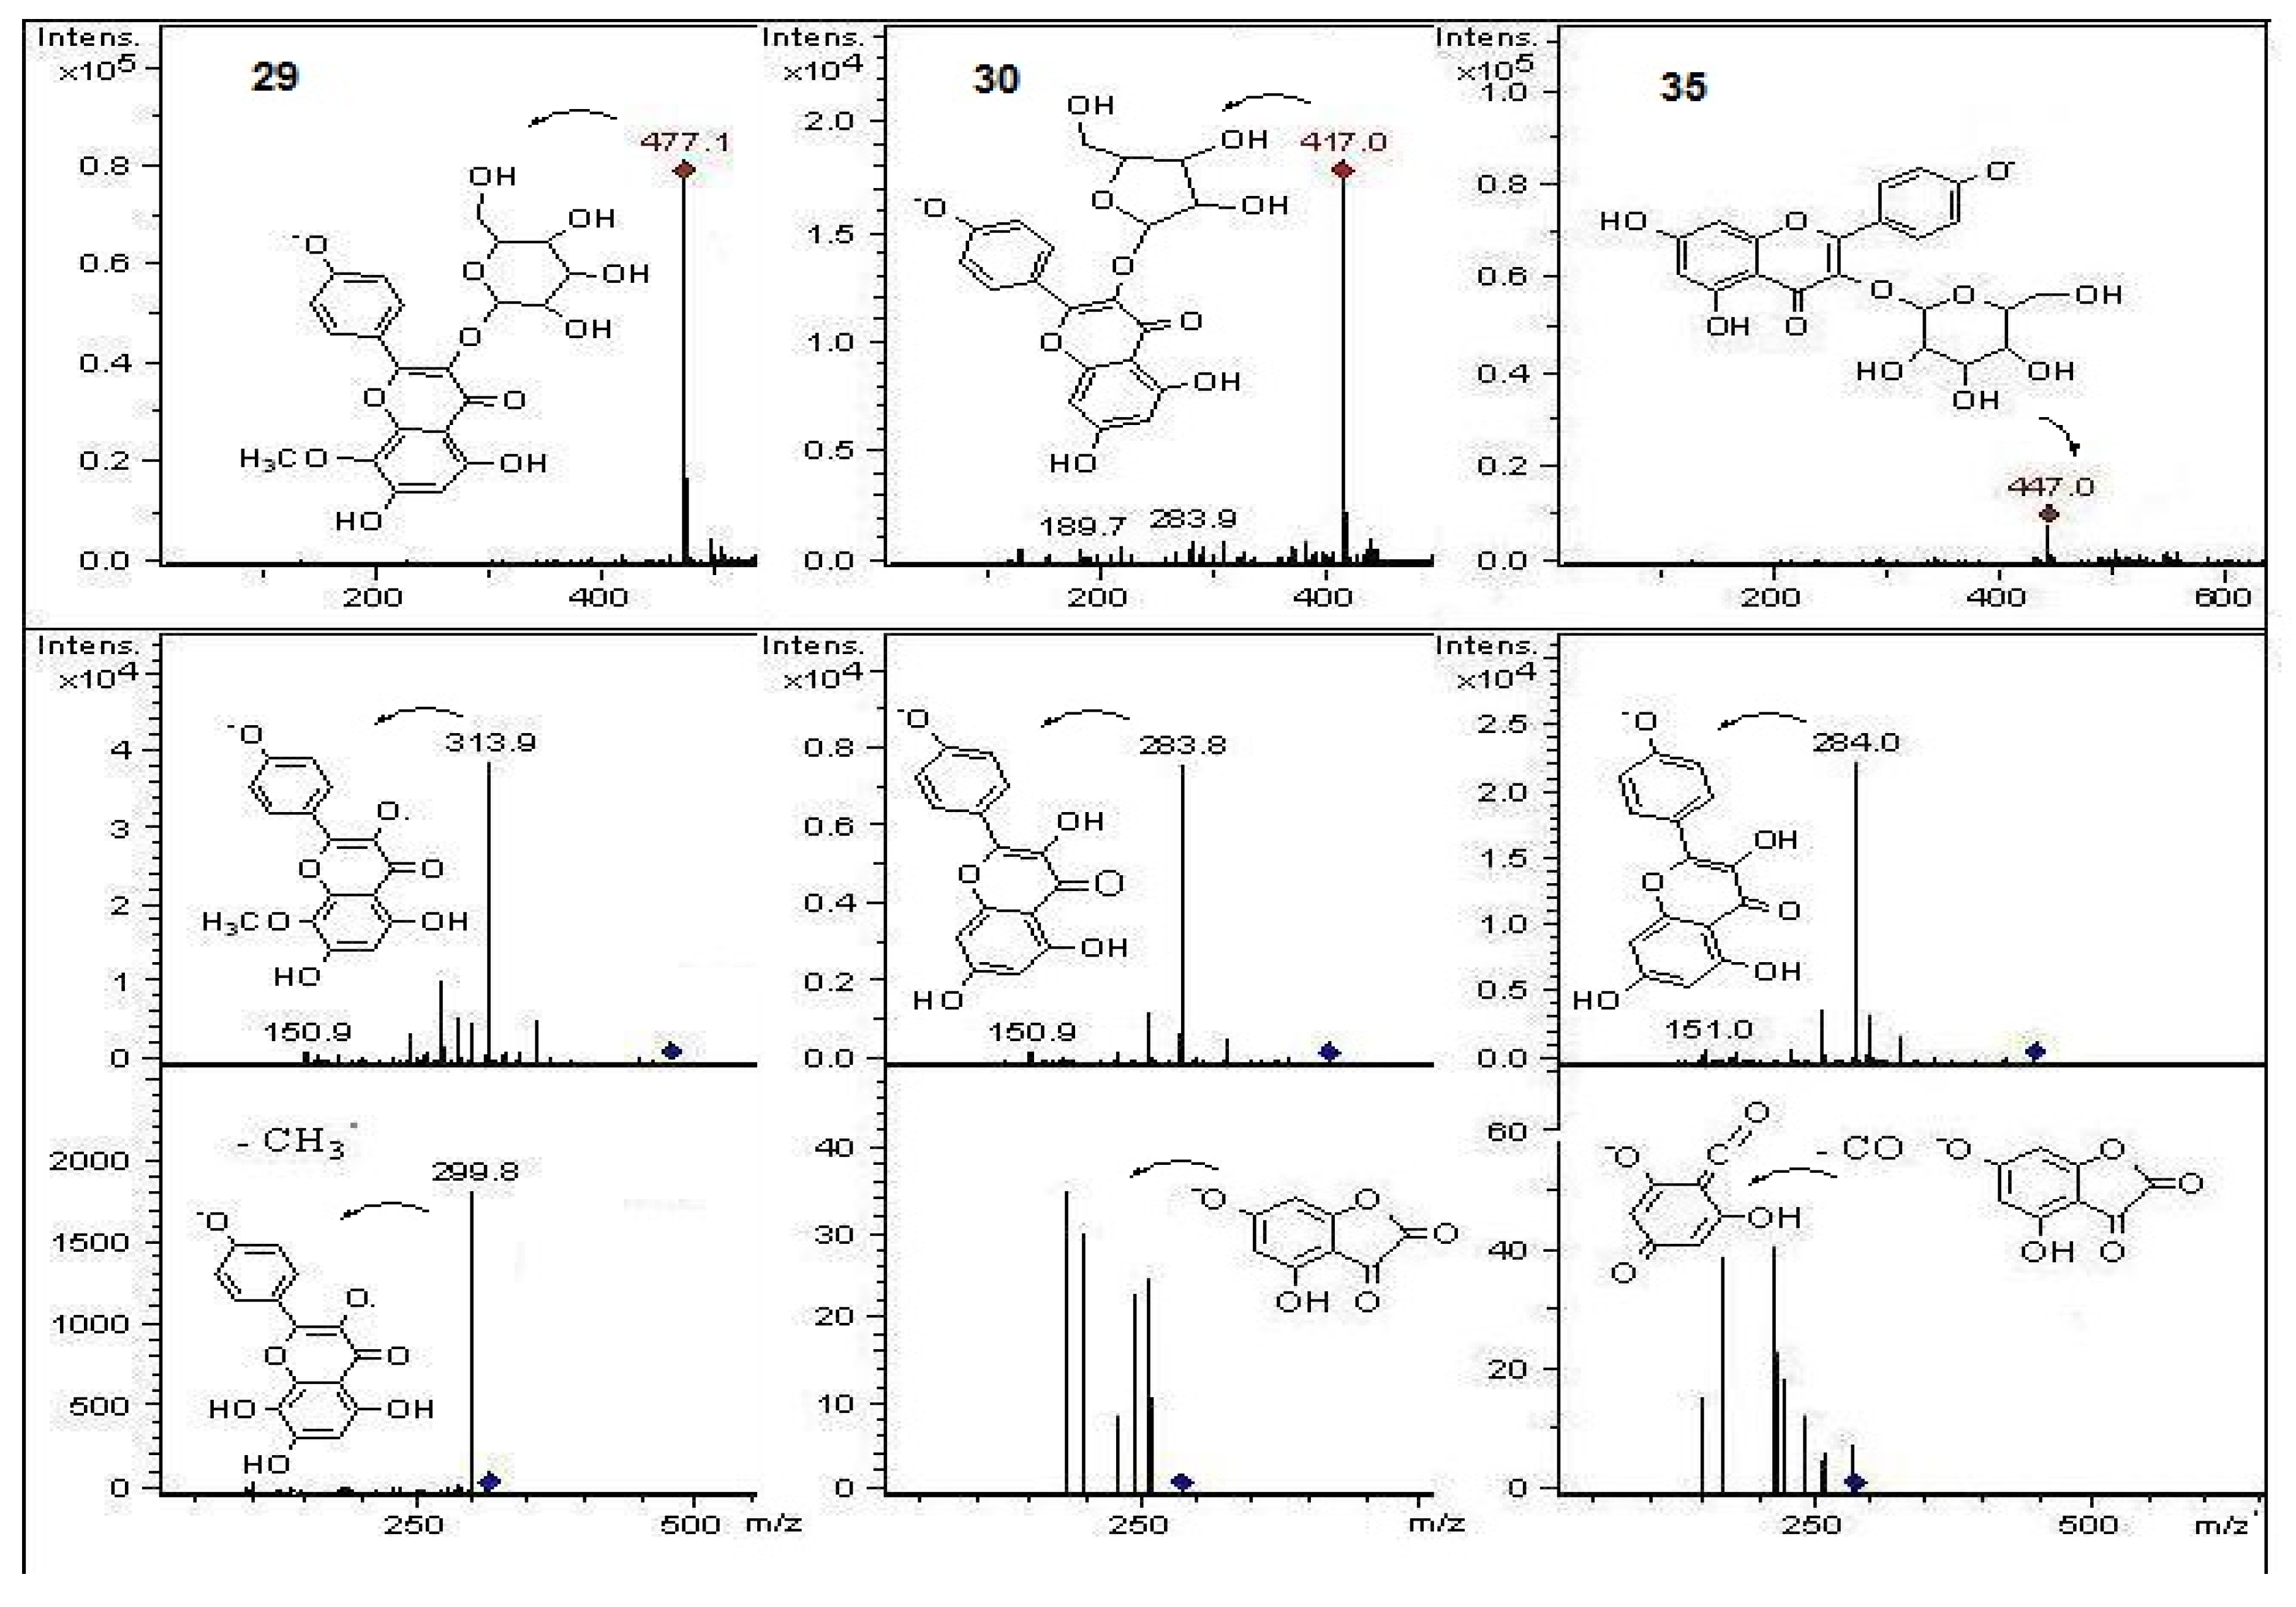
| 29 | 23.5 | 265, 352 | − | 477 | 315, 300, 285 | 8-Methoxy- Kaempferol -3-O- glucose | Cral, Cryl, Craf | |
| 30 | 24.2 | 265, 352 | − | 417 | 285 | Kaempferol-3-O-pentose | Cryl | |
| 31 | 24.8 | 254, 362 | − | 331 | 315, 300, 179, 151 | Myricetin 3′ methyl ether | Cral | |
| 32 | 25.1 | 254, 360 | − | 317 | 300, 179, 151 | Myricetin * | Cryl, Cral | |
| 33 | 26.1 | 275, 292sh, 343sh, 512 | + | 785 | 493, 331 | Malvidin-3-O-(4′′′coumaroyl)-rutinose | Craf, Cryl | |
| 34 | 27.1 | 268, 335 | − | 431 | 311 | Apigenin 8-C-glucose (vitexin) * | Cryl | |
| 35 | 27.7 | 266, 350 | − | 447 | 895 | 285 | Kaempferol 3-O- glucose | Cryl, Cryf |
| 36 | 28.2 | 266, 350 | − | 315 | 300, 285 | 8-Methoxy- Kaempferol | Cryl, Cryf |
© 2013 by the author; licensee MDPI, Basel, Switzerland. This article is an open access article distributed under the terms and conditions of the Creative Commons Attribution license (http://creativecommons.org/licenses/by/3.0/).
Share and Cite
Simirgiotis, M.J. Antioxidant Capacity and HPLC-DAD-MS Profiling of Chilean Peumo (Cryptocarya alba) Fruits and Comparison with German Peumo (Crataegus monogyna) from Southern Chile. Molecules 2013, 18, 2061-2080. https://doi.org/10.3390/molecules18022061
Simirgiotis MJ. Antioxidant Capacity and HPLC-DAD-MS Profiling of Chilean Peumo (Cryptocarya alba) Fruits and Comparison with German Peumo (Crataegus monogyna) from Southern Chile. Molecules. 2013; 18(2):2061-2080. https://doi.org/10.3390/molecules18022061
Chicago/Turabian StyleSimirgiotis, Mario J. 2013. "Antioxidant Capacity and HPLC-DAD-MS Profiling of Chilean Peumo (Cryptocarya alba) Fruits and Comparison with German Peumo (Crataegus monogyna) from Southern Chile" Molecules 18, no. 2: 2061-2080. https://doi.org/10.3390/molecules18022061
APA StyleSimirgiotis, M. J. (2013). Antioxidant Capacity and HPLC-DAD-MS Profiling of Chilean Peumo (Cryptocarya alba) Fruits and Comparison with German Peumo (Crataegus monogyna) from Southern Chile. Molecules, 18(2), 2061-2080. https://doi.org/10.3390/molecules18022061