1. Introduction
For achieve the pharmacological activity of an active pharmaceutical ingredient (API), the solubility of the API in physiological liquids is required, so that the API can be available at the place of absorption. Solubility in various solvents is a characteristic property of a particular compound. The solubility of a compound in water correlates to a great extent with the solubility in physiological liquids and is the first limiting factor for good absorption and biodistribution. From the point of view of pharmaceutical formulations, the solubility of compounds higher than 1% can be considered as satisfactory. When this condition is not met, it is important to improve the solubility. Solubility is not the only important factor; also the solubility rate is essential. This is a physico-chemical property that can be influenced by crystal shape (morphology, polymorphism), particle size, properties of compound surface,
etc. [
1,
2,
3].
The solubility of an API can be principally influenced in two ways: (i) chemically (salt formation when the molecule is ionizable; other molecule modification to increase hydrophilicity; prodrug preparation); or (ii) by optimization of physico-chemical properties (addition of excipients, particle size reduction or change of polymorphic forms). There are several ways to improve API solubility based on addition of excipients: (i) formation of molecular complexes with solubilizers (e.g., benzoate sodium with caffeine) and/or with soluble salts of polybasic organic acids and hydroxy acids; (ii) generation of inclusion complexes with natural or synthetically modified cyclodextrins or (iii) application of co-solvents (such as ethanol, glycerol, propylene glycol, polyethylene glycol). Solubility can be also increased by addition of surfactants/tensides that create micelles in the aqueous medium. One more frequently used method of solubility increase is complexation of API to native or chemically modified polysaccharide matrixes, for example, of pectins, glucans, chitosans, celluloses, alginates,
etc. [
1,
2,
3,
4,
5].
The other possibility how to increase the solubility of an API is preparation of nanoparticles. The advantages of nanotechnology are as follows: (i) increased bioavailability (quick dissolution; improved penetration through membranes); (ii) lower doses; (iii) lower toxicity; (iv) targeted biodistribution; (v) reduction of influence of food on variability; vi) quicker development of formulations [
2,
6,
7,
8,
9]. Nanoparticles less than 200 nm are of practical importance [
10,
11,
12,
13,
14,
15]. Nevertheless it is necessary to admit some disadvantages of nanoparticles, such as: (i) increased aggregation in biological systems due to high surface energy; (ii) poor solubility and biocompatibility of carbon nanotubes; (iii) short biological half-life due to fast uptake in RES; (iv) high immunogenicity; (v) acute and chronic toxicity, and (vi) irresponsible/unforeseeable safety problems. Especially their possible toxicity comprises a great problem. The toxicity is dependent on the shape and surface properties of nanoparticles, because shape and surface can influence nanoparticle-cell interactions as well as the rate of penetration to cells. From various nanoparticle forms nanotubes were found as one of the most toxic nanoparticle shapes [
16,
17,
18,
19].
A wide range of techniques have been developed for the preparation of nanomaterials [
8,
9,
12,
13,
14,
15,
20,
21,
22,
23,
24,
25,
26]. Synthetic methods for nanoparticles are typically grouped into two categories: top-down (generally dispergation processes) and bottom-up (generally precipitation processes). The first involves division of a massive solid into smaller portions. This approach may involve milling or attrition, chemical methods and volatilization of a solid followed by condensation of the volatilized components, e.g., high-energy ball milling, high-pressure homogenization, emulsifying technology and microfluidization [
13,
14,
15,
20,
21,
22,
23]. The second, bottom-up, method of nanoparticle fabrication involves condensation of atoms or molecular entities in a gas phase or in solution such as sol-gel synthesis [
13,
14,
15,
20,
24] and precipitation processes, for example, spray freezing into liquid, evaporative precipitation into aqueous solution, precipitation with compressed antisolvent or rapid expansion of supercritical solution) [
13,
14,
15,
20,
25,
26]. The latter approach is by far the most popular in the preparation of nanoparticles.
The aim of this paper is preparation of nanoparticles of cholesterol-like compounds by precipitation. The procedure is in principle similar to the solvent evaporation process, e.g., evaporative precipitation into aqueous solution. Methods based on the similar approach were described recently [
27,
28,
29]. The chosen model APIs represent poorly water soluble compounds. In this pilot screening various types of surface-active agents were investigated. These excipients belong to GRAS substances and were applied in various concentrations. This contribution is the result of our interest in primary screening of nanoparticle preparation. Relationships between a substance, a solvent and a used excipient are discussed.
2. Results and Discussion
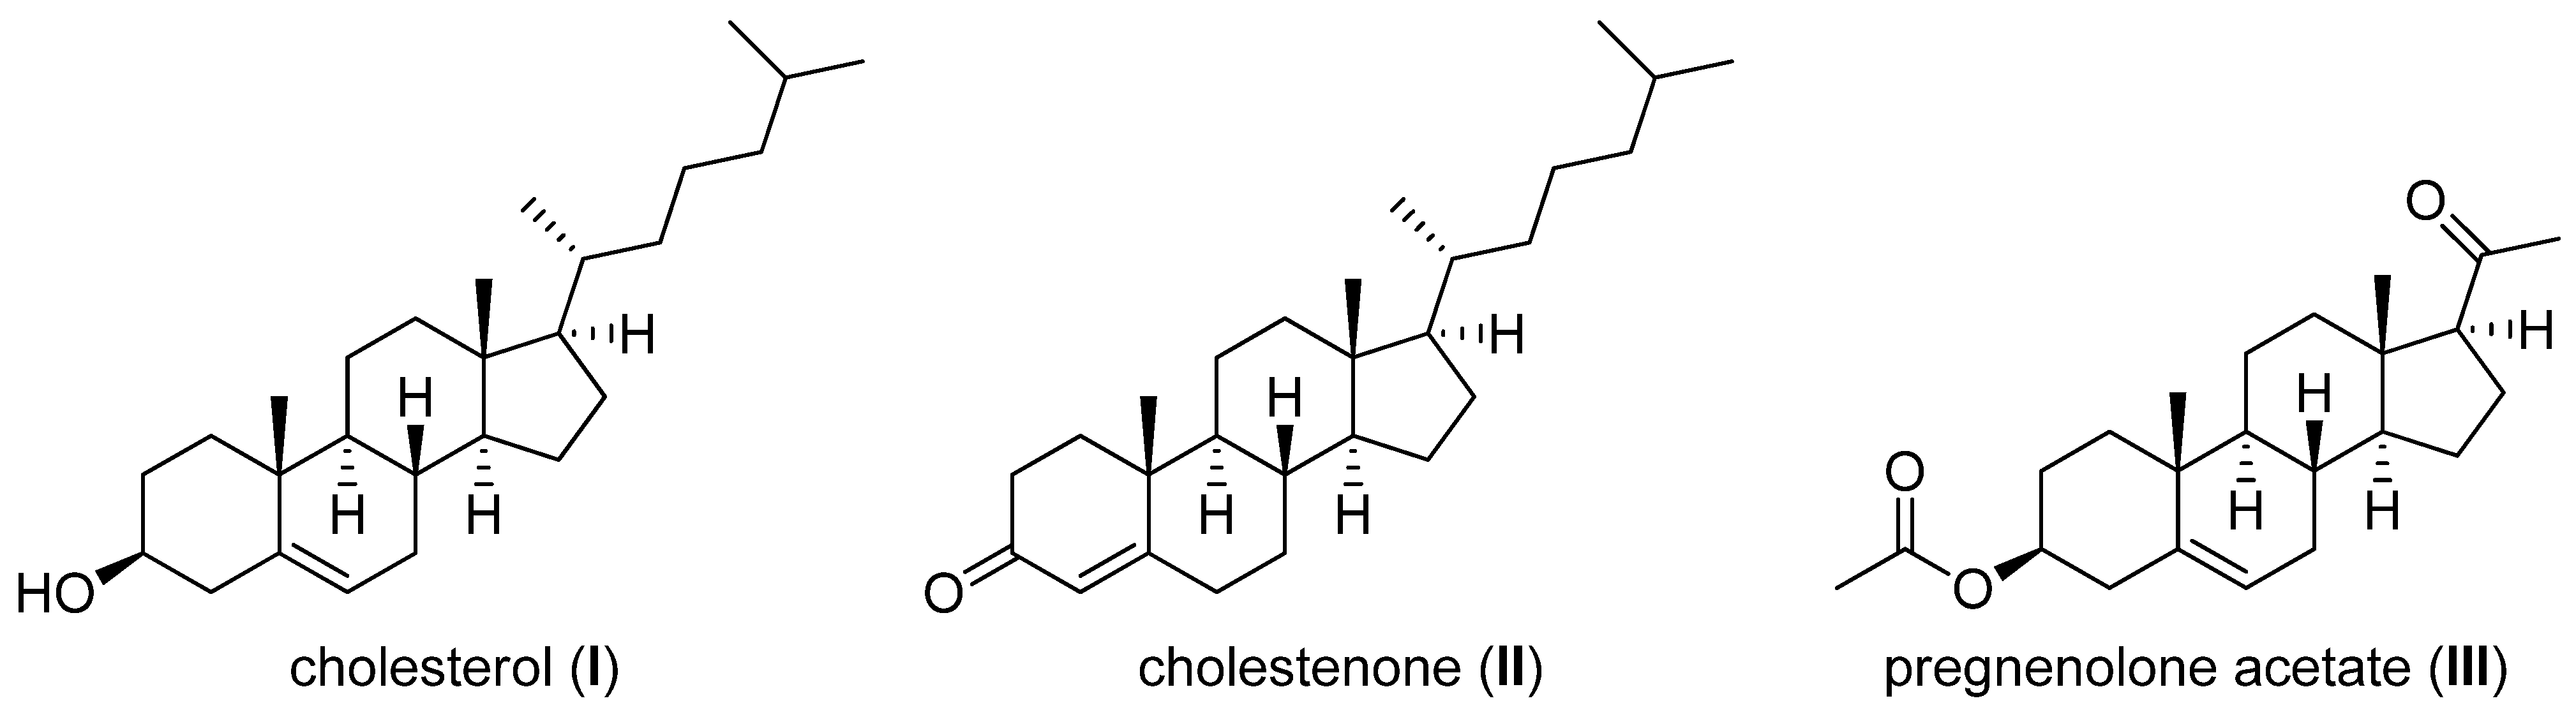
All three model APIs, cholesterol (5-cholesten-3β-ol,
I), cholestenolone (4-cholesten-3-one,
II) and pregnenolone acetate (5-pregnen-3β-ol-20-one acetate,
III), see
Figure 1, were chosen as types of poorly aqueous soluble compounds [
4,
12].
Figure 1.
Structures of model APIs.
Figure 1.
Structures of model APIs.
Used excipients represent various classes of pharmaceutical adjutants that can be utilized as solubility modifying compounds. Tween 80 (polysorbate 80, polyoxyethylene sorbitan monooleate) is a nonionic surfactant and emulsifier. Polyoxyethylene groups are hydrophilic groups, nevertheless C
18 chain of oleic acid constitutes a lipophilic group. Sodium dodecyl sulfate (SDS, sodium lauryl sulfate) is an anionic surfactant consisting of a C
12 tail attached to a sulfate group, giving the compound the desired amphiphilic properties. Macrogol 6000 (polyethylene glycol, PEG) is used as an excipient in pharmaceutical formulations. The number represents the average molecular weight of the polyethylene glycol. Carboxymethyl cellulose (CMC, carmellose) is a cellulose derivative with carboxymethyl groups bound to some of the hydroxyl groups of the glucopyranose monomers that make up the cellulose backbone. It is often used as salt-sodium carboxymethyl cellulose (SCMC). It is used as a viscosity modifier or thickener, and to stabilize emulsions in various products. Carboxymethyl dextran (CMD) is a polyanionic derivative of dextran (branched glucan composed of chains of varying lengths). It is supplied as the sodium salt of carboxymethyl dextran (SCMD). It is used as a stabilizer of proteins and other sensitive biopolymers, as a carrier for biosensor surfaces, as a stable non-toxic, non-immunogenic additive and also is used for preparation of low-toxic derivatives with drugs and other pharmacologically active substances [
3].
The concentration of excipient was chosen between 1% and 10%. The optimal concentration of surfactant is important for optimal particles wetting. If the concentration is too low, particles float on the surface. If the concentration is too high bubbles appear [
30]. The polar acetone (AC) and nonpolar dichloromethane (DCM) were chosen as the most suitable solvents for easy dissolution of the APIs.
All model APIs dissolved in dichloromethane and acetone (2% concentration) were added to aqueous solutions (1%, 3%, 5%, 10% concentration) of excipients such as Tween 80 (TW), sodium dodecyl sulfate (SDS), macrogol 6000 (PEG), sodium carboxymethyl cellulose (SCMC) and sodium carboxymethyl dextran (SCMD),
i.e., with each excipient 24 samples were prepared. The final relations API: excipient were 1:0.5 (2%:1%), 1:1.5 (2%:3%), 1:2.5 (2%:5%), 1:5 (2%:10%). Samples were obtained by mixing and simultaneous evaporation of organic solvent to final 10 mL sample volume and then characterized by dynamic light scattering [
30]. All the results are presented in
Table 1,
Table 2,
Table 3,
Table 4 and
Table 5 and
Figure 2,
Figure 3,
Figure 4,
Figure 5 and
Figure 6.
Figure 2,
Figure 3,
Figure 4,
Figure 5 and
Figure 6 illustrate the dependence of particle size expressed as the cumulative distribution x
90 [nm] of the compounds
I–
III on the concentration [%] of an individual excipient, whereas in Figures A samples are grouped according to individual APIs
I–
III, while in Figures B always individual APIs are separated according to the percentage of the excipient. The particle size x
90 was used for evaluation of the method success, since this value represents 90% of the cumulative particle size distribution in the measured sample.
The dispersity is a measure/degree of the homogeneity/heterogeneity of sizes of particles in a mixture/system. It is possible to see this feature on the width of the particle-size distribution, which is described as differences between cumulative distribution x
10 and x
90, see
Table 1–
Table 5. According to the results, the average relation of the cumulative distribution x
10/x
90 ranged from 0.6 to 0.9. It is possible to suppose that nanoparticles are spheres, because the size in dynamic light scattering means the hydrodynamic diameter of the particle. All samples were dispersed by ultrasonics directly before the measurement to avoid possible re-agglomeration. Stabilization of the dispersed samples was achieved by surfactants and by the temperature. The measuring cell was equilibrated at 25 °C, so the Brown motion of nanoparticles is influenced just by their size.
From
Figure 2A–
Figure 6A it can be stated that particle size is not dependent on model API type but it is strongly influenced by the type and concentration of the utilized excipient. After summarization of all the results it can be concluded that from 120 prepared mixtures 100 samples contained nanoparticles (see
Table 1–
Table 5), from which 82 samples contained nanoparticles smaller than 200 nm (see
Table 1–
Table 5, bolded values). Nanoparticles under 10 nm were determined in 51 samples from 82, see
Table 1–
Table 5 (bolded values with grey background).
Table 1.
Particle size (x10, x90 [nm]) of APIs I–III and concentration [%] of Tween 80 in dichloromethane (DCM) or acetone (AC). All the presented results are reported as medium value of four independent measurements, repeatability was up to 6%. Samples that contained nanoparticles <200 nm are bolded; nanoparticles <10 nm are indicated by grey background. (S.No. = sample number).
| API/Solvent | Tween 80 | |
| S.No. | 1% | S.No. | 3% | S.No. | 5% | S.No. | 10% | |
| x10 | x90 | x10 | x90 | x10 | x90 | x10 | x90 | Particle size [nm] |
| I/DCM | 1 | 1 | 1 | 2 | 139 | 200 | 3 | 222 | 289 | 4 | 158 | 231 |
| I/AC | 5 | 2038 | 2242 | 6 | 9963 | 10,276 | 7 | 9344 | 10,281 | 8 | 7 | 8 |
| II/DCM | 9 | 218 | 288 | 10 | 3149 | 3464 | 11 | 97 | 189 | 12 | 18 | 19 |
| II/AC | 13 | 14 | 21 | 14 | 57 | 81 | 15 | 9345 | 10,281 | 16 | 2 | 3 |
| III/DCM | 17 | 63 | 94 | 18 | 91 | 99 | 19 | 3640 | 4005 | 20 | 62 | 79 |
| III/AC | 21 | 332 | 366 | 22 | 2 | 3 | 23 | 53 | 77 | 24 | 12 | 19 |
Table 2.
Particle size (x10, x90 [nm]) of APIs I–III and concentration [%] of sodium dodecyl sulfate in dichloromethane (DCM) or acetone (AC). All the presented results are reported as medium value of four independent measurements, repeatability was up to 6%. Samples that contained nanoparticles <200 nm are bolded; nanoparticles <10 nm are indicated by grey background. (S.No. = sample number).
| API/Solvent | Sodium dodecyl sulfate | |
| S.No. | 1% | S.No. | 3% | S.No. | 5% | S.No. | 10% | |
| x10 | x90 | x10 | x90 | x10 | x90 | x10 | x90 | Particle size [nm] |
| I/DCM | 25 | 1 | 2 | 26 | 61 | 91 | 27 | 136 | 186 | 28 | 286 | 391 |
| I/AC | 29 | 503 | 706 | 30 | 1 | 1 | 31 | 195 | 272 | 32 | 9344 | 10,280 |
| II/DCM | 33 | 9345 | 10,281 | 34 | 134 | 184 | 35 | 1 | 2 | 36 | 1001 | 111 |
| II/AC | 37 | 24 | 26 | 38 | 2 | 3 | 39 | 18 | 27 | 40 | 6 | 9 |
| III/DCM | 41 | 12 | 18 | 42 | 1 | 2 | 43 | 1 | 2 | 44 | 1 | 2 |
| III/AC | 45 | 771 | 1083 | 46 | 4 | 7 | 47 | 4 | 7 | 48 | 1 | 2 |
Table 3.
Particle size (x10, x90 [nm]) of APIs I–III and concentration [%] of macrogol 6000 in dichloromethane (DCM) or acetone (AC). All the presented results are reported as medium value of four independent measurements, repeatability was up to 6%. Samples that contained nanoparticles <200 nm are bolded; nanoparticles <10 nm are indicated by grey background. (S.No. = sample number).
| API/Solvent | Macrogol 6000 | |
| S.No. | 1% | S.No. | 3% | S.No. | 5% | S.No. | 10% | |
| x10 | x90 | x10 | x90 | x10 | x90 | x10 | x90 | Particle size [nm] |
| I/DCM | 49 | 534 | 773 | 50 | 15 | 16.86 | 51 | 179 | 247 | 52 | 1 | 2 |
| I/AC | 53 | 2 | 2 | 54 | 3 | 4 | 55 | 2 | 3 | 56 | 193 | 292 |
| II/DCM | 57 | 90 | 99 | 58 | 408 | 576.85 | 59 | 197 | 285 | 60 | 211 | 279 |
| II/AC | 61 | 1 | 2 | 62 | 1 | 2.27 | 63 | 1 | 2 | 64 | 29 | 44 |
| III/DCM | 65 | 3 | 4 | 66 | 2 | 3 | 67 | 27 | 30 | 68 | 1 | 1 |
| III/AC | 69 | 2929 | 3222 | 70 | 3 | 3 | 71 | 90 | 99 | 72 | 6 | 6 |
Table 4.
Particle size (x10, x90 [nm]) of APIs I–III and concentration [%] of sodium carboxymethyl cellulose in dichloromethane (DCM) or acetone (AC). All the presented results are reported as medium value of four independent measurements, repeatability was up to 6%. Samples that contained nanoparticles <200 nm are bolded; nanoparticles <10 nm are indicated by grey background. (S.No. = sample number).
| API/Solvent | Sodium carboxymethyl cellulose | |
| S.No. | 1% | S.No. | 3% | S.No. | 5% | S.No. | 10% | |
| x10 | x90 | x10 | x90 | x10 | x90 | x10 | x90 | Particle size [nm] |
| I/DCM | 73 | 101 | 111 | 74 | 2 | 3 | 75 | 1 | 1 | 76 | 1 | 2 |
| I/AC | 77 | 6 | 9 | 78 | 357 | 486 | 79 | 7 | 9 | 80 | 2 | 3 |
| II/DCM | 81 | 90 | 99 | 82 | 1 | 2 | 83 | 3 | 3 | 84 | 879 | 1249 |
| II/AC | 85 | 2 | 3 | 86 | 90 | 99 | 87 | 1 | 2 | 88 | 101 | 111 |
| III/DCM | 89 | 1 | 2 | 90 | 8799 | 9987 | 91 | 1 | 2 | 92 | 534 | 731 |
| III/AC | 93 | 4 | 6 | 94 | 9345 | 10,281 | 95 | 9345 | 10,281 | 96 | 2 | 2 |
Table 5.
Particle size (x10, x90 [nm]) of APIs I–III and concentration [%] of sodium carboxymethyl dextran in dichloromethane (DCM) or acetone (AC). All the presented results are reported as medium value of four independent measurements, repeatability was up to 6%. Samples Samples that contained nanoparticles <200 nm are bolded; nanoparticles <10 nm are indicated by grey background. (S.No. = sample number).
| API/Solvent | Sodium carboxymethyl dextran | |
| S.No. | 1% | S.No. | 3% | S.No. | 5% | S.No. | 10% | |
| x10 | x90 | x10 | x90 | x10 | x90 | x10 | x90 | Particle size [nm] |
| I/DCM | 97 | 5862 | 8981 | 98 | 1 | 1 | 99 | 20 | 31 | 100 | 17 | 26 |
| I/AC | 101 | 1 | 1 | 102 | 8 | 9 | 103 | 3 | 4 | 104 | 90 | 99 |
| II/DCM | 105 | 209 | 275 | 106 | 354 | 422 | 107 | 9345 | 10,281 | 108 | 2022 | 3205 |
| II/AC | 109 | 3 | 3 | 110 | 9345 | 10,281 | 111 | 535 | 729 | 112 | 1 | 2 |
| III/DCM | 113 | 1 | 1 | 114 | 1 | 2 | 115 | 1418 | 1560 | 116 | 3 | 5 |
| III/AC | 117 | 9344 | 10,281 | 118 | 101 | 111 | 119 | 5 | 8 | 120 | 22 | 24 |
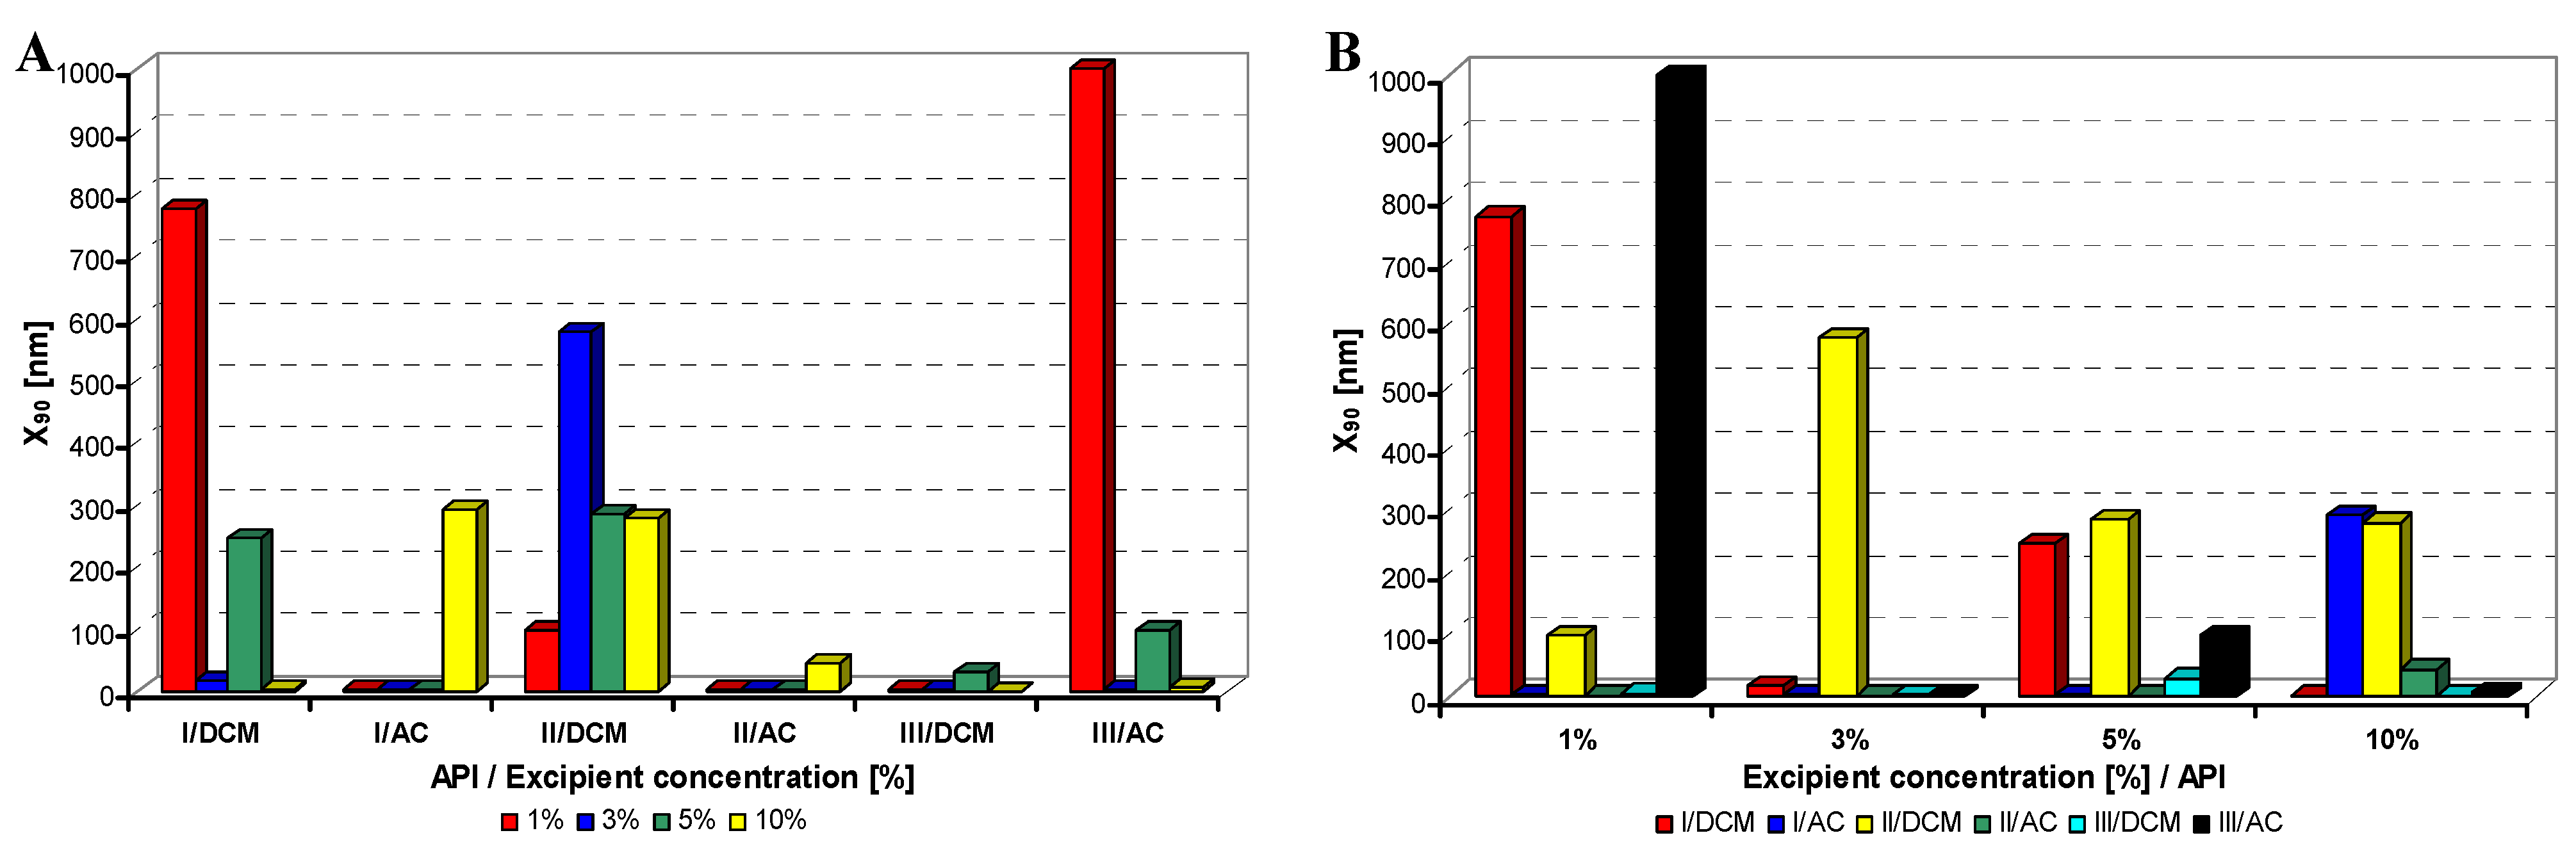
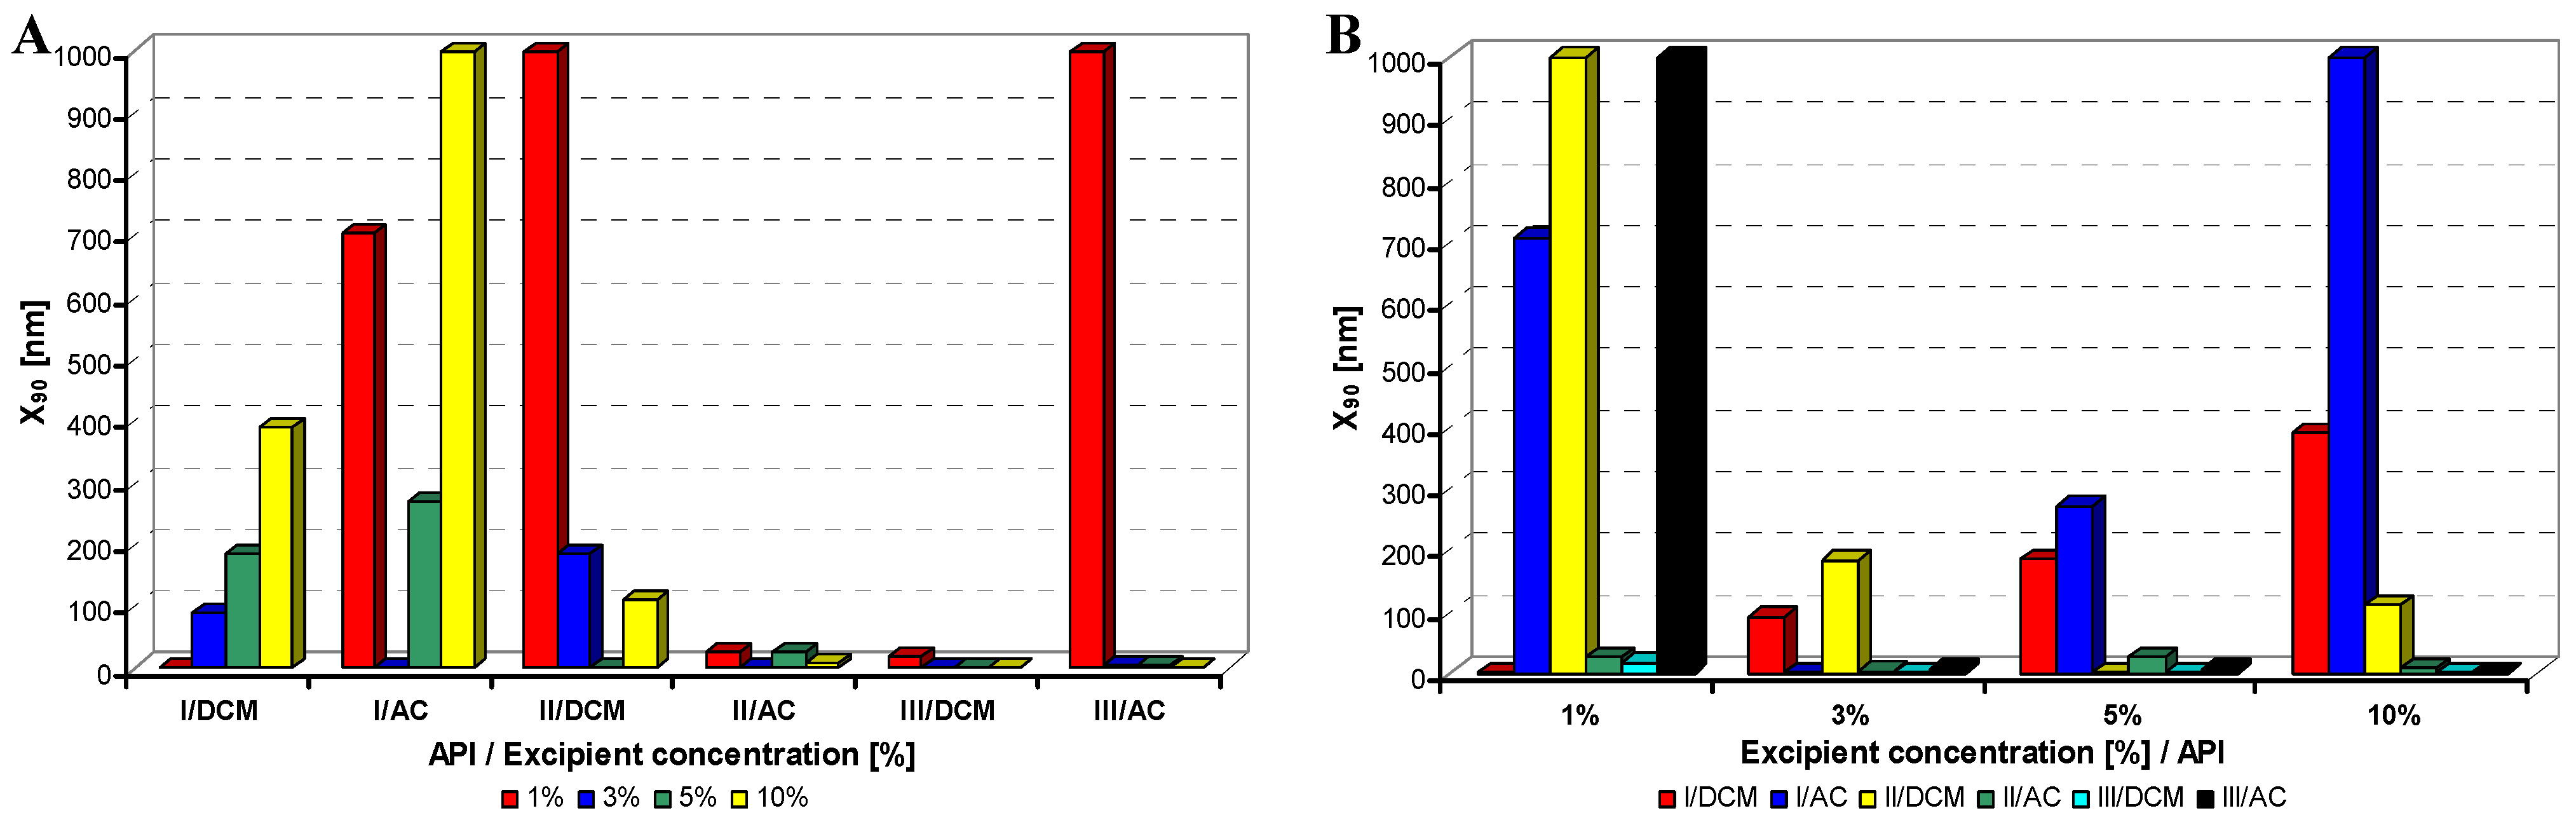
Figure 2.
Dependence of particle size (x90 [nm]) of model APIs I–III on concentration [%] of Tween 80 in dichloromethane (DCM) or acetone (AC). (A) Samples are grouped according to APIs; (B) samples are grouped according to excipient percentage. For clarity sake, the values on y-axis are only to 1,000 nm.
Figure 3.
Dependence of particle size (x90 [nm]) of model APIs I–III on concentration [%] of sodium dodecyl sulfate in dichloromethane (DCM) or acetone (AC). (A) Samples are grouped according to APIs; (B) samples are grouped according to excipient percentage. For clarity sake, the values on y-axis are only to 1,000 nm.
Figure 4.
Dependence of particle size (x90 [nm]) of model APIs I–III on concentration [%] of macrogol 6000 in dichloromethane (DCM) or acetone (AC). (A) Samples are grouped according to APIs; (B) samples are grouped according to excipient percentage. For clarity sake, the values on y-axis are only to 1,000 nm.
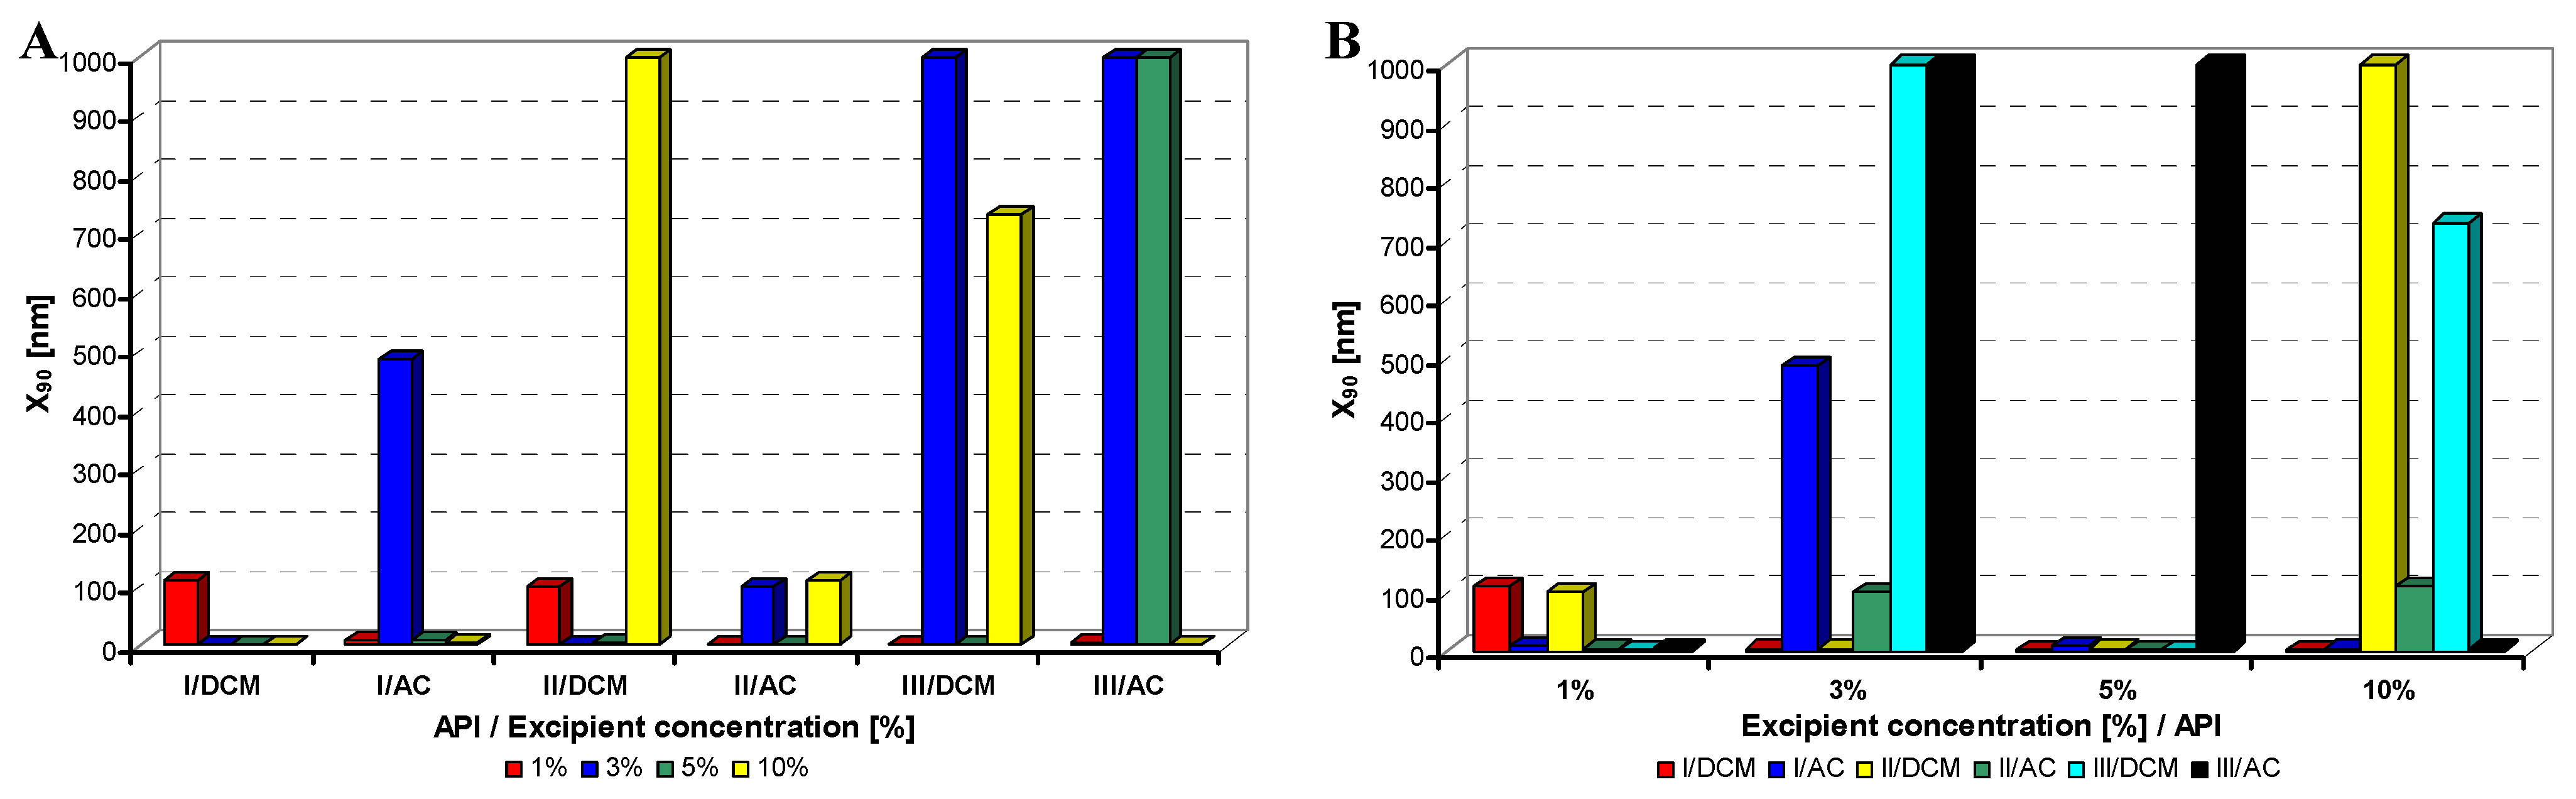
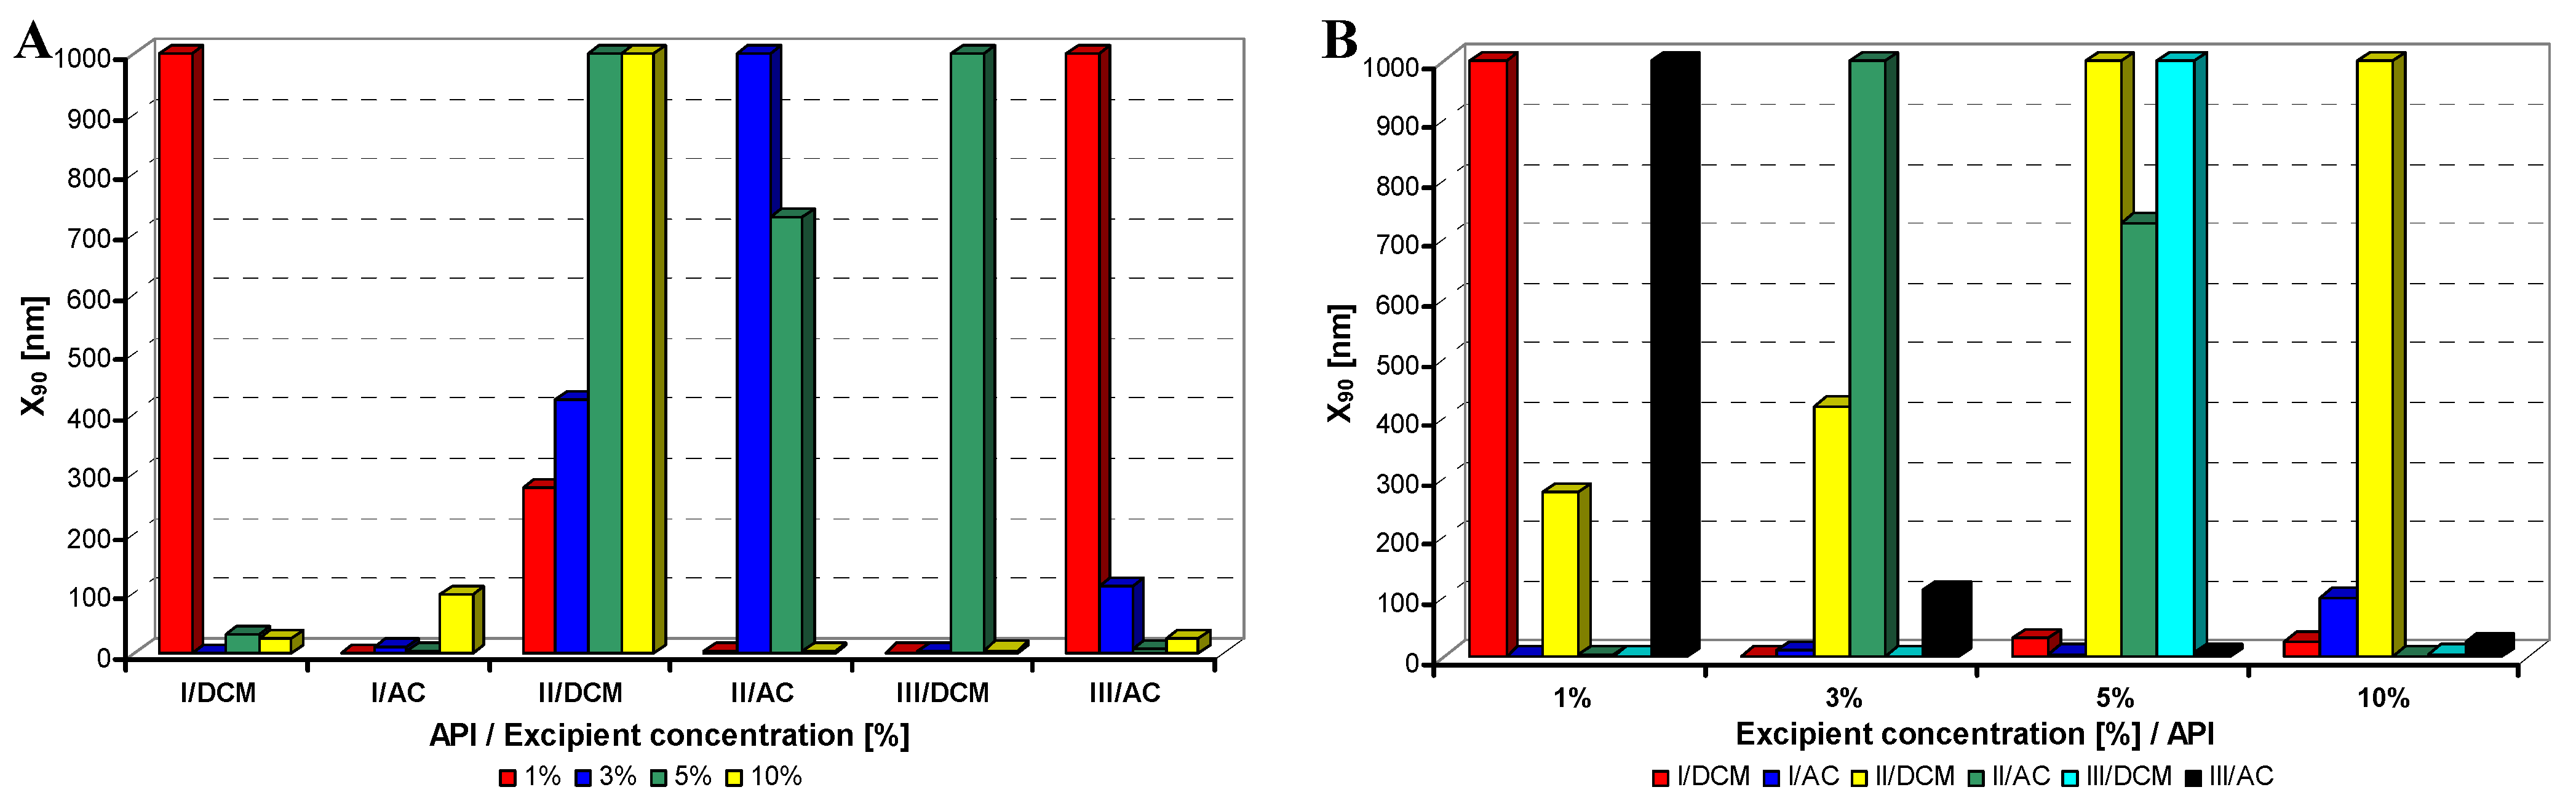
Figure 5.
Dependence of particle size (x90 [nm]) of model APIs I–III on concentration [%] of sodium carboxymethyl cellulose in dichloromethane (DCM) or acetone (AC). (A) Samples are grouped according to APIs; (B) samples are grouped according to excipient percentage. For clarity sake, the values on y-axis are only to 1,000 nm.
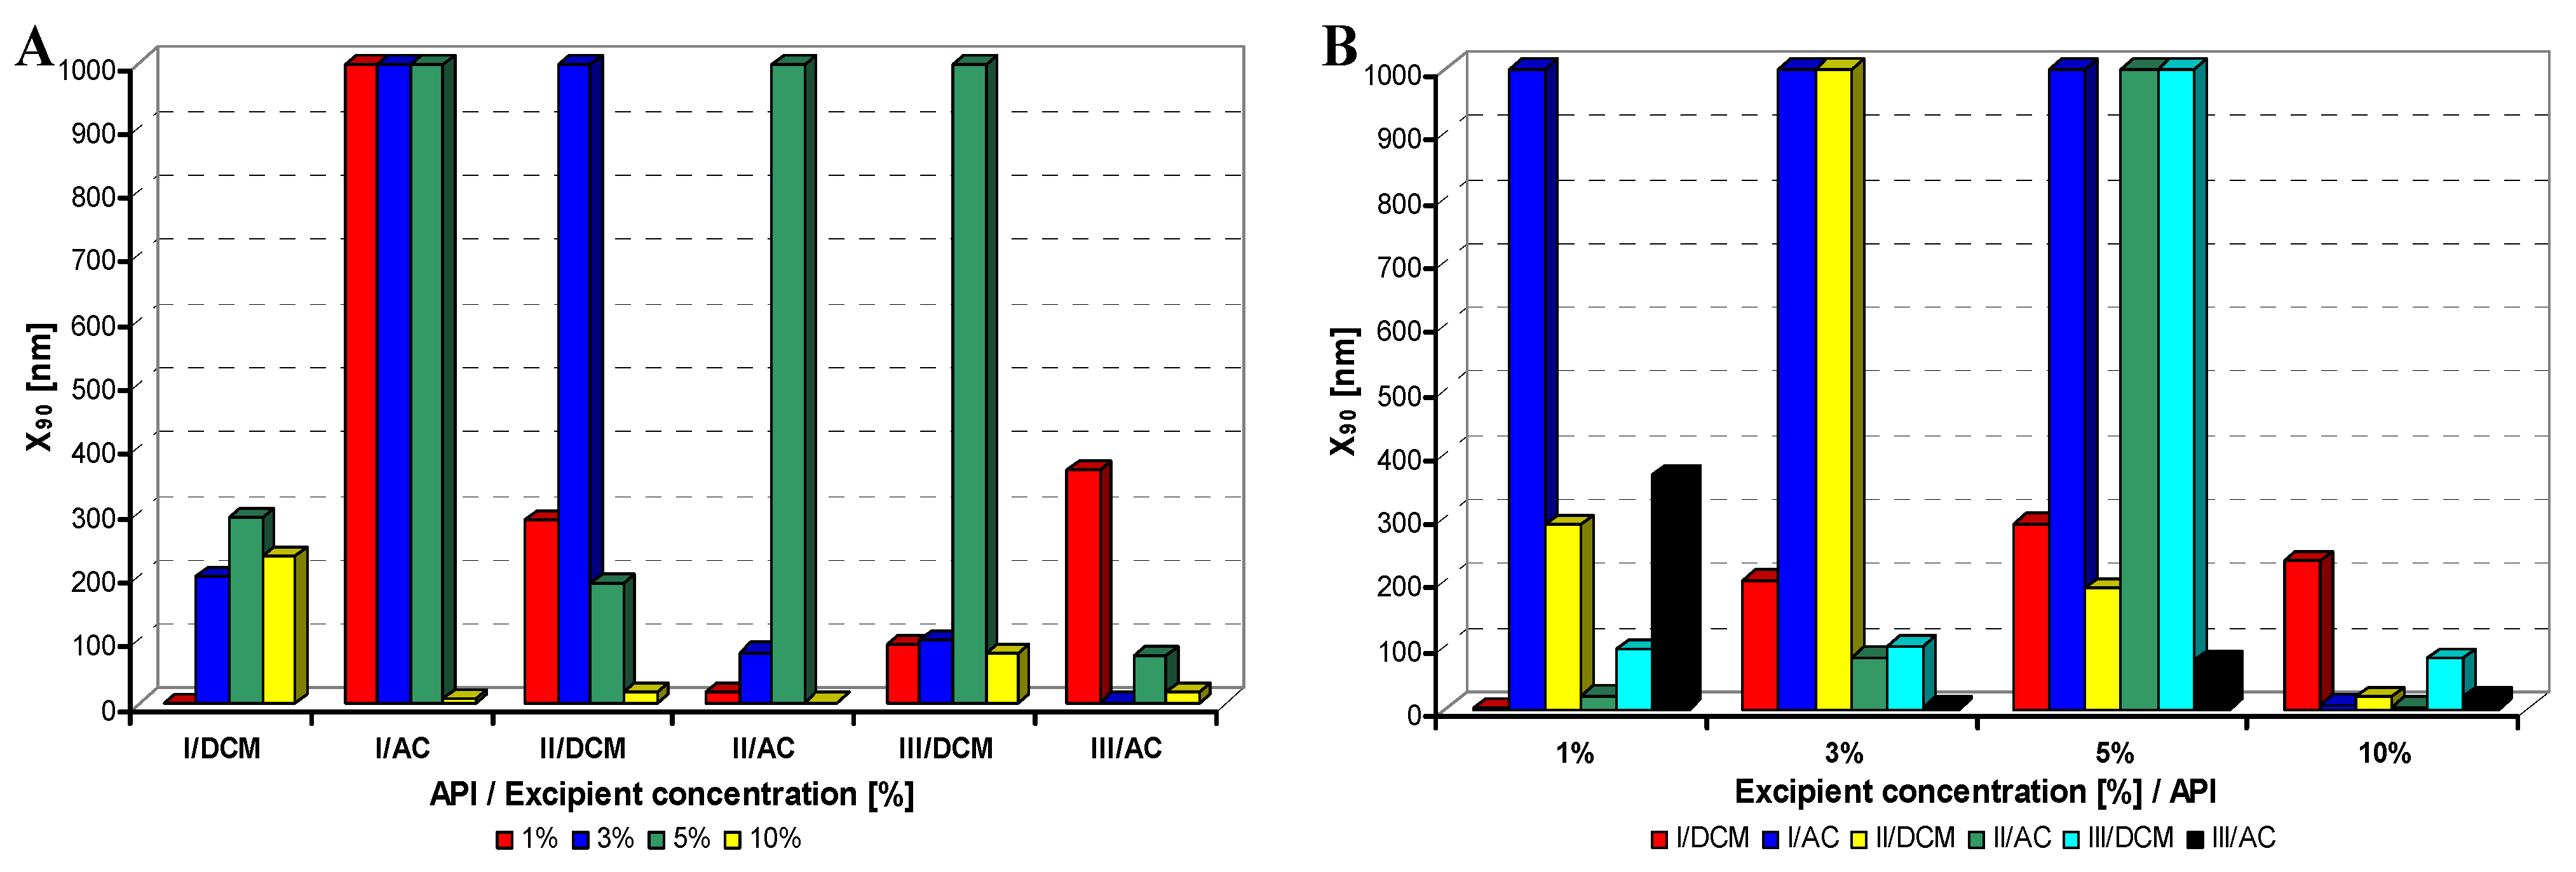
Figure 6.
Dependence of particle size (x90 [nm]) of model APIs I–III on concentration [%] of sodium carboxymethyl dextran in dichloromethane (DCM) or acetone (AC). (A) Samples are grouped according to APIs; (B) samples are grouped according to excipient percentage. For clarity sake, the values on y-axis are only to 1,000 nm.
Generally it can be stated that macrogol provided mostly nanoparticles, and sodium dodecyl sulfate as well as sodium carboxymethyl cellulose afforded most of nanoparticles under 200 nm; the latter yielded most of nanoparticles less than 10 nm.
Table 6 summarizes results of all the samples of nanoparticles under 900 nm size depending on solvents and the type and amount of excipients. As the aim of this contribution is specification of suitable conditions for nanoparticles preparation, in
Table 6 generated nanoparticles are not divided according to used APIs.
Table 6.
View of formed samples of nanoparticles (≤900 nm) depending on solvents and type and amount of excipients. (conc. = concentration, excp. = excipient, dichloromethane = DCM, acetone = AC, Tween 80 = TW, sodium dodecyl sulfate = SDS, macrogol 6000 = PEG, sodium carboxymethyl cellulose = SCMC, sodium carboxymethyl dextran = SCMD).
| Excp. conc./type | DCM | Sum total | Overall average x90[nm] | AC | Sum total | Overall average x90[nm] |
| 1% | 3% | 5% | 10% | 1% | 3% | 5% | 10% |
| number of nanop. samples | number of nanop. samples |
| TW | 3 | 2 | 2 | 3 | 10 | 149 | 2 | 2 | 1 | 3 | 8 | 72 |
| SDS | 2 | 3 | 3 | 3 | 11 | 90 | 2 | 3 | 3 | 2 | 10 | 106 |
| PEG | 3 | 3 | 3 | 3 | 12 | 193 | 2 | 3 | 3 | 3 | 11 | 42 |
| SCMC | 3 | 2 | 3 | 2 | 10 | 96 | 3 | 2 | 2 | 3 | 10 | 73 |
| SCMD | 2 | 3 | 1 | 2 | 8 | 95 | 2 | 2 | 3 | 3 | 10 | 99 |
| Sum total | 13 | 13 | 12 | 13 | 51 | 623 | 11 | 12 | 12 | 14 | 49 | 392 |
| Overall average | 136 | 123 | 106 | 145 | 510 | 125 | 104 | 68 | 103 | 45 | 320 | 78 |
| 127 | 80 |
In
Table 6 results of all the determined nanoparticles are listed. Based on these results it can be stated that acetone as polar solvent is more advantageous for nanoparticle generation in case of Tween, macrogol and sodium carboxymethyl cellulose (significantly less nanoparticle size average (calculated using x
90): 72, 42, 73 nm compared with DCM and approximately the same number of nanoparticle samples). In case of sodium carboxymethyl dextran the number of nanoparticle samples and their nanoparticle size were approximately the same as when using acetone and dichloromethane (10-99/8-95). Dichloromethane seems to be more advantageous only in combination with sodium dodecyl sulphate, where smaller nanoparticles were determined (10-106/11-90).
If the influence of excipient concentration in acetone and dichloromethane is considered, it can be stated that generally 10% and 3% concentrations of excipient in acetone,
i.e., API:excipient ratio 1:5 and 1:1.5, or 5% and 3% concentrations of excipient in dichloromethane,
i.e., API:excipient ratio 1:2.5 and 1:1.5, seem to be the most advantageous for maximum number of nanoparticle samples with the smallest nanoparticle size, see
Table 6 and
Figure 2B–
Figure 6B. If amounts of excipients regardless organic solvents are considered, the most favourable concentrations are the following: sodium dodecyl sulphate 3% (API:excipient ratio 1:1.5) and 5% (API:excipient ratio 1:2.5), sodium carboxymethyl cellulose 5% (API:excipient ratio 1:2.5), Tween and sodium carboxymethyl dextran 10% (API:excipient ratio 1: 5) and macrogol 3–10% (API:excipient ratios 1:1.5–5).
Based on the above discussed facts it can be concluded that macrogol 6000, sodium dodecyl sulphate or sodium carboxymethyl cellulose can be used as effective nanoparticle-stabilizing agents in API:excipient ratios 1:1.5, 1:2.5, 1:5. The polar solvent acetone is preferable to nonpolar dichloromethane, probably due to the fact that acetone has higher boiling point (b.p. 56 °C) than dichloromethane (b.p. 39 °C) and it evaporates more slowly in comparison with dichloromethane (dynamically and/or kinetically controlled precipitation). During slow evaporation of organic solvent formed API particles could be more effectively stabilized by excipients in nanoparticle size (dynamic process of nanoparticles generation). Results with APIs dissolved in acetone provided the number of nanoparticle samples comparable with dichloromethane (49/51), but the particle size of APIs dissolved in acetone was smaller than that of APIs dissolved in dichloromethane by third (392/623).


