2. Results and Discussion
The EtOH extract of Moutan Cortex (1.0 kg) was partitioned between EtOAc and H
2O, and then the H
2O-layer was partitioned with
n-BuOH. The
n-BuOH layer was separated by column chromatography on silica gel and ODS, and using HPLC to give two new monoterpene diglycosides, suffruyabiosides A (
1, 0.00028%) and B (
2, 0.00013%), together with seven known compounds
3–
9. The known compounds
3–
9 were identified as paeoniflorin (
3) [
3], salicylpaeoniflorin (
4) [
7], oxypaeoniflorin (
5) [
8,
9], mudanpioside E (
6) [
10], mudanpioside D (
7) [
10], galloylpaeoniflorin (
8) [
2,
9], and mudanpioside I (
9) [
11].
The molecular formula of suffruyabioside A (
1) was assigned as C
36H
42O
18 by HRESIMS [
m/z 785.2212 (M+Na)
+, Δ −5.7 mmu]. The IR spectrum indicated the presence of hydroxyl (3412 cm
−1) and ester (1729 cm
−1) moieties. The
1H- and
13C-NMR spectra of
1 (
Table 1) revealed signals assignable to a monoterpene pinane type skeleton similar to that of paeoniflorin (
3) [
12] with signals for three methylenes at δ
H 2.21 (1H, d,
J = 13.0 Hz, H-3), 1.73 (1H, d,
J = 13.0 Hz, H-3), 1.73 (1H, brd,
J = 12.3 Hz, H-7), 2.50 (1H, m, H-7), and 4.87 (2H, s, H-8), two methines at δ
H 2.52 (1H, m, H-5) and 5.40 (1H, s, H-9), and one methyl at δ
H 1.25 (3H, s, H-10). HMBC correlations (
Table 1,
Figure 1 and
Figure 2) of H-5, H-7, H-8, H-9, and H-10 to C-1 (δ
C 90.1), H-7, H-9, and H-10 to C-2 (δ
C 88.8), H-10 to C-3 (δ
C 44.7), H-3, H-5, and H-7 to C-4 (δ
C 106.1), H-3 to C-5 (δ
C 41.1), H-8 to C-6 (δ
C 72.5), H-5 to C-7 (δ
C 27.1), and H-8 to C-9 (δ
C 103.0) revealed the presence of a pinane type skeleton. The
1H-
1H COSY connectivities of H-1"' to H-2"', H-5"' to H-6"', H-1"" to H-2"", and H-4"" to H-6"" and HMBC correlations of H-2"' to C-4"' (δ
C 82.1), H-4"' to C-2"' (δ
C 75.4), H-5"' to C-3"' (δ
C 78.7), H-1"", H-4"", and H-5"" to C-3"" (δ
C 72.4), and H-2"" and H-6"" to C-4"" (δ
C 74.7) implied the presence of two sugar moieties. NOESY correlations of H-1"' to H-3"', H-1"' to H-5"', H-1"" to H-3"", H-1"" to H-5"", and H-2"" to H-4"" and two anomeric proton signals of H-1"' and H-1"" observed a doublet at δ
H 4.64 (1H,
J = 7.8 Hz) and 4.44 (1H,
J = 7.8 Hz), suggesting the presence of two β-glucose moieties. Moreover the presence of benzoyl and
p-hydroxybenzoyl groups was revealed by the
1H-
1H COSY connectivities of H-2' to H-6', H-2" to H-3", and H-5" to H-6" and HMBC correlations of H-2' and H-6' to C-4' (δ
C 135.3) and C-7' (δ
C 168.3), H-3" and H-5" to C-1" (δ
C 120.0), and H-2" and H-6" to C-7" (δ
C 168.8) and C-4" (δ
C 163.6). HMBC correlations of H-8 (δ
H 4.87) to C-7', H-4"' (δ
H 3.64) to C-1"" (δ
C 105.7), and H-6""(δ
H 4.86) to C-7" (δ
C 168.8) revealed that the benzoyl group was attached to C-8 (δ
C 63.8) by the ester linkage, the first sugar was linked to C-1"' (δ
C 100.6) with the other sugar attached to C-4"' (δ
C 82.1) by ether linkages, and the
p-hydroxybenzoyl group was connected to C-6"" (δ
C 65.4) of the other sugar through an ester linkage.
Table 1.
13C- and 1H-NMR data of suffruyabiosides A (1) and B (2) in CD3OD.
Table 1.
13C- and 1H-NMR data of suffruyabiosides A (1) and B (2) in CD3OD.
| | Suffruyabioside A (1) | | Suffruyabioside B (2) |
|---|
| | δC | δH, J in Hz | HMBC a | | δC | δH, J in Hz | HMBC a |
|---|
| 1 | 90.1, C | - | | | 90.1, C | - | |
| 2 | 88.8, C | - | | | 87.8, C | - | |
| 3 | 44.7, CH2 | 1.73, d, 13.0 | 4, 5 | | 41.4, CH2 | 1.76, d, 13.9 | 2, 5 |
| | | 2.21, d, 13.0 | | | | 2.18, d, 13.9 | |
| 4 | 106.1, C | - | | | 104.0, C | - | |
| 5 | 41.1, CH | 2.52, m | 1, 4, 7 | | 40.7, CH | 2.56, m | 3, 7 |
| 6 | 72.5, C | - | | | 72.5, C | - | |
| 7 | 27.1, CH2 | 1.73, bd, 12.3 | 1, 2, 4 | | 24.2, CH2 | 1.67, d, 9.5 | 1, 2, 5 |
| | | 2.50, m | | | | 2.56, m | |
| 8 | 63.8, CH2 | 4.87, s | 1, 6, 9, 7' | | 62.8, CH2 | 4.80, s | 9, 7' |
| 9 | 103.0, CH | 5.40, s | 1, 2 | | 102.9, CH | 5.50, s | 2 |
| 10 | 22.5, CH3 | 1.25, s | 1, 2, 3 | | 20.4, CH3 | 1.22, s | 1, 2, 3 |
| 1' | 131.1, C | - | | | 132.1, C | - | |
| 2' | 130.7, CH | 8.08, dt, 7.8, 1.2 | 3', 4', 6', 7' | | 131.5, CH | 8.09, dt, 7.6, 1.4 | 1', 3', 4', 7' |
| 3' | 130.6, CH | 7.53, t, 7.8 | 1', 2', 5' | | 130.6, CH | 7.54, t, 7.6 | 2', 4' |
| 4' | 135.3, CH | 7.64, tt, 7.4, 1.2 | 2', 3', 5', 6' | | 135.3, CH | 7.66, tt, 7.6, 1.4 | 3', 5' |
| 5' | 130.6, CH | 7.53, t, 7.8 | 1', 2', 3' | | 130.6, CH | 7.54, t, 7.6 | 4', 6' |
| 6' | 130.7, CH | 8.08, dt, 7.8, 1.2 | 2', 3', 4', 7' | | 131.5, CH | 8.09, dt, 7.6, 1.4 | 1', 4', 5', 7' |
| 7' | 168.3, C | - | | | 168.3, C | - | |
| 1" | 120.0,C | - | | | 132.0,C | - | |
| 2" | 133.8, CH | 7.93, dd, 8.8, 1.9 | 4", 6", 7" | | 131.4, CH | 8.07, dt, 8.3, 1.3 | 1", 3", 4", 7" |
| 3" | 112.0, CH | 6.86, dd, 8.8, 1.9 | 1", 5" | | 130.4, CH | 7.51, t, 8.3 | 2", 4" |
| 4" | 163.6, C | - | | | 135.2, CH | 7.65, tt, 8.3, 1.3 | 3", 5" |
| 5" | 112.0, CH | 6.86, dd, 8.8, 1.9 | 1", 3" | | 130.4, CH | 7.51, t, 8.3 | 4", 6" |
| 6" | 133.8, CH | 7.93, dd, 8.8, 1.9 | 2", 4", 7" | | 131.4, CH | 8.07, dt, 8.3, 1.3 | 1", 4", 5", 7" |
| 7" | 168.8, C | - | | | 168.8, C | - | |
| 1"' | 100.6, CH | 4.64, d, 7.8 | 1, 5"' | | 100.6, CH | 4.65, d, 7.8 | 1, 5"' |
| 2"' | 75.4, CH | 3.34, m | 4"' | | 75.5, CH | 3.35, m | 4"' |
| 3"' | 78.7, CH | 3.35, m | 1"', 5"' | | 79.1, CH | 3.30, m | 1"', 5"' |
| 4"' | 82.1, CH | 3.64, m | 2"', 1"" | | 82.2, CH | 3.64, m | 2"', 1"" |
| 5"' | 77.1, CH | 3.39, m | 3"' | | 77.1, CH | 3.39, m | 3"' |
| 6"' | 63.3, CH2 | 3.69, dd, 11.9, 5.7 | 5"' | | 63.3, CH2 | 3.70, dd, 12.0, 6.3 | 5"' |
| | | 3.93, dd, 11.9, 2.0 | 5"' | | | 3.93, dd, 12.0, 2.0 | 4"' |
| 1"" | 105.7, CH | 4.44, d, 7.8 | 3"" | | 105.7, CH | 4.44, d, 7.8 | 3"" |
| 2"" | 75.6, CH | 3.38, m | 1"", 4"" | | 75.6, CH | 3.40, m | 4"" |
| 3"" | 72.4, CH | 3.33, m | 1"", 5"" | | 72.8, CH | 3.30, m | 1"", 5"" |
| 4"" | 74.7, CH | 3.68, m | 2"", 3"" | | 74.7, CH | 3.60, m | 2"", 3"" |
| 5"" | 78.7, CH | 3.86, m | 3"" | | 78.7, CH | 3.81, m | 3"" |
| 6"" | 65.4, CH2 | 4.65, dd, 12.8, 5.1 | | | 65.4, CH2 | 4.66, dd, 11.9, 3.8 | 7", 4"" |
| | | 4.86, dd, 12.8, 2.0 | 7", 4"" | | | 4.86, dd, 11.9, 2.0 | 7" |
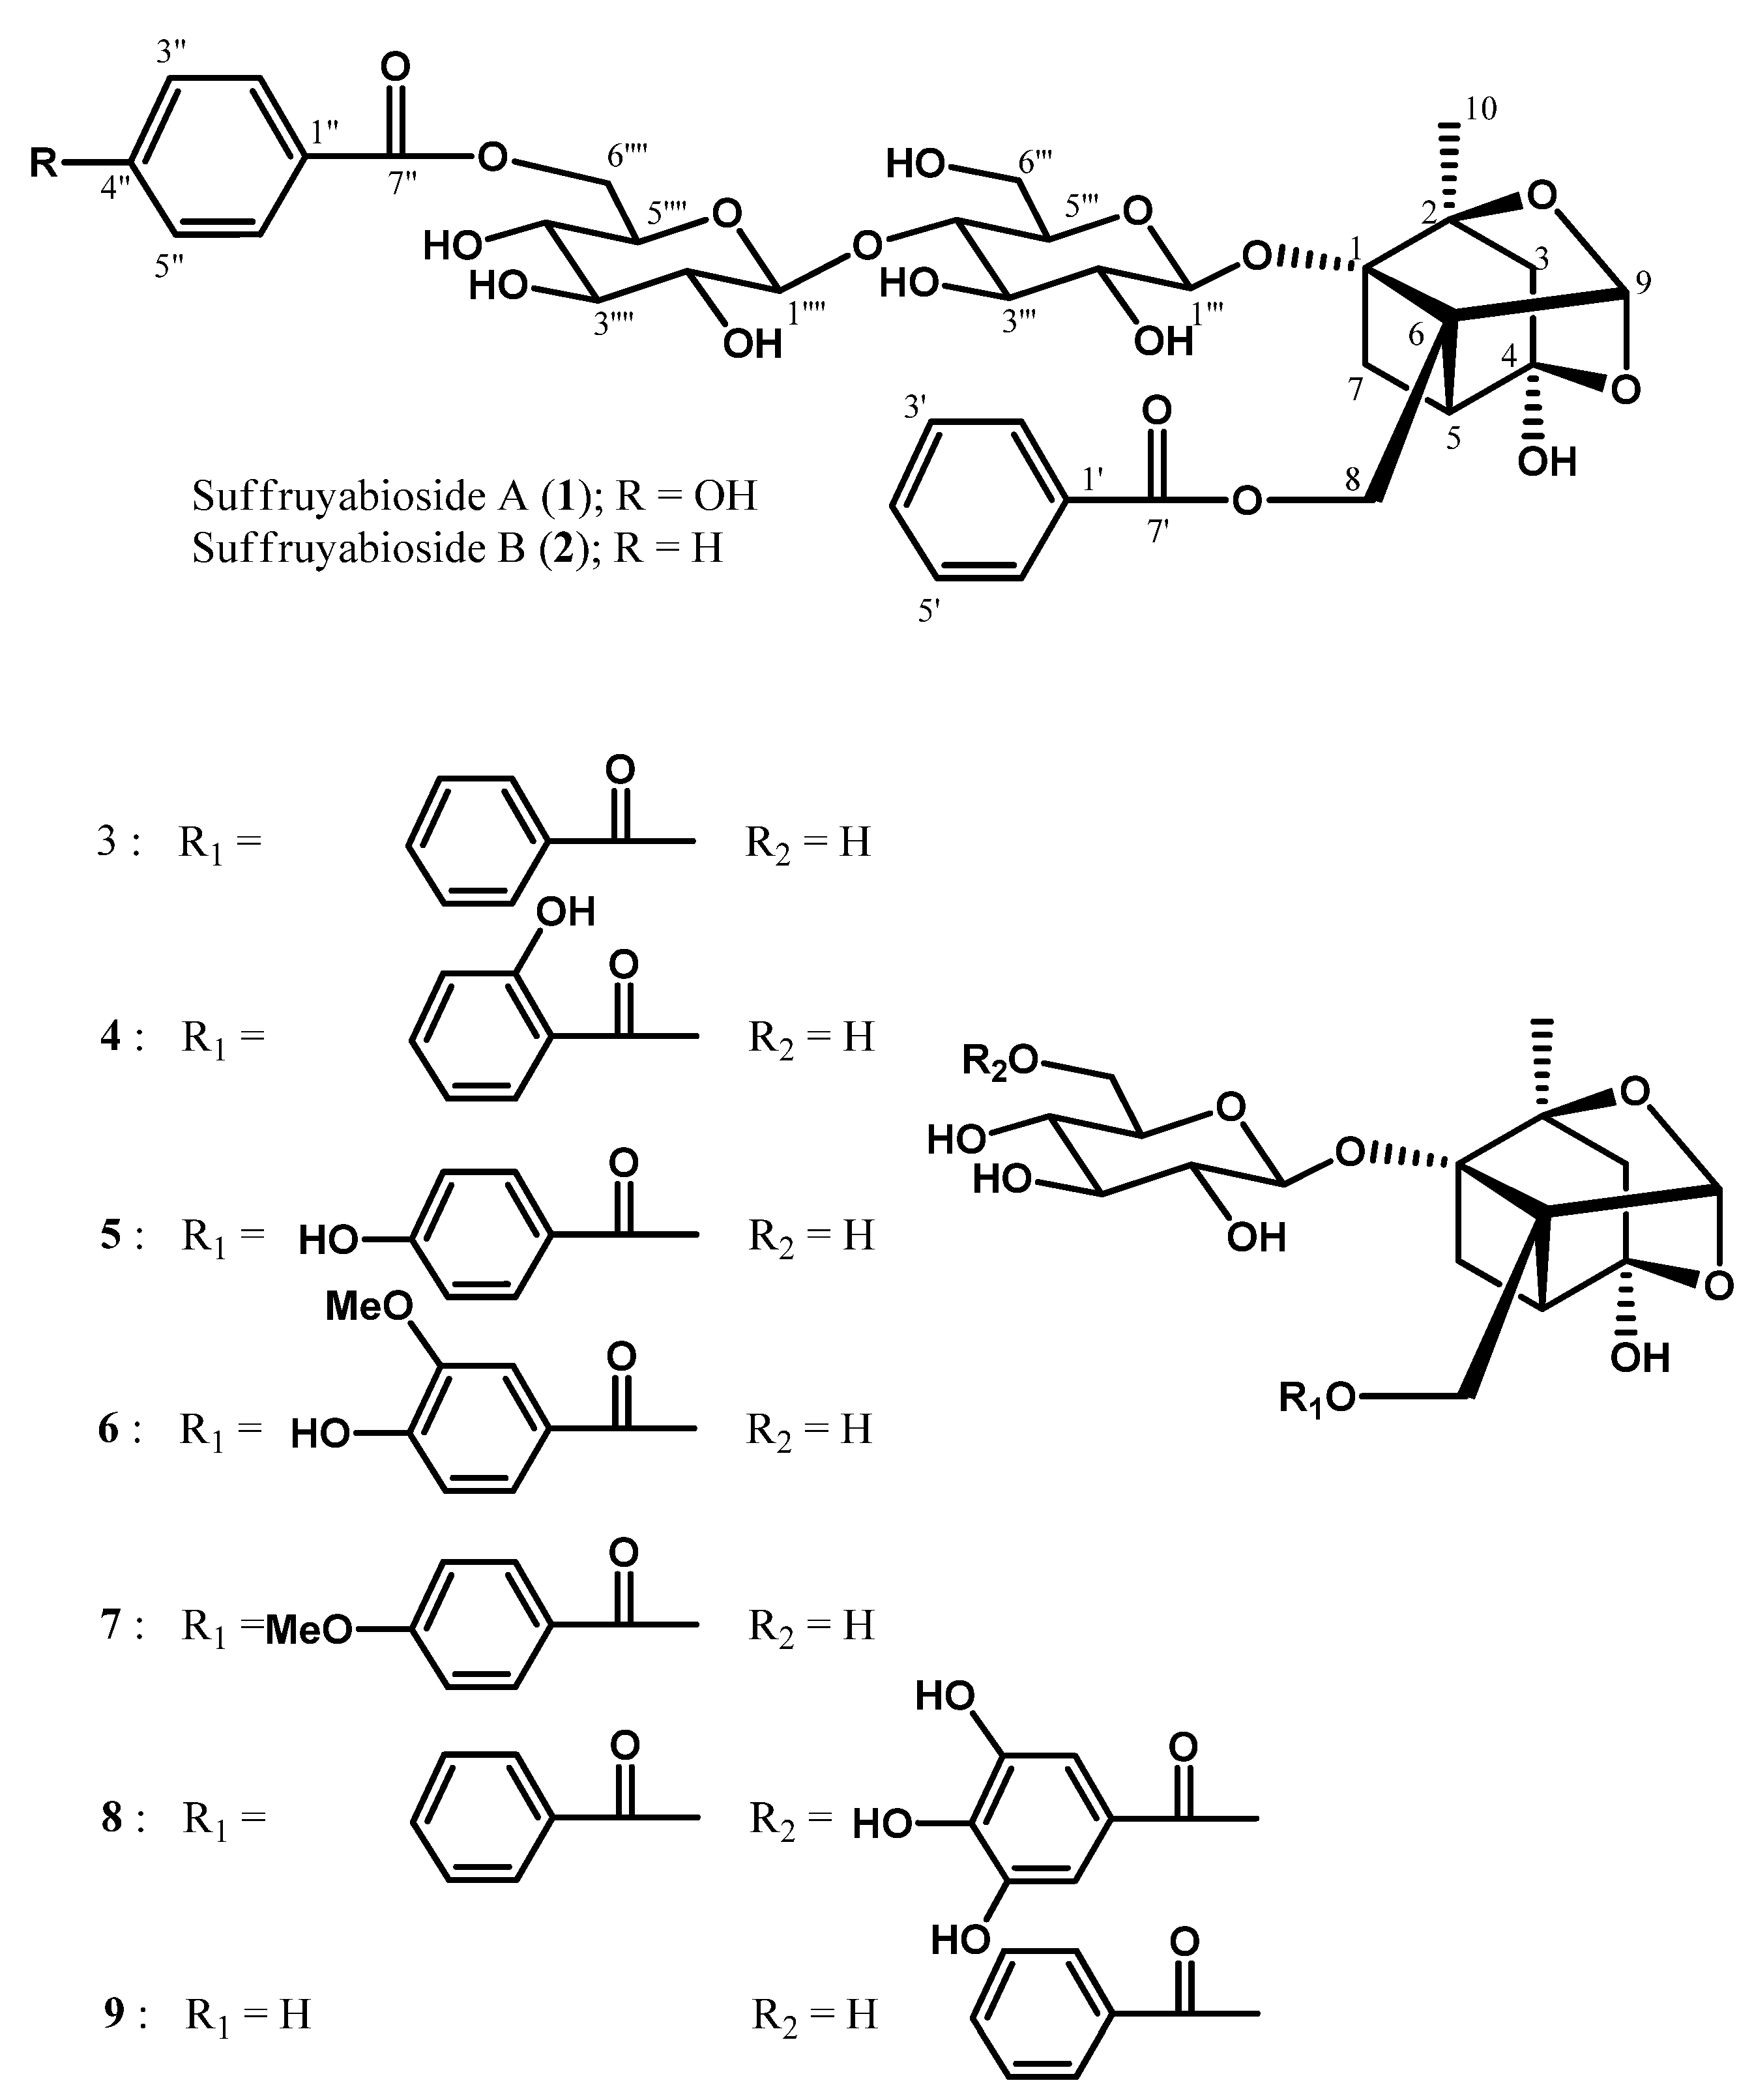
Figure 1.
Structures of suffuruyabiosidesA (1) and B (2), and seven known compounds 3–9.
Figure 1.
Structures of suffuruyabiosidesA (1) and B (2), and seven known compounds 3–9.
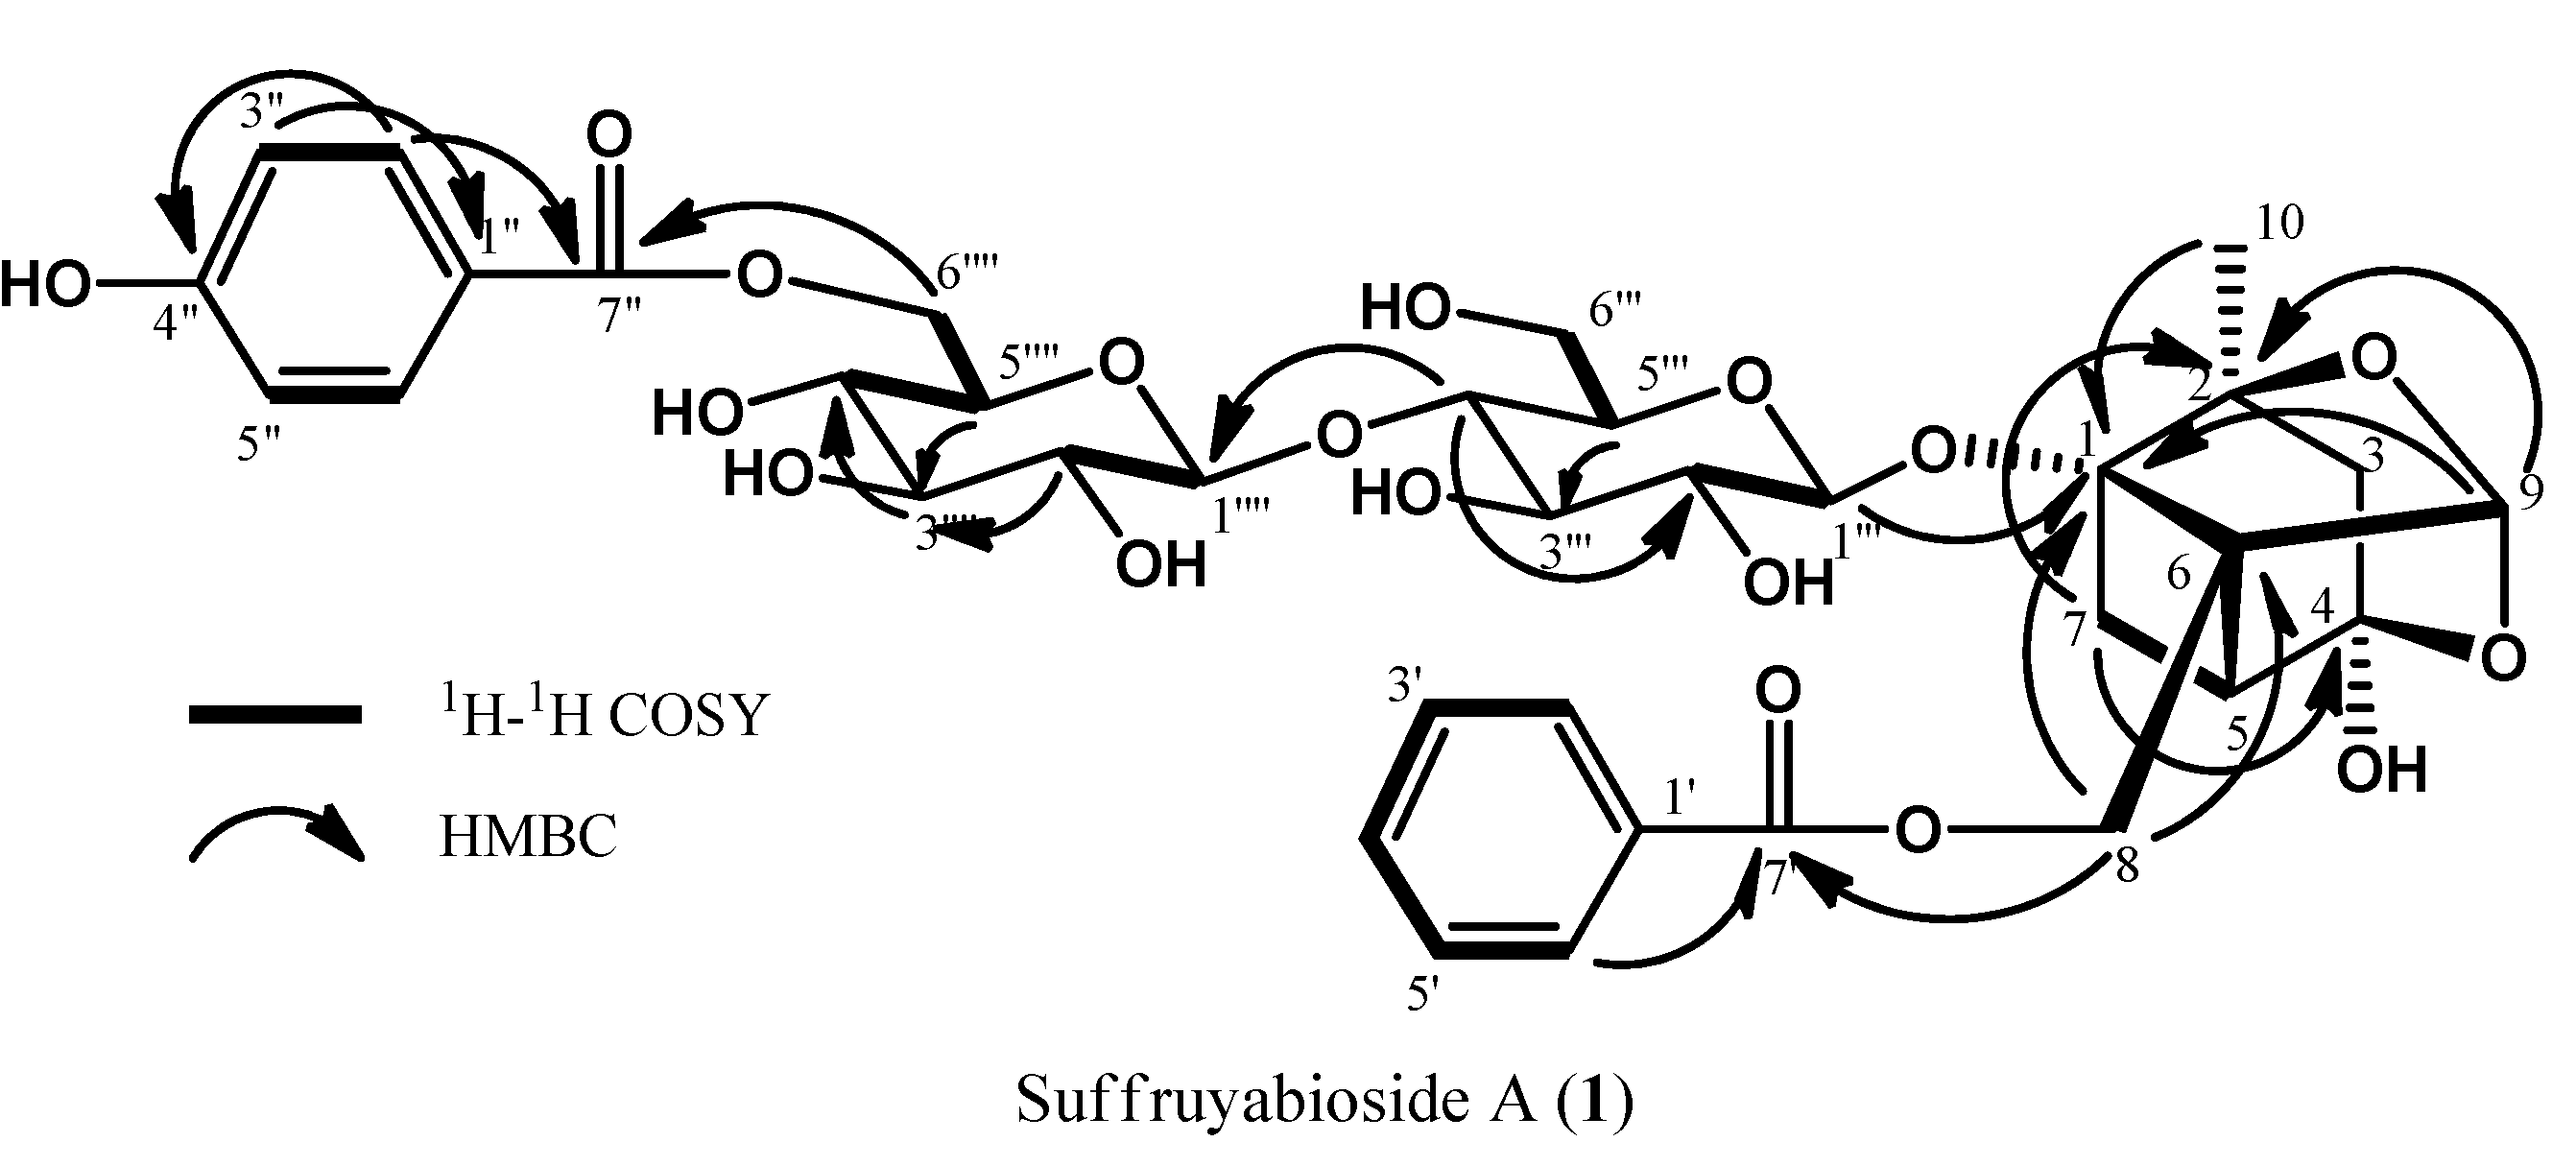
Figure 2.
2D NMR correlations of suffuruyabioside A (1).
Figure 2.
2D NMR correlations of suffuruyabioside A (1).
The stereochemistry at various stereocenters of the monoterpene unit was assigned on the basis of similarity of the reported spectral data [
13]. On the basis of these observations
1 was established as 6""-
O-
p-hydroxybenzoyl-6"'-
O-β-glucopyranosyl- paeoniflorin.
The
1H and
13C-NMR spectra (
Table 1) of suffruyabioside B (
2) also resembled that of paeoniflorin (
3), except for the additional appearance of sugar and benzoyl proton signals. The molecular formula was established as C
36H
42O
17 by HRESIMS data [
m/z 769.2281 (M+Na)
+, Δ−3.9 mmu]. Analysis of the IR spectrum of
2 suggested the presence of hydroxyl (3388 cm
−1) and ester (1711 cm
−1) groups in the molecule. The
1H and
13C-NMR data indicated the presence of the same monoterpene pinane type skeleton as in
3 (
Table 1). The two sugar NMR signals at H-1"' (δ
H 4.65,
J = 7.8 Hz; δ
C 100.6) and H-1"" (δ
H 4.44,
J = 7.8 Hz; δ
C 105.7) and NOESY correlations of H-1"' to H-3"', H-1"' to H-5"', H-1"" to H-3"", and H-1"" to H-5"" revealed the presence of two β-glucose moieties. Furthermore, analysis of the HMBC spectrum (
Table 1) clearly indicated that the anomeric carbon C-1"" (δ
C 105.7) was coupled with H-4"' (δ
H 3.64) through the ether linkage. HMBC correlations of H
2-8 (δ
H 4.80) to C-7' (δ
C 168.3) indicated that the benzoyl group was attached to C-8 (δ
C 62.8) of the aglycone by the ester linkage, while the other benzoyl group was connected to C-6"" (δ
C 65.4) of Glc2 by the ester linkage on the basis of HMBC correlation of H-6"" (δ
H 4.66 and 4.86) to C-7" (δ
C 168.8). Therefore,
2 was identified as 6""-
O-benzoyl-6"' -
O-β-glucopyranosylpaeoniflorin.
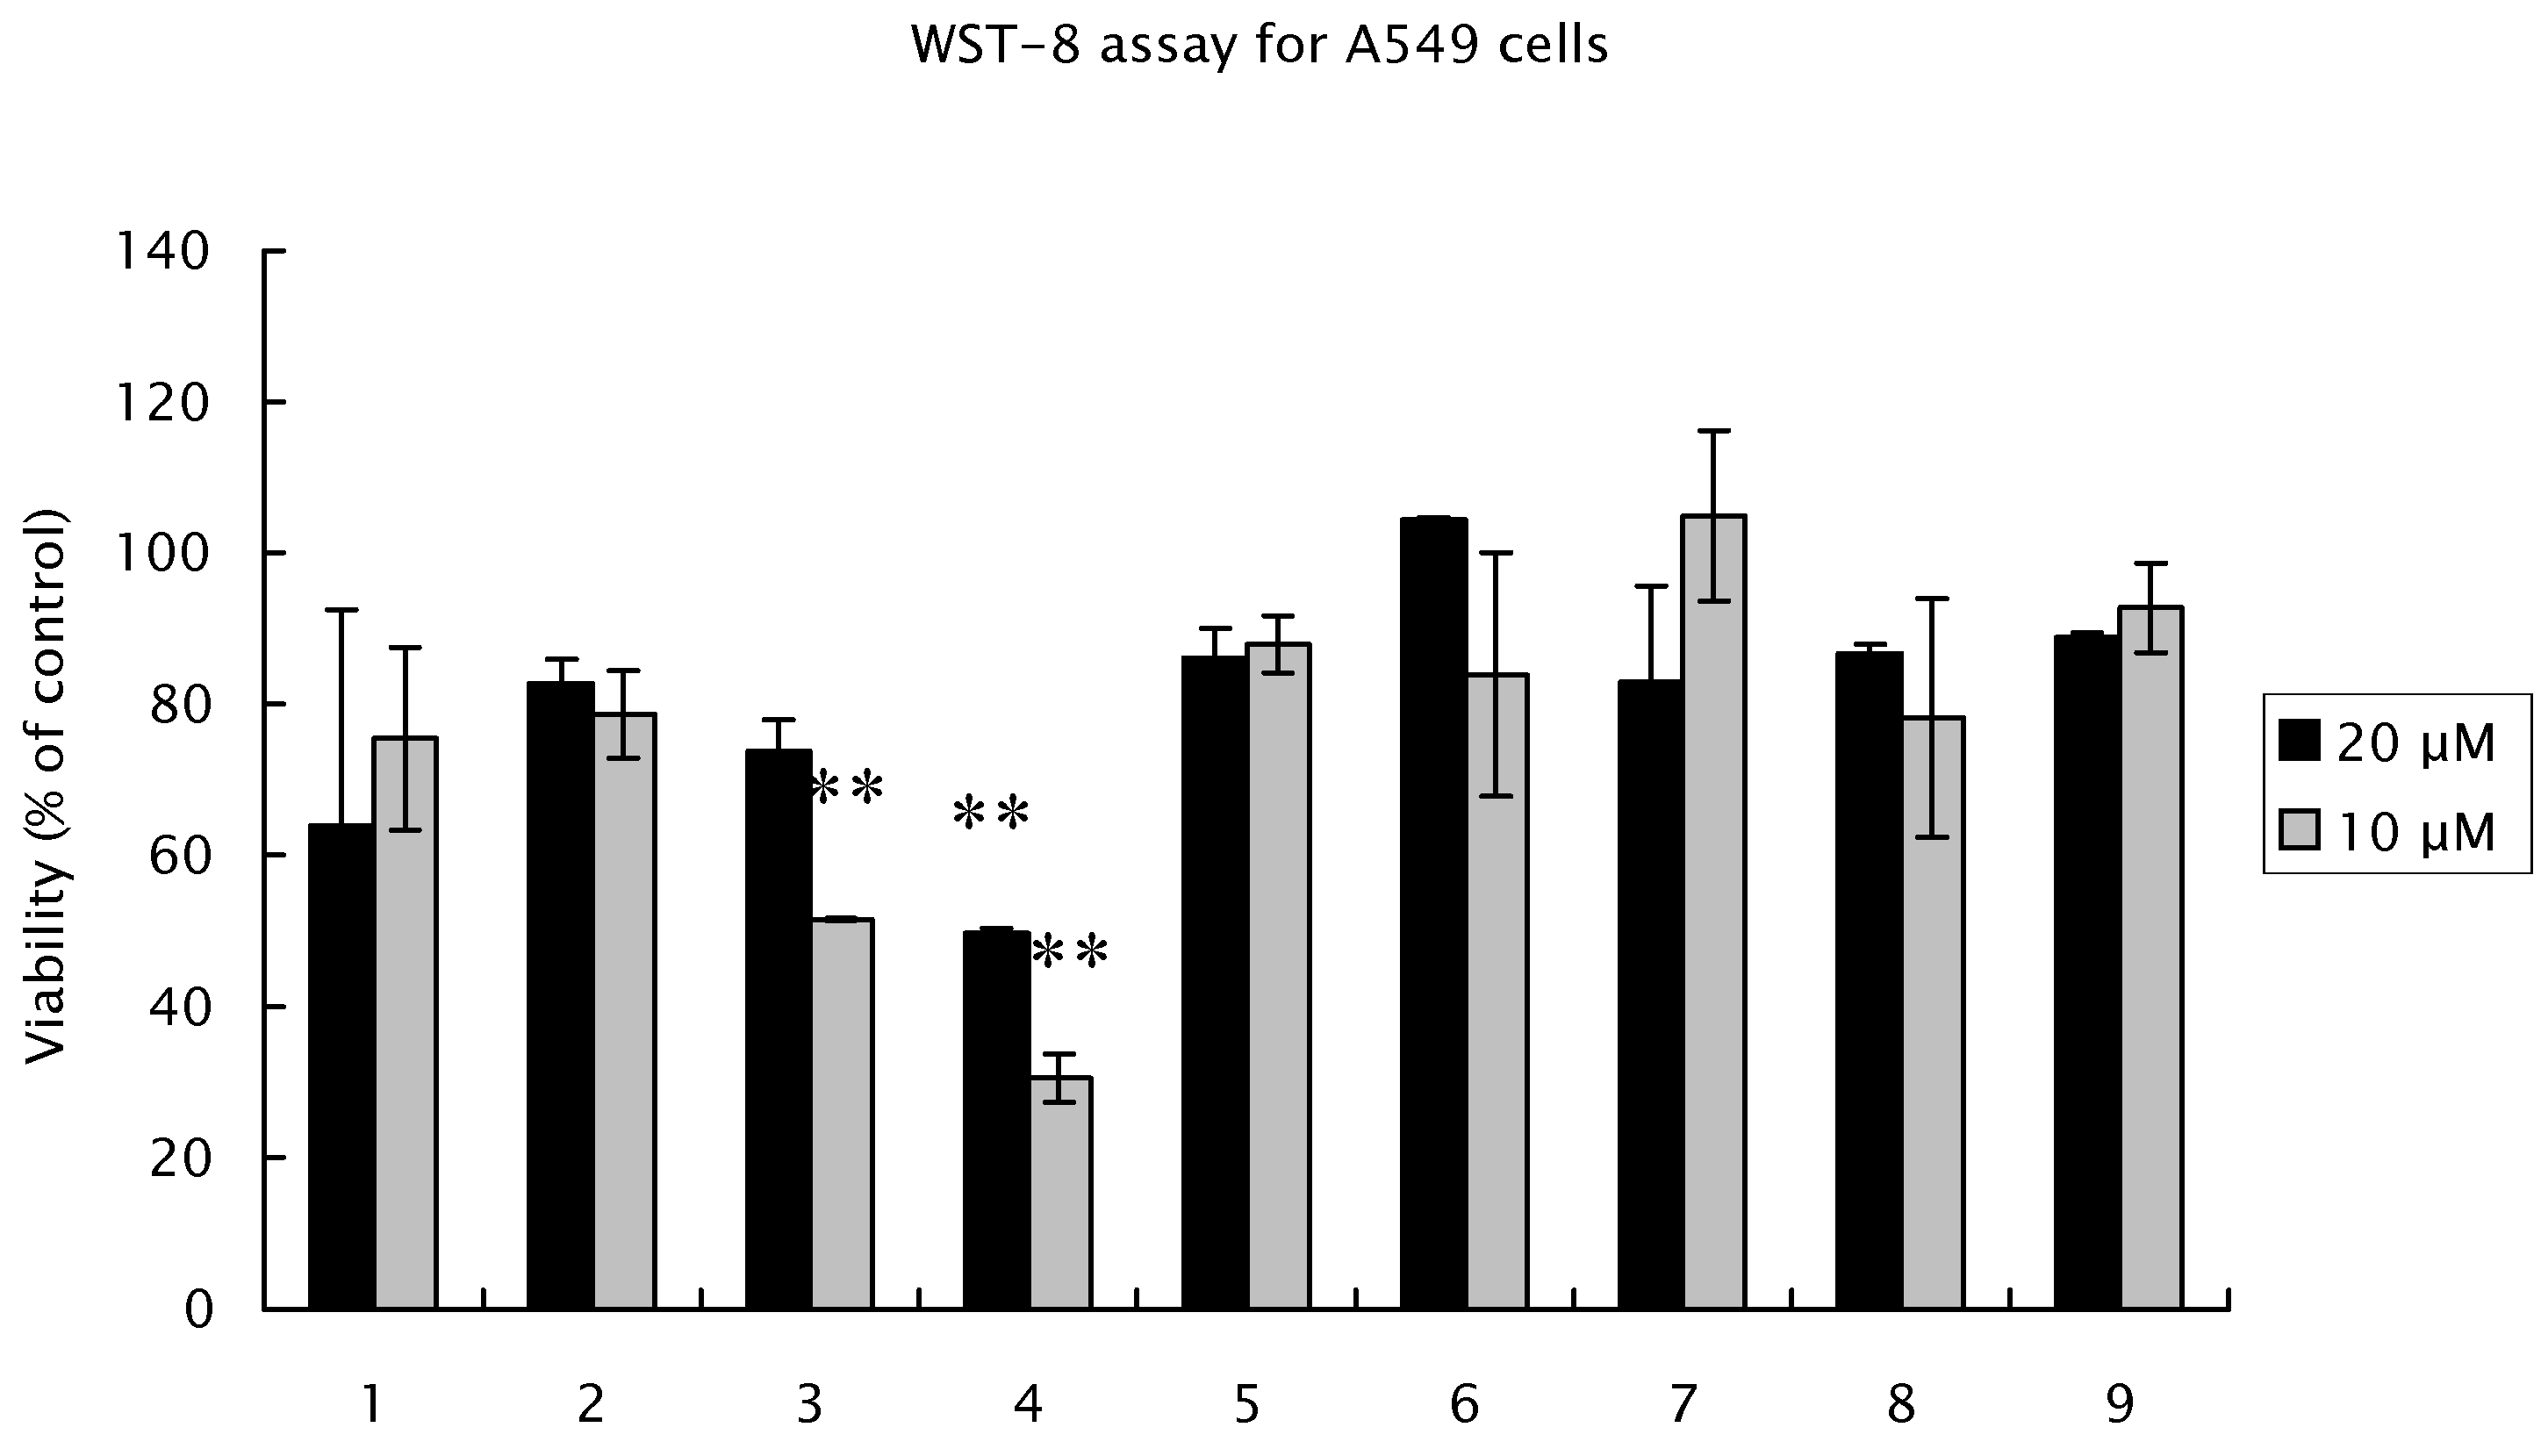
The cytotoxic activities of suffruyabiosides A (
1) and B (
2) and known compounds
3-
9 against human lung adenocarcinoma epithelial A549 cells were assayed (
Figure 3). Salicylpaeoniflorin (
4) and paeoniflorin (
3) showed moderate cytotoxicities (viabilities: 31% and 52%, respectively), while other compounds including suffruyabiosides A (
1) and B (
2), showed very weak activities (viabilities: 63–100%).
Figure 3.
Antiproliferative effects of suffruyabiosidesA (1) and B (2), and known compounds 3-9 for A549 cells. Cells were incubated with different concentration of each compound for 48 h in 96-well plates. Proliferation was measured by WST-8 Assay. Results are expressed as percentage cell proliferation relative to the control group. This assay was repeated two times. Data are the mean ± SD of three determinations. ** significant difference (p < 0.01) vs. control cells. (Dunnett’s test).
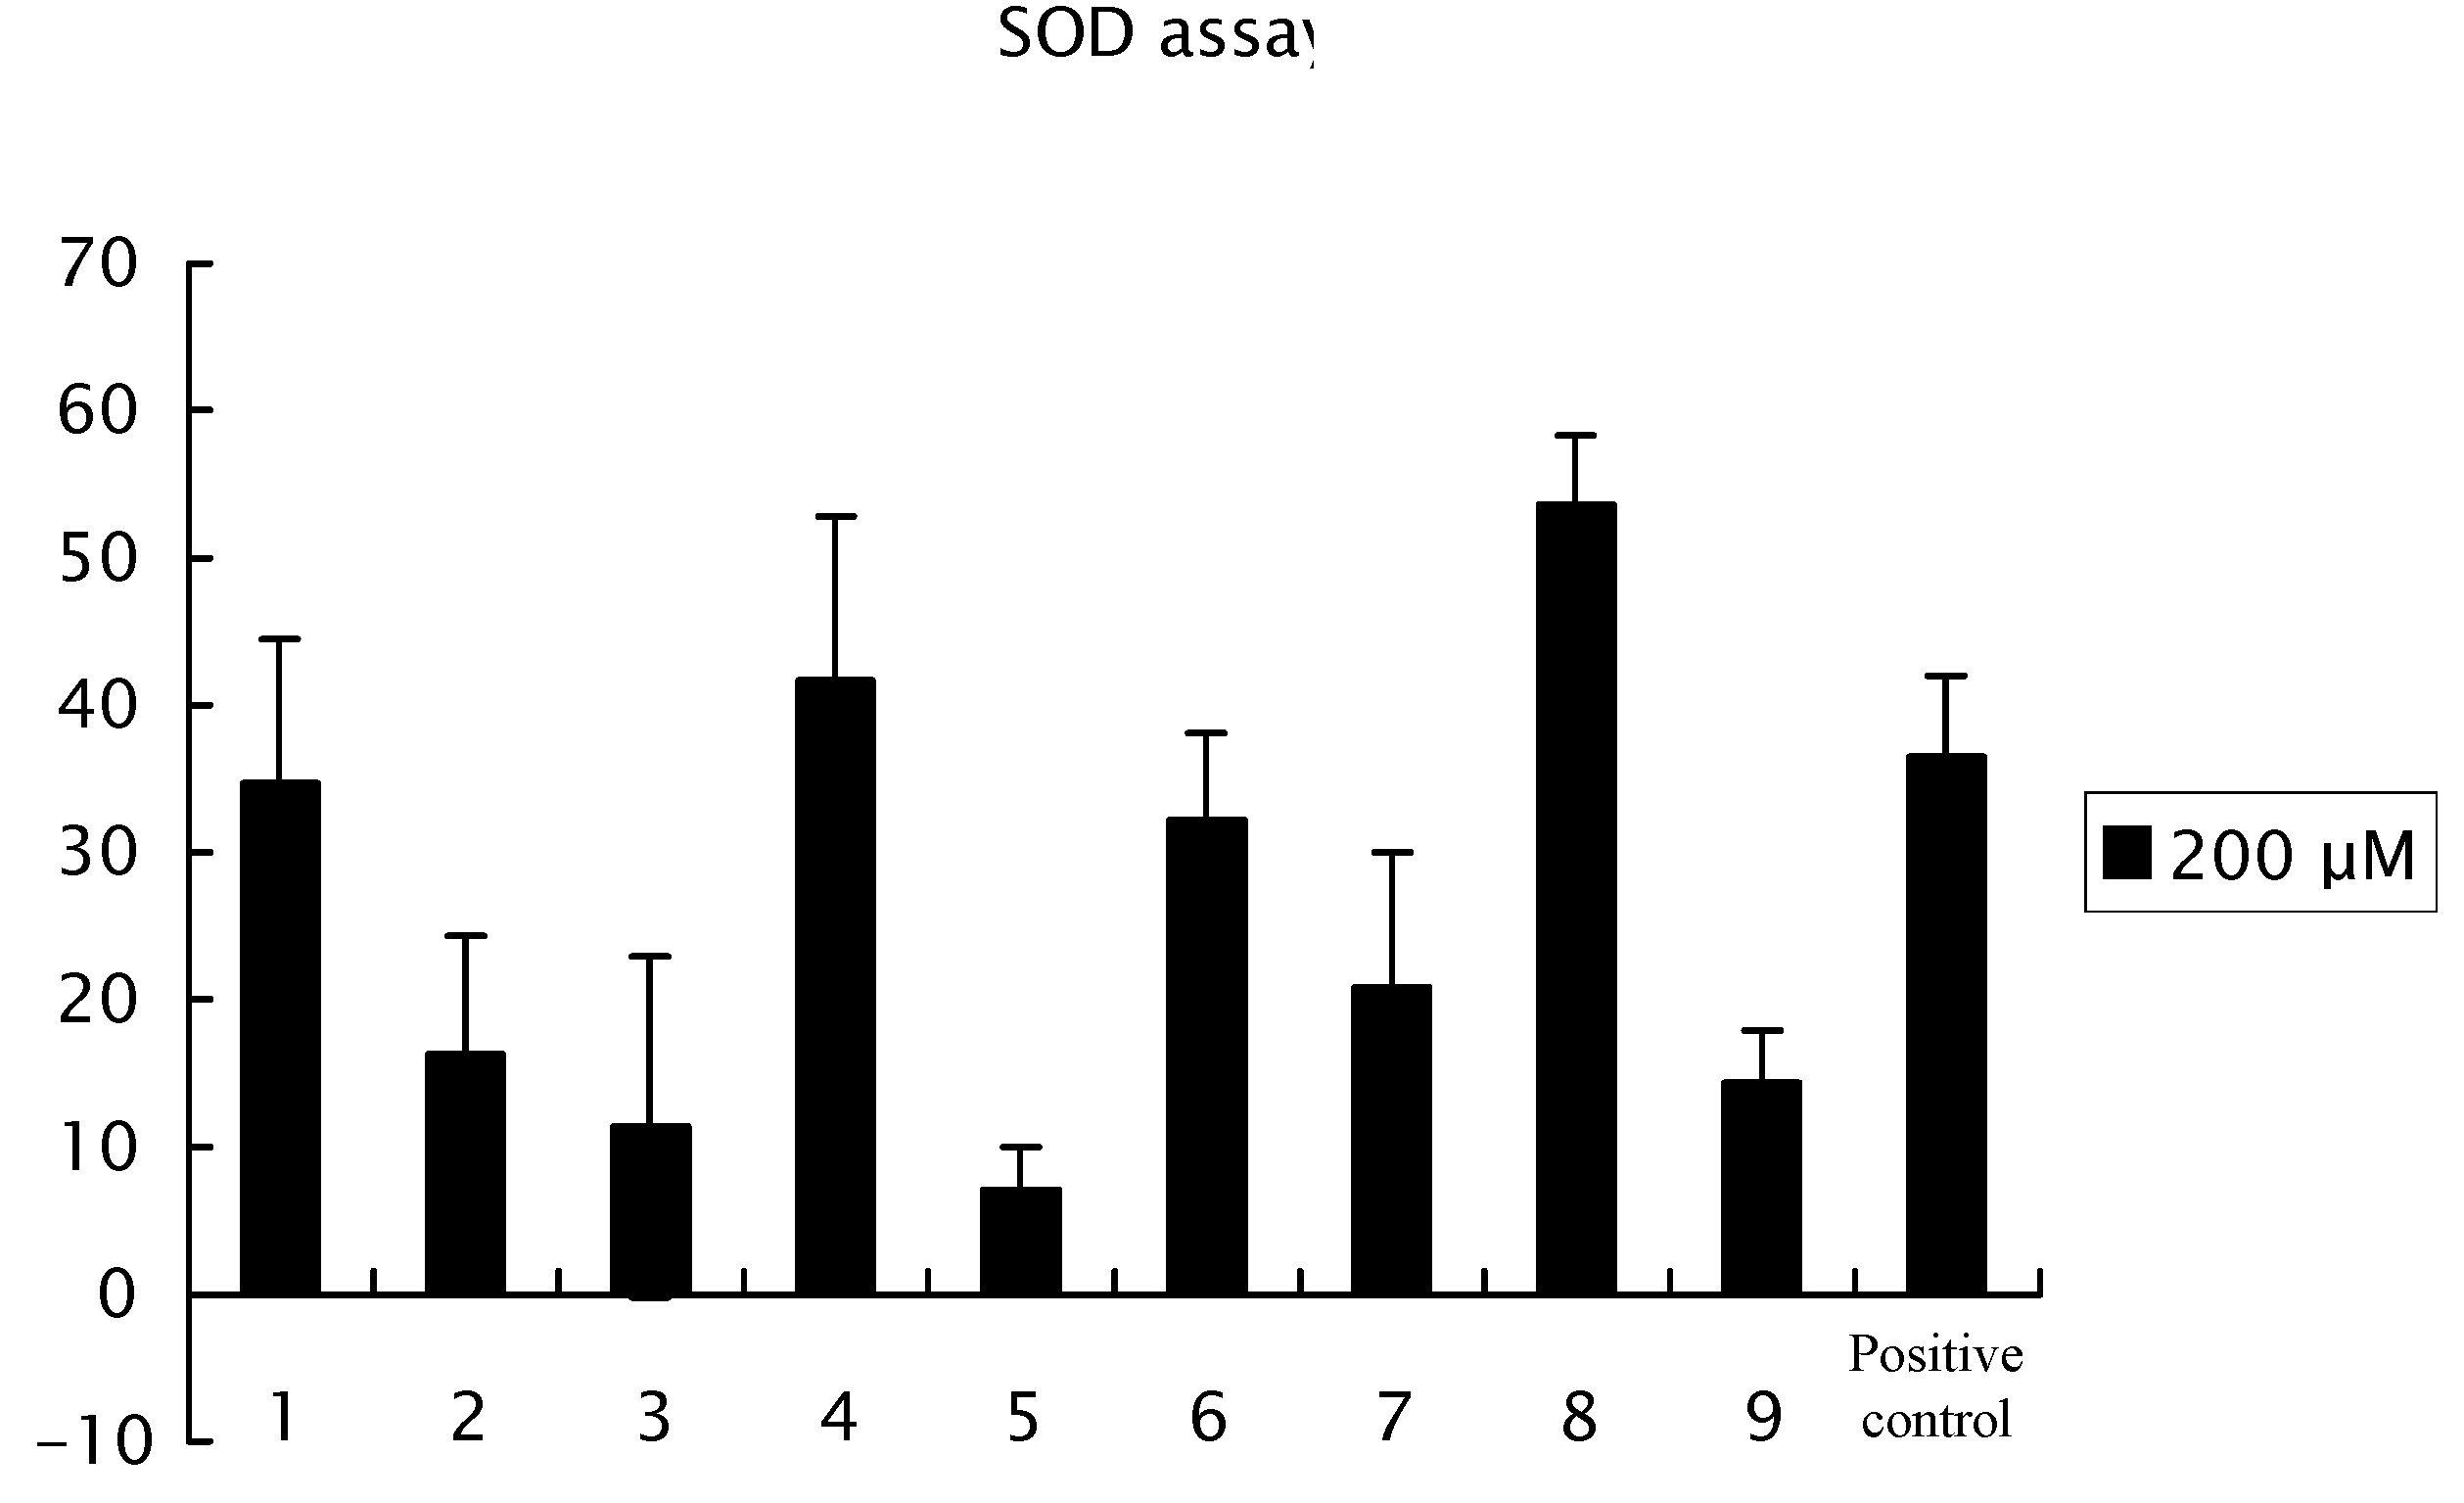
The structure-activity relationships for radical scavenging with isolated compounds
1–
9 are shown in
Figure 4. Galloylpaeoniflorin (
8) was the most effective among the nine compounds
1–
9. Galloylpaeoniflorin (
8) and salicylpaeoniflorin (
4) revealed a more pronounced radical scavenging effect than α-tocopherol (positive control). Increase in the number of phenolic hydroxyl groups produced a more effective of radical scavenging effect (
8 >
6 >
5). Comparing the effect of
4 with
5 showed that
o-substitution with a phenolic hydroxyl group was more effective than
p-substitution. In addition, mudanpioside I (
9) was more effective than paeoniflorin (
3), indicating that a benzoyl group connected to a C-6 of the β-glucose by the ester linkage was more effective for radical scavenging than a benzoyl group attached to the C-8 monoterpene pinane type skeleton.
Figure 4.
Radical scavenging effects of suffruyabiosides A (1) and B (2) and known compounds 3–9. After the incubation of the plate at 37 °C for 20 min, read the absorbance at 450 nm using an ELISA reader. This assay was repeated two times. Data are the mean ± SD of three determinations.
Figure 4.
Radical scavenging effects of suffruyabiosides A (1) and B (2) and known compounds 3–9. After the incubation of the plate at 37 °C for 20 min, read the absorbance at 450 nm using an ELISA reader. This assay was repeated two times. Data are the mean ± SD of three determinations.
In conclusion, two new monoterpene glycosides, suffruyabiosides A (
1) and B (
2) were isolated from Moutan Cortex. It was the first reported as having a cellobiose in paeoniflorin related compounds [
9]. Salicylpaeoniflorin (
4) exhibited both cytotoxic activity against A549 cells and a radical scavenging effect in an SOD assay, suggesting that salicylpaeoniflorin (
4) may be useful as a cytotoxic and a radical scavenging agent.
3. Experimental
3.1. General
Optical rotations were measured with a JASCO DIP-370 polarimeter. IR spectra were recorded on a JASCO FT/IR-300 spectrometer. 1H-NMR (500 MHz) and 13C-NMR (125 MHz) spectra were measured and recorded in CD3OD on a Bruker Avance 500 spectrometer. Chemical shift values (δ) were reported in parts per million (ppm) relative to CD3OD (δH 3.35, δC 49.8). HRESIMS were recorded on Waters Xevo Q-Tof.
3.2. Plant Material
Moutan Cortex (the roots cortex of Paeonia suffruticosa Andrews.) was purchased from Beijing Tong Ren Tang Group Co., Ltd. in November 2007, which was collected from Anhui Province in China and dried by sunlight. This sample was paeoniaceae plant peony root bark, and the root was removed the wooden heart, washed, sliced, and dried. A voucher specimen has been deposited at the Graduate School of Life and Environmental Sciences, University of Tsukuba, Tsukuba, Japan.
3.3. Extraction and Isolation
Moutan Cortex (1.0 kg) was crushed with homogenizer and extracted three times with EtOH (2L × 3) overnight at room temperature, followed by removal of solvent under reduced pressure, to yield a dried EtOH extract (340 g). The EtOH extract was dissolved in H2O (900 mL) and extracted with EtOAc (900 mL × 3). The H2O-soluble portion was partitioned between n-BuOH (900 mL × 3) and aqueous layers. The n-BuOH layer (16.4 g) was chromatographed on a silica gel using CHCl3-MeOH-H2O (65:25:4 → 5:5:1) to afford MC-BU-1~11. Further MC-BU-4 was separated using chromatograph on an ODS with MeOH-H2O (1:9 → 3:7 → 1:1), to give 8 fractions MC-BU-4-1~8. MC-BU-4-4 was subjected to passage over an ODS HPLC column (TSK-gel ODS-80Ts, TOSOH, ϕ 7.8 × 300 mm, MeOH-H2O = 20:80 → 100:0, 1.0 mL/min) to give oxypaeoniflorin (5, 25.3 mg). MC-BU-4-4-12 was further purified using an ODS HPLC column (TSK-gel ODS-80Ts, TOSOH, ϕ 4.6 × 250 mm, MeOH: H2O = 20:80 → 100:0, 1.0 mL/min) to give mudanpioside E (6, 1.4 mg). MC-BU-4-5 (548.5 mg) was subjected to passage over an ODS HPLC column (TSK-gel ODS-80Ts, TOSOH, ϕ 7.8 × 300 mm, MeOH-H2O = 20:80 → 100:0, 1.0 mL/min) to give paeoniflorin (3, 127.6 mg) and mudanpioside D (7, 0.9 mg). MC-BU-4-5-8 was further purified by an ODS HPLC column (TSK-gel ODS-80Ts, TOSOH, ϕ 7.8 × 300 mm, MeOH-H2O = 30:80 → 100:0, 1.0 mL/min) to give salicylpaeoniflorin (4, 2.6 mg). MC-BU-4-6 (79.2 mg) subjected to passage over an ODS HPLC column (TSK-gel ODS-80Ts, TOSOH, ϕ 7.8 × 300 mm, MeOH-H2O = 35:65 → 100:0, 1.0 mL/min) to give 9 fractions MC-BU-4-6-1~9. MC-BU-4-6-6 and MC-BU-4-6-7 were purified to give galloylpaeoniflorin (8, 4.7 mg) and mudanpioside I (9, 3.3 mg), respectively. MC-BU-4-6-8 was then purified by separation over an ODS HPLC column (TSK-gel ODS-80Ts, TOSOH, ϕ 4.6 × 250 mm, MeOH-H2O = 40:60 → 100:0, 0.8 mL/min) to give suffruyabioside A (1, 2.8 mg). MC-BU-4-6-9 further purified using an ODS HPLC column (TSK-gel ODS-80Ts, TOSOH, ϕ 4.6 × 250 mm, MeOH-H2O = 50:50 → 100:0, 1.0 mL/min) to give suffruyabioside B (2, 1.3 mg).
Suffruyabioside A (
1). Colorless amorphous solid; [α]
D27 −18.0 (
c = 1.00, MeOH); IR (KBr) ν
max 3412, 1729, 1525, 1404, and 1069 cm
−1; UV (MeOH) λ
max nm (ε) 206 (26500), 226 (18400), and 258 (13700);
1H and
13C-NMR see
Table 1; ESIMS
m/z 785 [M+Na]
+; HRESIMS
m/z 785.2212 [M+Na]
+, calcd for C
36H
42O
18Na, 785.2269.
Suffruyabioside B (
2). Pale yellow amorphous solid; [α]
D28 −14.0 (
c = 1.00, MeOH); IR (KBr) ν
max 3388, 1711, 1459, 1357, and 1078 cm
−1; UV(MeOH) λ
max nm (ε) 202 (18700), 226 (26300), and 258 (4500);
1H and
13C-NMR: see
Table 1; ESIMS
m/z 769 [M+Na]
+; HRESIMS
m/z 769.2281 [M+Na]
+, calcd for C
36H
42O
17Na, 769.2320.
3.4. Preparation of Paeoniflorin and Other Compounds
Suffruyabiosides A (1) and B (2) and other seven known compounds 3–9 were dissolved in water and stored at −30 °C. For all cell proliferation assay, the final concentrations of the test compounds were prepared by diluting the stock with RPMI-1640. Control cultures also received the carrier solvent RPMI-1640.
3.5. Cell Culture
Human lung adenocarcinoma epithelial A549 cells (ATCC CCL 185, RIKEN Cell Bank) was maintained in monolayer culture at 37 °C and 5% CO2 in RPMI-1640 supplemented with 10% FBS, 100 units/mL penicillin G and 100 µg/mL streptomycin.
3.6. Cell Proliferation Assay
Inhibition of cell proliferation for A549 cell by suffruyabiosides A (1) and B (2) and other seven known compounds 3–9 was measured using the WST-8 assay. Briefly, cells were placed in 96-well culture plates (1 × 10⁴ cells/well). After 24 h incubation, cells were then incubated for 48 h in the presence or absence of compounds 1–9 (20 and 10 µM) dissolved in culture medium and an appropriate solvent. The WST-8 test solution (10 µL) was added to each well. After 4 h incubation, absorbance was measured on ELISA reader (Microplate Reader Model 550, Bio-RAD) at the test wavelength of 450 nm. RPMI-1640 supplemented with 10% FBS was used as the negative control.
3.7. Radical Scavenging Effect with SOD
Suffruyabiosides A (1) and B (2) and other seven known compounds 3–9 were subjected to a superoxide dismutase (SOD) assay using the SOD Assay Kit-WST according to the technical manual. Briefly, in a 96-well plate, 20 µL of sample solution was added to each sample and blank 2 well, and 20 µL of double distilled water was added to each blank 1 and blank 3 well. Then 200 µL of WST working solution was added to each well. After mixing, 20 µL of dilution buffer was added to each blank 2 and blank 3 well, and 20 µL of enzyme working solution (15 µL of enzyme mixted with 2.5 µL dilution buffer) was added to each sample and blank 1 well. The plate was incubated at 37 °C for 20 min and the O.D. was determined at 450 nm using an ELISA reader (Microplate Reader Model 550, Bio-RAD). The SOD-like activity was calculated by the following equation:
SOD activity (inhibition rate %) = {[(A blank 1–A blank 3)–(A sample–A blank 2)] / (A blank 1–A blank 3)}× 100
where A blank 1, A blank 2, A blank 3, and A sample were the absorbance of blank 1, blank 2, blank 3, and the sample, respectively.

