Variation of Medicinal Components in a Unique Geographical Accession of Horny Goat Weed Epimedium sagittatum Maxim. (Berberidaceae)


Abstract
:1. Introduction
2. Results
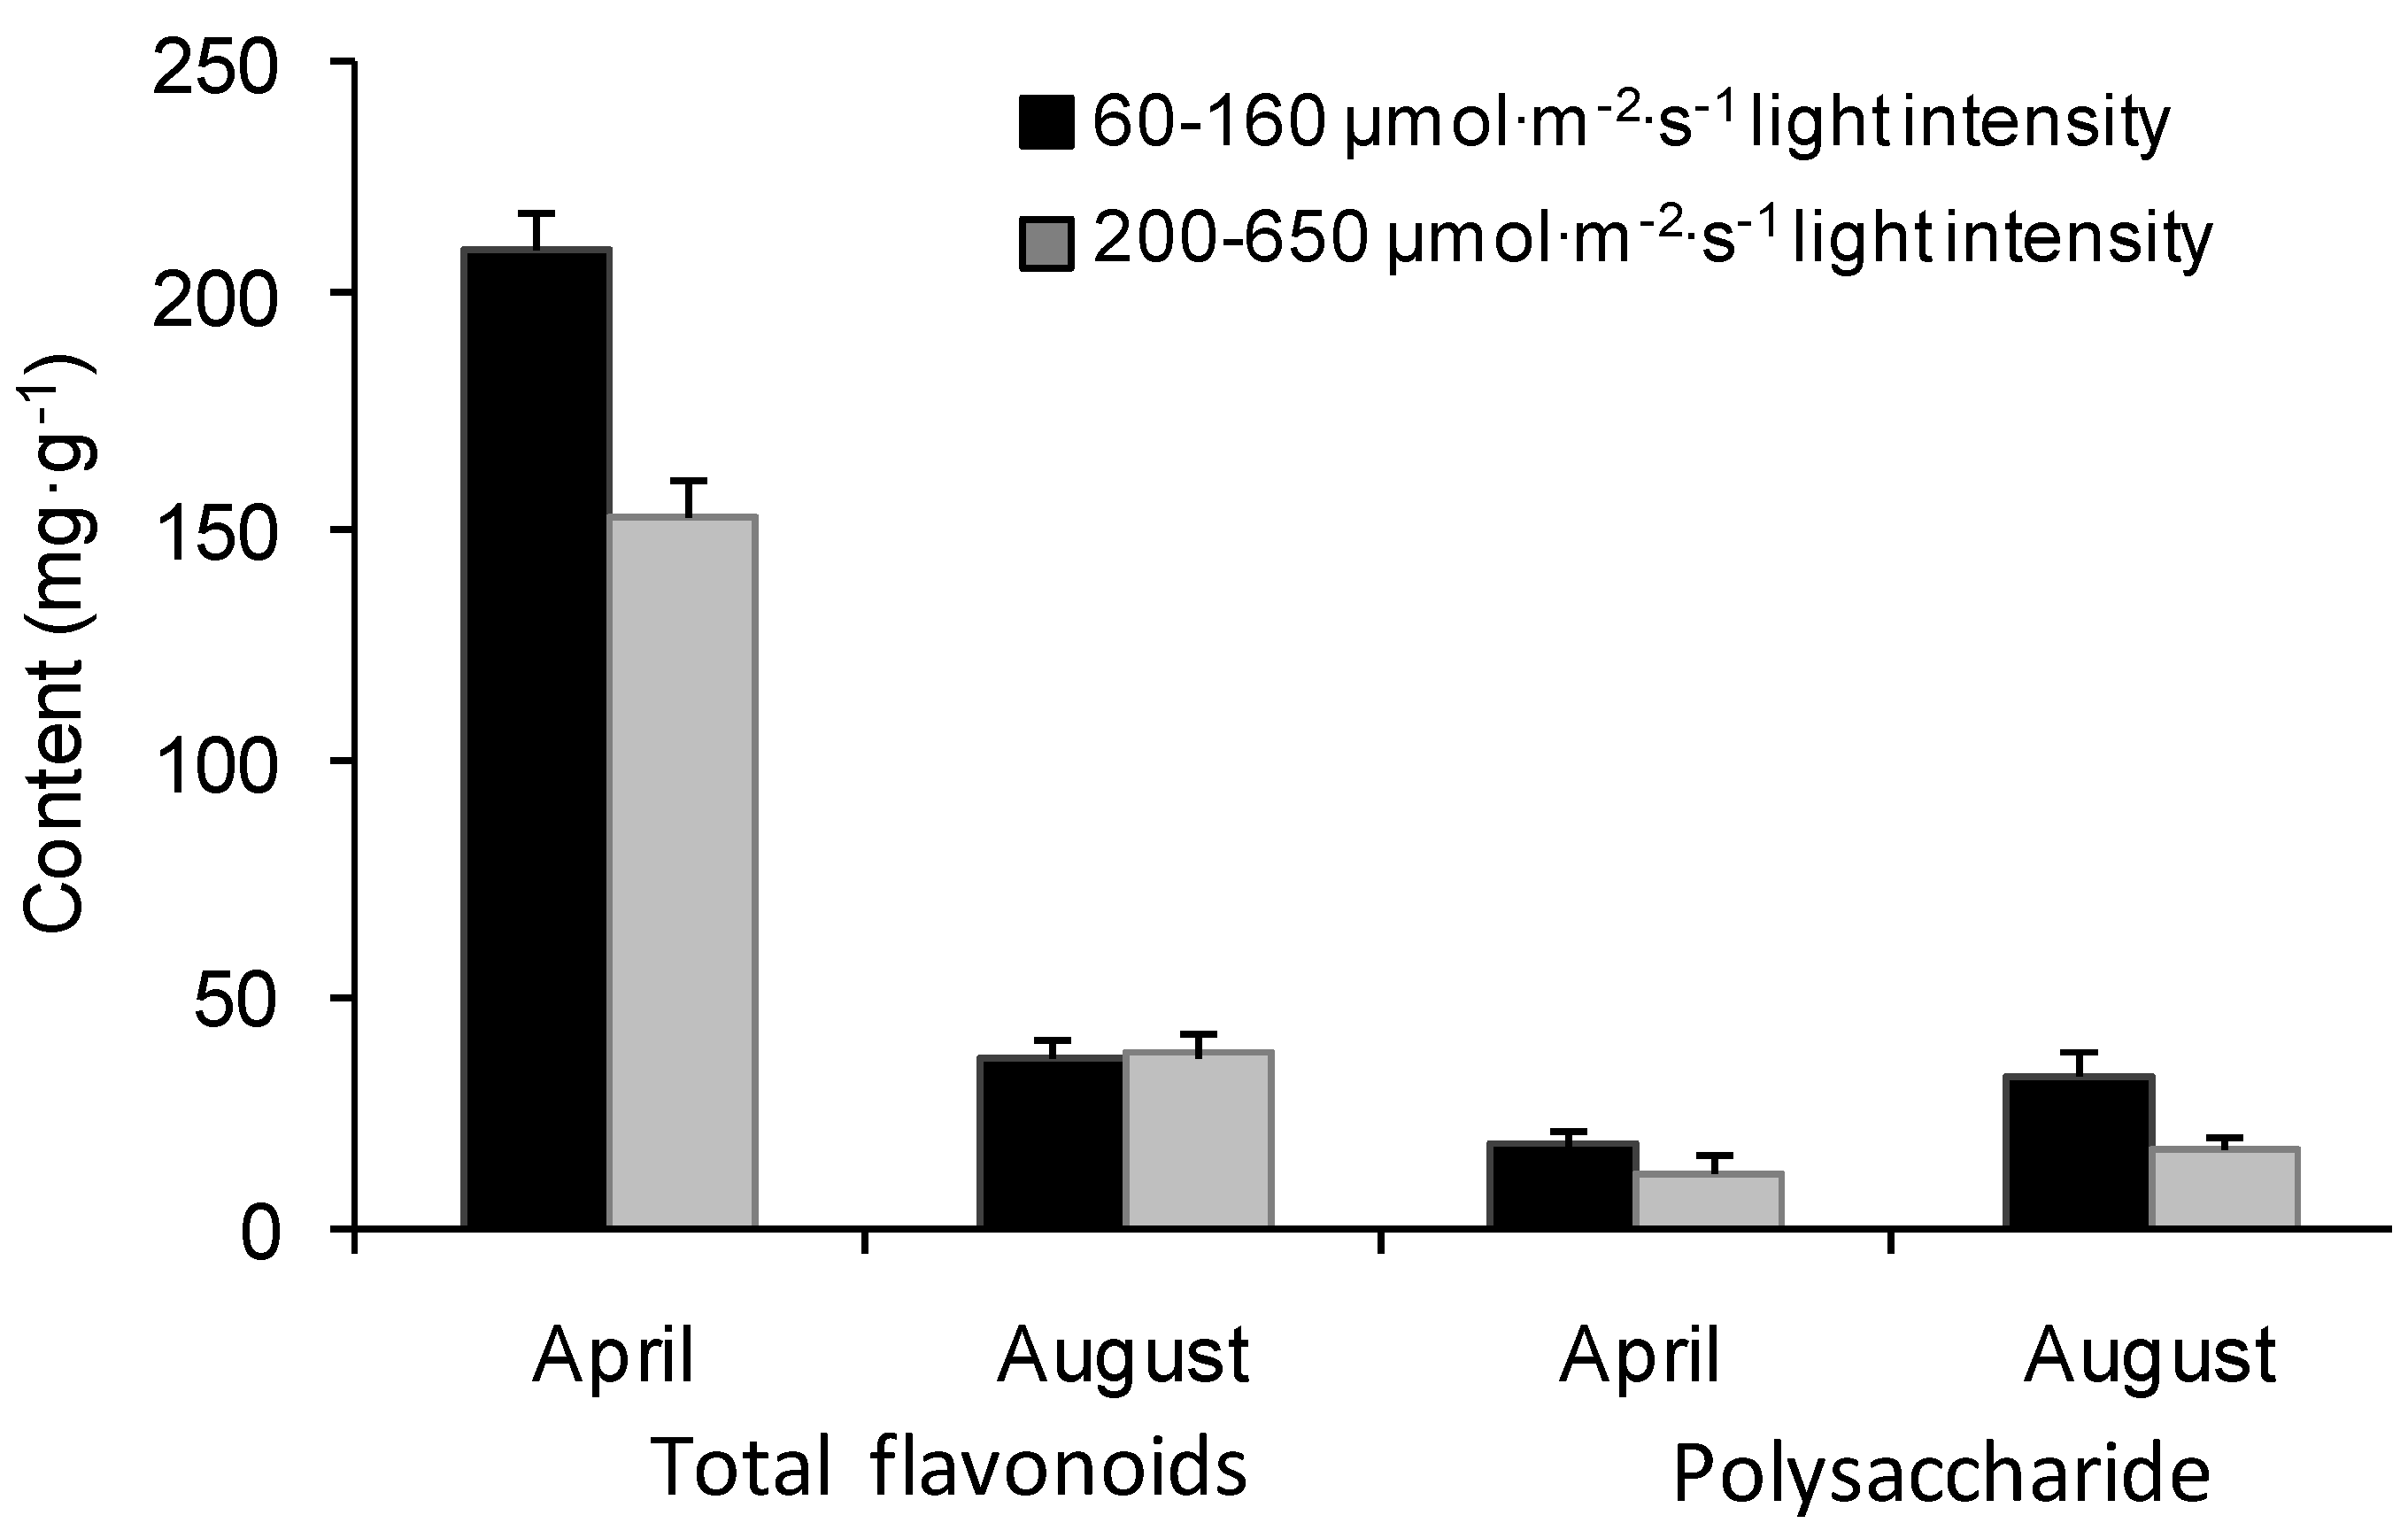
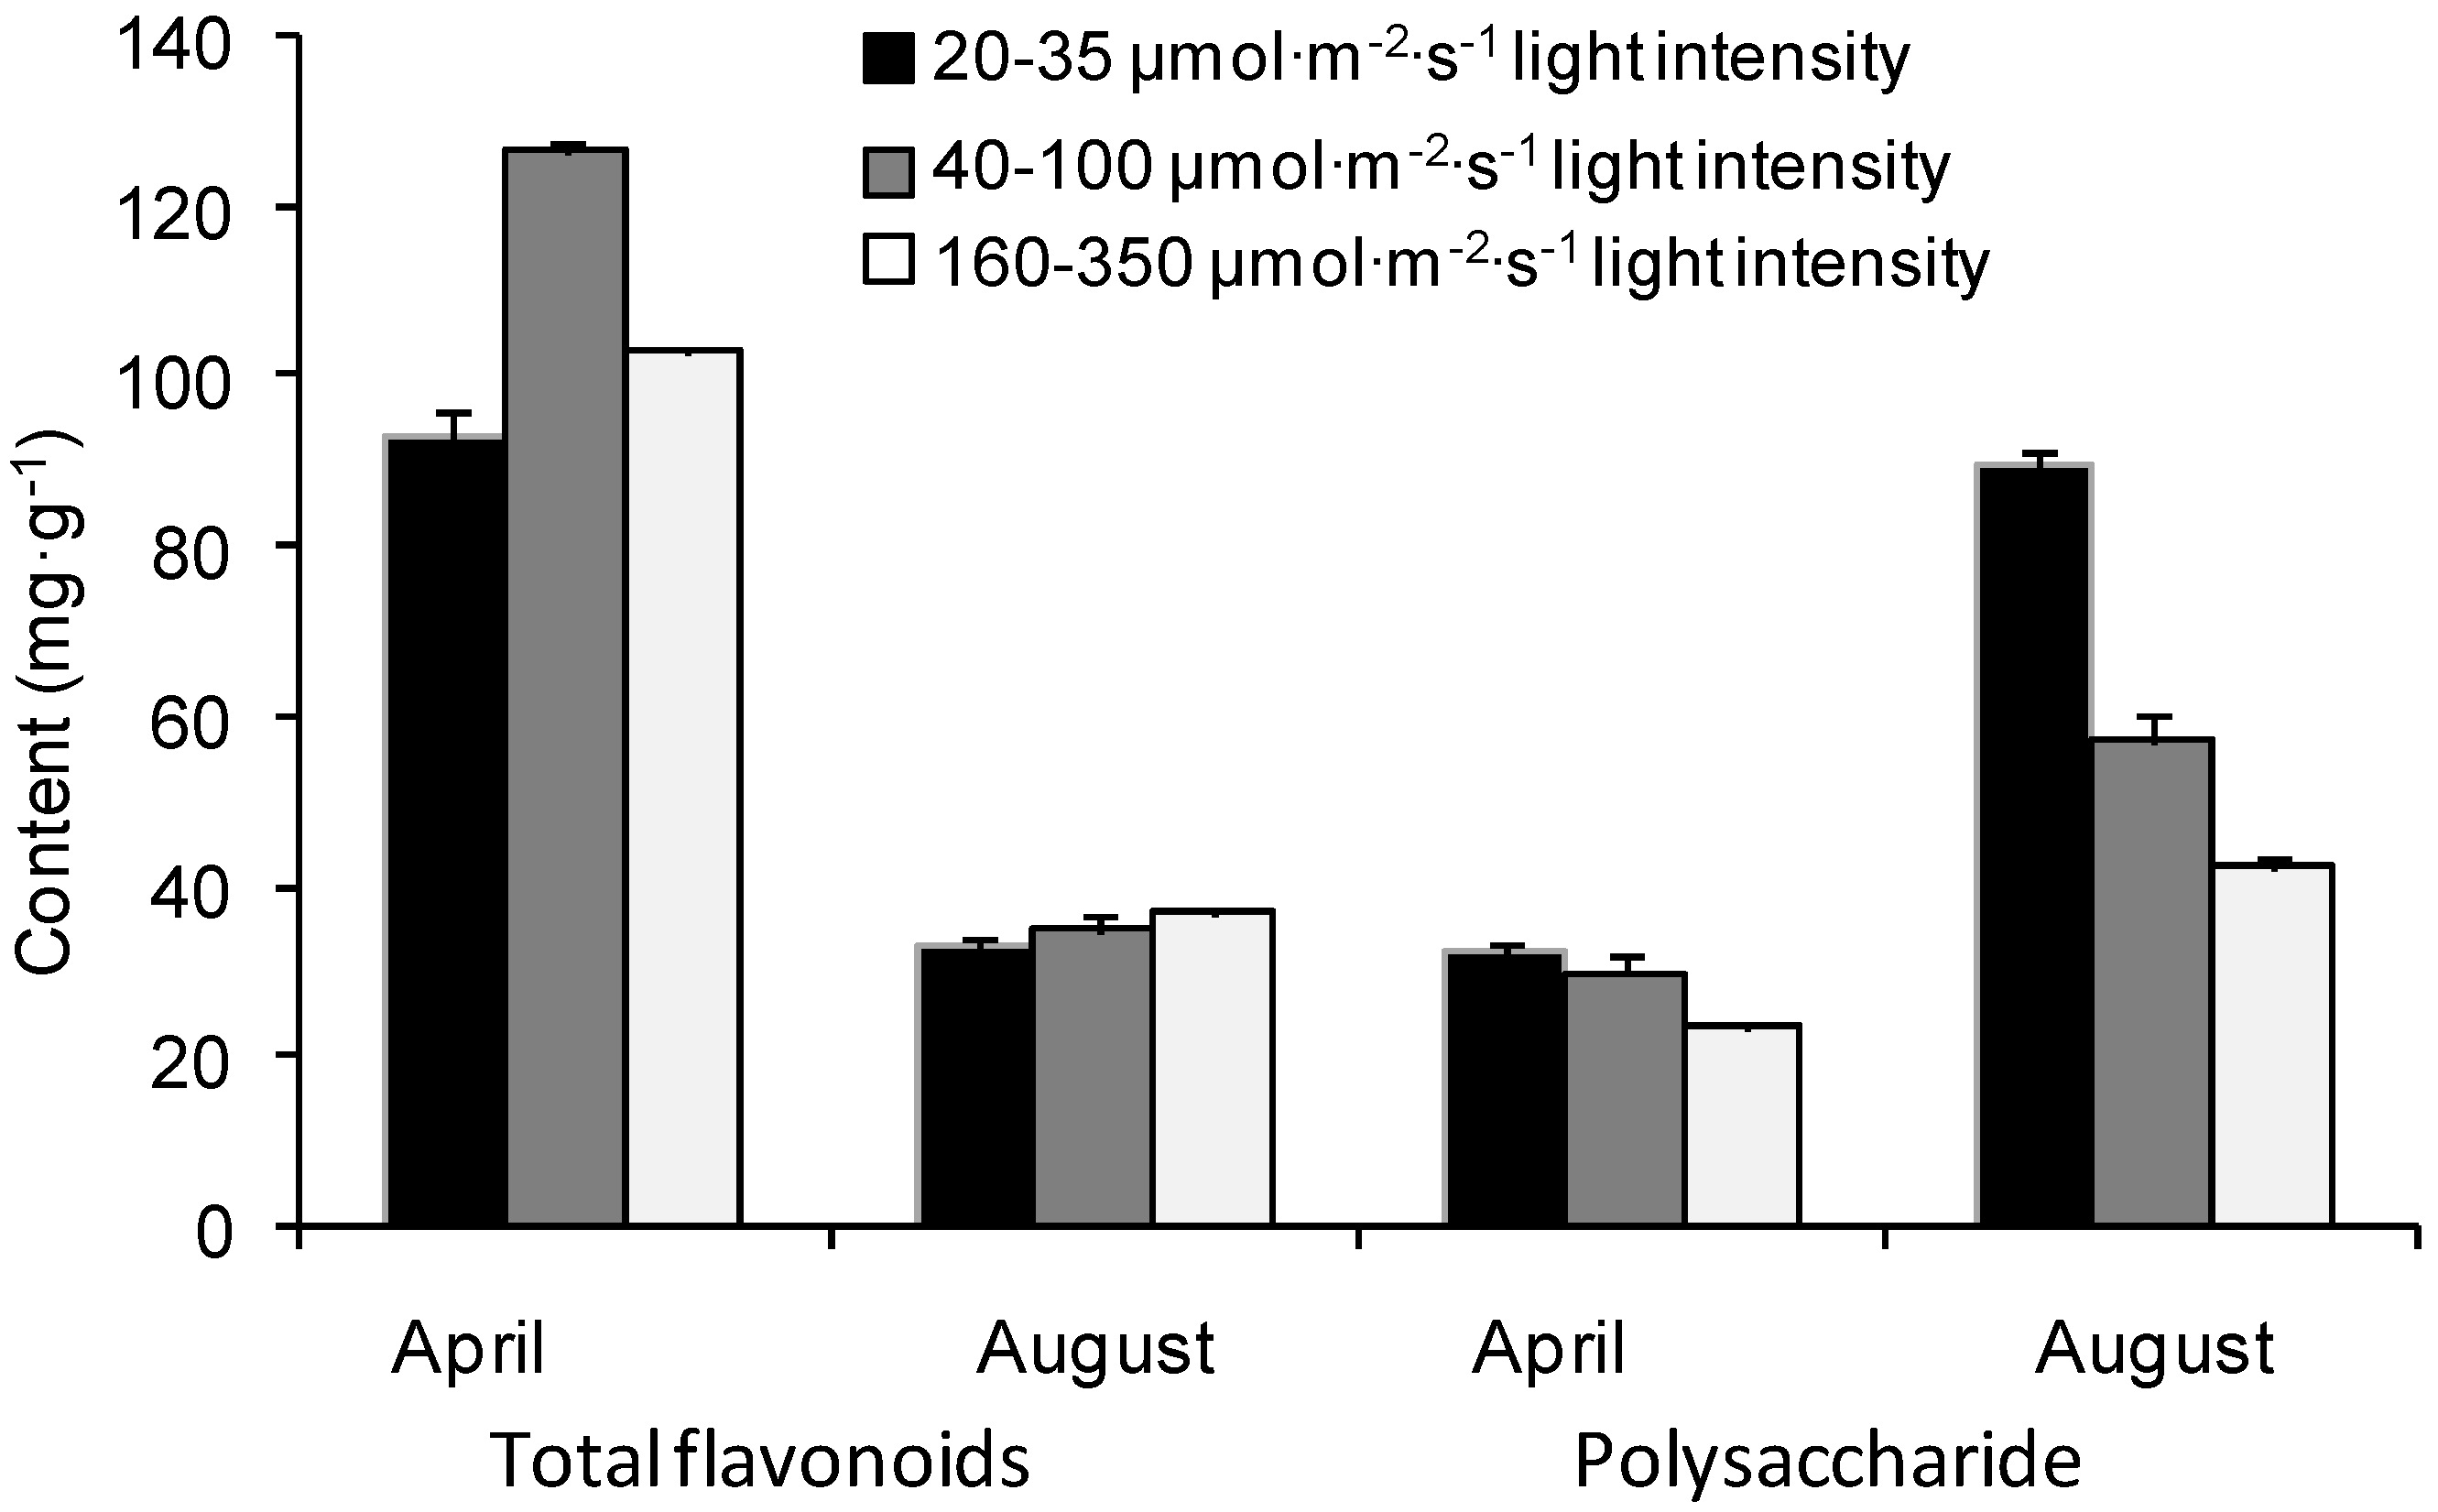
2.1. Seasonal Variations of Flavonoids and Polysaccharides under Different Light Intensities
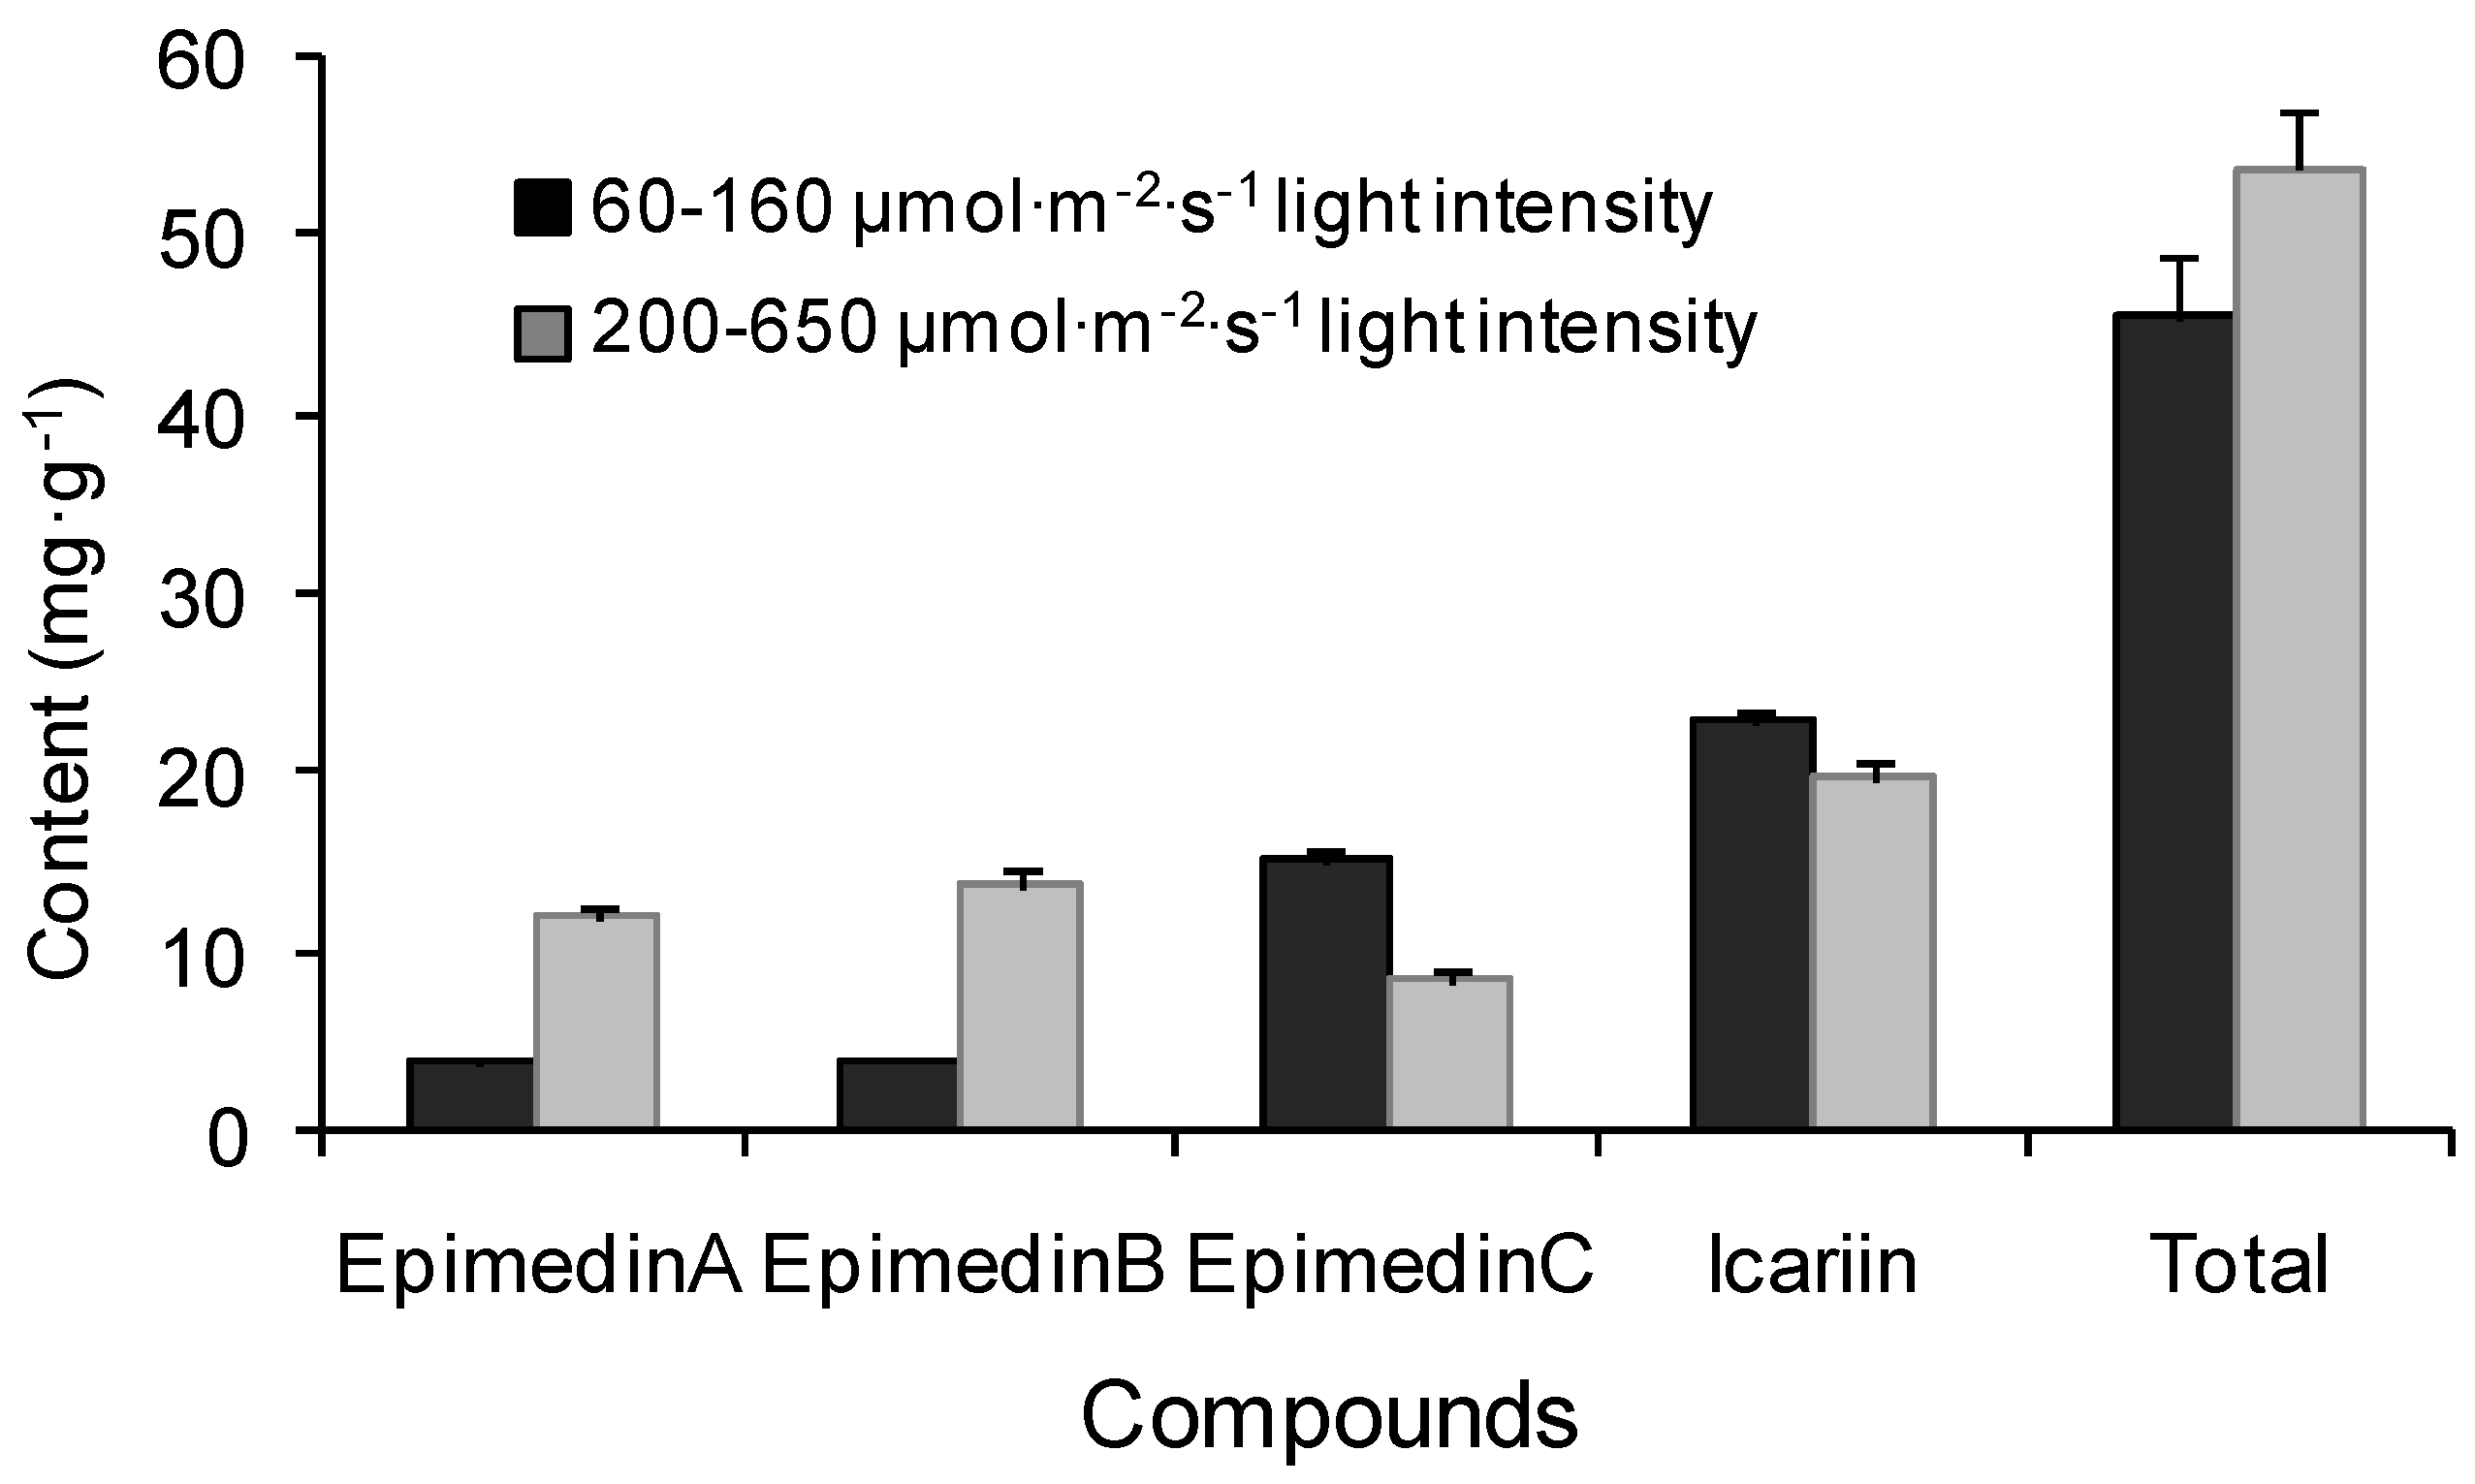
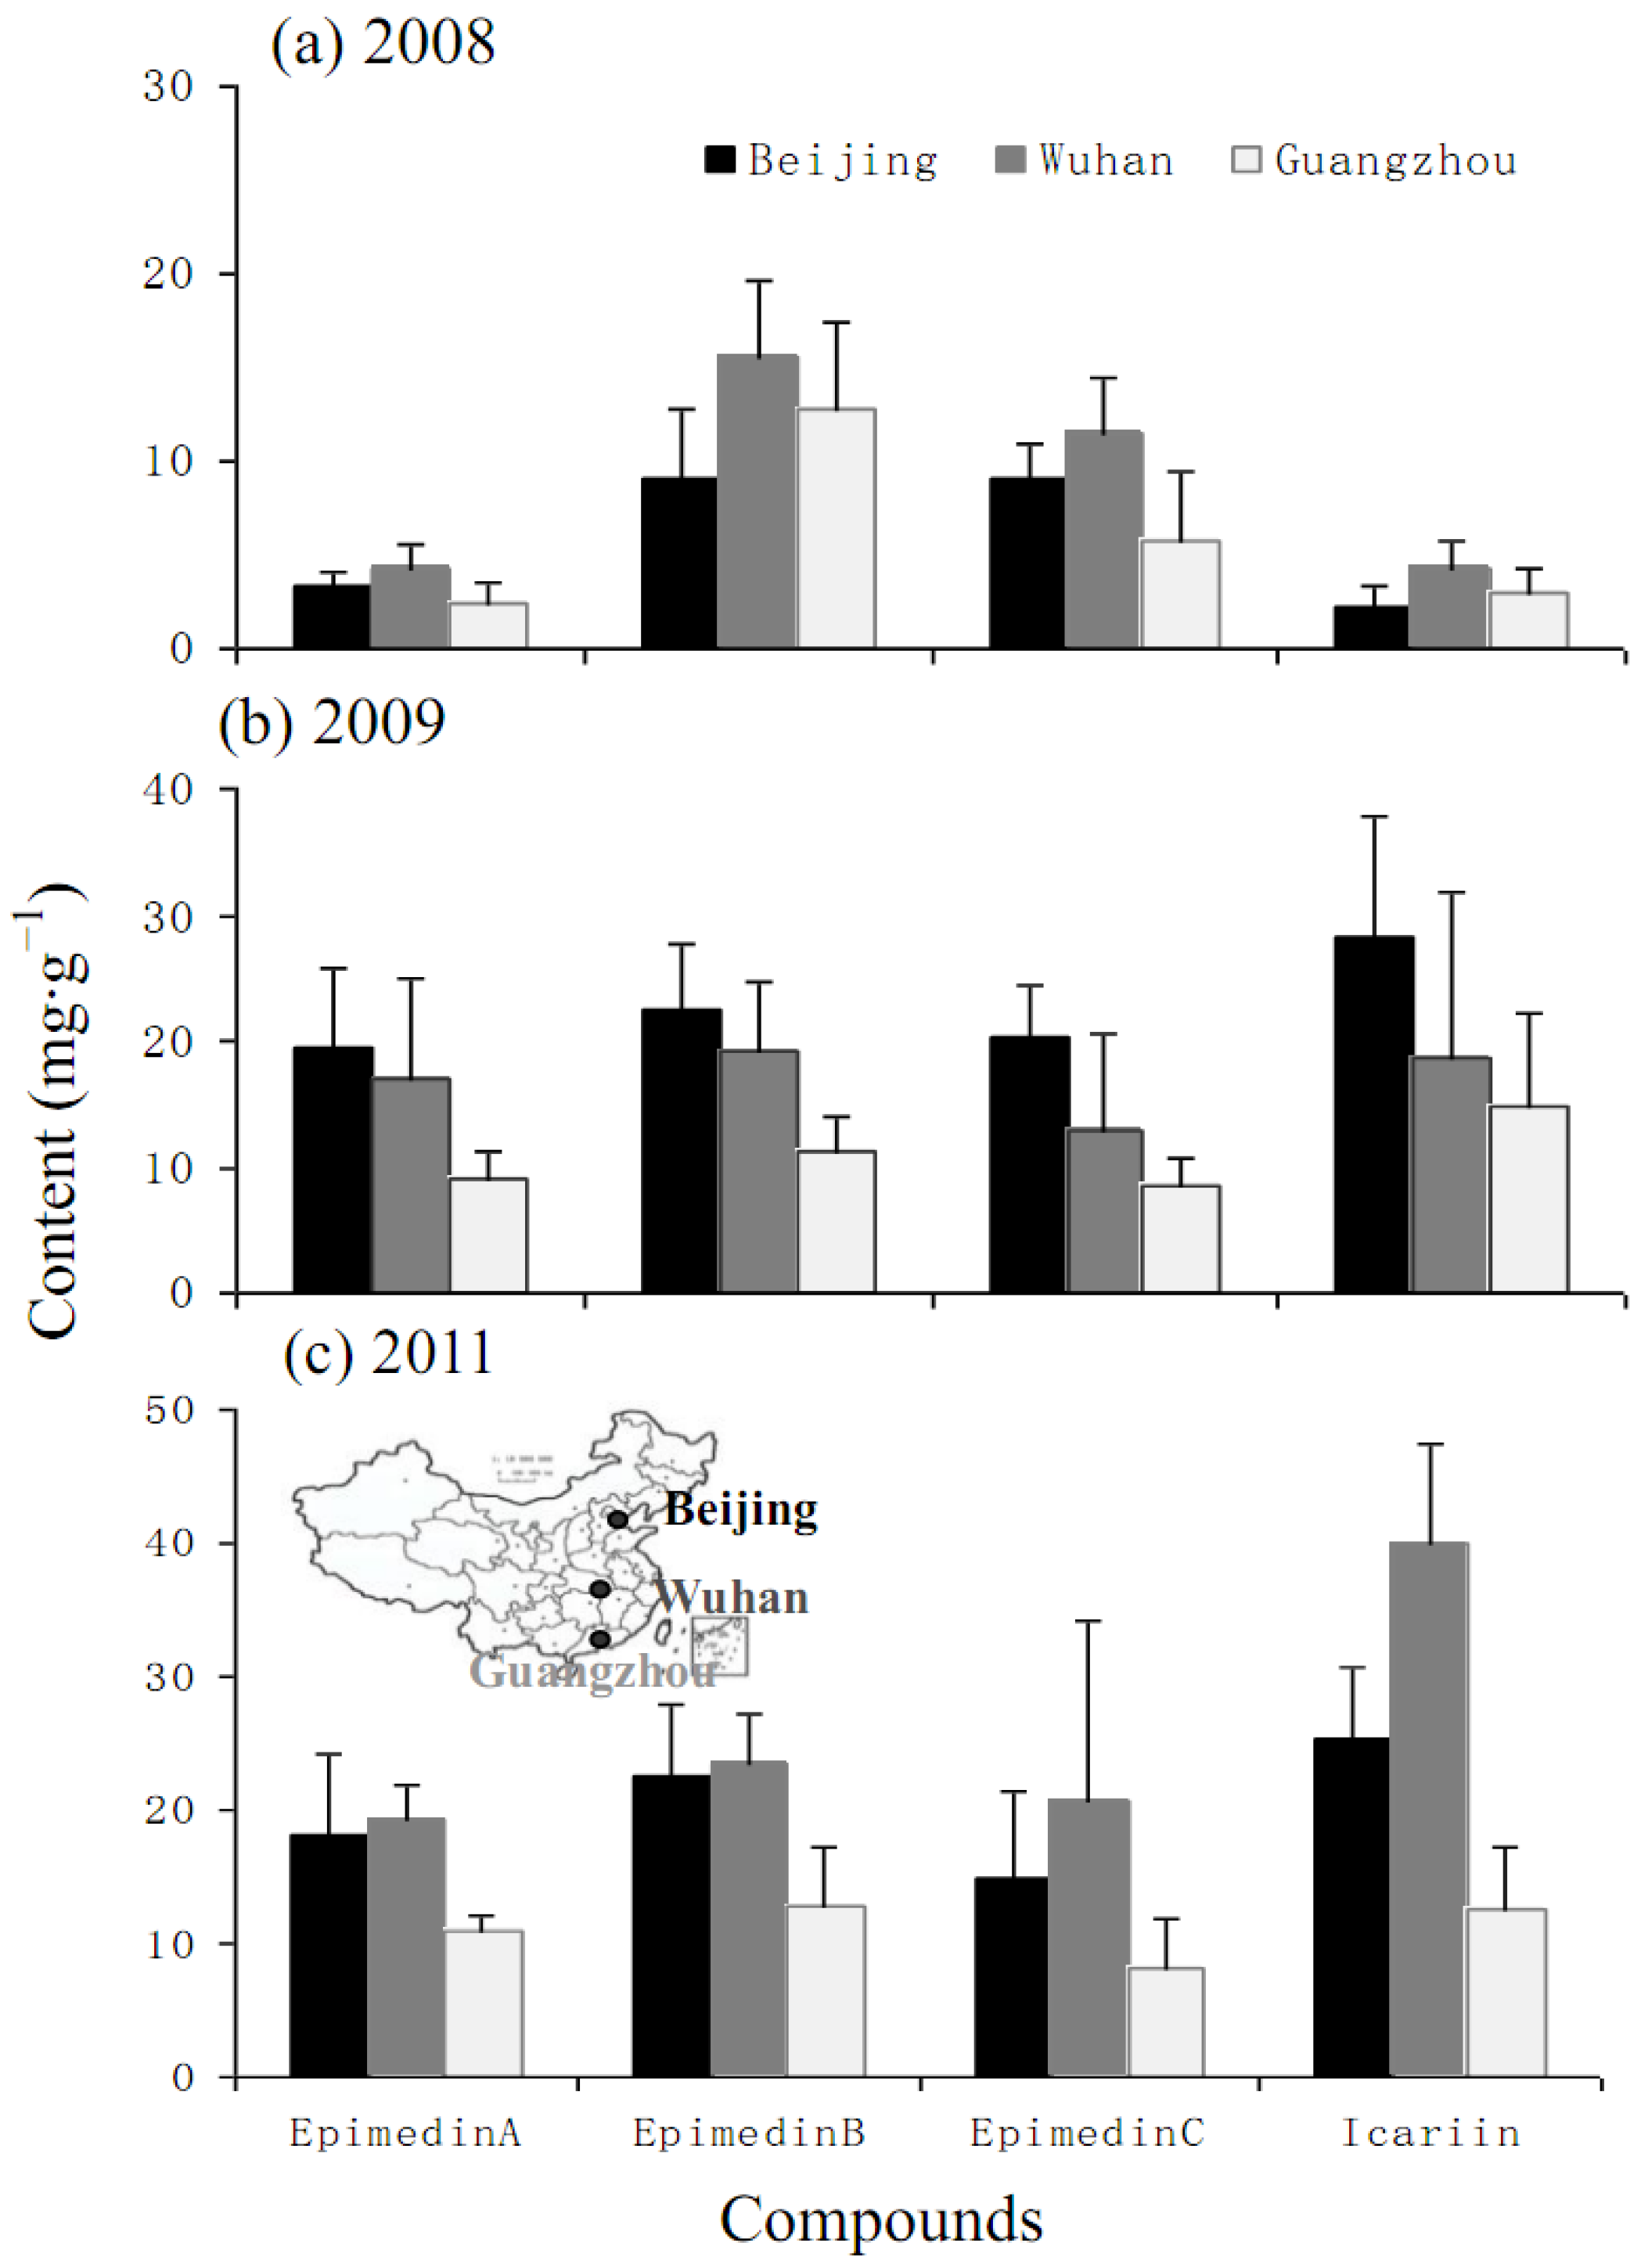
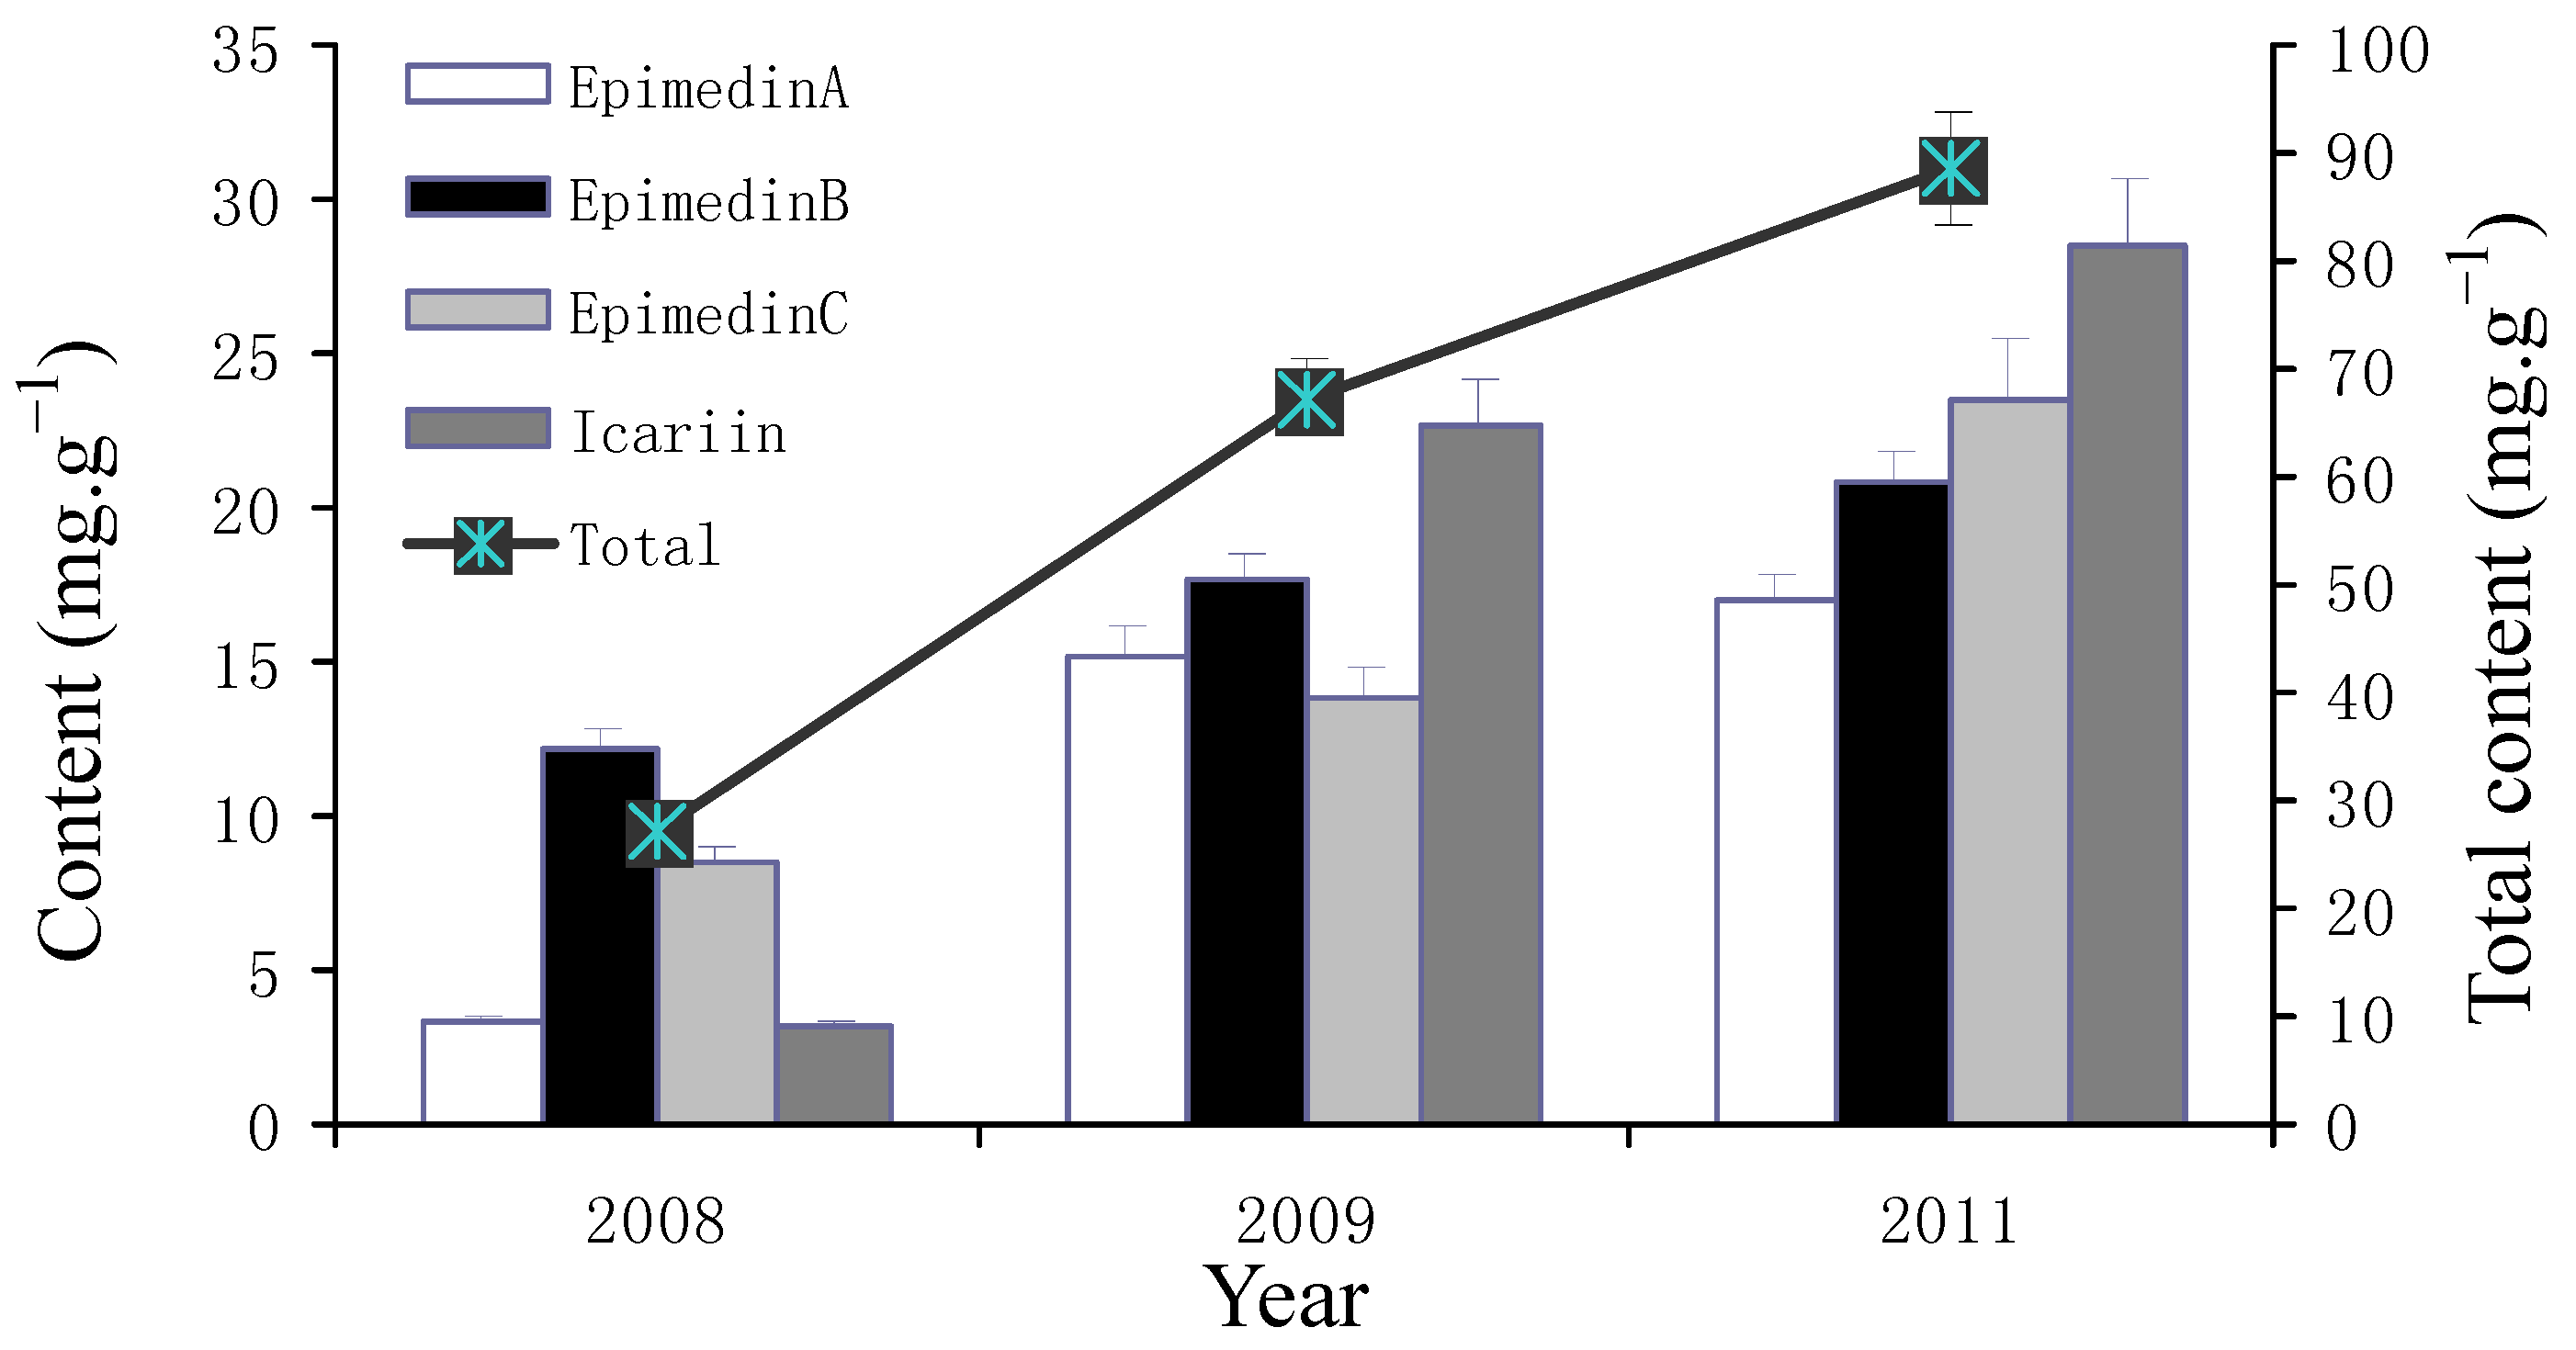
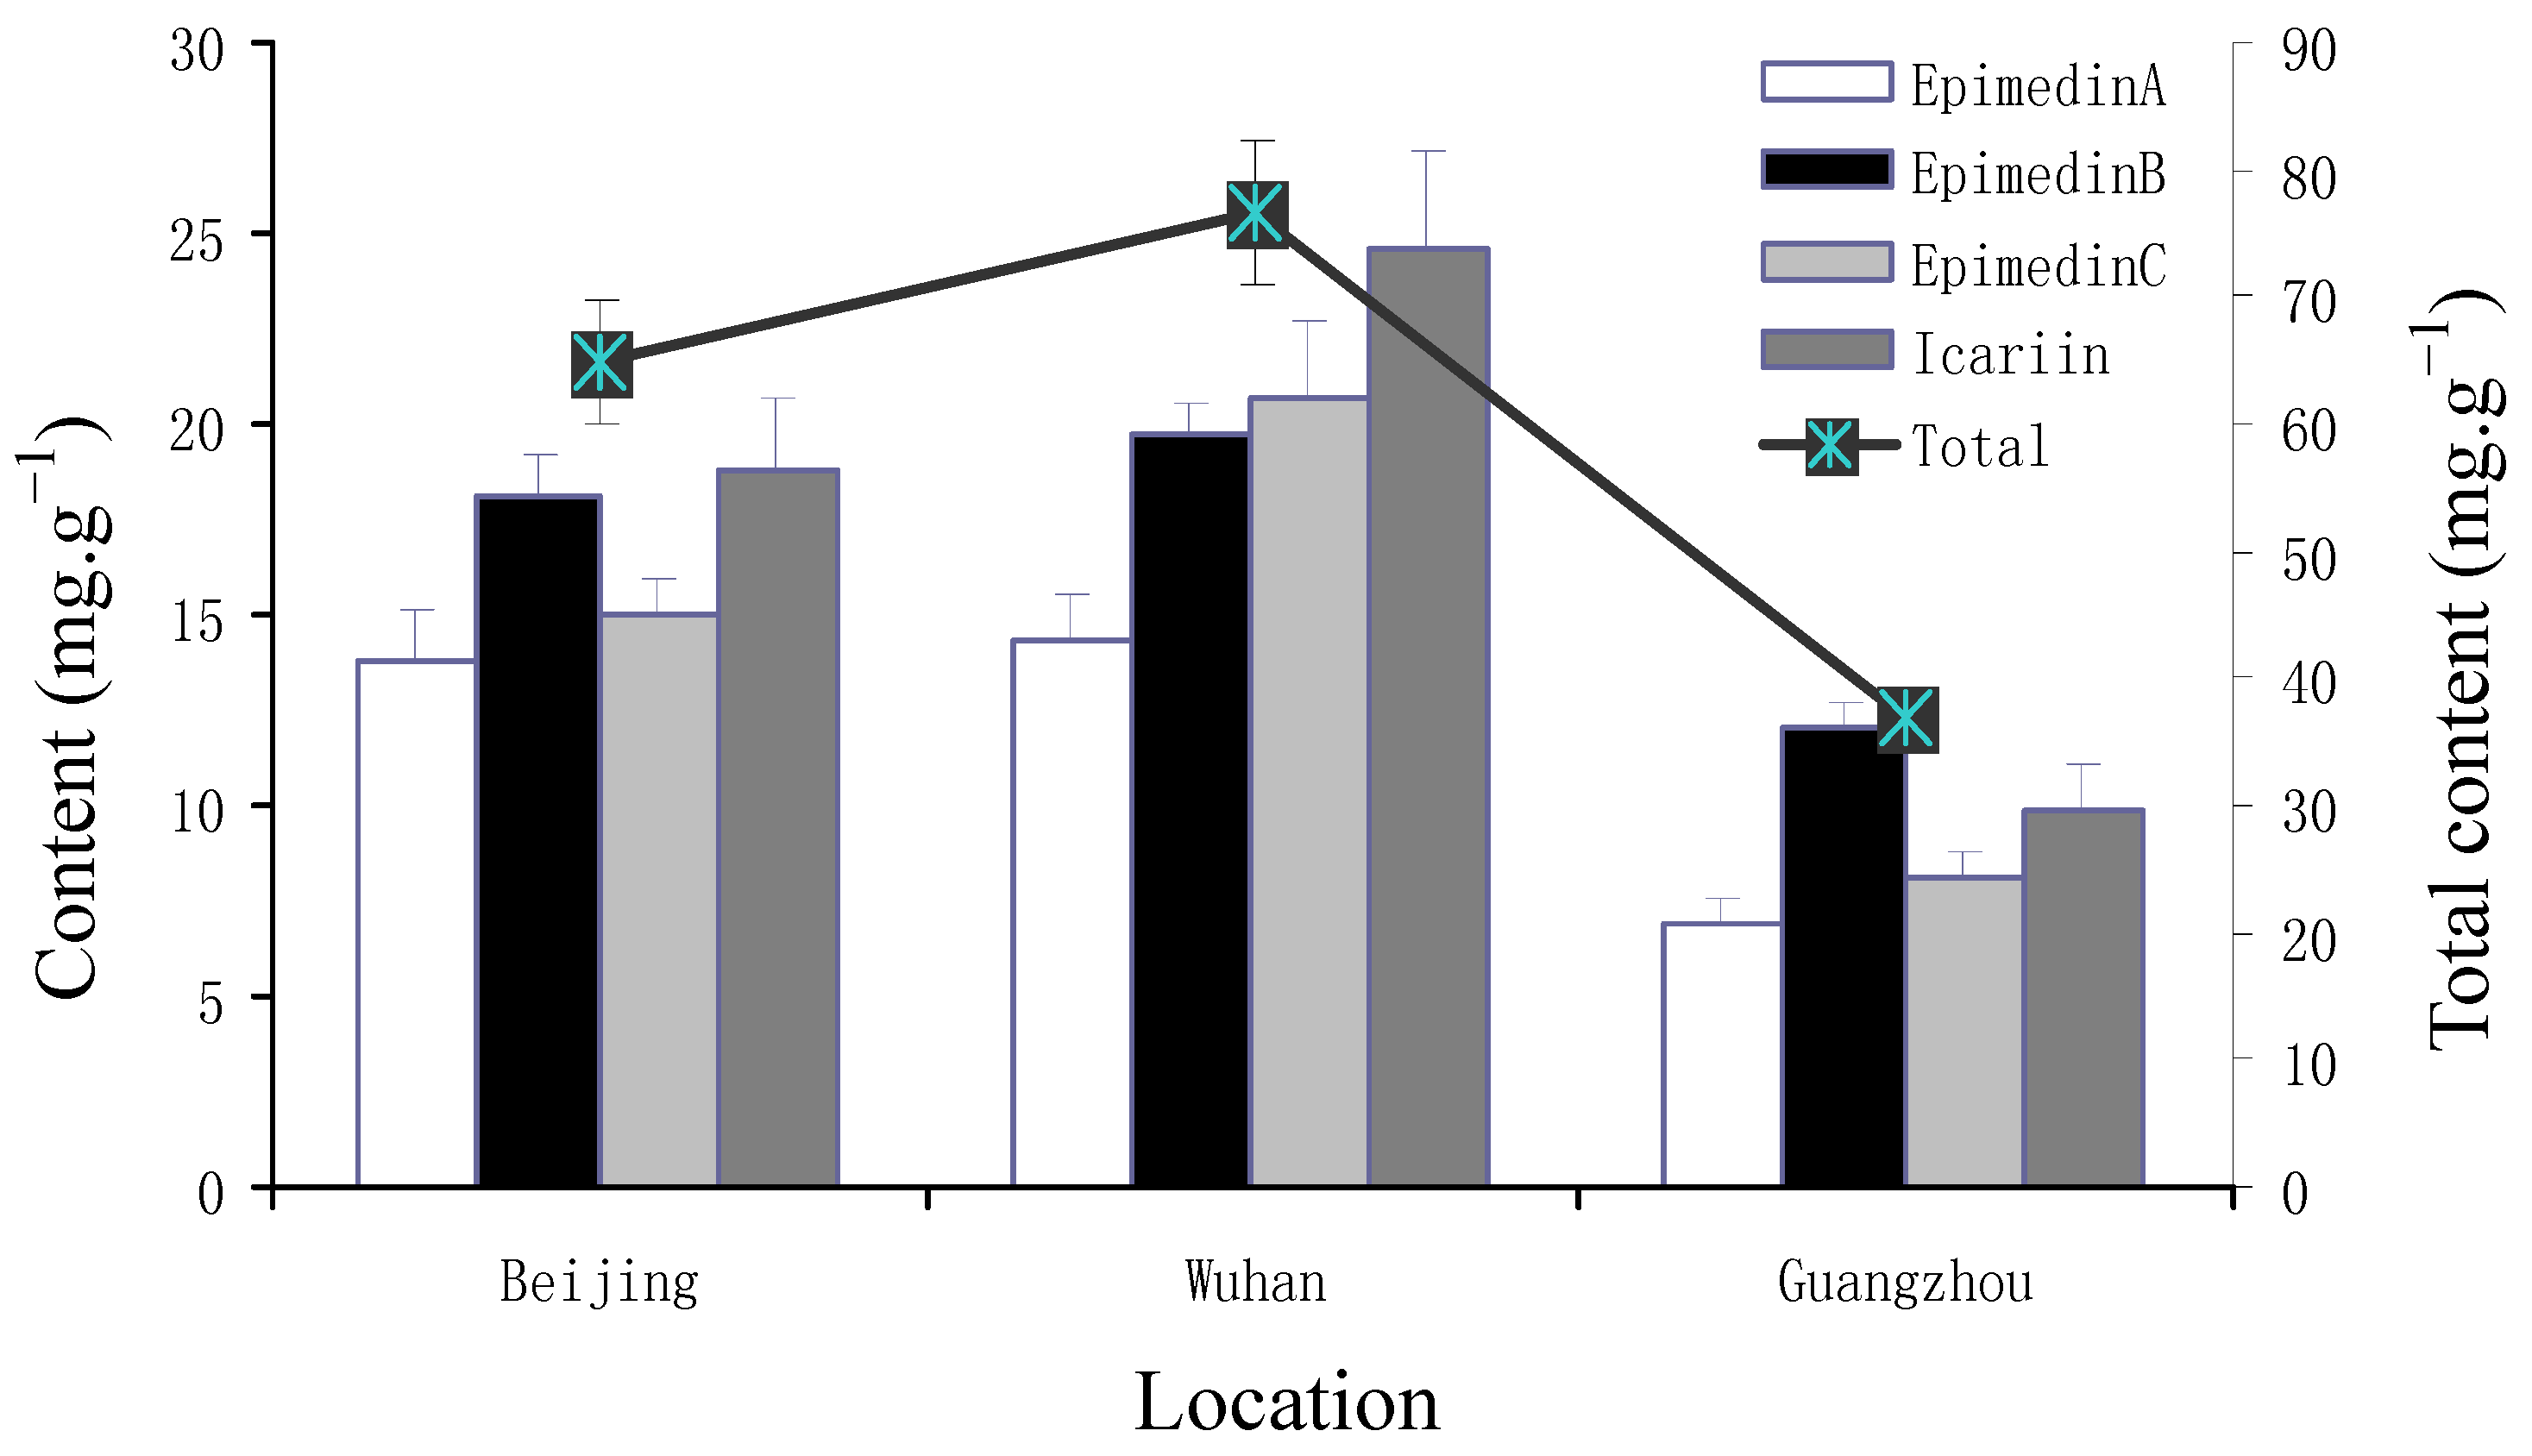
2.2. Yearly and Regional Variation of Content of Icariin, Epimedin A, B and C
3. Discussion
4. Experimental
4.1. Plant Materials and Experimental Designs
4.2. Chemicals and Reagents
4.3. Total Flavonoid Content Analysis
4.4. Polysaccharide Content Analysis
4.5. Analysis of Icariin, Epimedin A, Epimedin B and Epimedin C Contents
4.6. Data Analysis
5. Conclusions
Acknowledgements
References
- Wu, H.; Lien, E.J.; Lien, L.L. Chemical and pharmacological investigations of Epimedium species: A Survey. Prog. Drug Res. 2003, 60, 1–57. [Google Scholar] [PubMed]
- Ma, H.P.; He, X.R.; Yang, Y.; Li, M.X.; Hao, D.J.; Jia, Z.P. The genus Epimedium: An ethnopharmacological and phytochemical review. J. Ethnopharmacol. 2011, 134, 519–541. [Google Scholar] [CrossRef] [PubMed]
- Liu, J.J.; Li, S.P.; Wang, Y.T. Optimization for quantitative determination of four flavonoids in Epimedium by capillary zone electrophoresis coupled with diode array detection using central composite design. J. Chromatogr. A 2006, 1103, 344–349. [Google Scholar] [CrossRef] [PubMed]
- Chen, X.J.; Guo, B.L.; Li, S.P.; Zhang, Q.W.; Tu, P.F.; Wang, Y.T. Simultaneous determination of 15 flavonoids in Epimedium using pressurized liquid extraction and high-performance liquid chromatography. J. Chromatogr. A 2007, 1163, 96–104. [Google Scholar] [CrossRef] [PubMed]
- Lu, Y.; Wang, D.; Hu, Y.; Huang, X.; Wang, J. Sulfated modification of epimedium polysaccharide and effects of the modifiers on cellular infectivity of IBDV. Carbohydr. Polym. 2008, 71, 183–186. [Google Scholar] [CrossRef]
- Zhang, H.H.; Gao, X.; Lu, D.Y.; Wang, Y. Simultaneous determination of epimedin A, B, C and icariin in herba epimedii by high performance liquid chromatography. J. Inst. Anal. 2007, 26, 198–201. [Google Scholar]
- Xu, Y.Q. Determination of Active Constitutes and Population Genetics of Three Medicinal Epimedium Species. Ph.D. Thesis, Graduate University of Chinese Academy of Sciences, Beijing, China, 2008. [Google Scholar]
- Ying, J.S. Herba Epimedii. In Flora of China; Wu, Z.Y., Raven, P.H., Hong, D.Y., Eds.; Science Press: Beijing, China, 2009; Volume 29, pp. 263–298. [Google Scholar]
- Dong, R.; Feng, Y.C.; Liu, L.J.; Li, C.Y. Influence of light intensity on effective chemical contents of Epimedium koreanum Nakai. J. Jilin Agric. Univ. 2003, 25, 413–415. [Google Scholar]
- Liu, M.N. Advancement of research on physiological ecology of officinal resource of Epimedium. Asia-Pac. Tradit. Med. 2009, 5, 162–166. [Google Scholar]
- Pei, L.K.; Huang, W.H.; He, T.G.; Guo, B.L. Systematic studies on quality of main species of Herba Epimedii. Zhongguo Zhong Yao Za Zhi 2007, 32, 2217–2222. [Google Scholar] [PubMed]
- Guo, B.L.; Wang, C.L.; Chen, J.M.; Xiao, P.G. Determination of 9 flavonids in 5 species of Epimedium recorded in Chinese pharmacopoeia by HPLC. Yao Xue Xue Bao 1996, 31, 292–295. [Google Scholar]
- Xie, J.P.; Wang, Z.D.; Sun, W.J. The Investigation of epimedin C and icariin in the leaves of 9 species of Epimedium. Chin. Tradit. Herb. Drugs 2007, 38, 613–614. [Google Scholar]
- Schijlen, E.G.W.M.; Ric de Vos, C.H.; van Tunen, A.J.; Bovy, A.G. Modification of flavonoid biosynthesis in crop plant. Phytochemistry 2004, 65, 2631–2648. [Google Scholar] [CrossRef] [PubMed]
- Du, J.F.; Zhang, Z.Y. The comparision of the content of polysaccharide and the accmlation of dry mass indifferent species of Dioscorea opposite Thunb. Jiangsu J. Tradit. Chin. Med. 2008, 40, 57–59. [Google Scholar]
- Koga, S.; Shoyama, Y.; Nishioka, I. Studies on Epimedium species: Flavonol glycoside and isozymes. Biochem. Syst. Ecol. 1991, 19, 315–318. [Google Scholar] [CrossRef]
- Chang, Y.X.; Li, J.; Su, G.E.; Wang, Y.C. Study on the dynamics trends of Polysaccharide content of Cynomorium songaricum Rupr in different growth stages. J. Inner Mongolia Univ. 2007, 38, 237–240. [Google Scholar]
- He, S.Z.; Wang, Y.Y.; Xu, W.F. Research on flavnoids in leave of Epimedium myrianThum and Epimedium acuminatum in Guizhou for different growth phase. GuiZhou Sci. 2008, 26, 34–37. [Google Scholar]
- Sun, C.; Zhang, Y.M.; Zhou, J.L. Study on the content of icariin of artificial cultivated E. wushanense. Chin. J. Tradit. Chin. Med. Pharm. 2005, 20, 670–671. [Google Scholar]
- Zhang, C.X.; Ma, X.J.; Zhang, Y.Y. Study on the best harvesting time of E. koreanum. Chin. Tradit. Pat. Med. 2009, 31, 576–579. [Google Scholar]
- Yu, J.L.; Jiang, Q.J.; Sun, R.S.; Lv, H. Determination of the effective components in different parts and harvest time of Epimedium koreanum. Chin. J. Exp. Tradit. Med. Formulae 2012, 18, 92–95. [Google Scholar]
- Qin, J.M.; Dong, R.; Zhang, W.D. Effective content analysis of Epimedium koreanum Nakai.in different growth year. Lishizhen Med. Mater. Med. Res. 2006, 17, 901–902. [Google Scholar]
- Zhang, H.H. Measurement, Extraction and Analysis of Flavone and Polysaccharide in Herba Epimedii. Ph.D. Thesis, Graduate University of Chinese Academy of Science, Beijing, China, 2008. [Google Scholar]
- Gao, X. Content Analysis of Four Flavonoids in Epimedium L. and Cloning of Flavonol Biosynthesis-Related Genes in E. sagittatum. M.S. Thesis, Graduate University of Chinese Academy of Science, Beijing, China, 2009. [Google Scholar]
Sample Availability: Samples of the flavonoids and polysaccharide are available from the authors. |


| Source | df | MS | F | P |
|---|---|---|---|---|
| Polysaccharide (April) | 4 | 0.17 | 294.21 | <0.001 |
| Polysaccharide (August) | 4 | 0.37 | 1409.00 | <0.001 |
| Flavone (April) | 4 | 0.10 | 2969.00 | <0.001 |
| Flavone(August) | 4 | 0.00 | 12.41 | <0.001 |
| Source | df | MS | F | P |
|---|---|---|---|---|
| Epimedin A | 1 | 0.62 | 1398 | <0.001 |
| Epimedin B | 1 | 0.8 | 1124 | <0.001 |
| Epimedin C | 1 | 0.16 | 206.4 | <0.001 |
| Icariin | 1 | 0.01 | 29.4 | 0.001 |
| Total | 1 | 0.01 | 28.8 | 0.001 |
| Epimedin A | Epimedin B | Epimedin C | Icariin | Total | |||||||
|---|---|---|---|---|---|---|---|---|---|---|---|
| Source | df | MS | F | MS | F | MS | F | MS | F | MS | F |
| Duration (D) | 2 | 4.57 | 218.46 ** | 568.76 | 28.32 ** | 1.12 | 44.09 ** | 6.97 | 95.41 | 2.35 | 189.19 ** |
| Location (L) | 2 | 0.53 | 25.52 ** | 571.77 | 28.47 ** | 1.00 | 39.63 ** | 0.34 | 4.70 | 0.66 | 52.62 ** |
| D × L | 4 | 0.04 | 1.94 | 275.76 | 13.73 ** | 0.41 | 16.12 ** | 0.70 | 9.527 | 0.19 | 14.97 ** |
© 2012 by the author; licensee MDPI, Basel, Switzerland. This article is an open access article distributed under the terms and conditions of the Creative Commons Attribution license (http://creativecommons.org/licenses/by/3.0/).
Share and Cite
Liang, Q.; Wei, G.; Chen, J.; Wang, Y.; Huang, H. Variation of Medicinal Components in a Unique Geographical Accession of Horny Goat Weed Epimedium sagittatum Maxim. (Berberidaceae). Molecules 2012, 17, 13345-13356. https://doi.org/10.3390/molecules171113345
Liang Q, Wei G, Chen J, Wang Y, Huang H. Variation of Medicinal Components in a Unique Geographical Accession of Horny Goat Weed Epimedium sagittatum Maxim. (Berberidaceae). Molecules. 2012; 17(11):13345-13356. https://doi.org/10.3390/molecules171113345
Chicago/Turabian StyleLiang, Qiong, Guoyan Wei, Jianjun Chen, Ying Wang, and Hongwen Huang. 2012. "Variation of Medicinal Components in a Unique Geographical Accession of Horny Goat Weed Epimedium sagittatum Maxim. (Berberidaceae)" Molecules 17, no. 11: 13345-13356. https://doi.org/10.3390/molecules171113345
APA StyleLiang, Q., Wei, G., Chen, J., Wang, Y., & Huang, H. (2012). Variation of Medicinal Components in a Unique Geographical Accession of Horny Goat Weed Epimedium sagittatum Maxim. (Berberidaceae). Molecules, 17(11), 13345-13356. https://doi.org/10.3390/molecules171113345