Cytoprotective Effects of β-Melanocortin in the Rat Gastrointestinal Tract

 ,
,
Abstract
: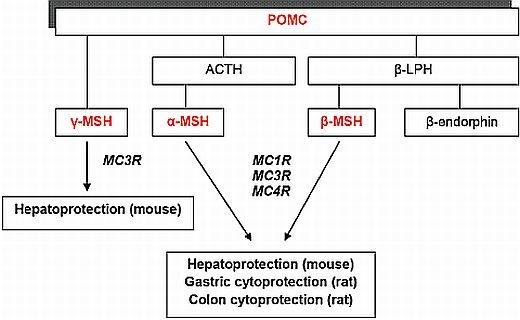
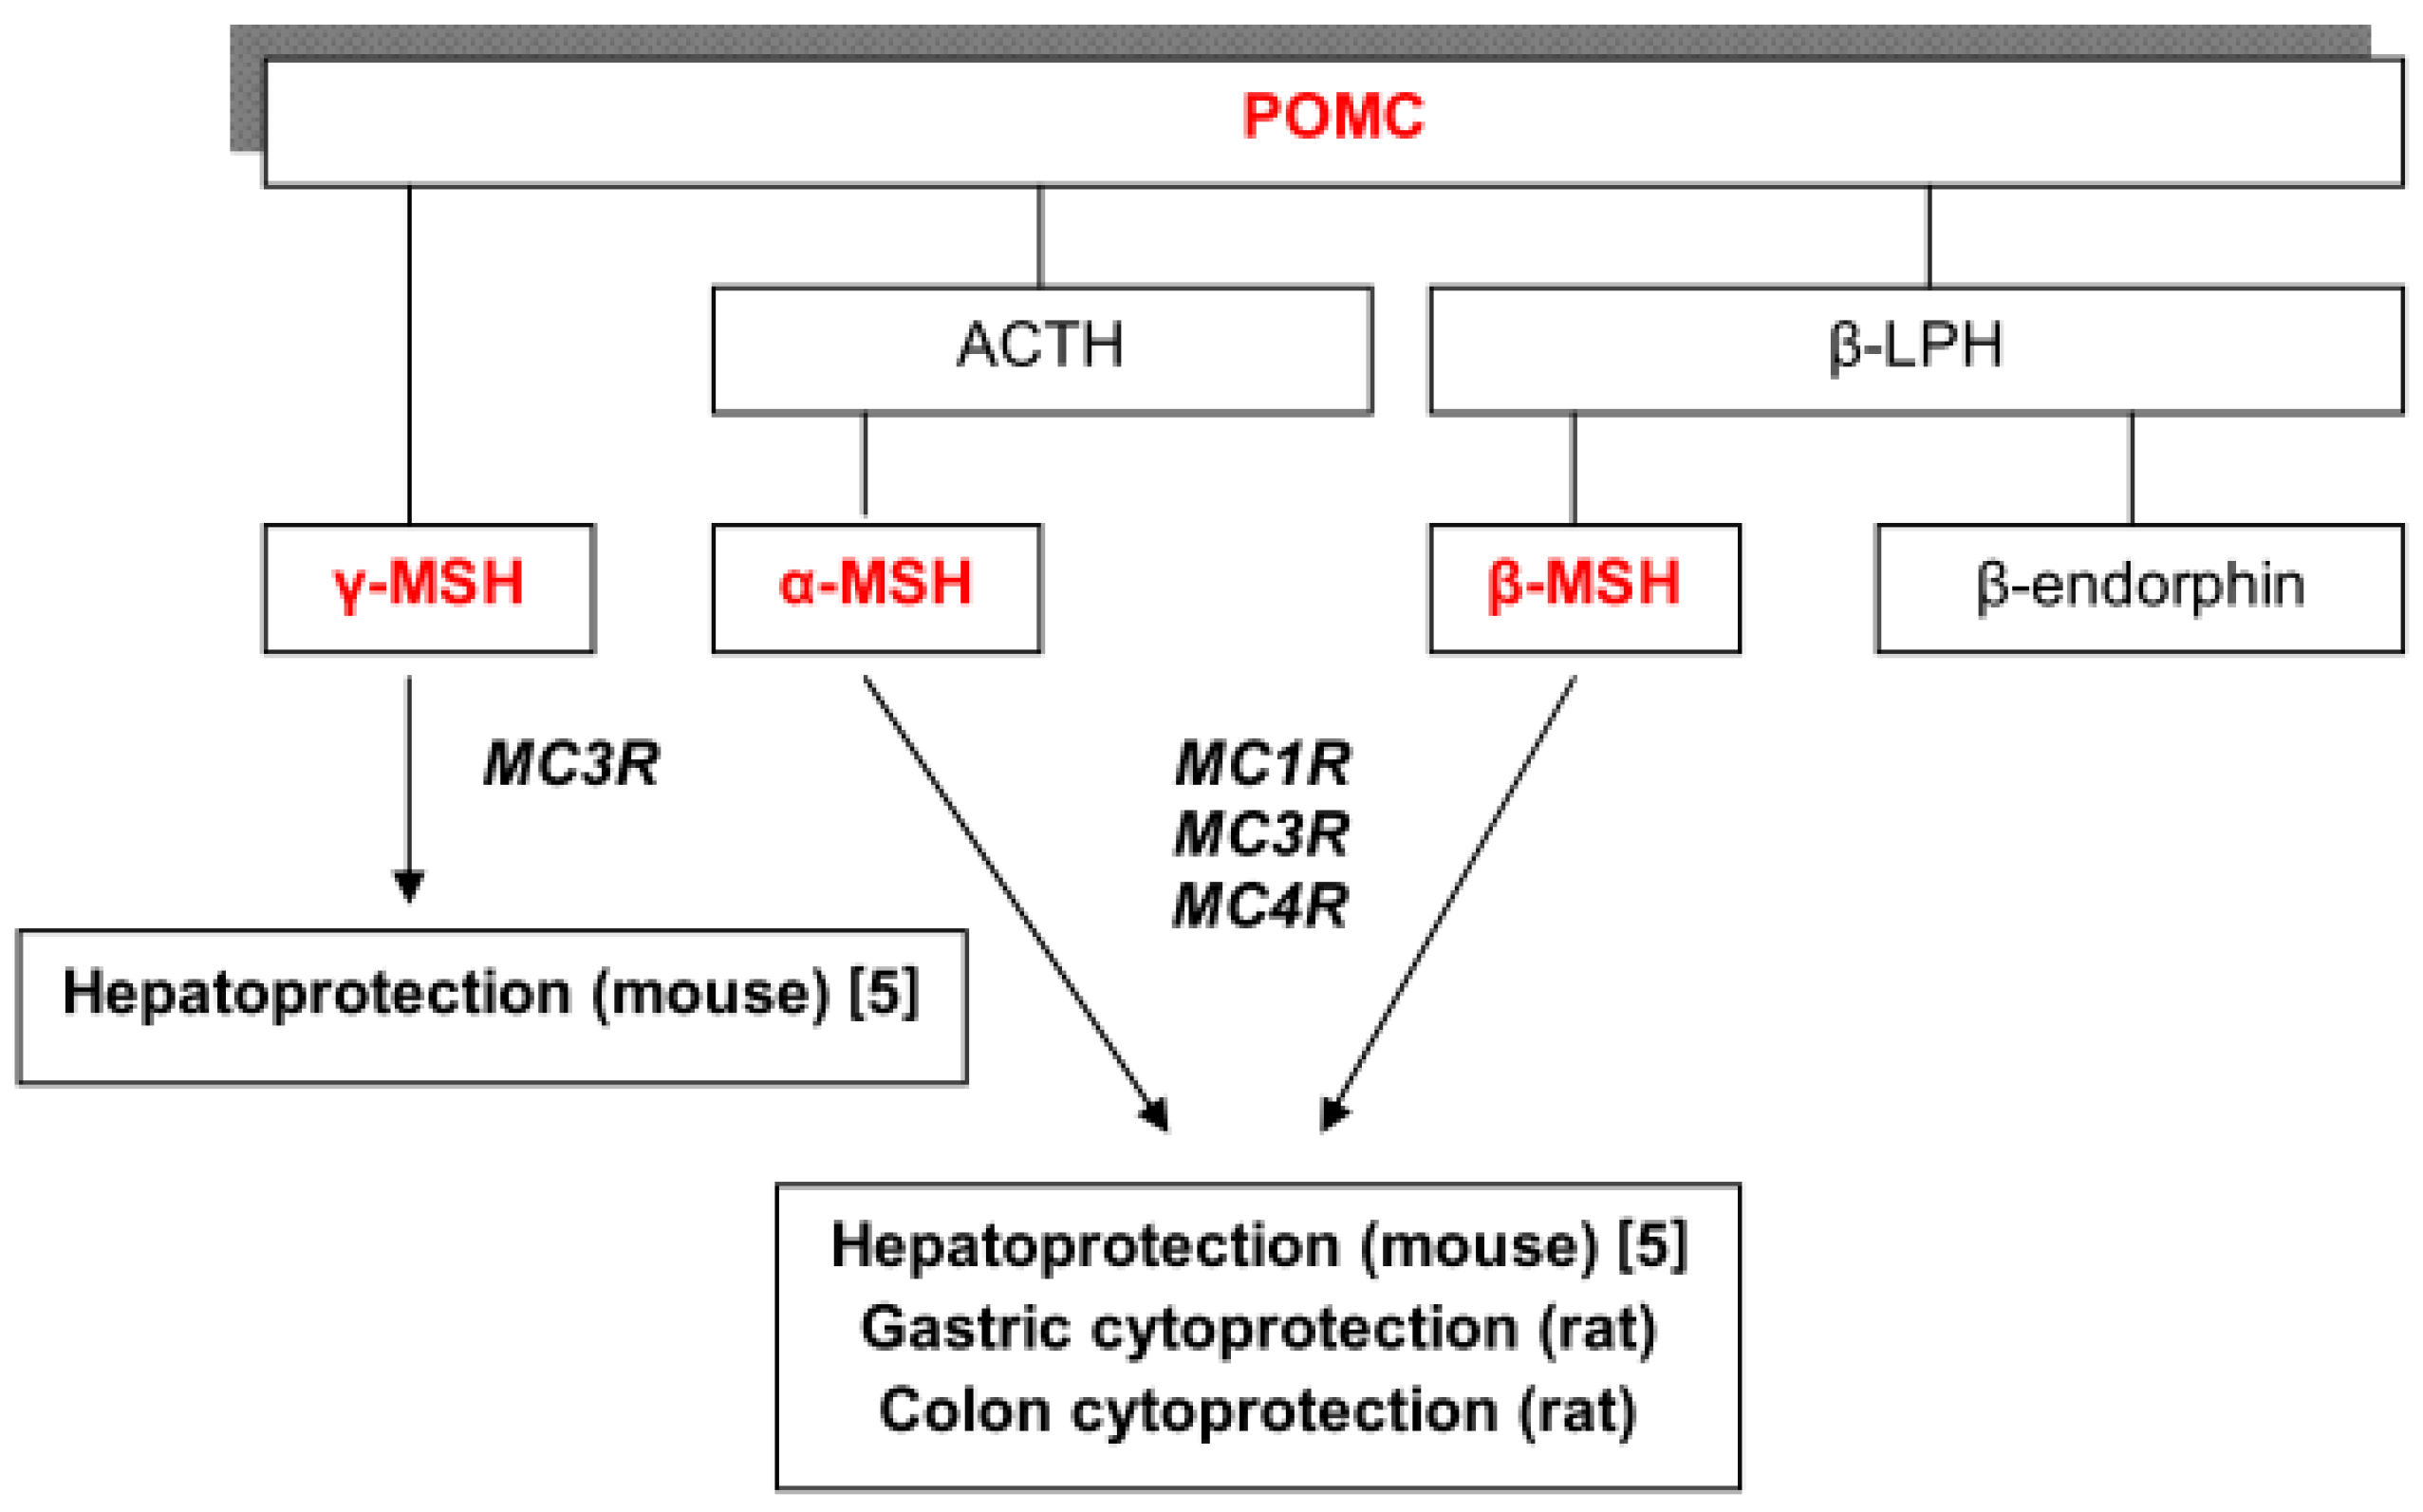
1. Introduction
2. Results and Discussion
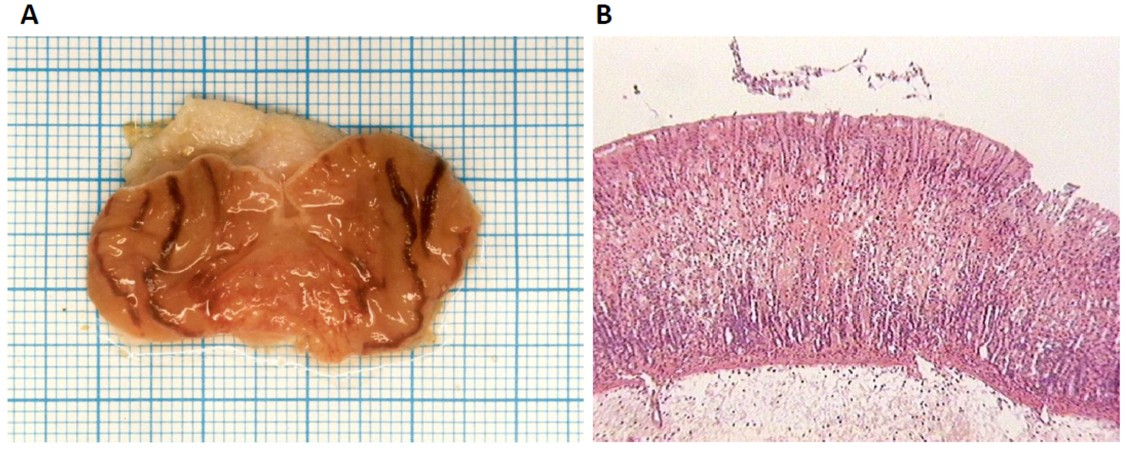
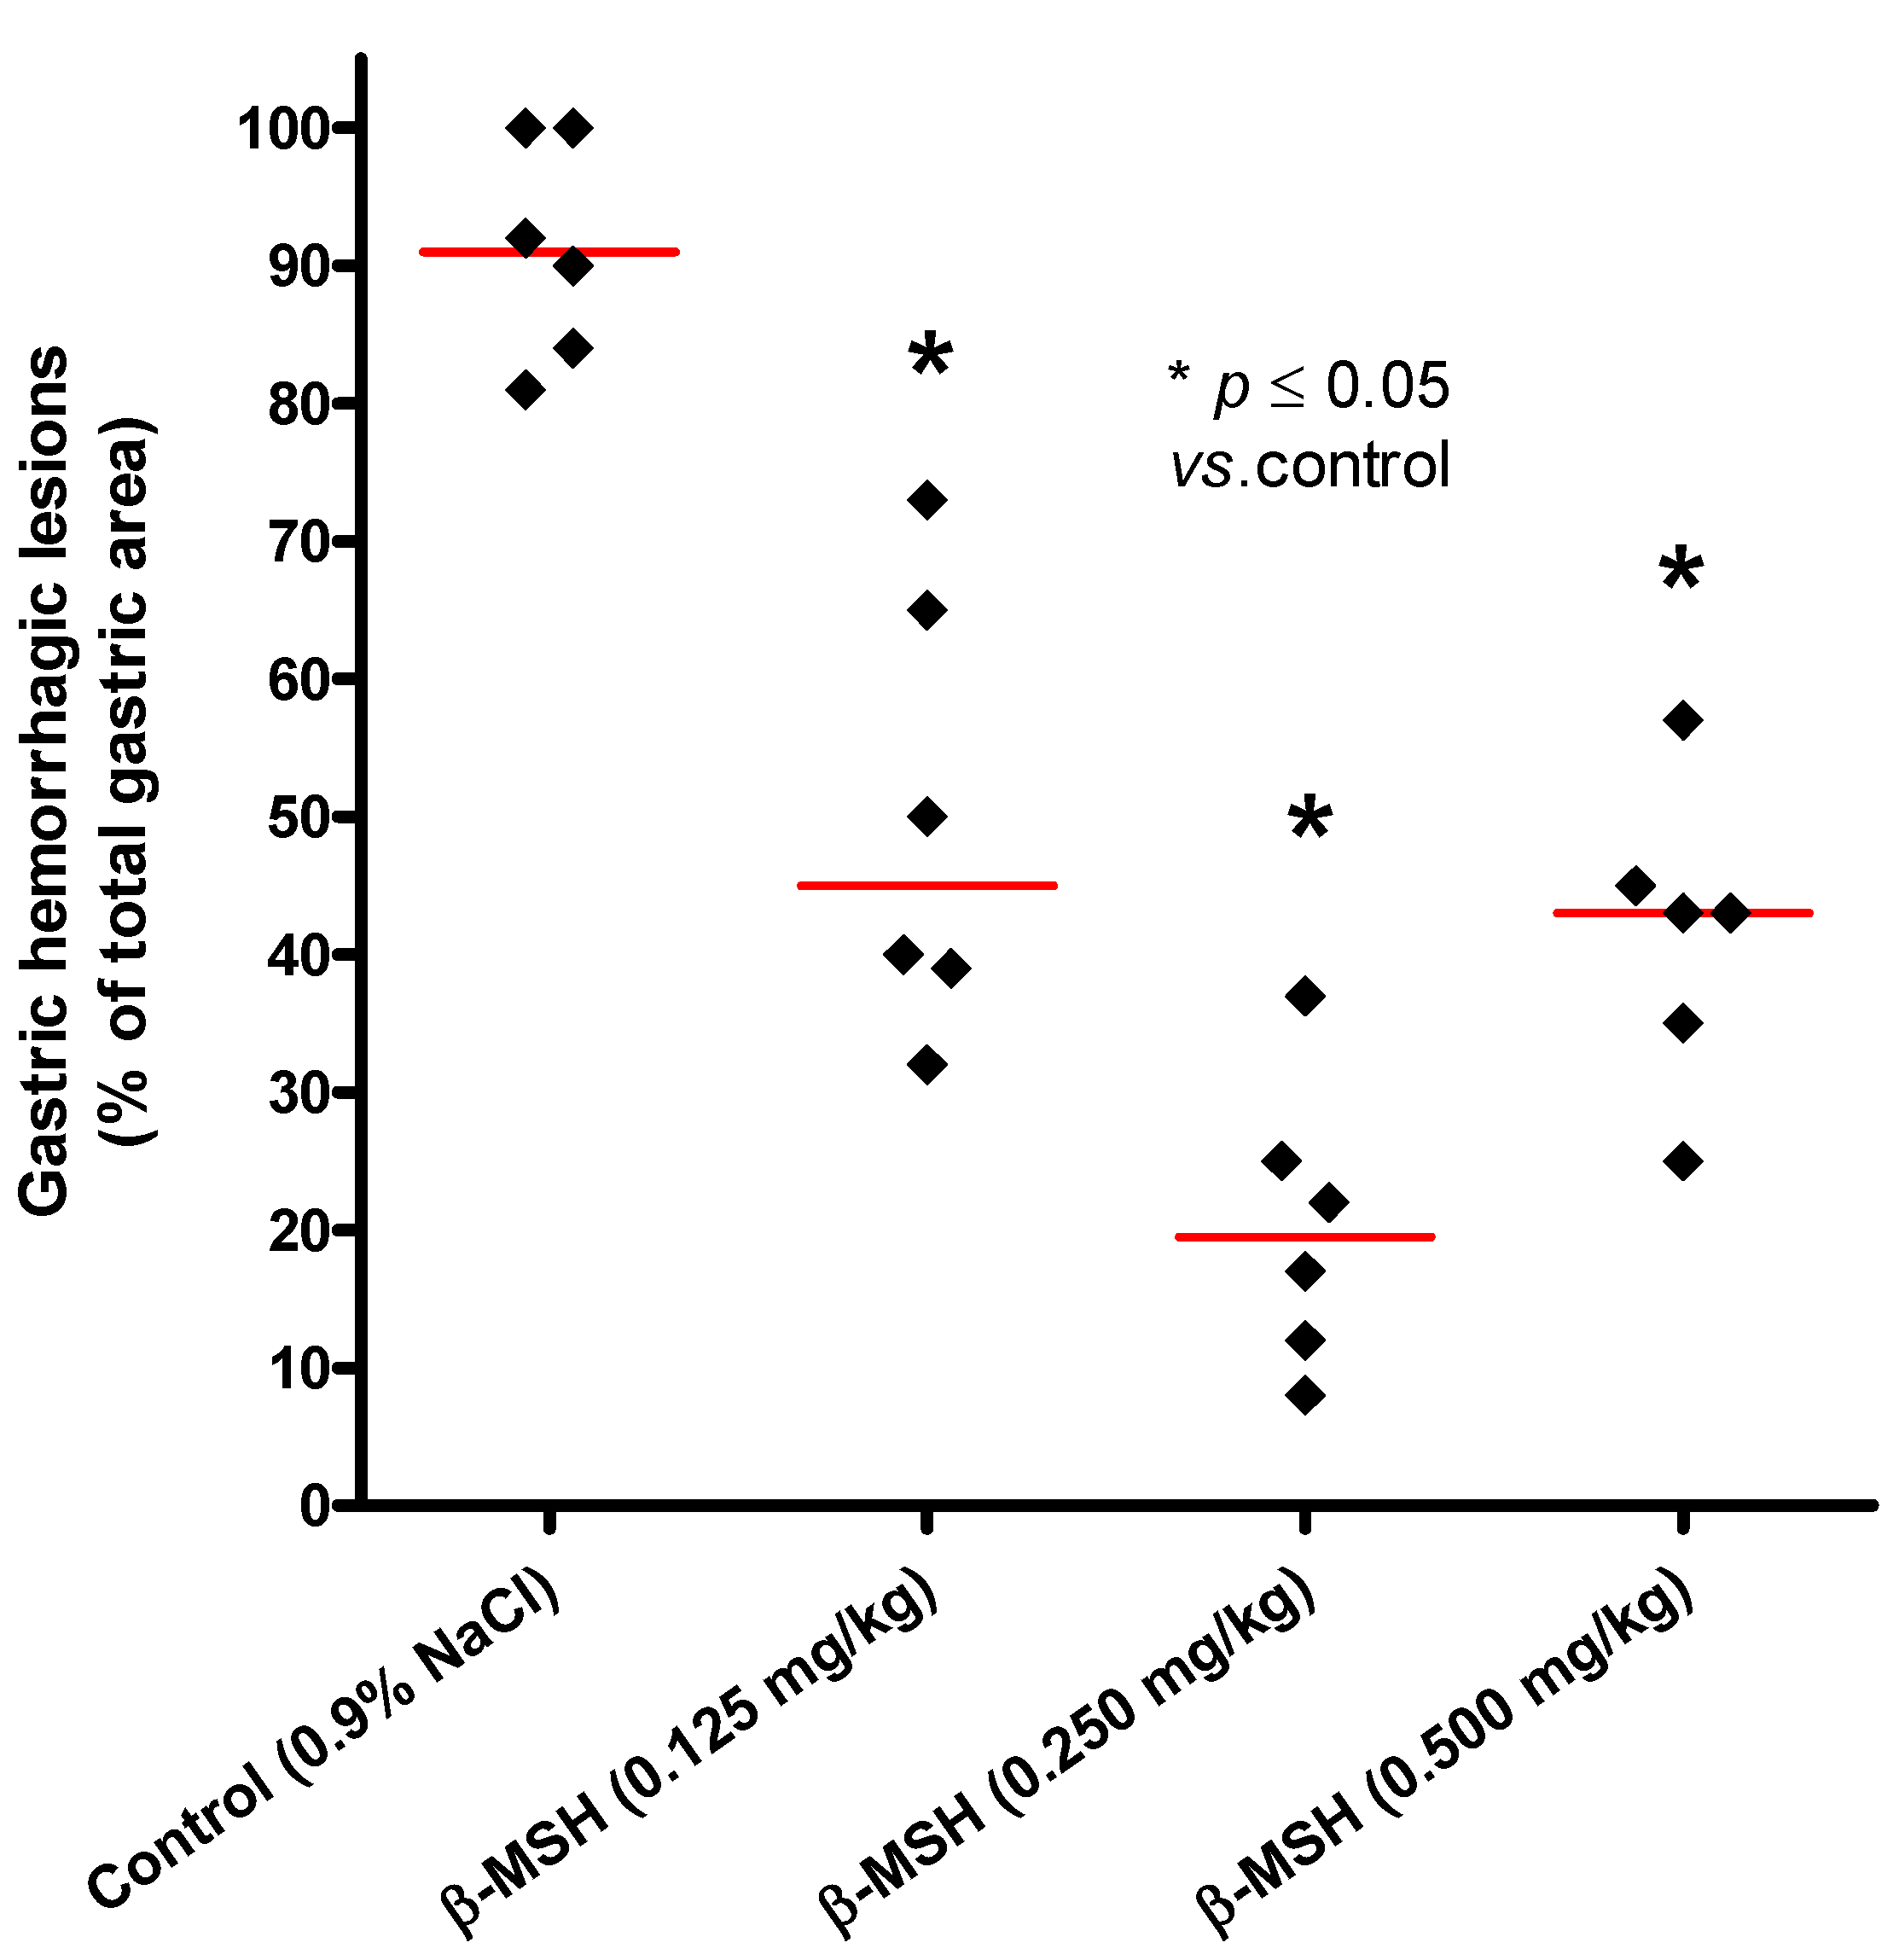
2.1. Cytoprotective Effect of β-MSH on Ethanol-Induced Gastritis

| Substance | i.p. dose | n | Mean | SD | Median | p value |
|---|---|---|---|---|---|---|
| Control | 0.9% NaCl | 6 | 91.20 | 7.91 | 91.0 | |
| β-MSH | 0.125 mg/kg | 6 | 49.80 | 16.12 | 45.0 | 0.011 |
| β-MSH | 0.250 mg/kg | 6 | 20.20 | 10.34 | 19.5 | 0.011 |
| β-MSH | 0.500 mg/kg | 6 | 41.00 | 11.90 | 43.0 | 0.017 |

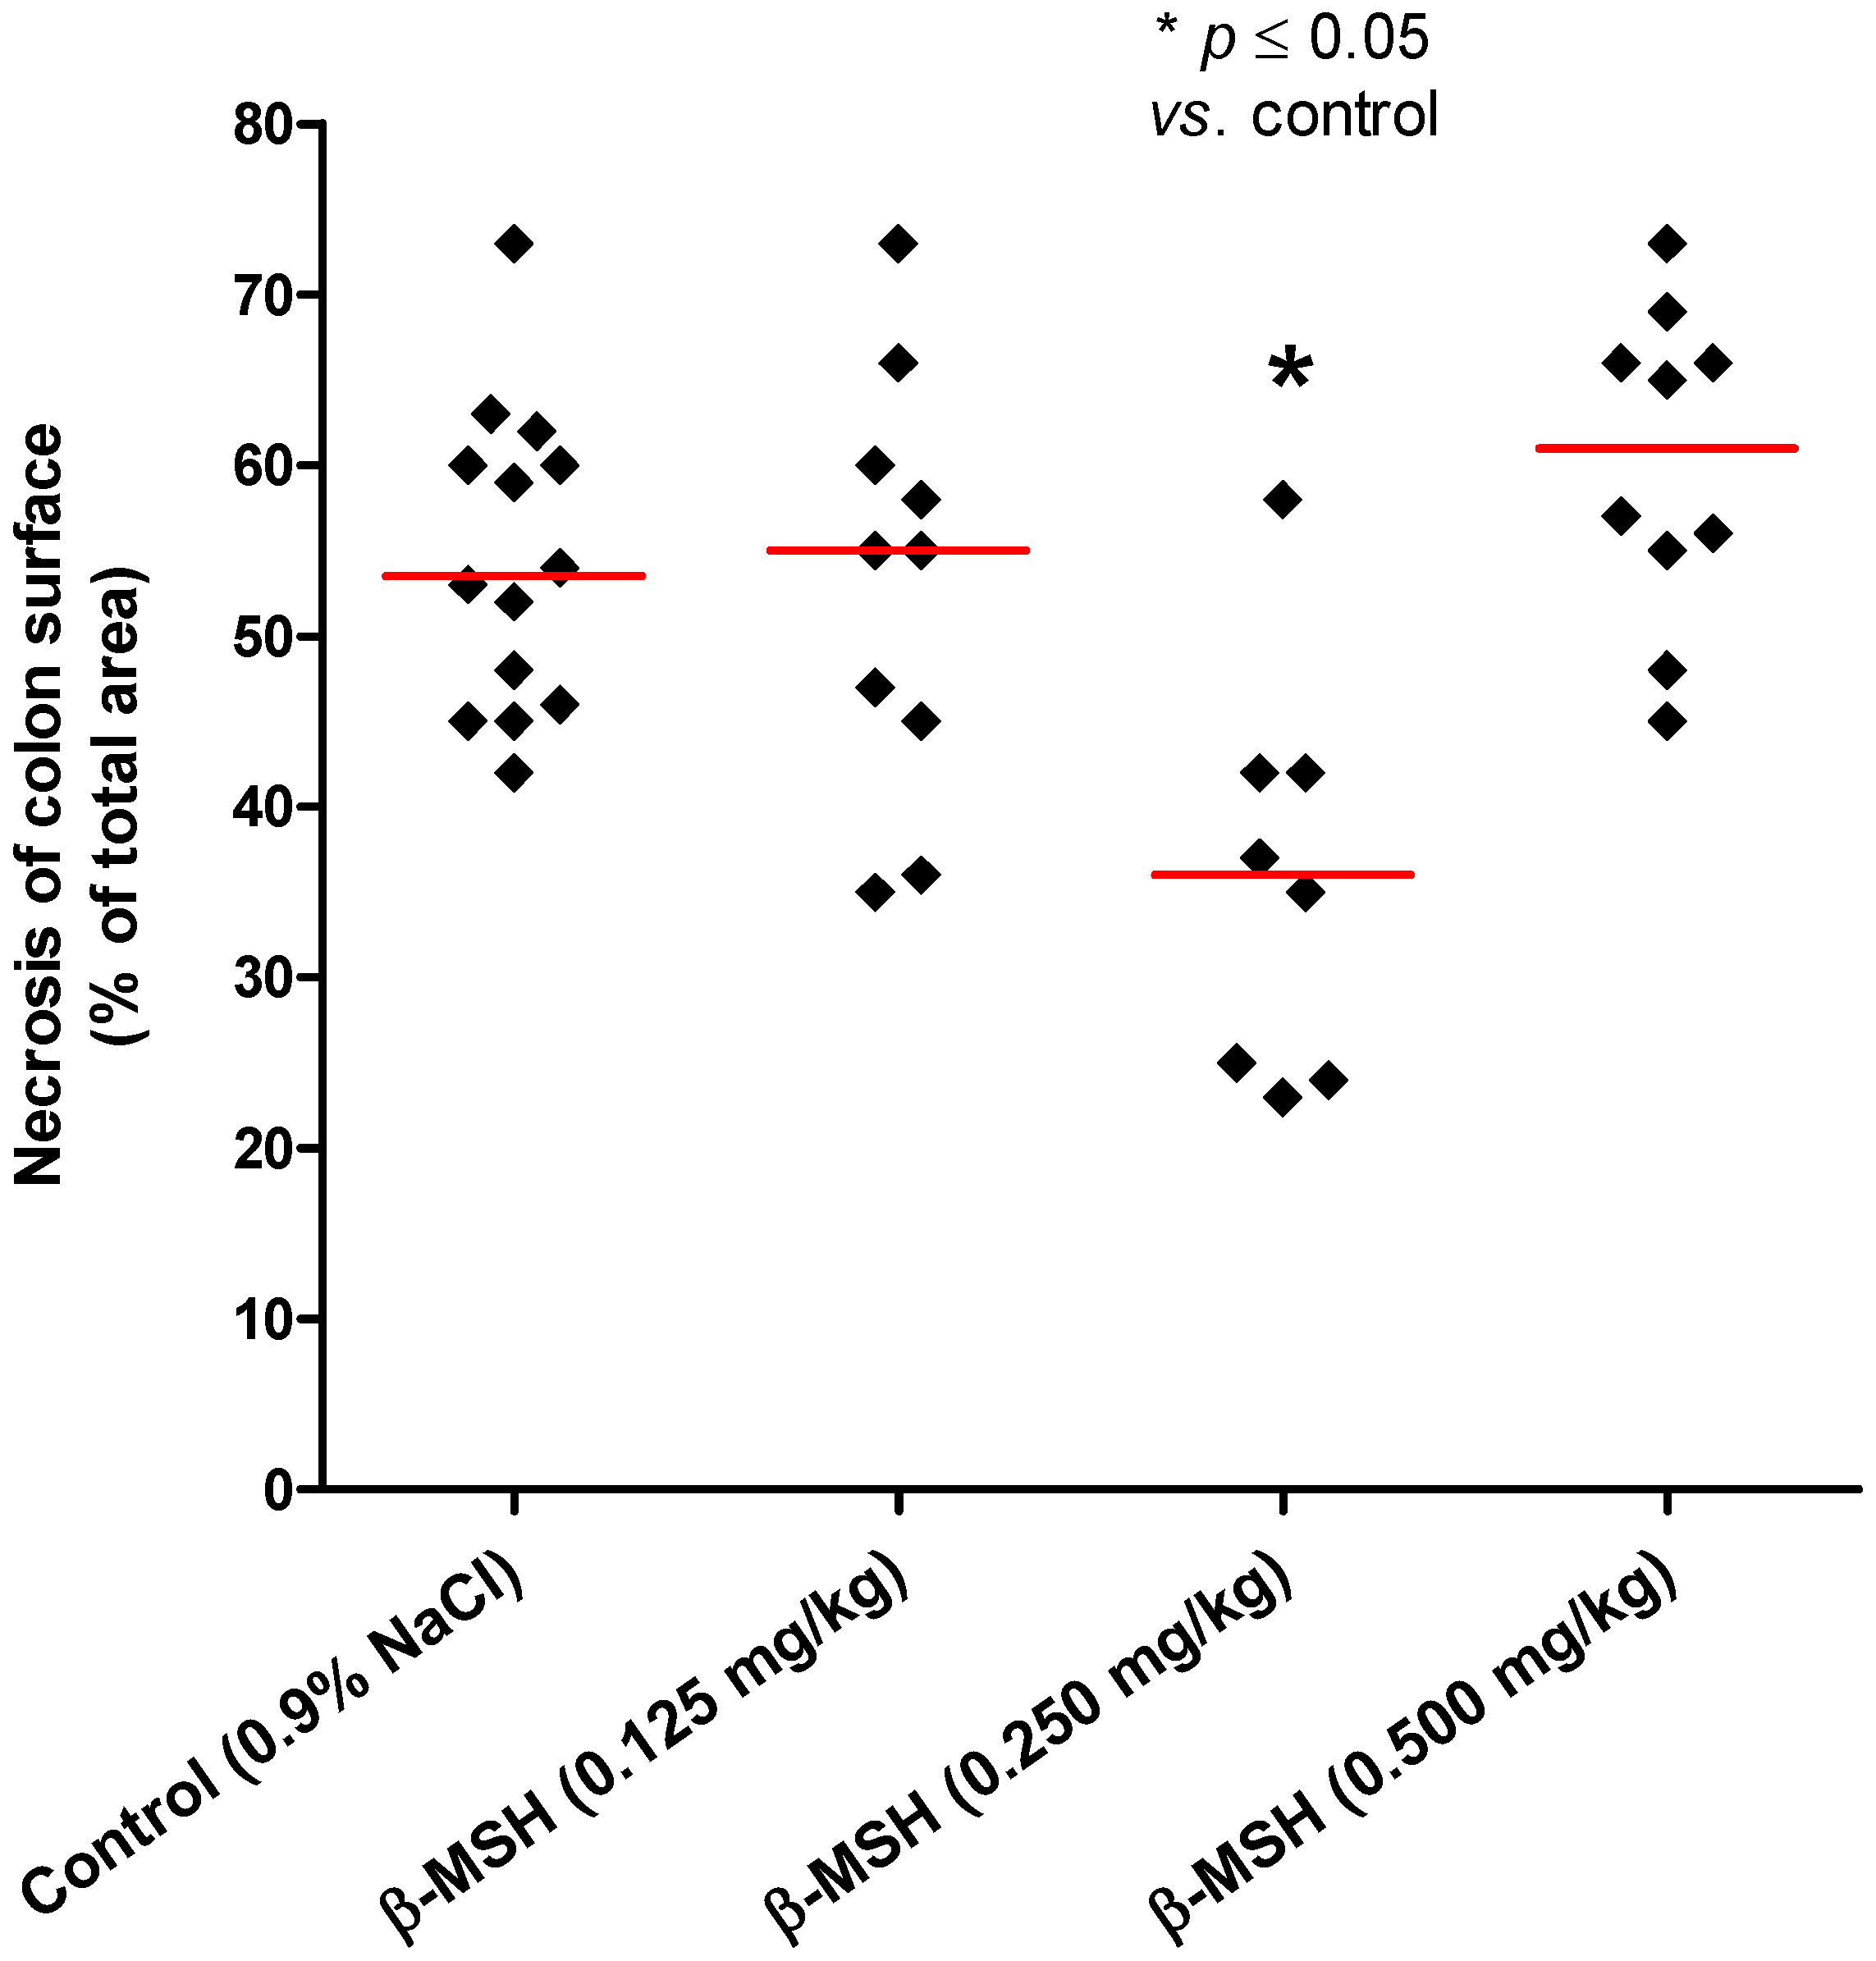
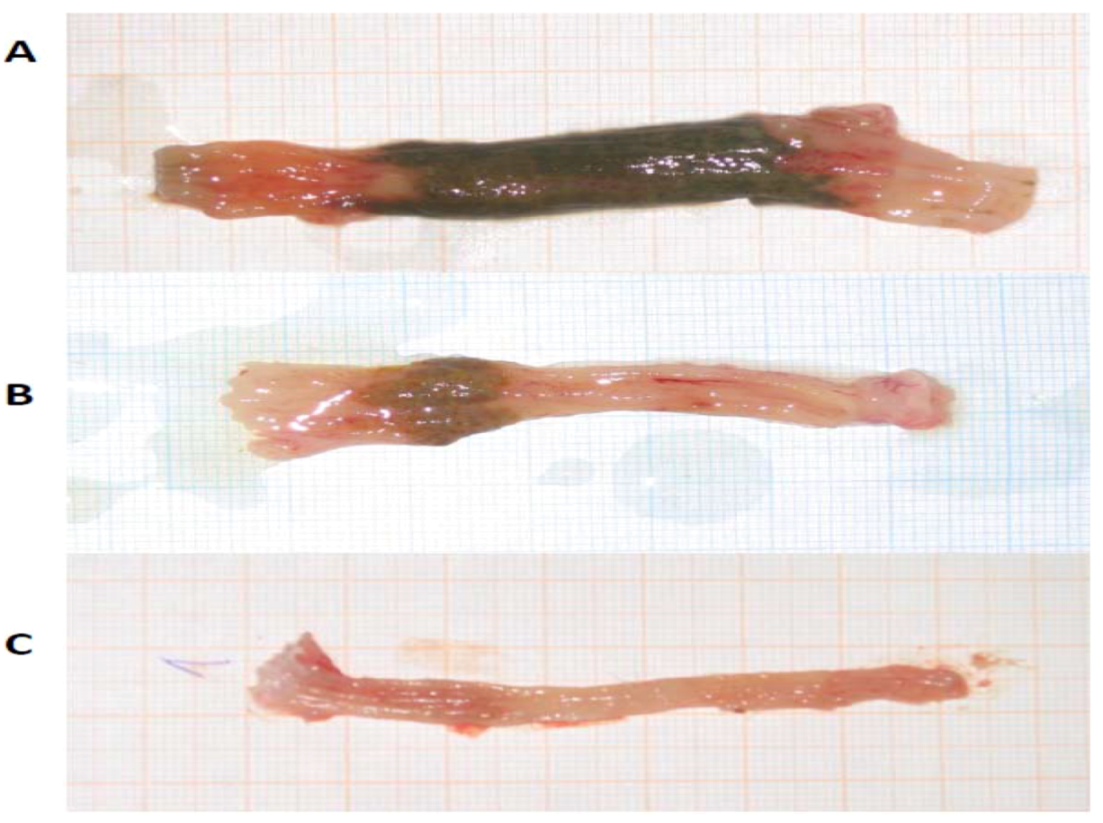
2.2. Cytoprotective and Antiinflammatory Effect of β-MSH on TNBS-Induced Colitis
| Substance | i.p. dose | n | Mean | SD | Median | p value |
|---|---|---|---|---|---|---|
| Control | 0.9% NaCl | 14 | 54.40 | 8.82 | 53.5 | |
| β-MSH | 0.125 mg/kg | 10 | 53.00 | 12.30 | 55.0 | 0.995 |
| β-MSH | 0.250 mg/kg | 8 | 35.75 | 11.90 | 36.0 | 0.004 |
| β-MSH | 0.500 mg/kg | 10 | 60.00 | 9.23 | 61.0 | 0.308 |
| Substance | i.p. dose | n | Individual scores | Mean | SD | Median | p value |
|---|---|---|---|---|---|---|---|
| Control | 0.9% NaCl | 14 | 3, 2, 3, 3, 2, 3, 3, 3, 3, 3, 3, 3, 3, 3 | 2.86 | 0.36 | 3.0 | |
| β-MSH | 0.125 mg/kg | 10 | 3, 2, 2, 3, 2, 3, 3, 3, 2, 3 | 2.60 | 0.52 | 3.0 | 0.376 |
| β-MSH | 0.250 mg/kg | 8 | 2, 2, 3, 1, 2, 2, 3, 2 | 2.13 | 0.64 | 2.0 | 0.013 |
| β-MSH | 0.500 mg/kg | 10 | 3, 3, 3, 2, 3, 3, 3, 3, 2, 3 | 2.80 | 0.42 | 3.0 | 0.972 |
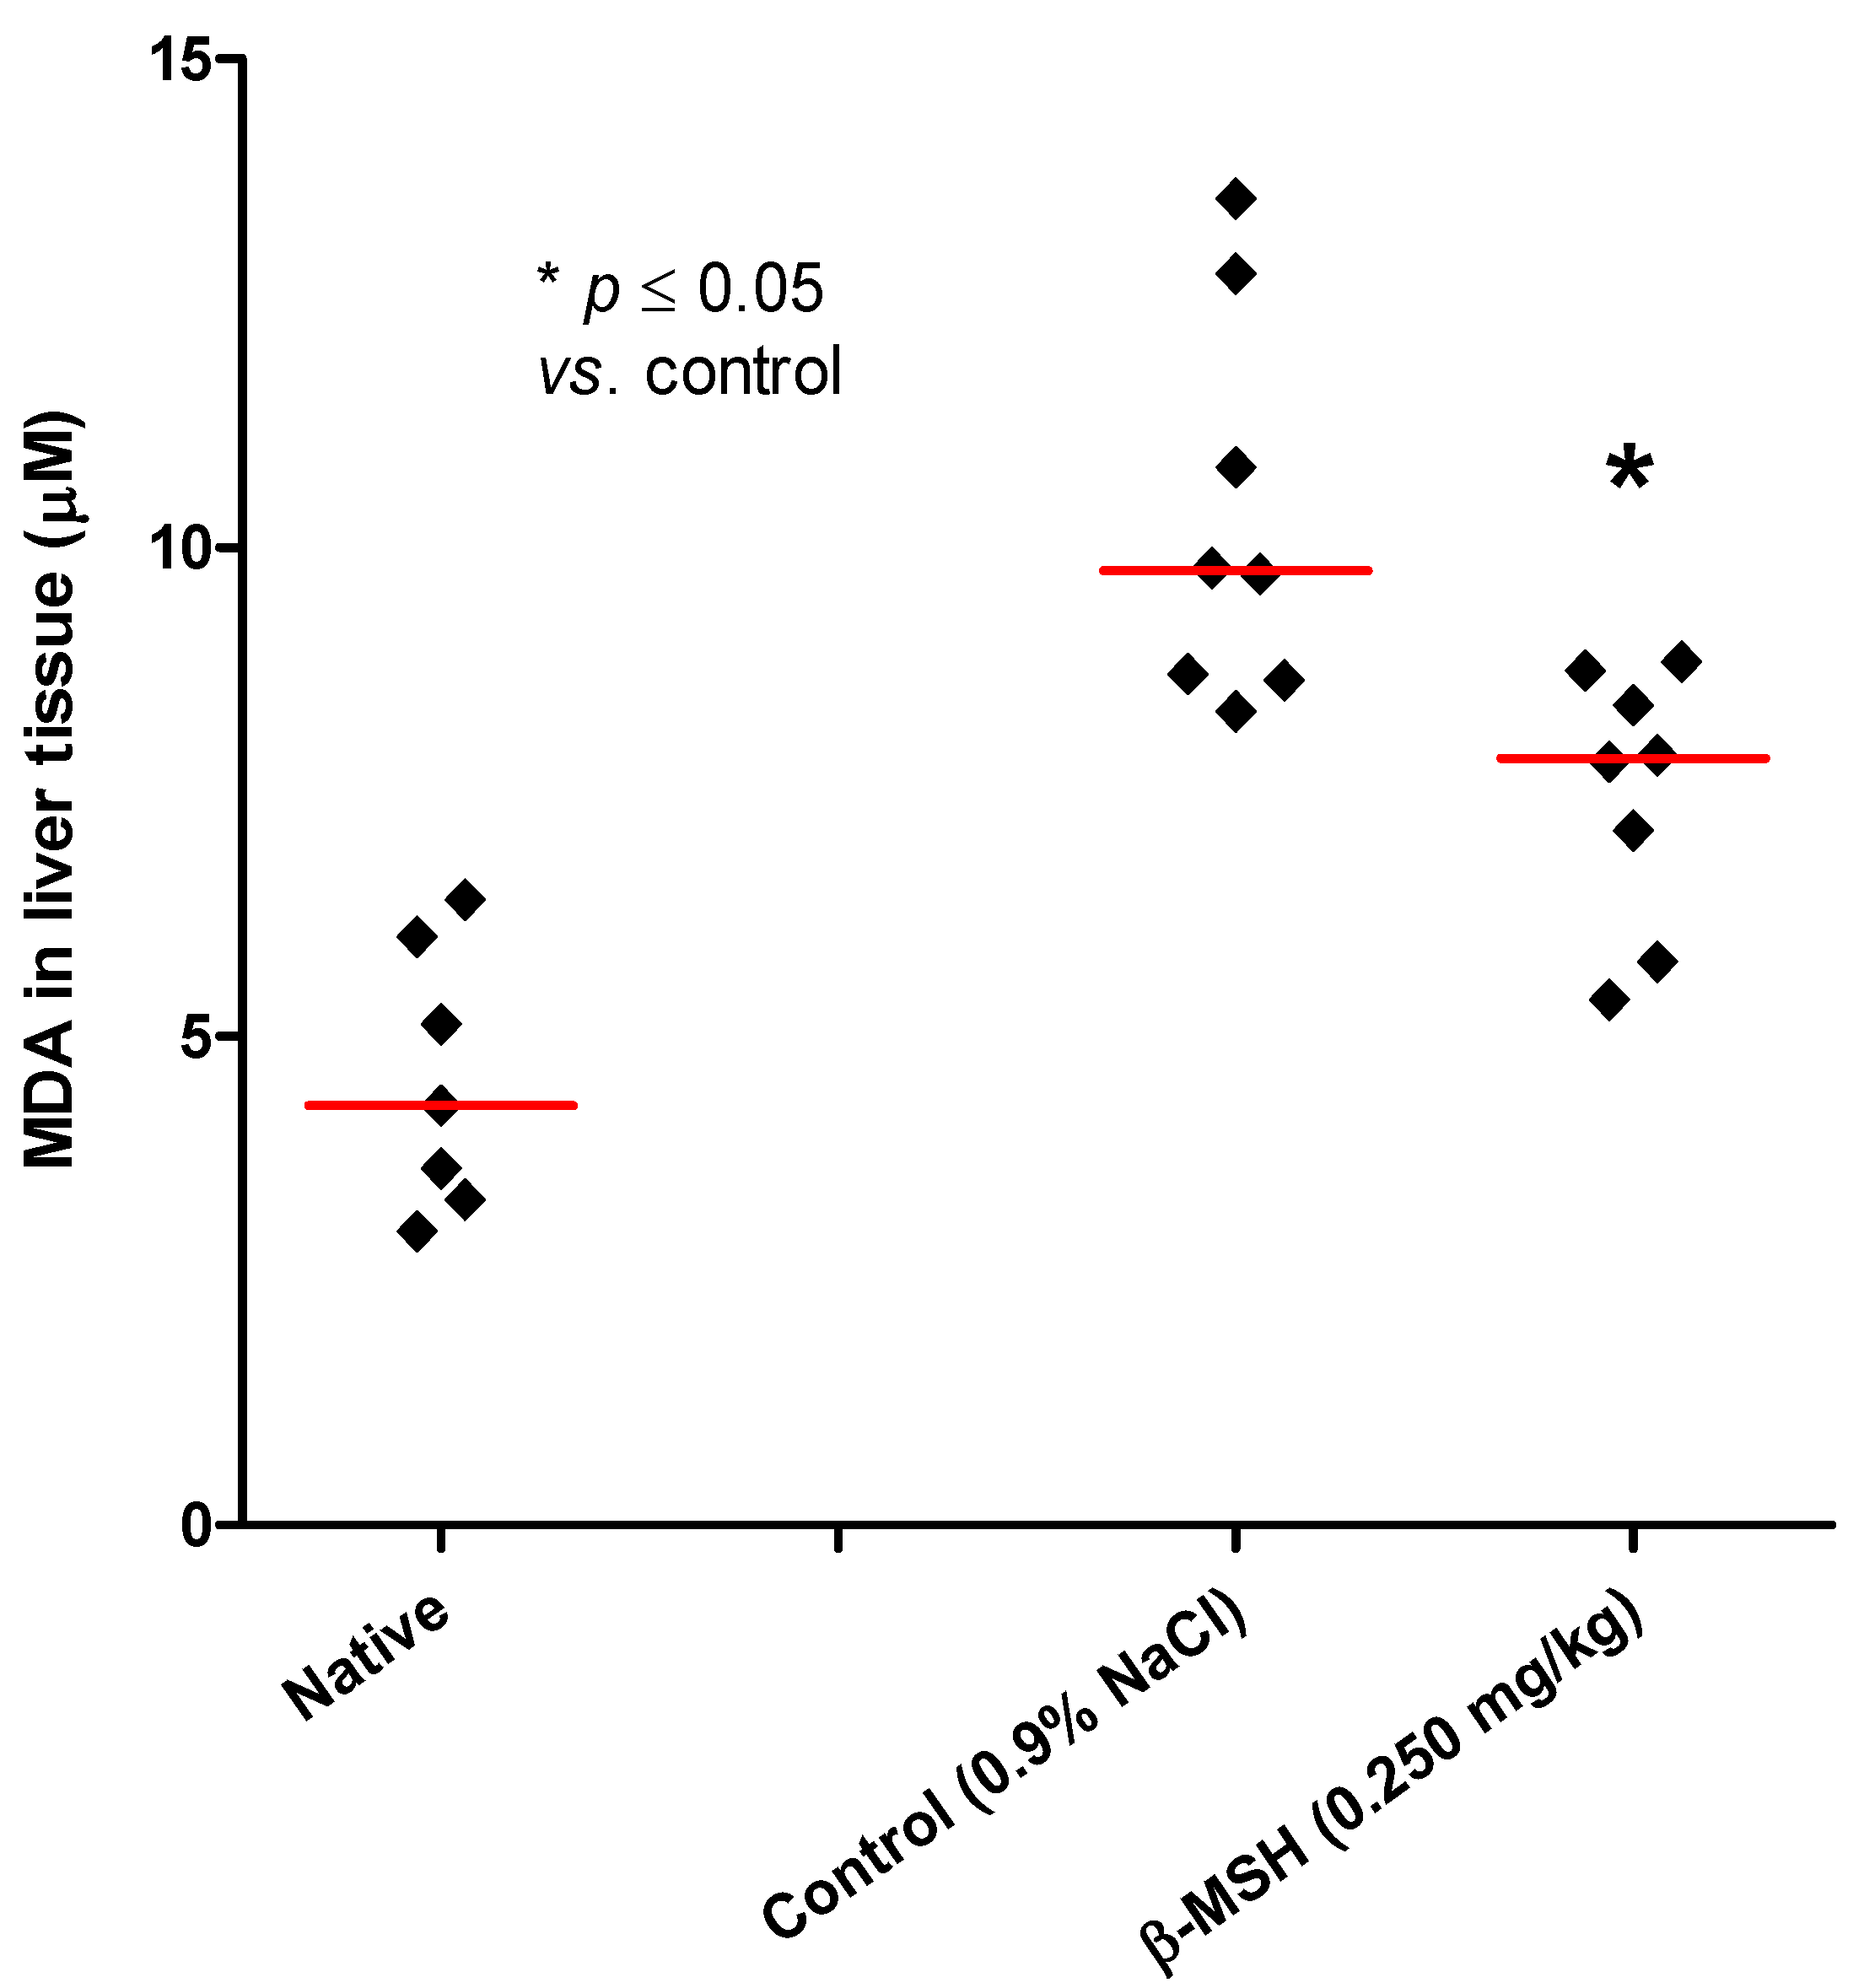
2.3. Evaluation of Systemic and Local Inflammation in TNBS-Induced Colitis
3. Experimental
3.1. Animals
3.2. Materials
- Synthetic β-melanocortin (β-MSH, AEKKDEGPYRMEHFRWGSPPKD, GenScript, Piscataway, NJ, USA, purity > 95%) was used at three doses: 0.125 mg, 0.250 mg and 0.500 mg per kilogram of body weight
- 2,4,6-trinitrobenzenesulphonic acid (TNBS, Sigma-Aldrich Inc., St. Louis, MO, USA) dissolved in 40% ethanol
- 96% ethanol (Kemika, Zagreb, Croatia)
- 0.9% NaCl
3.3. Treatment Regimen
3.4. Evaluation of Mucosal Lesions Damage

3.5. Macroscopic and Histopathological Estimation of Colon
3.6. Evaluation of Systemic Inflammation
3.7. Statistical Analysis
4. Conclusions
- The optimal protective dose ofβ-MSH in experimental colitis and gastritis model is 0.250mg/kg b.w.
- β-MSH acts as a cytoprotective agent in themodelof ethanol-induced gastritis, which can be seenas astatisticallysignificant reduction ofhemorrhagiclesions when compared to the controlgroup.
- In the model of TNBS-induced colitis β-MSH significantly reduced necrosis of the colonic mucosa and overalldegree ofinflammation, when comparedto the control group.
- The presentedresultsjustifyfurther research on β-MSH peptideanditsderivativesin the inflammatorygastrointestinal diseases, and point to the possibility of using them in studies of digestive system pharmacotherapy.
Acknowledgments
- Sample Availability: Not available.
References
- Catania, A.; Lonati, C.; Sordi, A.; Carlin, A.; Leonardi, P.; Gatti, S. The melanocortin system in control of inflammation. Sci. World J. 2010, 10, 1840–1853. [Google Scholar] [CrossRef]
- Brzoska, T.; Luger, T.A.; Maaser, C.; Abels, C.; Böhm, M. Alpha-melanocyte-stimulating hormone and related tripeptides: biochemistry, antiinflammatory and protective effects in vitro and in vivo, and future perspectives for the treatment of immune-mediated inflammatory diseases. Endocr. Rev. 2008, 29, 581–602. [Google Scholar] [CrossRef]
- Getting, S.J. Targeting melanocortin receptors as potential novel therapeutics. Pharmacol. Ther. 2006, 111, 1–15. [Google Scholar] [CrossRef]
- Catania, A. Neuroprotective actions of melanocortins: A therapeutic opportunity. Trends Neurosci. 2008, 31, 353–360. [Google Scholar] [CrossRef]
- Blagaić, V.; Houra, K.; Turčić, P.; Štambuk, N.; Konjevoda, P.; Boban-Blagaić, A.; Kelava, T.; Kos, M.; Aralica, G.; Čulo, F. The Influence of α-, β-, and γ-melanocyte stimulating hormone on acetaminophen induced liver lesions in male CBA mice. Molecules 2010, 15, 1232–1241. [Google Scholar] [CrossRef]
- Turčić, P.; Bradamante, M.; Houra, K.; Štambuk, N.; Kelava, T.; Konjevoda, P.; Kazazić, S.; Vikić-Topić, D.; Pokrić, B. Effects of α-melanocortin enantiomers on acetaminophen-induced hepatotoxicity in CBA mice. Molecules 2009, 14, 5017–5026. [Google Scholar] [CrossRef]
- Lipton, J.M.; Catania, A. Anti-inflamatory actions of the neuroimmunomodulator α-MSH. Immunol. Today 1997, 18, 140–145. [Google Scholar] [CrossRef]
- Konjevoda, P.; Štambuk, N.; Aralica, G.; Pokrić, B. Cytoprotective effects of met-enkephalin and α-MSH on ethanol induced gastric lesions in rats. J. Physiol. Paris 2001, 95, 277–281. [Google Scholar] [CrossRef]
- Tješić-Drinković, D.; Tješić-Drinković, Do.; Štambuk, N.; Konjevoda, P.; Votava-Raić, A.; Vinković, M. Alpha-melanocyte stimulating hormone reduces colonic damage in rat model of inflammatory bowel disease. Croat. Chem. Acta 2005, 78, 535–539. [Google Scholar]
- Houra, K.; Turčić, P.; Gabričević, M.; Weitner, T.; Konjevoda, P.; Štambuk, N. Interaction of α-melanocortin and its pentapeptide antisense LVKAT: Effects on hepatoprotection in male CBA mice. Molecules 2011, 16, 7331–7343. [Google Scholar] [CrossRef]
- Konjevoda, P.; Štambuk, N.; Tješić-Drinković, D.; Tješić-Drinković, Do.; Gotovac, N.; Ježek, D; Vikić-Topić, D.; Votava-Raić, A. Effect of α-MSH on experimentally induced mucosal injury of rat gastrointestinal system. Period Biol. 2004, 106, 355–359. [Google Scholar]
- Luger, T.A.; Scholzen, T.; Brzoska, T.; Becher, E.; Slominski, A.; Paus, R. Cutaneous immunomodulation and coordination of skin stress responses by alpha-melanocyte-stimulating hormone. Ann. NY Acad. Sci. 1998, 840, 381–394. [Google Scholar] [CrossRef]
- Spencer, J.D.; Schallreuter, K.U. Regulation of pigmentation in human epidermal melanocytes by functional high-affinity ß-melanocyte-stimulating hormone/melanocortin-4 receptor signaling. Endocrinology 2009, 150, 1250–1258. [Google Scholar]
- Muceniece, R.; Zvejniece, L.; Liepinsh, E.; Kirjanova, O.; Baumane, L.; Petrovska, R. The MC3 receptor binding affinity of melanocortins correlates with the nitric oxide production inhibition in mice brain inflammation model. Peptides 2006, 27, 1443–1450. [Google Scholar] [CrossRef]
- Muceniece, R.; Zvejniece, L.; Kirjanova, O.; Liepinsh, E.; Krigere, L.; Vilskersts, R. Beta-MSH inhibits brain inflammation via MC(3)/(4) receptors and impaired NF-kappaB signaling. J. Neuroimmunol. 2005, 169, 13–19. [Google Scholar] [CrossRef]
- Muceniece, R.; Zvejniece, L.; Kirjanova, O.; Liepinsh, E.; Krigere, L.; Baumane, L. β- and γ- melanocortins inhibit lipopolysaccharide induced nitric oxide production in mice brain. Brain Res. 2004, 995, 7–13. [Google Scholar] [CrossRef]
- Cone, R.D. Anatomy and regulation of the central melanocortin system. Nat. Neurosci. 2006, 8, 571–557. [Google Scholar] [CrossRef]
- Ellacott, K.L.J.; Cone, R.D. The role of the central melanocortin system in the regulation of food intake and energy homeostasis: lessons from mouse models. Phil. Trans. R. Soc. B 2006, 361, 1265–1274. [Google Scholar] [CrossRef]
- Bickel, M.; Herling, A.W. Activity on the gastrointestinal tract. In Handbook of Drug Discovery: Pharmacological Assays, 3rd; Vogel, H.G., Ed.; Springer-Verlag: Berlin, Germany, 2008; pp. 1191–1322. [Google Scholar]
- Kastin, A.J.; Pan, W. Peptides and hormesis. Crit. Rev. Toxicol. 2008, 38, 629–631. [Google Scholar] [CrossRef]
- Elson, C.O.; Weaver, C.T. In vivo models of inflammatory bowel disease. In Inflammatory Bowel Disease: Translating Basic Science into Clinical Practice; Targan, S.R., Shanahan, F., Karp, L.C., Eds.; Wiley-Blackwell: Oxford, UK, 2010; pp. 25–51. [Google Scholar]
- Cho, C.H.; Ko, J.K.S. Herbal medicines and animal models of gastrointestinal diseases. In Drug Discovery Handbook; Gad, S.C., Ed.; Willey: Hoboken, NJ, USA, 2005; pp. 1013–1036. [Google Scholar]
- Catania, A.; Lipton, J.M. The neuropeptide alpha MSH: A key component of neuroimmunomodulation. Neuroimmunomodul 1994, 1, 93–99. [Google Scholar] [CrossRef]
- Catania, A.; Gatti, S.; Colombo, G.; Lipton, J.M. Targeting melanocortin receptors as a novel strategy to control inflammation. Pharmacol. Rev. 2004, 56, 1–29. [Google Scholar]
- Kucuk, C.; Sozuer, E.; Gursoy, S.; Canoz, O.; Artis, T.; Akcan, A.; Akyildiz, H.; Muhtaroglu, S. Treatment with Met-RANTES decreases bacterial translocation in experimental colitis. Am. J. Surg. 2006, 191, 77–83. [Google Scholar] [CrossRef]
- Masubuchi, Y.; Enoki, K.; Horie, T. Down-regulation of hepatic cytochrome P450 enzymes in rats with trinitrobenzene sulfonic acid-induced colitis. Drug Metab. Dispos. 2008, 36, 597–603. [Google Scholar]
- Guerard, F. Lipid peroxidation originating α,β-unsaturated aldehydes and their metabolites as biomarkers. In Biomarkers for Antioxidant Defense and Oxidative Damage; Aldini, G., Yeum, K.J., Niki, E., Russell, R.M., Eds.; Wiley-Blackwell: London, UK, 2010; pp. 117–135. [Google Scholar]
- Roulin, A.; Ducrest, A.-L. Association between melanism, physiology and behaviour: A role for the melanocortin system. Eur. J. Pharmacol. 2011, 660, 226–233. [Google Scholar] [CrossRef]
- Maaser, C.; Kannengiesser, K.; Specht, C.; Lugering, A.; Brzoska, T.; Luger, T.A.; Domschke, W.D.; Kucharzik, T. Crucial role of the melanocortin receptor MC1R in experimental colitis. Gut 2006, 55, 1415–1422. [Google Scholar] [CrossRef]
- National Institutes of Health. JImage. Available online: http://www.jimage-analysr.org/ (accessed on 7 June 2012).
- GraphPad Software, San Diego, CA, USA. Available online: http://www.graphpad.com/ (accessed on 7 June 2012).
- KyensLab Inc, Tokyo, Japan. Available online: http://www.kyenslab.com/ (accessed on 7 June 2012).
© 2012 by the authors; licensee MDPI, Basel, Switzerland. This article is an open-access article distributed under the terms and conditions of the Creative Commons Attribution license (http://creativecommons.org/licenses/by/3.0/).
Share and Cite
Bradamante, M.; Turčić, P.; Štambuk, N.; Konjevoda, P.; Aralica, G.; Alerić, I.; Kozmar, A. Cytoprotective Effects of β-Melanocortin in the Rat Gastrointestinal Tract. Molecules 2012, 17, 11680-11692. https://doi.org/10.3390/molecules171011680
Bradamante M, Turčić P, Štambuk N, Konjevoda P, Aralica G, Alerić I, Kozmar A. Cytoprotective Effects of β-Melanocortin in the Rat Gastrointestinal Tract. Molecules. 2012; 17(10):11680-11692. https://doi.org/10.3390/molecules171011680
Chicago/Turabian StyleBradamante, Mirna, Petra Turčić, Nikola Štambuk, Paško Konjevoda, Gorana Aralica, Ivan Alerić, and Ana Kozmar. 2012. "Cytoprotective Effects of β-Melanocortin in the Rat Gastrointestinal Tract" Molecules 17, no. 10: 11680-11692. https://doi.org/10.3390/molecules171011680
APA StyleBradamante, M., Turčić, P., Štambuk, N., Konjevoda, P., Aralica, G., Alerić, I., & Kozmar, A. (2012). Cytoprotective Effects of β-Melanocortin in the Rat Gastrointestinal Tract. Molecules, 17(10), 11680-11692. https://doi.org/10.3390/molecules171011680