1. Introduction
Atherosclerosis is one of the leading causes of mortality in industrialized and developing nations. It is a progressive disease that is characterized by the accumulation of lipid-rich plaques within the walls of arteries [
1]. Long-term clinical studies have shown that plasma concentrations of high density lipoprotein (HDL) cholesterol (HDL-C) are inversely proportional to the risk for atherosclerotic cardiovascular disease. One of the major atheroprotective actions of HDL particles involves the transport of excess cholesterol from peripheral tissues to the liver for excretion, a process known as reverse cholesterol transport (RCT) [
2]. HDL-mediated RCT represents a major target for the development of innovative antiatherogenic strategies to reduce the risk of atherosclerotic cardiovascular disease.
Scavenger receptor class B type I (SR-BI) is the first molecularly well-defined HDL receptor in mice [
3], and its human homologue is CD36 and Lysosomal integral membrane protein-II Analogous-1 (CLA-1) [
4]. SR-BI/CLA-1 plays an important role in RCT by mediating selective uptake of cholesteryl ester from peripheral tissues to the liver. The discovery of up-regulators of CLA-1 expression may benefit the further study of the mechanism of action of CLA-1 in human atherosclerotic cardiovascular diseases and might have pharmacologic applications [
5].
To obtain active compounds that can increase CLA-1 transcriptional level in liver cells, we developed a cell-based reporter assay applicable for high-throughput screening (HTS) [
6]. Using this assay trichostatin A (TSA) was found to prominently up-regulate CLA-1 transcriptional activity [
7]. Suberoylanilide hydroxamic acid (SAHA), an analogue of TSA, was also found to up-regulate CLA-1 transcriptional activity [
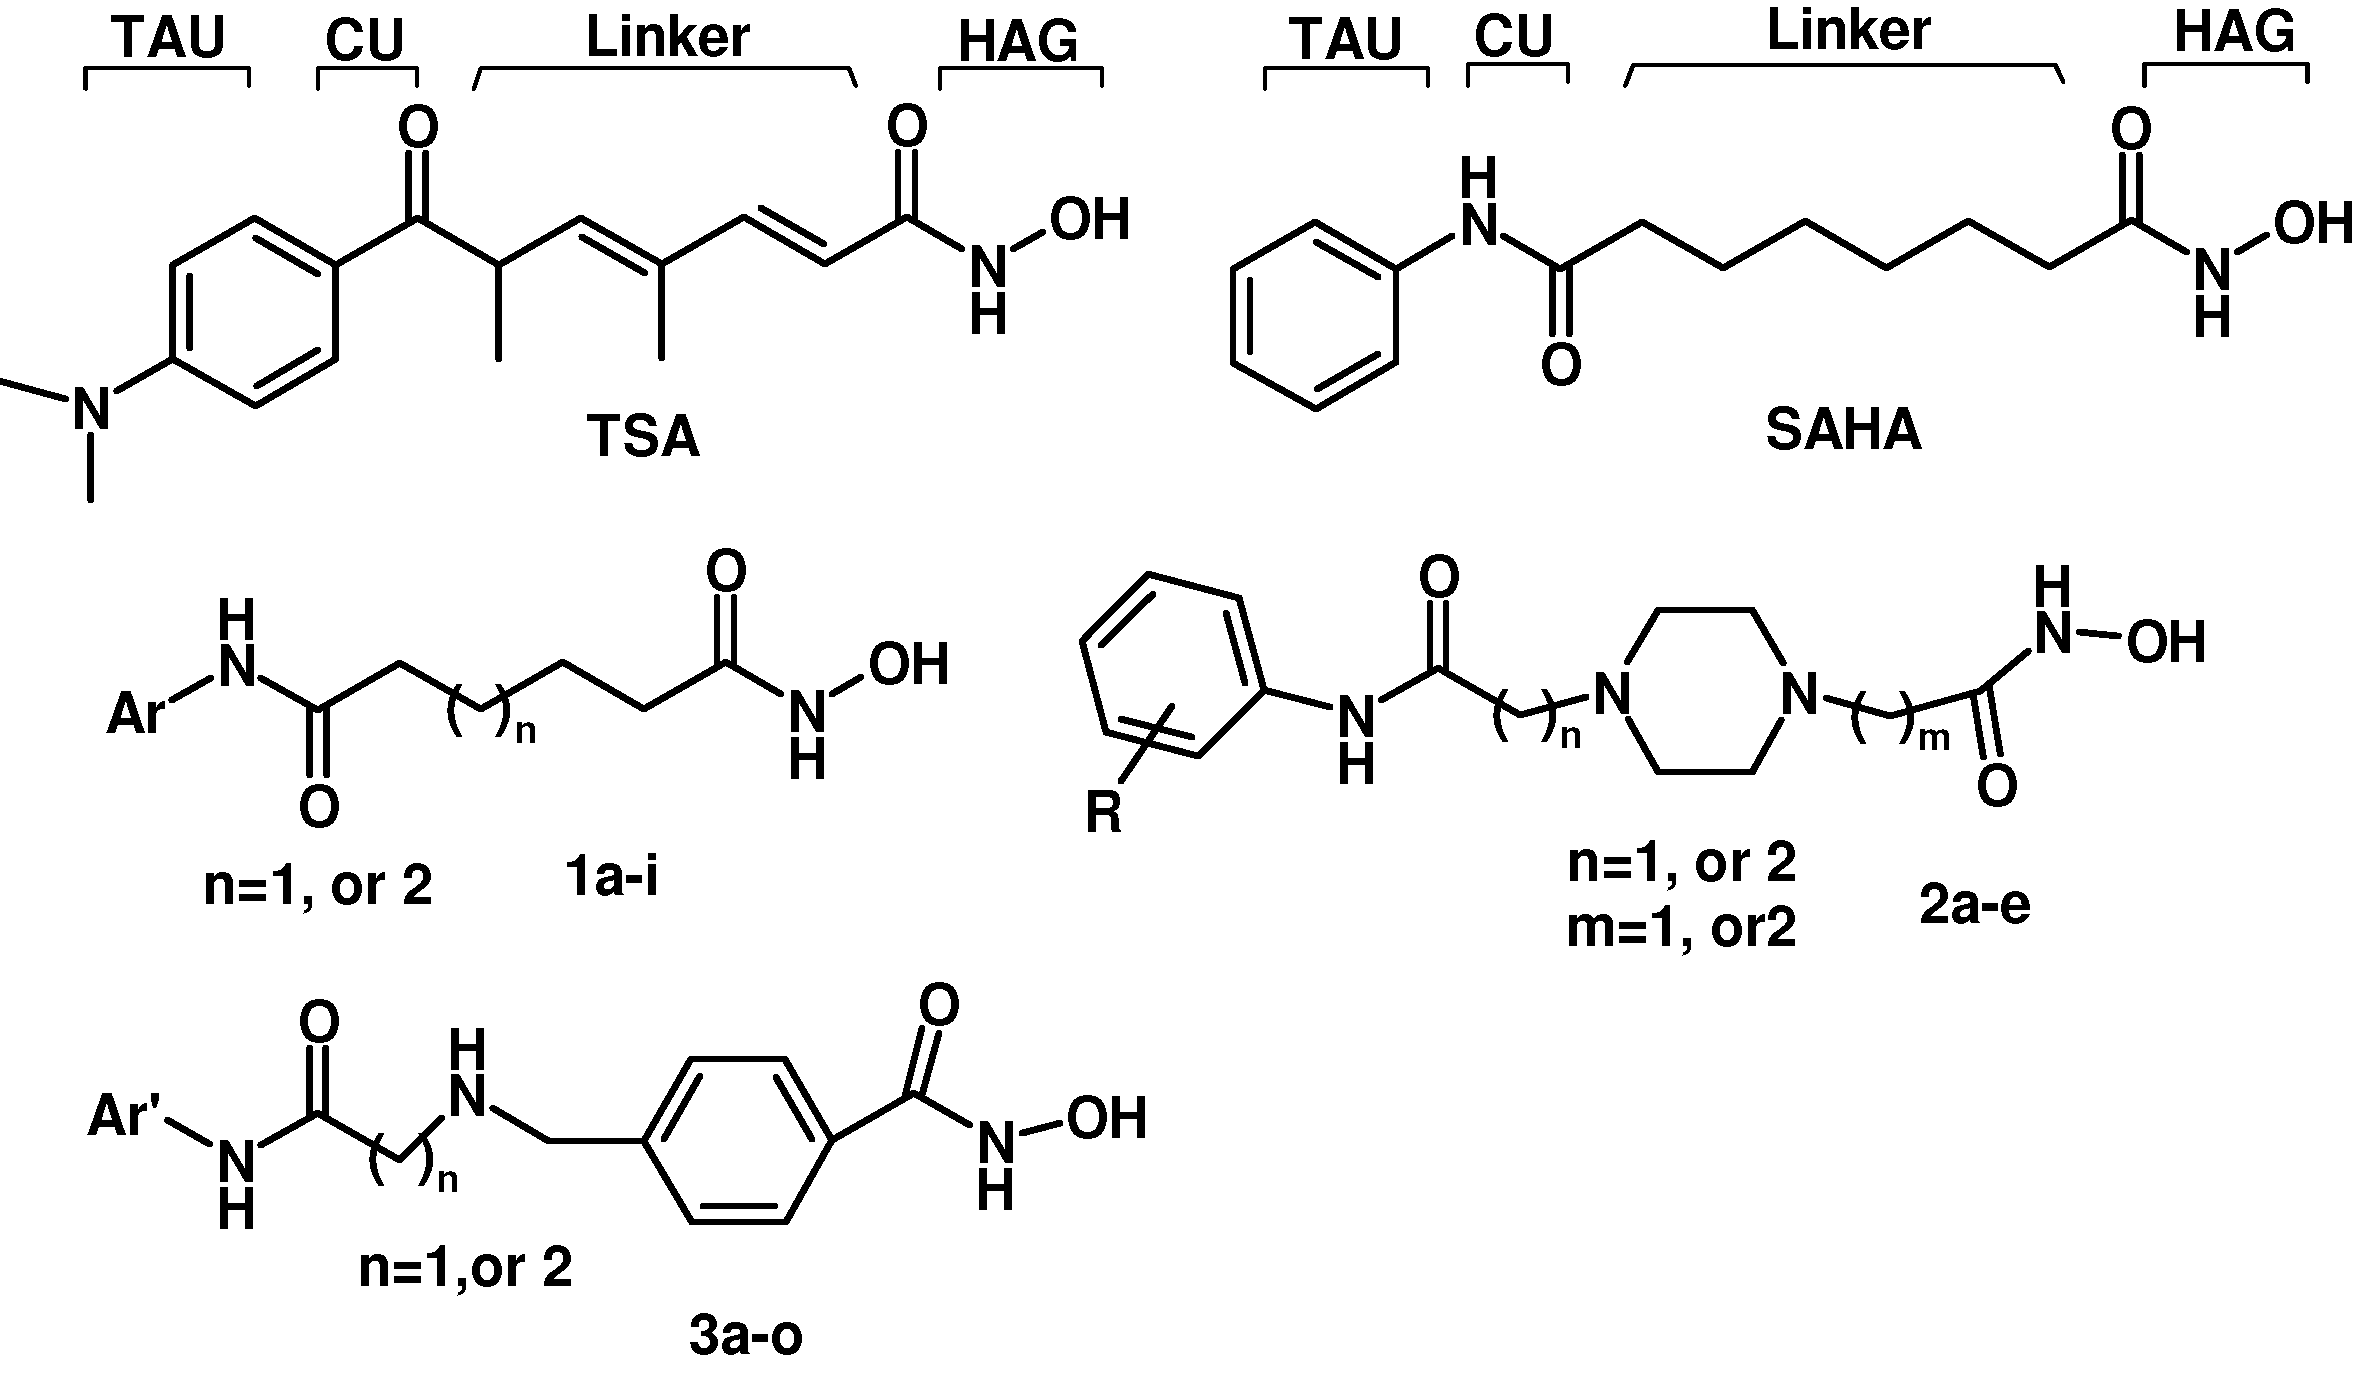
7]. TSA and SAHA have some common pharmacophore characteristics, which can be segmented into four parts: (i) a terminal aromatic unit (TAU); (ii) a connecting unit (CU); (iii) a linker domain; and (iv) the hydroxamic acid group (HAG) (
Figure 1) [
8,
9]. Small molecular structure changes have been found to have significant impact on up-regulating activity. When the hydroxamic acid group was replaced by a carboxyl and an acylamide, the two corresponding analogues of TSA showed a 10-fold and a 250-fold decrease in maximal up-regulating fold compared with TSA, respectively [
10]. To better understand the SAR of hydroxamic acid compounds, to lay out a foundation for potential up-regulators of CLA-1 expression, and to further explore the mechanism of CLA-1/SR-BI promoter up-regulation we embarked on the design and synthesis of analogues library of TSA and SAHA.
Figure 1.
Structures of TSA, SAHA and designed compounds.
Figure 1.
Structures of TSA, SAHA and designed compounds.
Based on TSA and SAHA, primarily the hydroxamic acid group was retained and the lead change program focused on the linker and terminal aromatic units. In TSA the chain length between the CU and the hydroxamic acid group is five atoms and it is six atoms for SAHA. Firstly we adjusted the length of the linker to 4–5 carbon atoms based on SAHA to obtain compounds 1a-i. TSA has two methyl groups on the linker part, so piperazine ring was introduced in different locations in the linker in 2a-e, mainly based on SAHA, to investigate space tolerance. Furthermore we introduced a benzylamino group to the linker part to synthesize compounds 3a-o to investigate its effect on up-regulating activity. Compounds 12a-d with a carboxyl group replacing the hydroxamic acid group of 3a-d were also investigated.
1.1. Chemistry
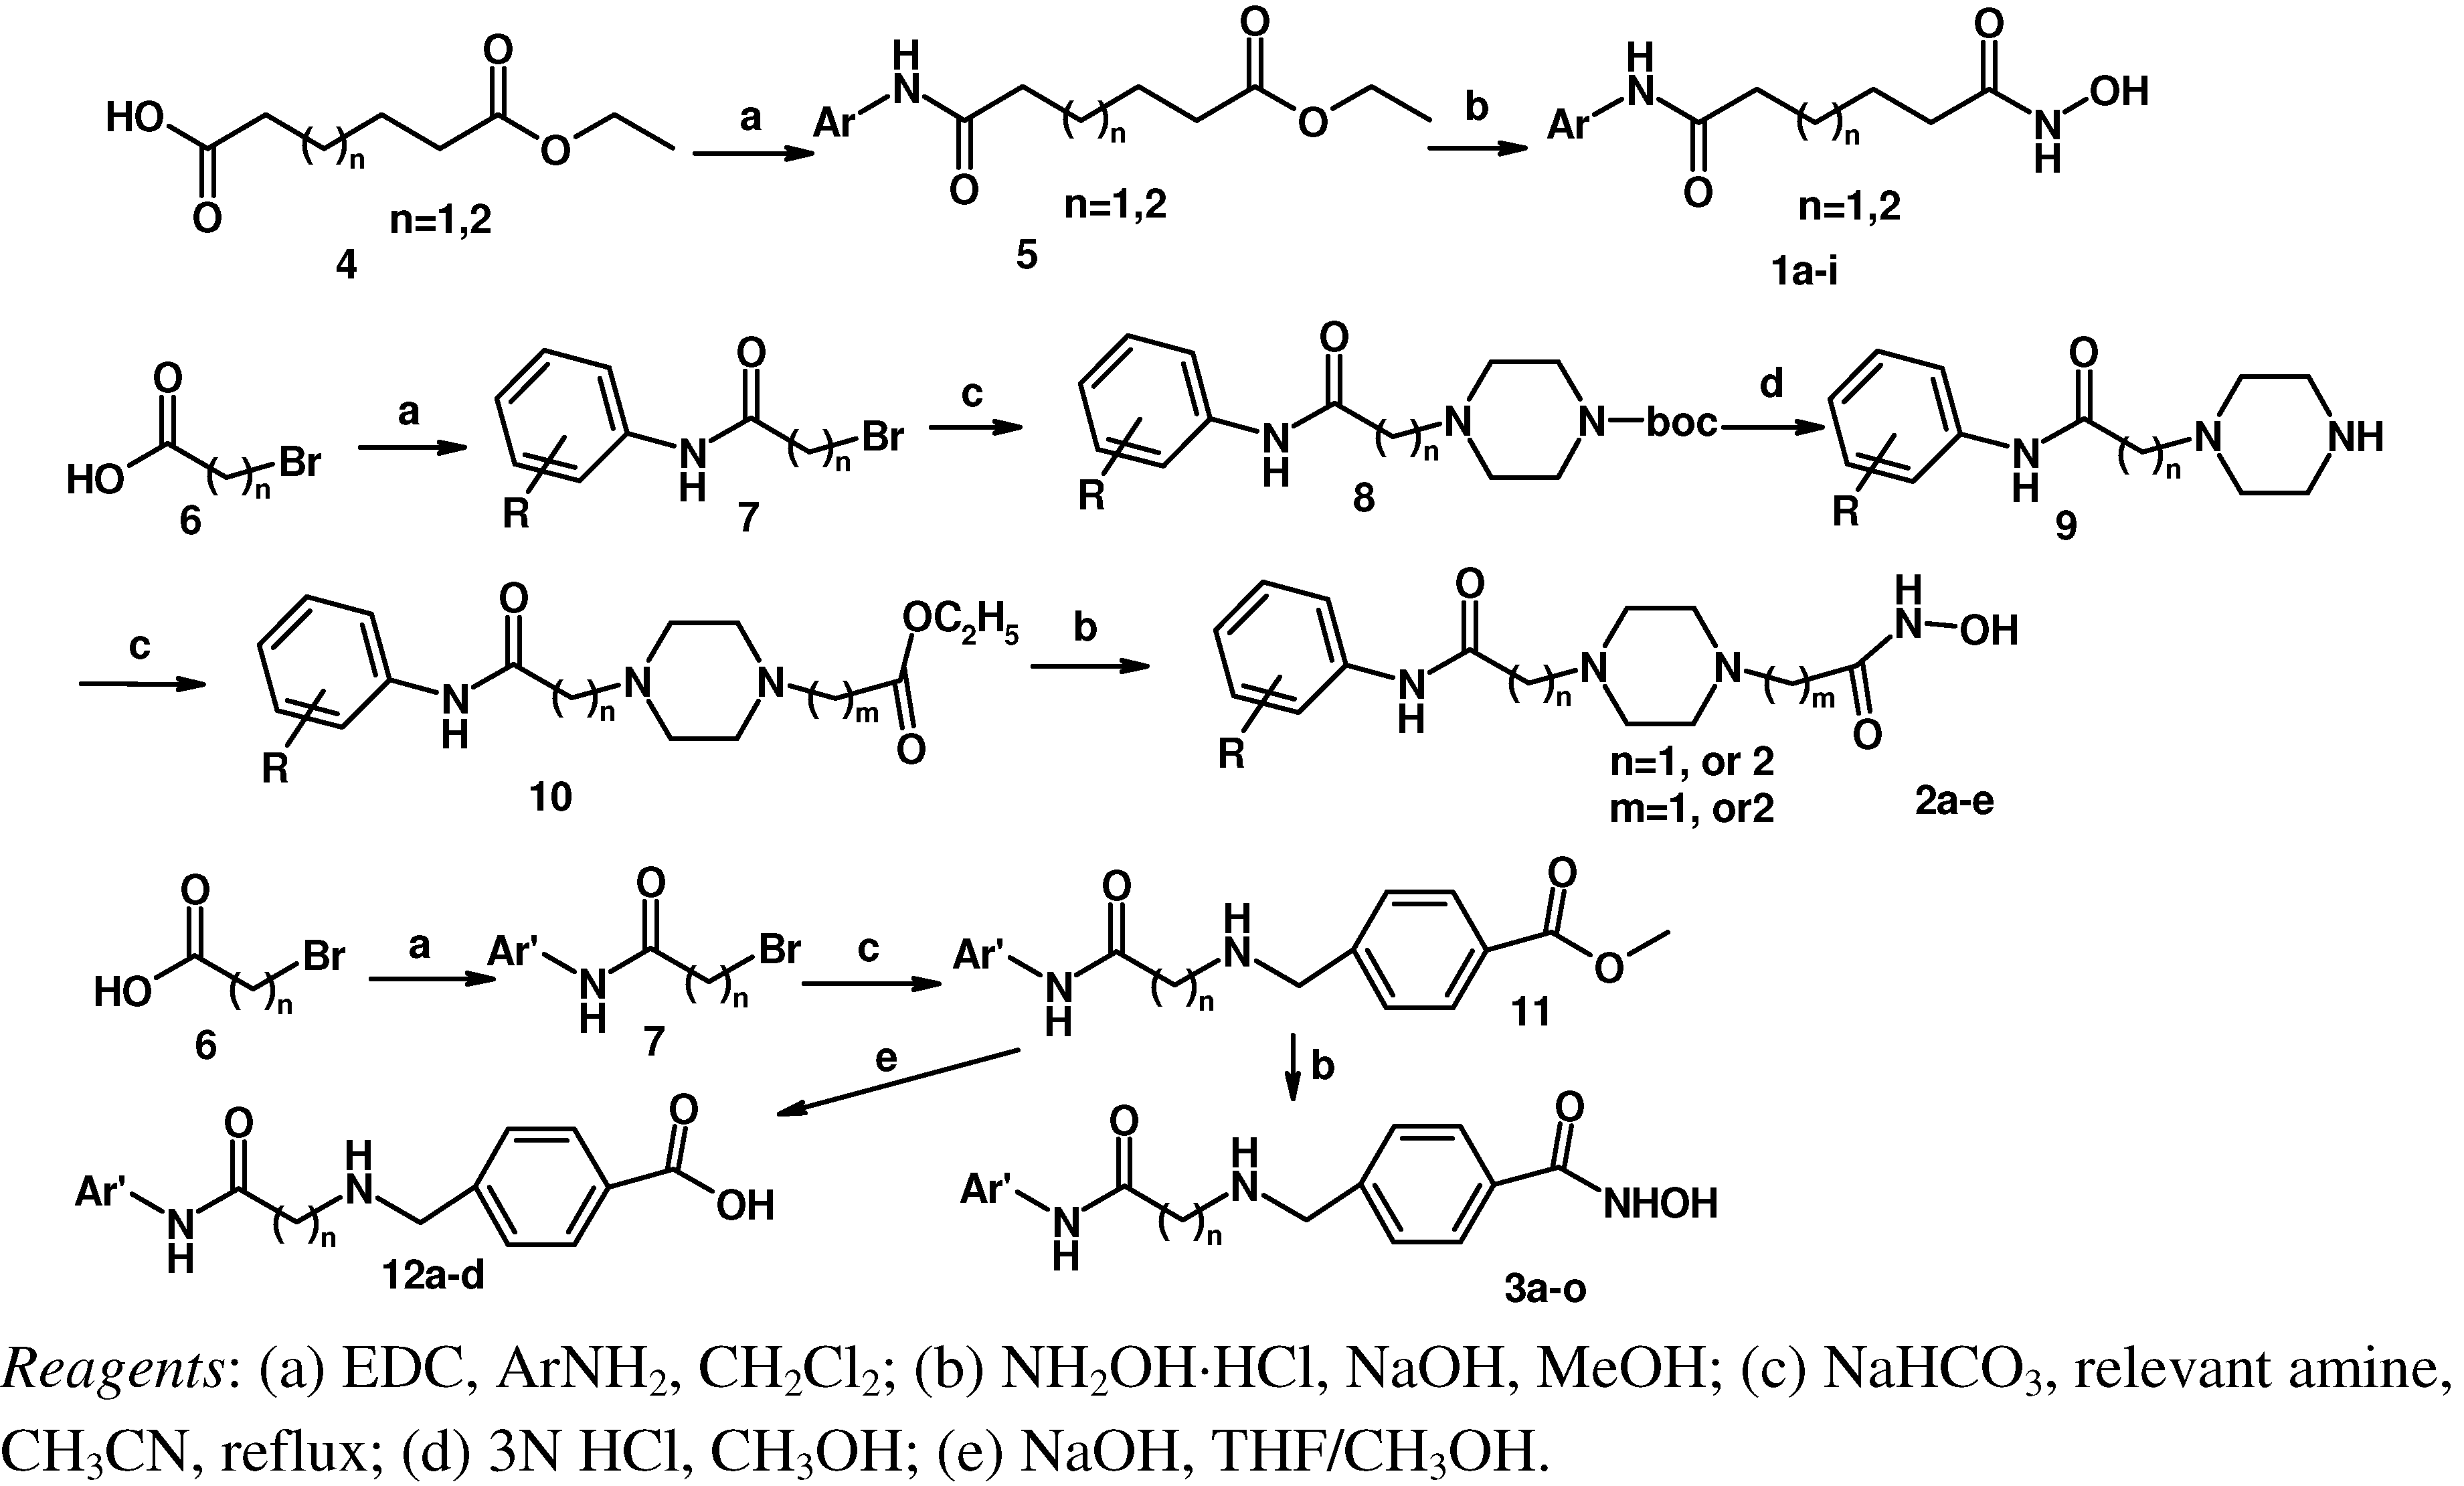
Scheme 1 shows the synthetic routes used to prepare the three series of hydroxamic acid compounds
1a-i,
2a-e and
3a-o. Reactions of adipic acid monoethyl ester or pimelic acid monoethyl ester
4 with relevant amines using 1-ethyl-3-(3-dimethyllaminopropyl)carbodiimide hydrochloride (EDC·HCl) as a coupling agent gave acylamides
5 [
11], which were then reacted with hydroxylamine in the presence of NaOH, yielding the desired targets
1a-i [
12]. Bromoacetic acid or 3-bromopropionic acid
6 were reacted with relevant amines using EDC·HCl to obtain acylamides
7, which were in turn reacted with 1-BOC-piperazine in the presence of K
2CO
3 to give
8. The BOC groups of compounds
8 were deprotected with 3 N HCl to afford
9 [
13], which were reacted with ethyl bromoacetate or ethyl 3-bromopropionate in the presence of K
2CO
3 to give
10 [
14]. Compounds
10 were finally converted into
2a-e in the same way as described for
1a-i. Acylamides
7 with methyl 4-(aminomethyl)benzoate hydrochloride in the presence of KHCO
3 furnished
11, which were then converted to
3a-o according to the synthetic method used for
1a-i.
Scheme 1.
The synthesis route of objective compounds.
Scheme 1.
The synthesis route of objective compounds.
2. Results and Discussion
As exploratory screening of the synthesized compounds, we first evaluated the up-regulating of CLA-1 expression activities in HepG2 cells at 10 μg/mL concentration.
Table 1,
Table 2,
Table 3 summarize the activity data and inhibition rates of HDAC at 500 nM for the synthesized compounds as well as the known up-regulators TSA and SAHA as positive controls.
Table 1.
Up-regulating activities of CLA-1 expression in HepG2 cells and inhibition rate of HDAC of compounds
1a-i.
![Molecules 16 09178 i001]()
Table 2.
Up-regulating activities of CLA-1 expression in HepG2 cells and inhibition rate of HDAC of compounds
2a-e.
![Molecules 16 09178 i011]()
Table 2.
Up-regulating activities of CLA-1 expression in HepG2 cells and inhibition rate of HDAC of compounds 2a-e. ![Molecules 16 09178 i011]()
| Cpd. | R | n | m | Up-regulating fold | Inhibition rate |
|---|
| (SD) | of HDAC (%) |
|---|
| 2a | H | 2 | 1 | 1.2
(0.1) | 5.4 |
| 2b | 2,4-(OCH3) | 2 | 1 | 1.1
(0.08) | 7.2 |
| 2c | H | 1 | 1 | 1.1
(0.1) | 5.6 |
| 2d | 4-N(CH3)2 | 1 | 1 | 1.1
(0.2) | 5.9 |
| 2e | H | 1 | 2 | 1.1
(0.1) | 8.6 |
Table 3.
Up-regulating activities of CLA-1 expression in HepG2 cells and inhibition rate of HDAC of compounds
3a-o,
12a-d.
![Molecules 16 09178 i012]()
Compounds
1a-i with a linker chain of four or five carbon atoms showed promising up-regulating activity. In general, compounds
1e-i with five carbon atoms chain showed more powerful activity than
1a-d with 9.2~15.7 fold up-regulation. From the structural perspective, the carbon chain length has great influence on up-regulating activity; the longer chain with five carbon atoms is more active than the shorter one. Compounds
1a-e,
1g,
1i were selected for further studies to obtain their activity EC
50 values. Similarly compounds with five carbon atoms chain showed better activities than those with four carbon atoms chain.
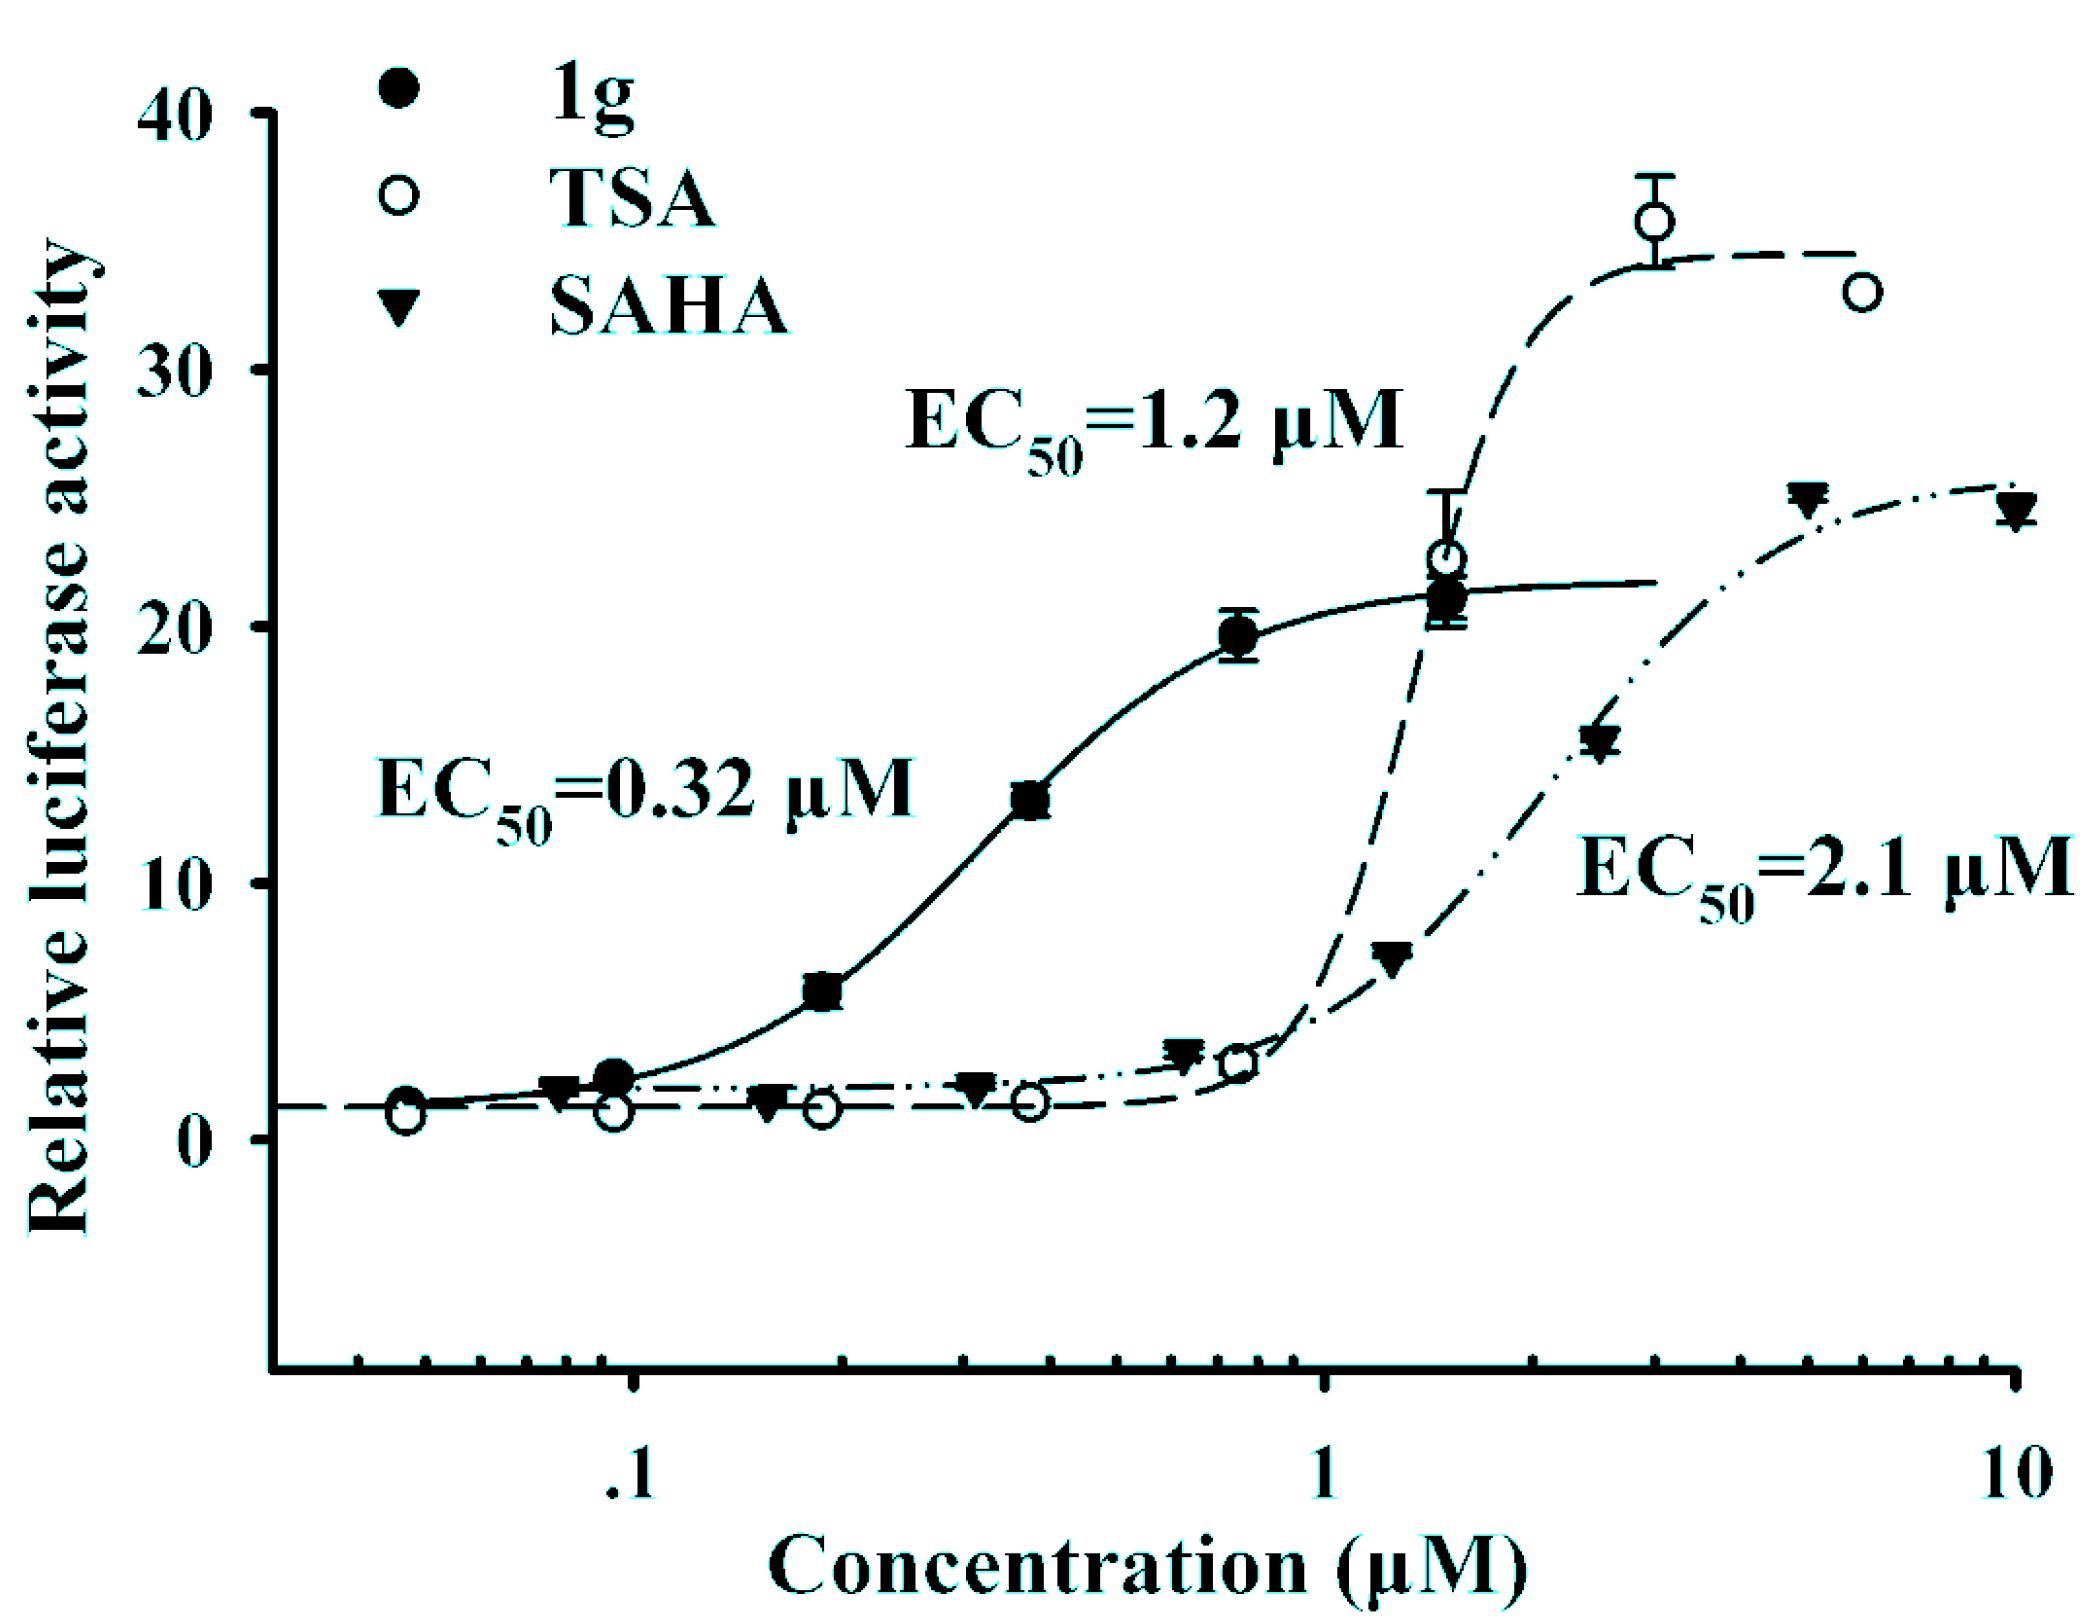
Figure 2 shows that compound
1g with a 3-chloro substituent on the phenyl ring exhibited the best up-regulating activity in terms of EC
50, suggesting that the substitution of the phenyl ring seemed to have significant impact on the up-regulating activity. Compound
1g has an EC
50 value of 0.32 μM, which is much lower than those of the reference compounds TSA (EC
50 = 1.2 μM) and SAHA (EC
50 = 2.1 μM), and more importantly, it showed much better up-regulating activity than both reference compounds at low concentrations (at and below 1 μM).
Figure 2.
The dose-response curves of compound 1g and SAHA.
Figure 2.
The dose-response curves of compound 1g and SAHA.
In contrast, 2a-e incorporating a piperazine group on the linker part exhibited no up-regulating activity, suggesting that the position 1 to 2 carbon atoms away from hydroxamic acid can’t tolerate the bulky piperazine ring group.
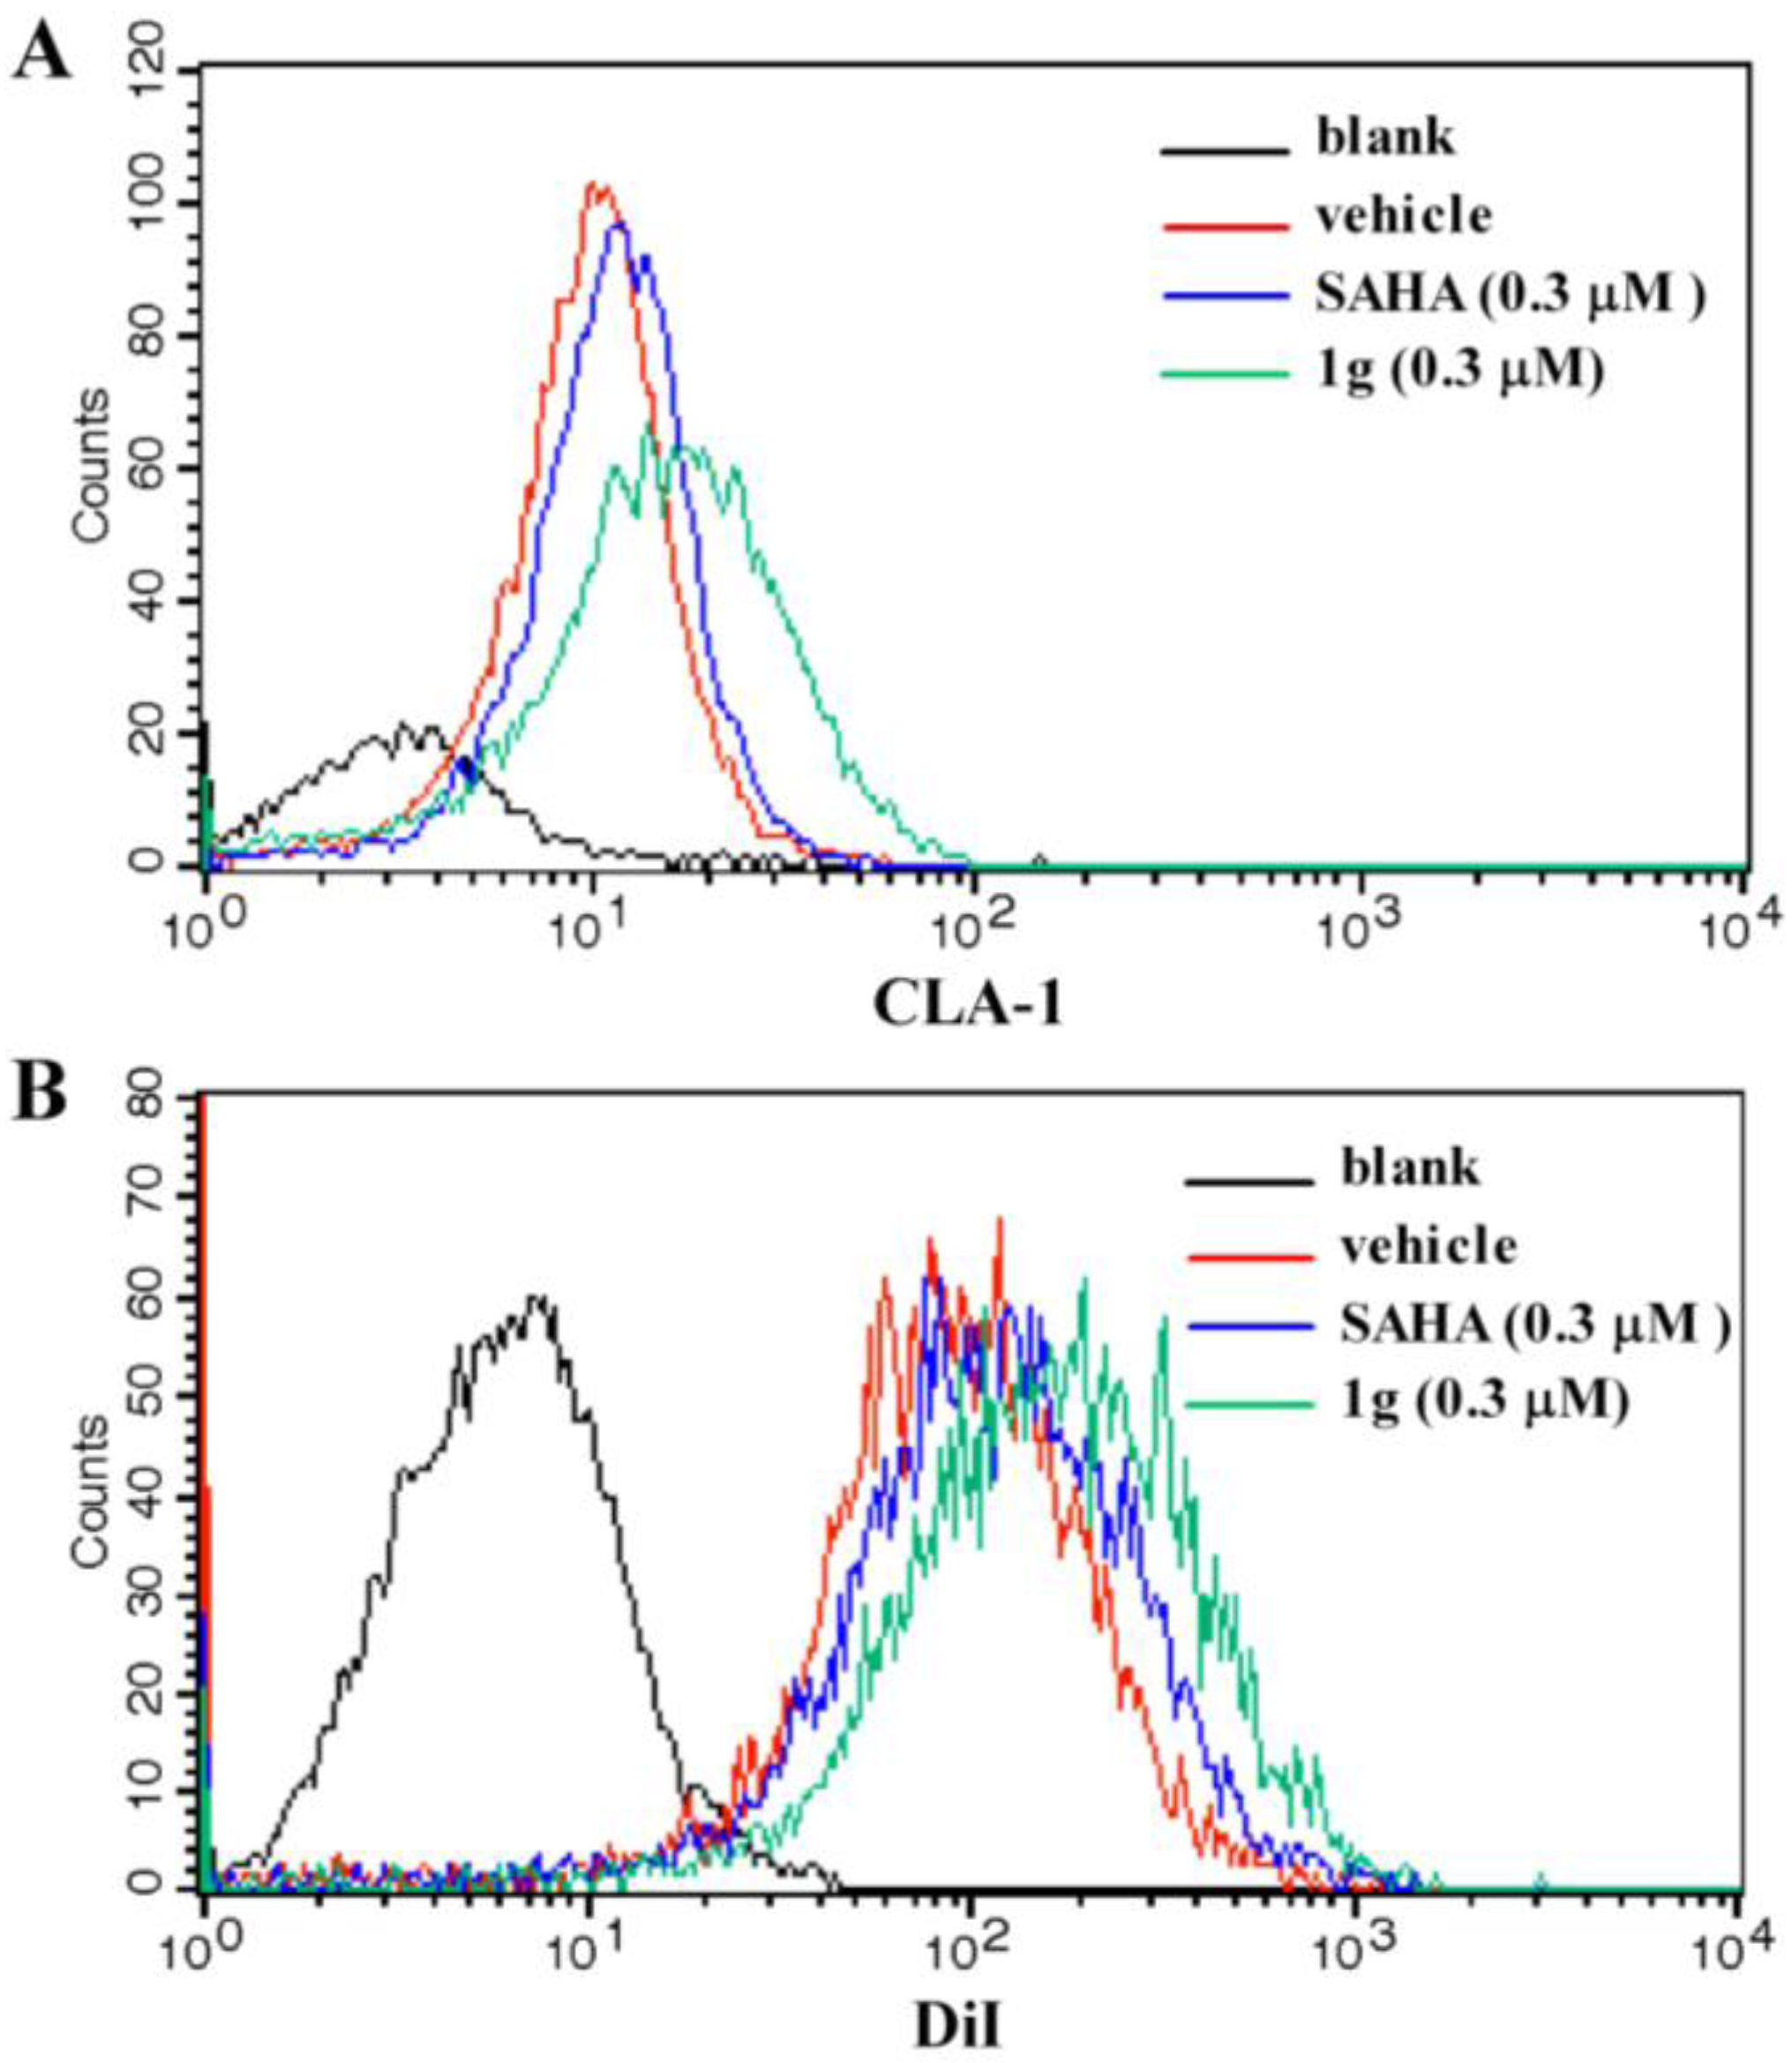
To determine if the CLA-1 expression level was increased by
1g due to the up-regulation of transcriptional activity, flow cytometry was performed to investigate the abundance of CLA-1 protein levels in HepG2 cells with and without
1g treatment. The result showed that with treatment of 0.3 μM
1g, the protein level of CLA-1 was increased by 224.6% (
Figure 3A), which was higher than 0.3 μM SAHA (63.5%). To test whether
1g enhanced the selective uptake of lipids from HDL by increasing the expression of CLA-1, fluorescence-labeled DiI-HDL uptake after 12 h incubation with HepG2 cells was measured in the presence or absence of
1g. 0.3 μM
1g promoted the uptake of DiI-HDL into the HepG2 cells by 62.5% which was higher than 0.3 μM SAHA (24.1%) (
Figure 3B).
Figure 3.
Effect of compound 1g on CLA-1 expression and DiI-HDL uptake.
Figure 3.
Effect of compound 1g on CLA-1 expression and DiI-HDL uptake.
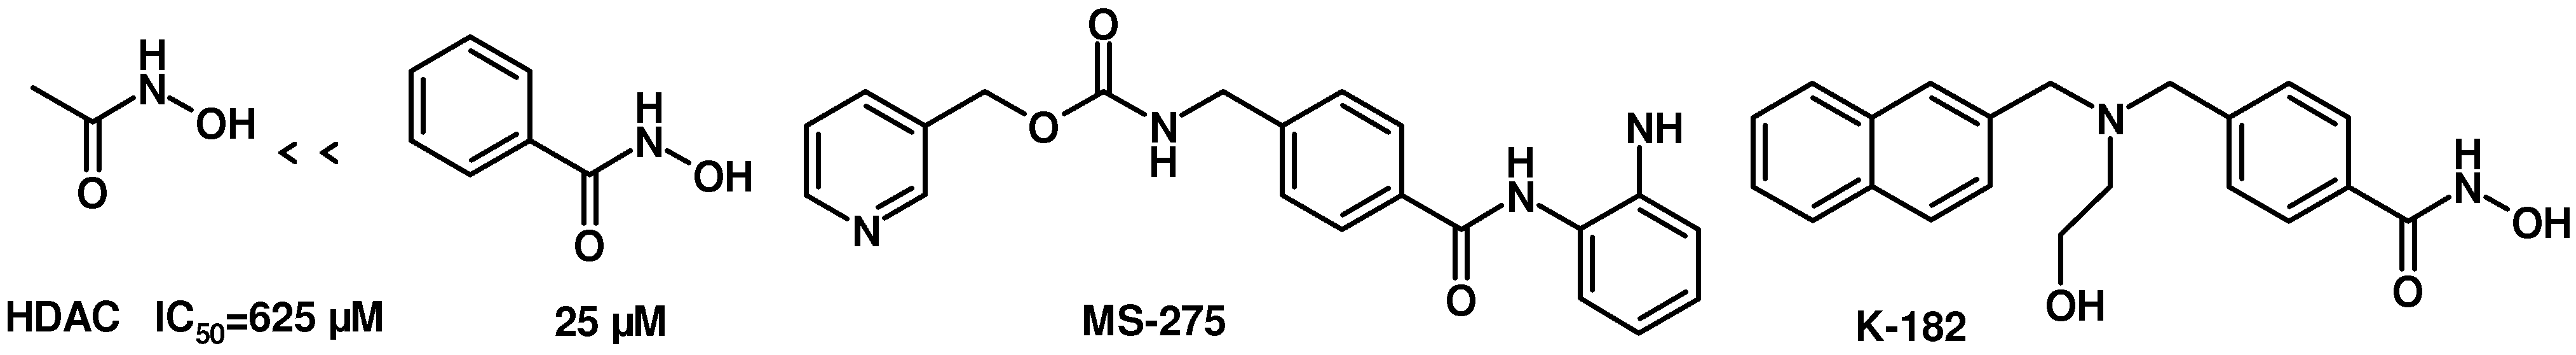
TSA was reported as a potent specific reversible inhibitor of mammalian histone deacetylase (HDAC), leading to hyperacetylation of chromatin-associated histones and thereby open promoter loci to permit interaction with transcription factors to promote gene expression [
15]. SAHA was the first HDAC inhibitor approved for treating cutaneous T cell lymphoma by FDA in 2006. It was reported that there was a 30-fold increase in HDAC inhibitory activity progressing from aceto- to benzoyl hydroxamic acid, with IC
50 values of 625 and 25 μM, respectively (
Figure 4) [
16,
17]. In addition,
MS-275 is under clinical trials and
K-182 is powerful as HDAC inhibitors [
18]. They all possess a benzylamino group on the linker part. We also tried to introduce a benzylamino moiety into the linker part to synthesize compounds
3a-o. Compounds
3a-o showed moderate activity. When n = 1, phenyl
3a,
p-chloro phenyl
3d,
p-methoxyphenyl
3e showed activity, with over 10-fold up-regulation at 10 μg/mL concentration, while
3b and
3c with chloro group substitution in the
ortho and
meta positions show a great decline in activity. Likewise, 3,4-dimethoxyphenyl compound
3f also displayed reduced activity. Benzyl or phenylethyl compounds
3h-3j were inferior to those with phenyl groups. When n = 2,
p-chlorophenyl derivative
3l was more potent than the
o-chlorophenyl one
3k. The 3,4-dimethoxy-phenyl compound
3n showed a fourfold decrease in activity compared with the similar
p-methoxy-phenyl analog
3m.
Figure 4.
Structures of HDAC inhibitors.
Figure 4.
Structures of HDAC inhibitors.
For
12a-d, the most notable observation is the lack of activity of all the carboxylic acid derivatives tested; conversely, nearly all hydroxamic acid analogs showed promising up-regulating activity. Consistent with our previous results [
10], these results indicated that the hydroxamic acid group is indispensable. For this series of compounds, substitution at the
para-position of the phenyl ring is preferred for good activity.
At present, there are only some clues that several known HDAC inhibitors such as TSA, SAHA and sodium butyrate are active on CLA-1 up-regulating activity [
7]. However, TSA up-regulated CLA-1 transcription with EC
50 = 1.2 μM, which is much higher than its HDAC inhibition IC
50 values (usually at nanomolar level). As the relationship between HDAC inhibition and CLA-1 transcriptional upregulation is quite intriguing, we further detected the HDAC inhibitory activity of our compounds using a HDAC Fluorimetric Assay kit (Enzo Life Science). At 10 nM, none of all 29 compounds showed HDAC inhibition (<5% inhibition) except compound
1g (~25% inhibition), whereas TSA exhibited ~60% inhibition at the same concentration (data not shown). At 500 nM,
1a-i and
3a-o showed different HDAC inhibition rates ranging from 8.8% to 92.1% and compounds
2a-e showed little inhibition (<8.6%) (
Table 1,
Table 2,
Table 3). Compound
1g showed the highest HDAC inhibition rate of 92.1% whereas TSA and SAHA exhibited 72.9% and 95.0% inhibition, respectively (
Table 1,
Table 2,
Table 3). The HDAC inhibition activity of the compounds synthesized in the present study correlated positively to their CLA-1 up-regulation activity on the whole, suggesting CLA-1 up-regulation may be dependent on the HDAC inhibition. However, the activity of some compounds towards HDAC inhibition did not correlate with the degree of up-regulation of CLA-1 promoter. This suggests that some of the hydroxamic acid derivatives may affect CLA-1 transcription through mechanisms other than HDAC inhibition in HepG2 cells. It will be interesting to determine the detailed relationship between HDAC inhibition and the induction of CLA-1 transcription in future studies.
3. Experimental
3.1. General
All reagents and solvents were reagent grade or were purified by standard methods before use. Melting points were determined in open capillaries on a RT-1 melting point apparatus (Tianjin Fenxi Yiqichang, Tianjin, China) and are uncorrected. Column chromatography was carried out on flash MCI GEL 20Y. 1H-NMR spectra analysis was performed on a Varian Inova 400 MHz spectrometer (Varian, Palo Alto, CA, USA), using DMSO-d6 as solvent and Me4Si as the internal standard. Chemical shifts (δ values) and coupling constants (J values) are given in ppm and Hz, respectively. ESI high-resolution mass spectra (HRMS) analysis was recorded on an Autospec Ultima-TOF mass spectrometer (Micromass UK Ltd., Manchester, UK). All the HRMS data were within ±5 ppm of calculated values.
3.4. General Procedure for Boc Deblocking (Scheme 1, step d)
Concentrated HCl (15 mL) was dropped into a solution of the corresponding BOC protected compound (5.82 mmol) in ethyl alcohol (50 mL), and the mixture was stirred for 16 h at room temperature. Saturated solution of NaHCO3 was added to pH > 8. The solution was concentrated under reduced pressure and the residue was extracted with ethyl acetate. The organic layer was concentrated under reduced pressure and provided the desired product as a yellow oil (about 80% yield).
3.6. CLA-1 Up-Regulating Activity
CLA-1 up-regulating activity was analyzed as described previously [
14]. Briefly, HepG2 cells stably transfected with pGL3-CLAP containing CLA-1 promoter region were seeded in 96-well plates at 5 × 10
4 number/well in MEM (Hyclone, Logan, UT, USA) (100 μL) containing 10% FBS (Hyclone) and 600 μg/mL G418 (Invitrogen, Carlsbad, CA, USA). With ~80% confluence, the cells were washed once with PBS (pH 7.3, 137 mM NaCl, 2.7 mM KCl, 4.3 mM Na
2HPO
4, 1.4 mM KH
2PO
4), followed by incubation with MEM (200 μL) containing 0.1% vehicle (DMSO), positive control (2.5 μM SAHA or 3.0 μM TSA) or 10 μg/mL compounds. After 18 h incubation at 37 °C, cells were washed with PBS, and then the luciferase activity was detected using the Luciferase Assay System (Promega, Madison, WI, USA). EC
50 values of the compounds were determined by a dose-response assay. Briefly, the above mentioned HepG2 cells were treated with the indicated concentrations of the compounds and detected by luciferase assay. The does-response curves were obtained and the apparent EC
50 value for each compound was calculated using Sigma Plot 9.0.
3.7 Analysis for Cell Surface Expression by Flow Cytometry
Cell surface expression of CLA-1 was analyzed by flow cytometry as described previously [
7]. Briefly, HepG2 cells were plated in 24-well dishes at 50,000 cells/well, followed by treatment for 24 h with 0.3 μM compounds or vehicle (0.1% DMSO). Then HepG2 cells were trypsinized from the plate, washed and resuspended in 4% paraform fixing solution, incubated overnight at 4 °C. After fixing, cells were blocked for 15 min at 4 °C in PBS containing 5% FBS. Cells were then incubated with monoclonal antibody to CLA-1 (BD Biosciences, San Jose, CA, USA) at a final dilution of 1:50 (4 °C, 1 h), followed by washing and staining with FITC-conjugated goat antibody to mouse IgG (1:100 dilution, 4 °C, 1 h). The cell suspension was centrifuged (800 × g, 3 min, 4 °C), the pellet was resuspended in PBS, and fluorescence intensity was analyzed using a BD FACSCalibur flow cytometer (BD Biosciences).
3.8 Analysis of Cellular Uptake of DiI-labeled HDL by Flow Cytometry
For the cellular DiI-HDL uptake by HepG2 cells assays, the cell pretreatment was the same as for the cell surface expression assay. Cells were incubated with DiI-HDL (2 μg/mL) and 0.3 μM compounds or vehicle for 12 h at 37 °C, then washed with PBS and incubated with PBS containing 0.5% bovine serum albumin (BSA) and 2 mM EDTA for 1 h at 4 °C, detached from the plate by gentle pipetting. The cell suspension was centrifuged (3 min, 800 g, 4 °C), the obtained pellet was resuspended in PBS, and DiI fluorescence was analyzed using a BD FACSCalibur flow cytometer (BD Biosciences).


