Figure 1A.
Laccase dose-response profiles for CA oxidation monitored by 260 nm absorption. Increasing concentrations of laccase were used to oxidize 500 μM CA in 100 μL of pH 4.5 buffer under real-time kinetic measurements using UV-transparent 96-well microplate. Decreases in CA absorbance were measured at 20 min for the samples purchased from Alfa Aesar (open triangles, blue tracing), Acros Organics (open circles, red tracing) and Sigma-Aldrich (open squares, purple tracing).
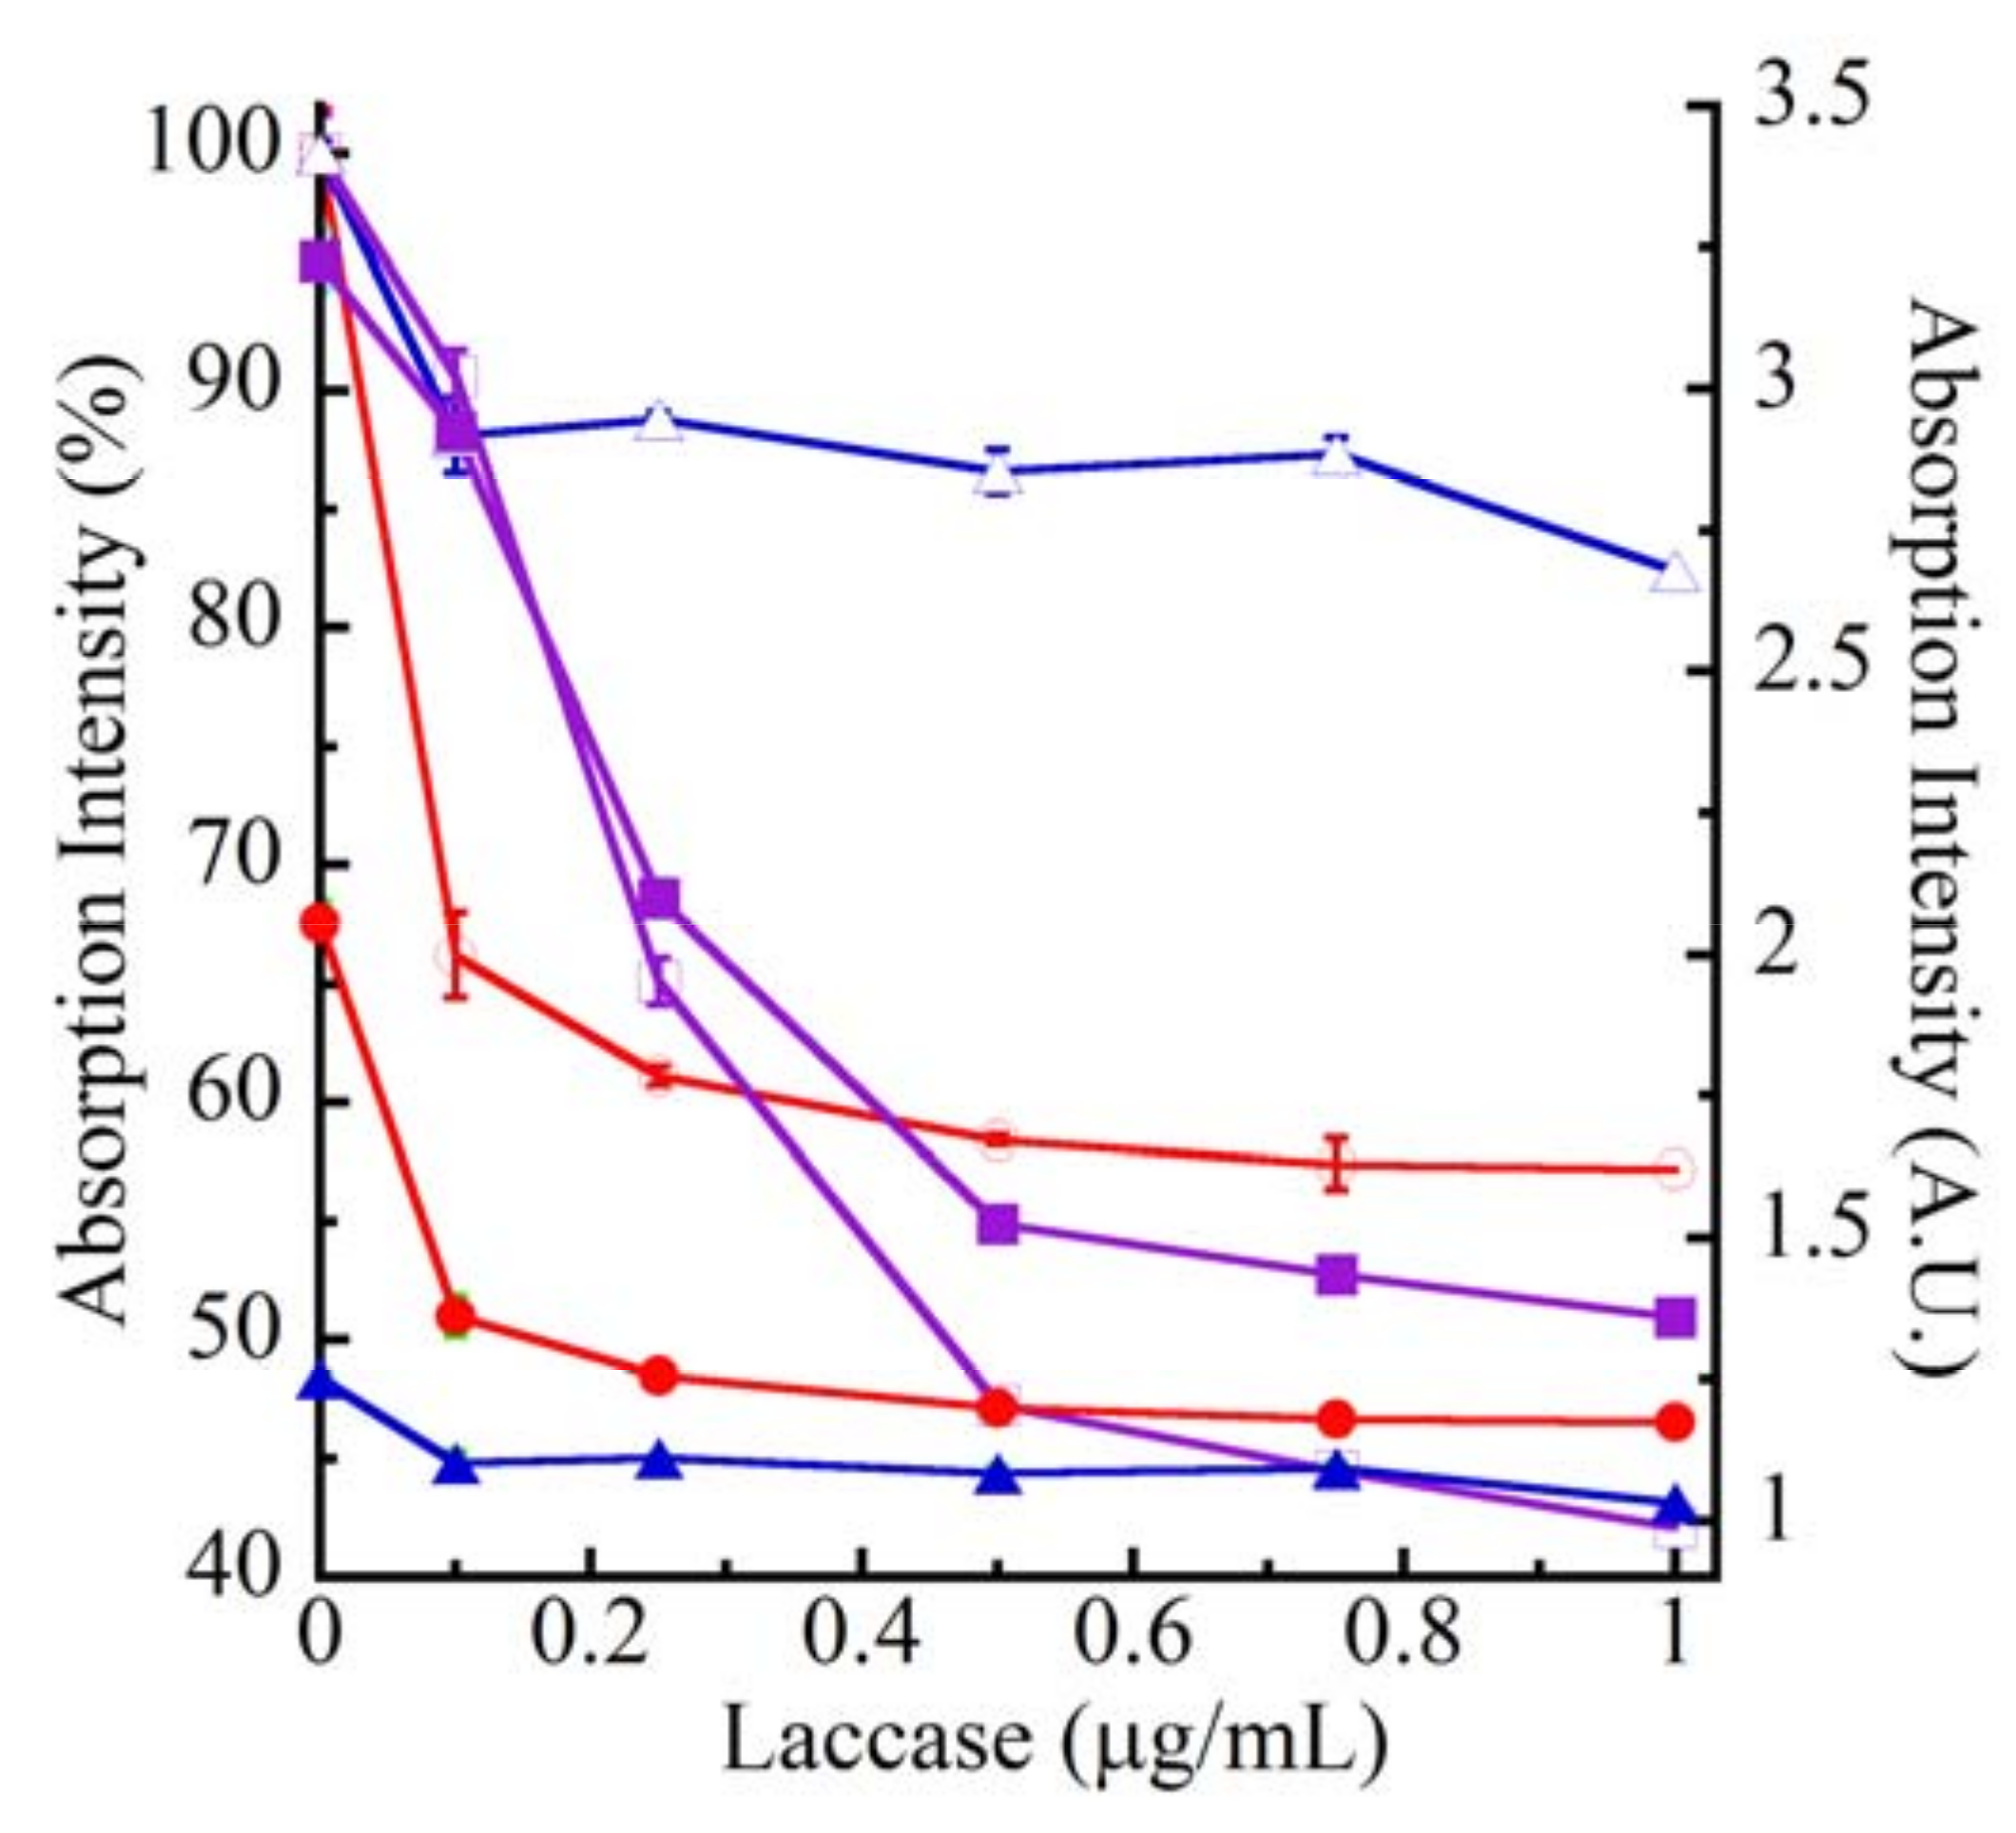
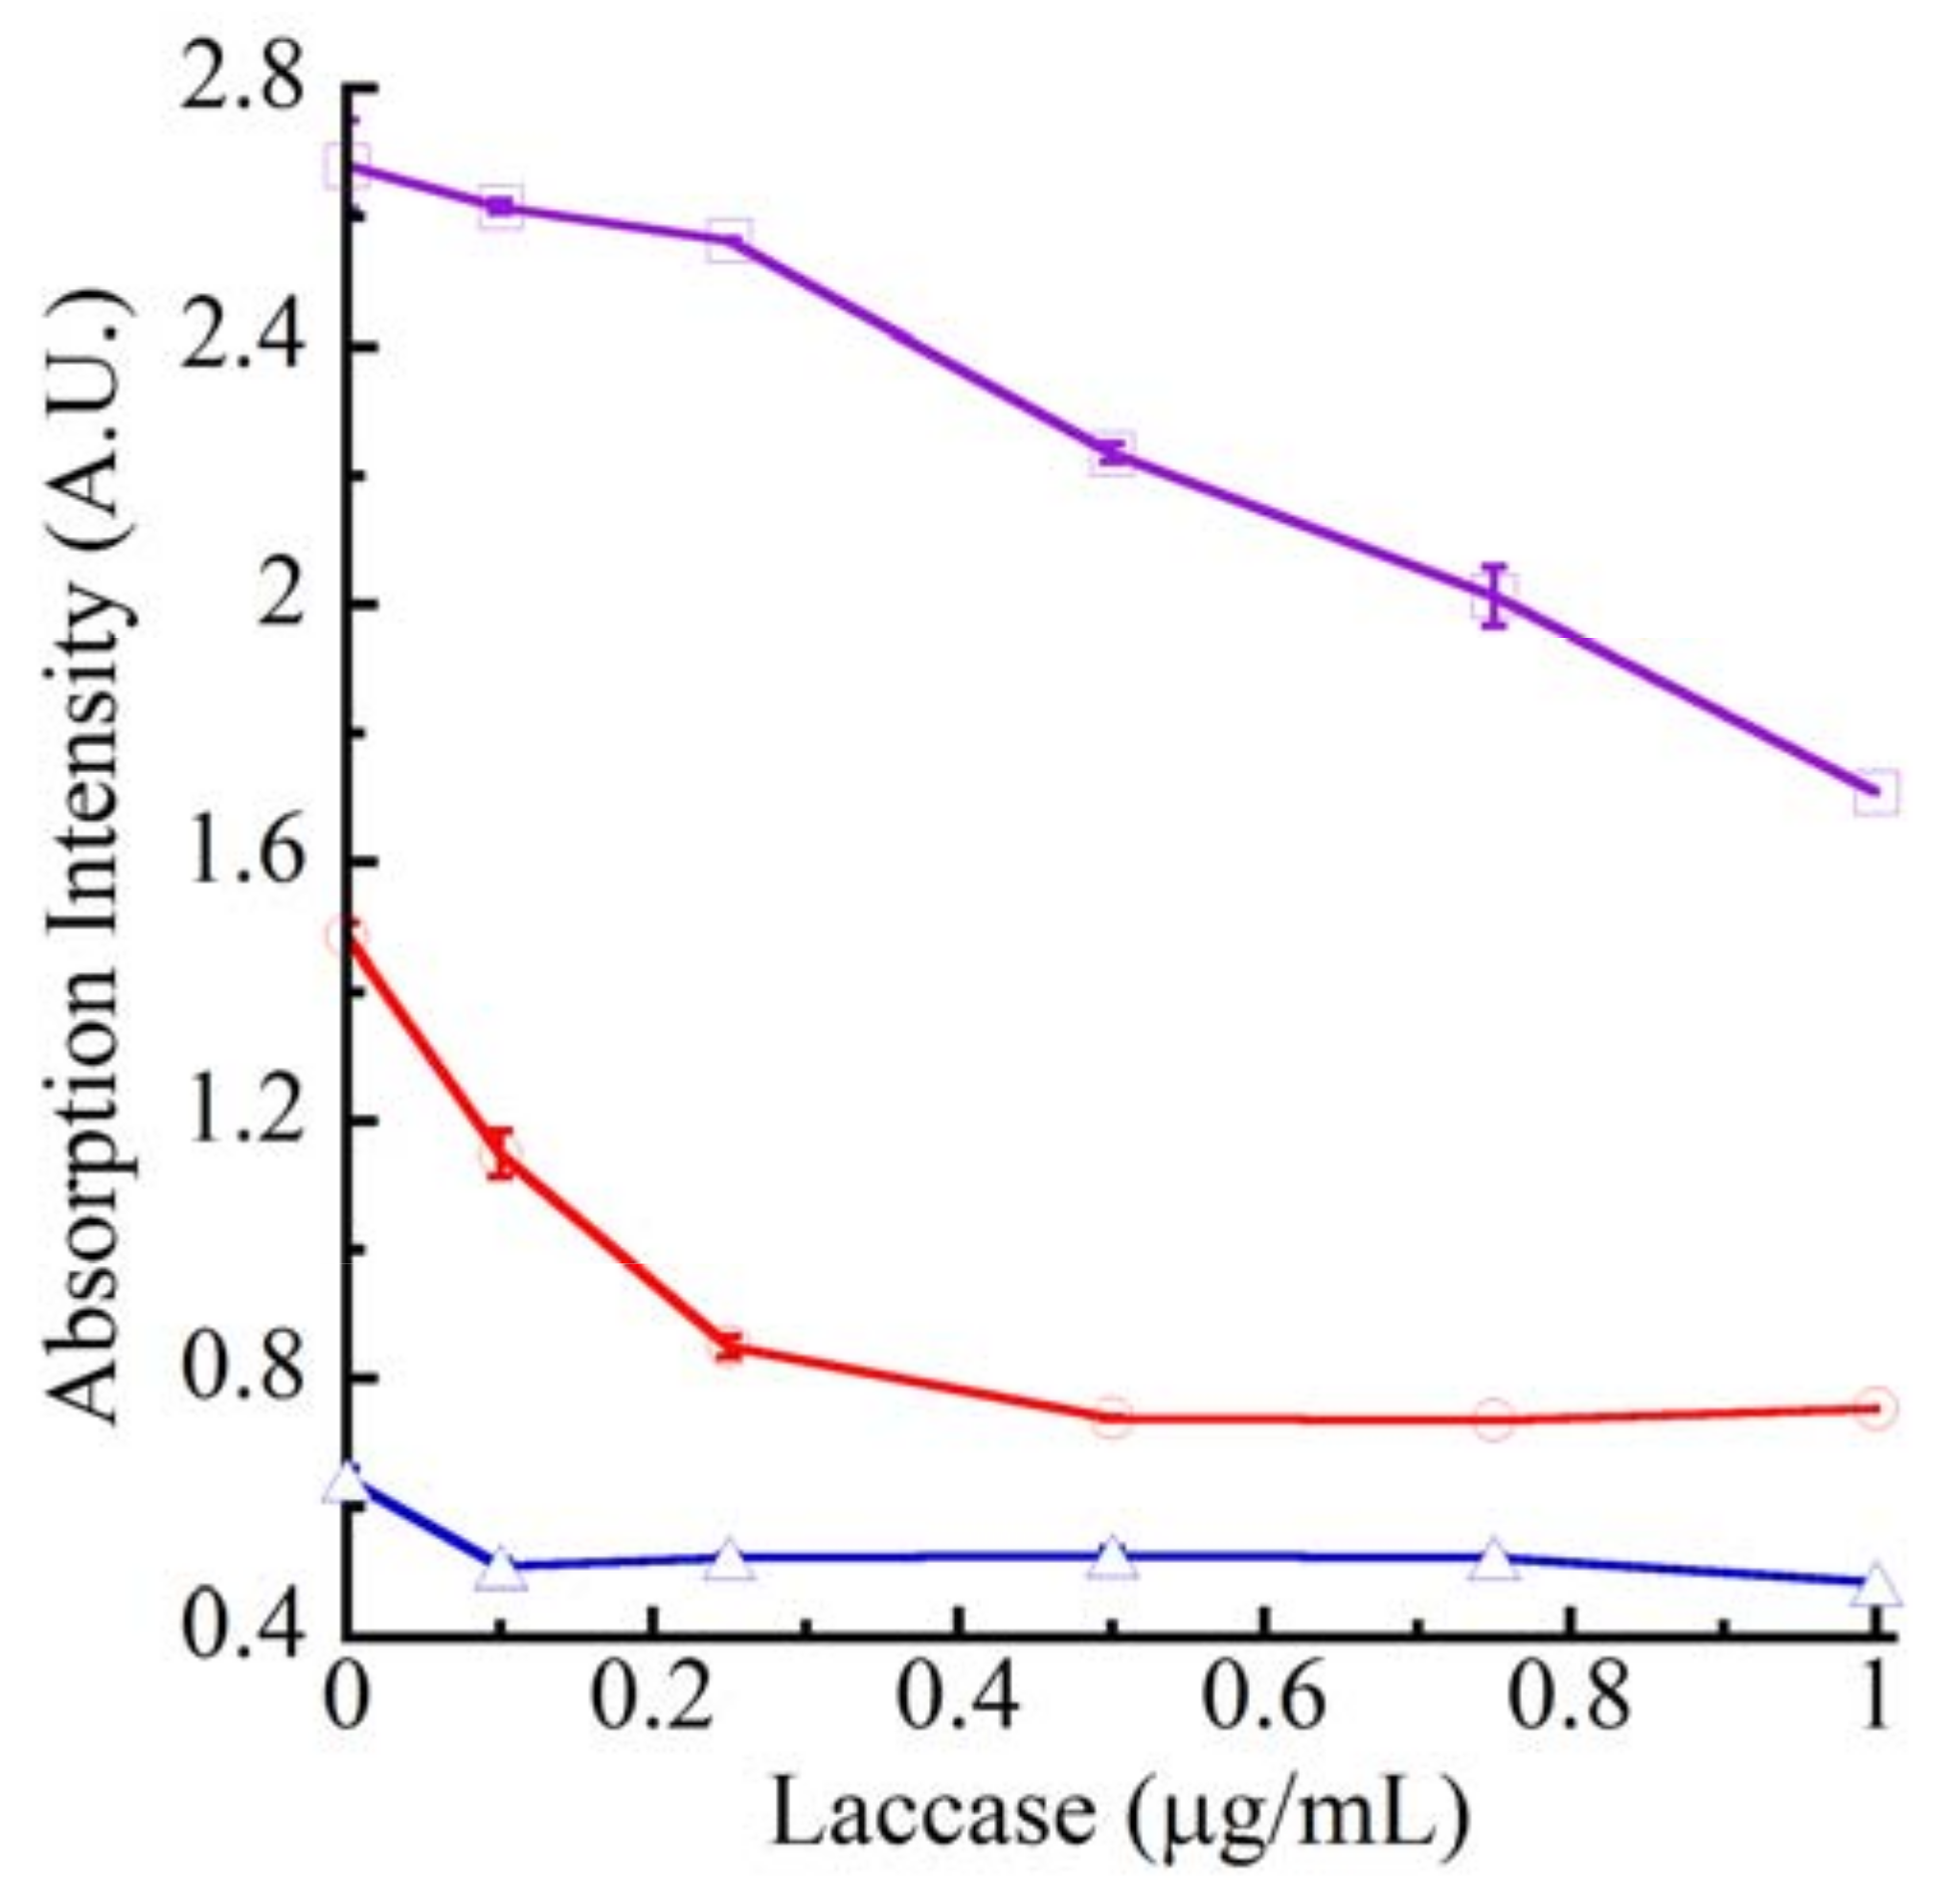
Figure 1B.
Laccase dose-response profiles for CA oxidation monitored by 290 nm absorption. Increasing concentrations of laccase were used to oxidize 500 μM CA in 100 μL of pH 4.5 buffer using UV-transparent 96-well microplate. At 60 min, the reactions were stopped through basification (100 mM NaOH final). Decreases in absorbance were measured from the CA samples purchased from Alfa Aesar (open and closed triangles, blue tracings), Acros Organics (open and closed circles, red tracings) and Sigma-Aldrich (open and closed squares, purple tracings). Open symbols represent normalized percent decreases in the absorption intensity and closed symbols are the actual absorption units (A.U.).
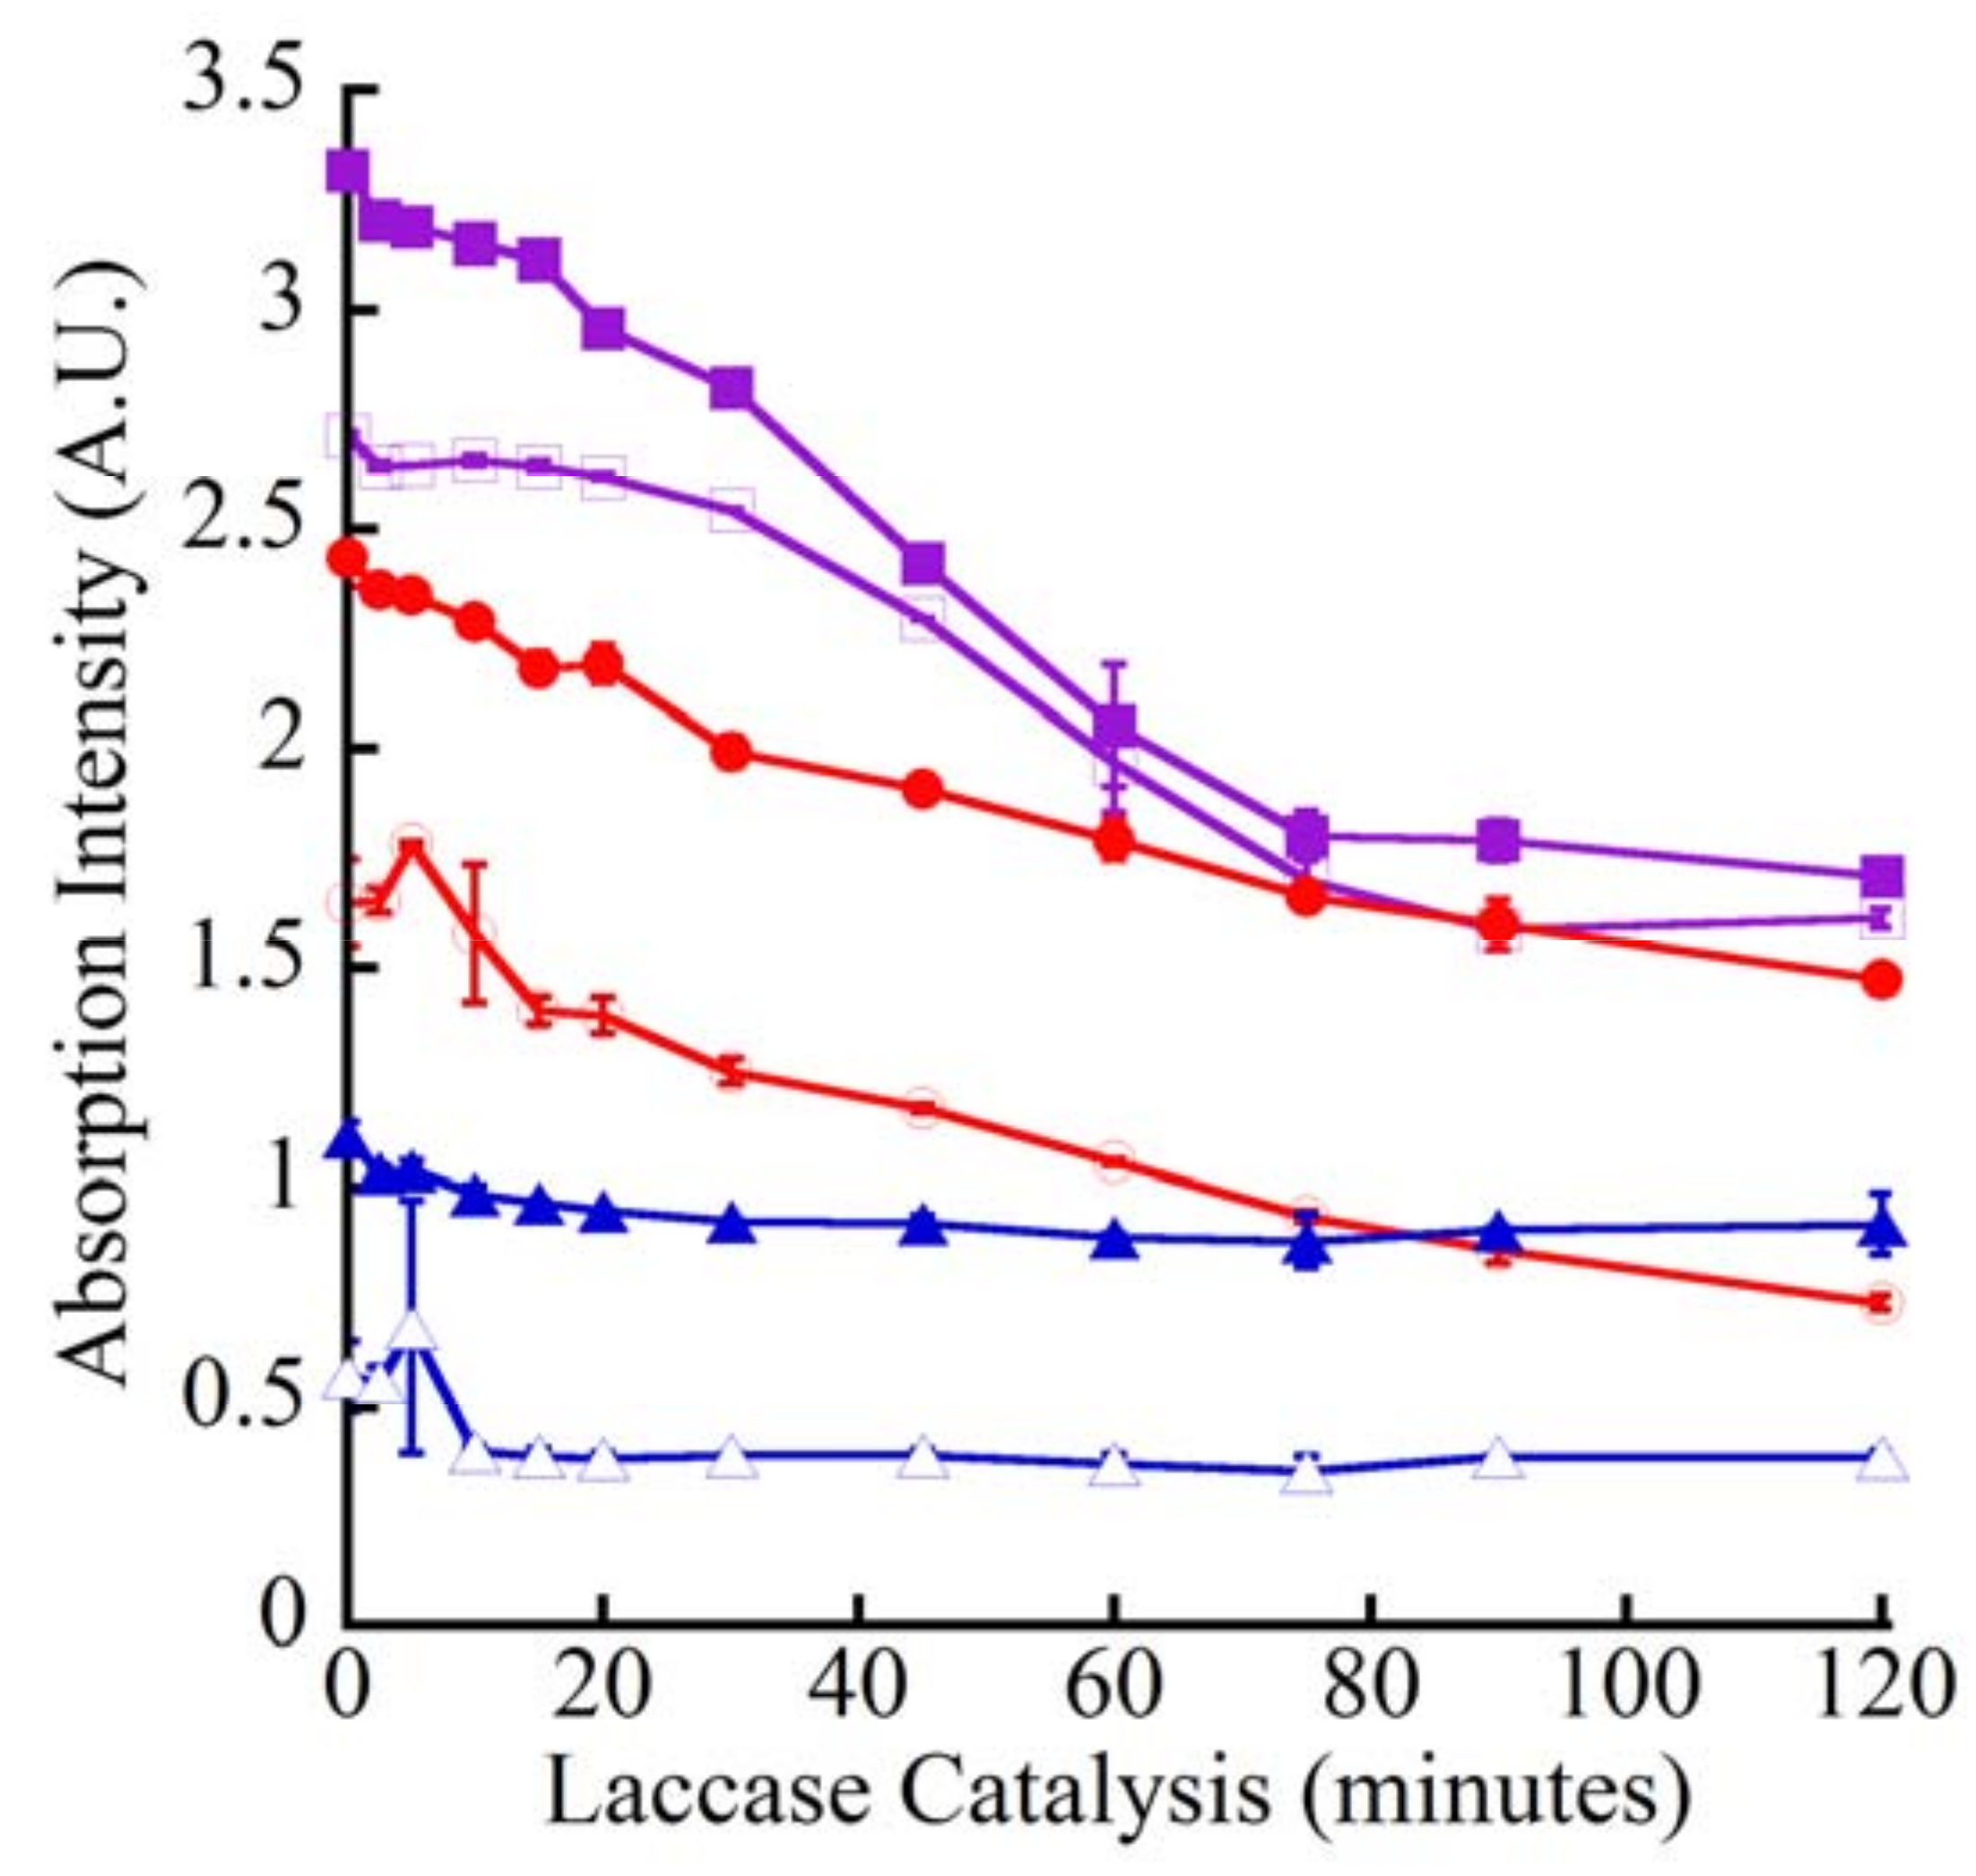
Figure 2.
Laccase kinetic (260 nm) and pseudo-kinetic (290 nm) oxidation of CA. Laccase (0.1 μg/mL) was used to oxidize 500 μM CA in 100 μL of pH 4.5 buffer using UV-transparent 96-well microplate. Absorbance decrease from identical reactions was measured at 260 nm (open symbols) for the indicated time periods. Pseudo-kinetic reactions were stopped with base (100 mM NaOH) and absorbance decreases were measured at 290 nm (closed symbols). The CA samples analyzed were from Alfa Aesar (open and closed triangles, blue tracings), Acros Organics (open and closed circles, red tracings) and Sigma-Aldrich (open and closed squares, purple tracings).
Figure 3.
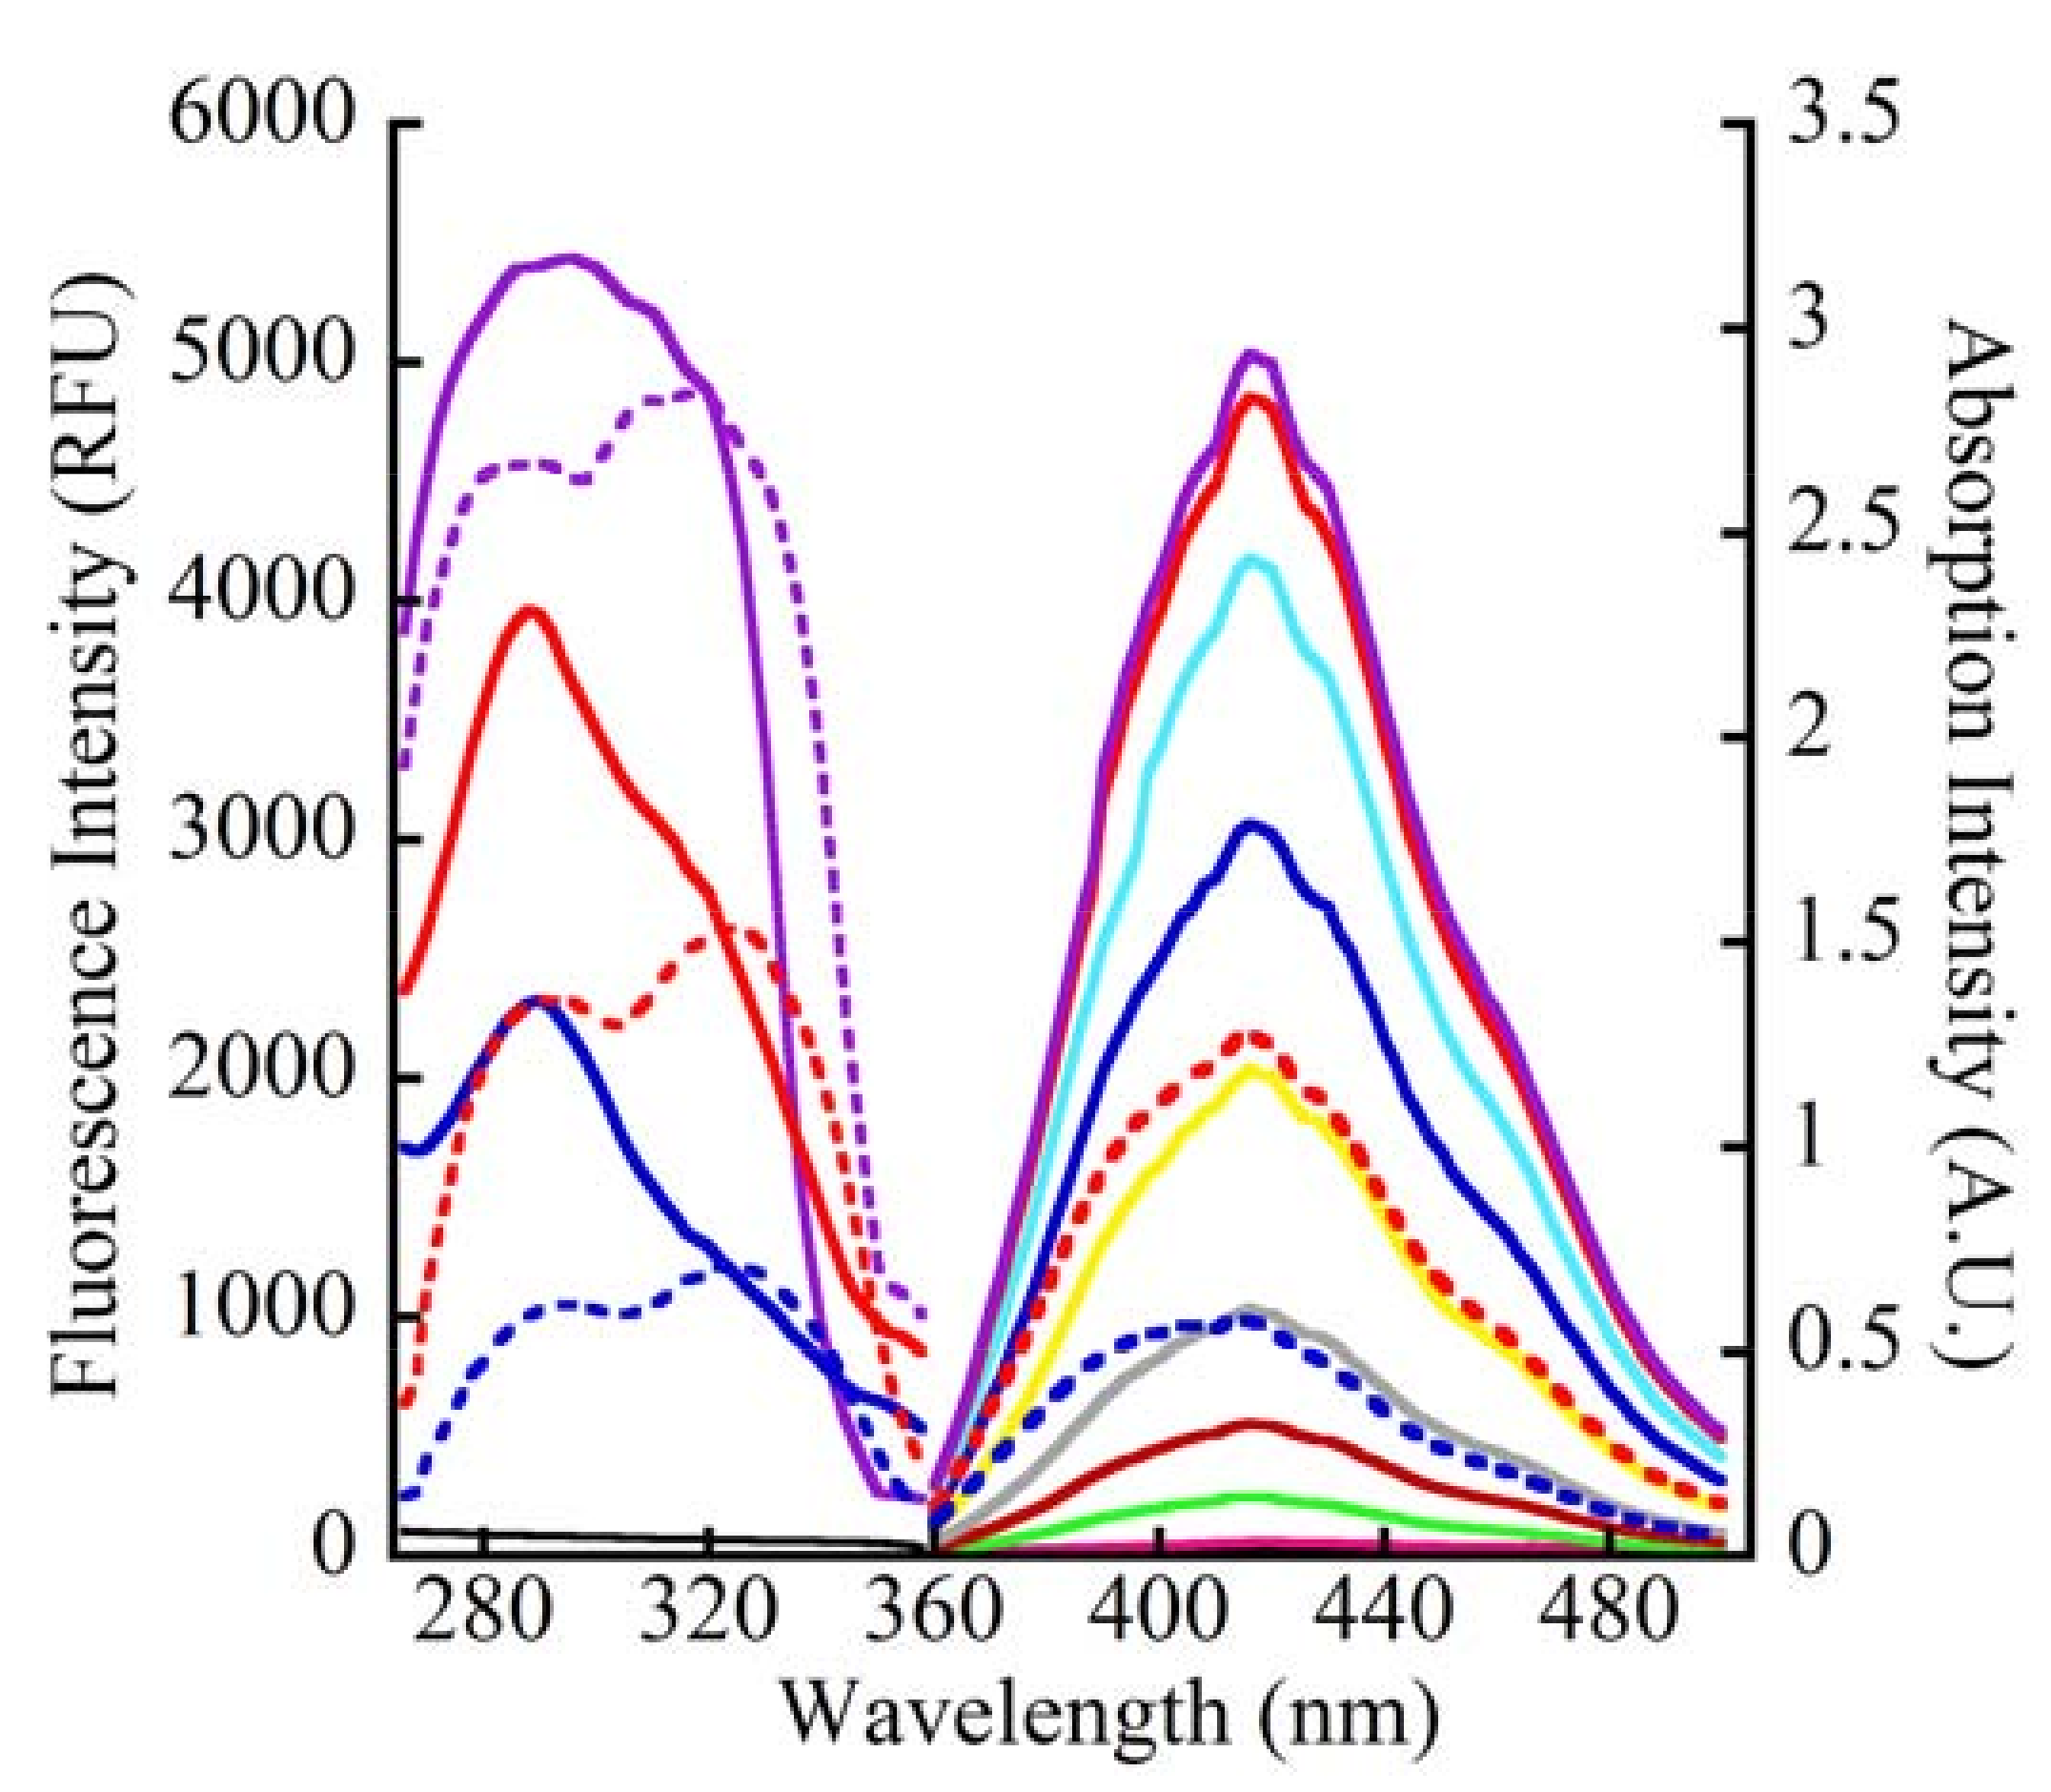
Absorption, excitation and emission spectra of CA. Left panel: Unmodified CA (100 μL of 500 μM CA in 100 mM NaOH) was dispensed into a 96-well UV-transparent microplate. Absorption was monitored between 250 to 350 nm in 2 nm intervals (solid tracings) for CA purchased from Alfa Aesar (blue), Acros Organics (red) and Sigma-Aldrich (purple). Excitation spectral profiles (broken tracings) were monitored between 250 to 350 nm in 2 nm intervals (emission = 420 nm) from CA purchased from Alfa Aesar (blue), Acros Organics (red) and Sigma-Aldrich (purple). The absorption and excitation profiles from 100 mM NaOH background are shown by the solid black tracing close to the abscissa. Right panel: The emission profiles of 100 μL of CA in 100 mM NaOH ranged from 360 to 500 nm in 2 nm intervals with an excitation wavelength of 290 nm. Fluorescence emission with increasing intensities represented by the solid tracings were from the following concentrations (μM) of Sigma-Aldrich CA: 1.0 (magenta), 2.5 (green), 5 (maroon), 10 (grey), 25 (yellow), 50 (blue), 100 (aqua), 250 (red) and 500 (purple). The broken red and blue tracings represent the fluorescence emission from 500 μM of CA from Acros Organics and Alfa Aesar, respectively. The black tracing close the abscissa is the background from 100 mM NaOH.
Figure 3.
Absorption, excitation and emission spectra of CA. Left panel: Unmodified CA (100 μL of 500 μM CA in 100 mM NaOH) was dispensed into a 96-well UV-transparent microplate. Absorption was monitored between 250 to 350 nm in 2 nm intervals (solid tracings) for CA purchased from Alfa Aesar (blue), Acros Organics (red) and Sigma-Aldrich (purple). Excitation spectral profiles (broken tracings) were monitored between 250 to 350 nm in 2 nm intervals (emission = 420 nm) from CA purchased from Alfa Aesar (blue), Acros Organics (red) and Sigma-Aldrich (purple). The absorption and excitation profiles from 100 mM NaOH background are shown by the solid black tracing close to the abscissa. Right panel: The emission profiles of 100 μL of CA in 100 mM NaOH ranged from 360 to 500 nm in 2 nm intervals with an excitation wavelength of 290 nm. Fluorescence emission with increasing intensities represented by the solid tracings were from the following concentrations (μM) of Sigma-Aldrich CA: 1.0 (magenta), 2.5 (green), 5 (maroon), 10 (grey), 25 (yellow), 50 (blue), 100 (aqua), 250 (red) and 500 (purple). The broken red and blue tracings represent the fluorescence emission from 500 μM of CA from Acros Organics and Alfa Aesar, respectively. The black tracing close the abscissa is the background from 100 mM NaOH.
![Molecules 15 01645 g003]()
Figure 4.
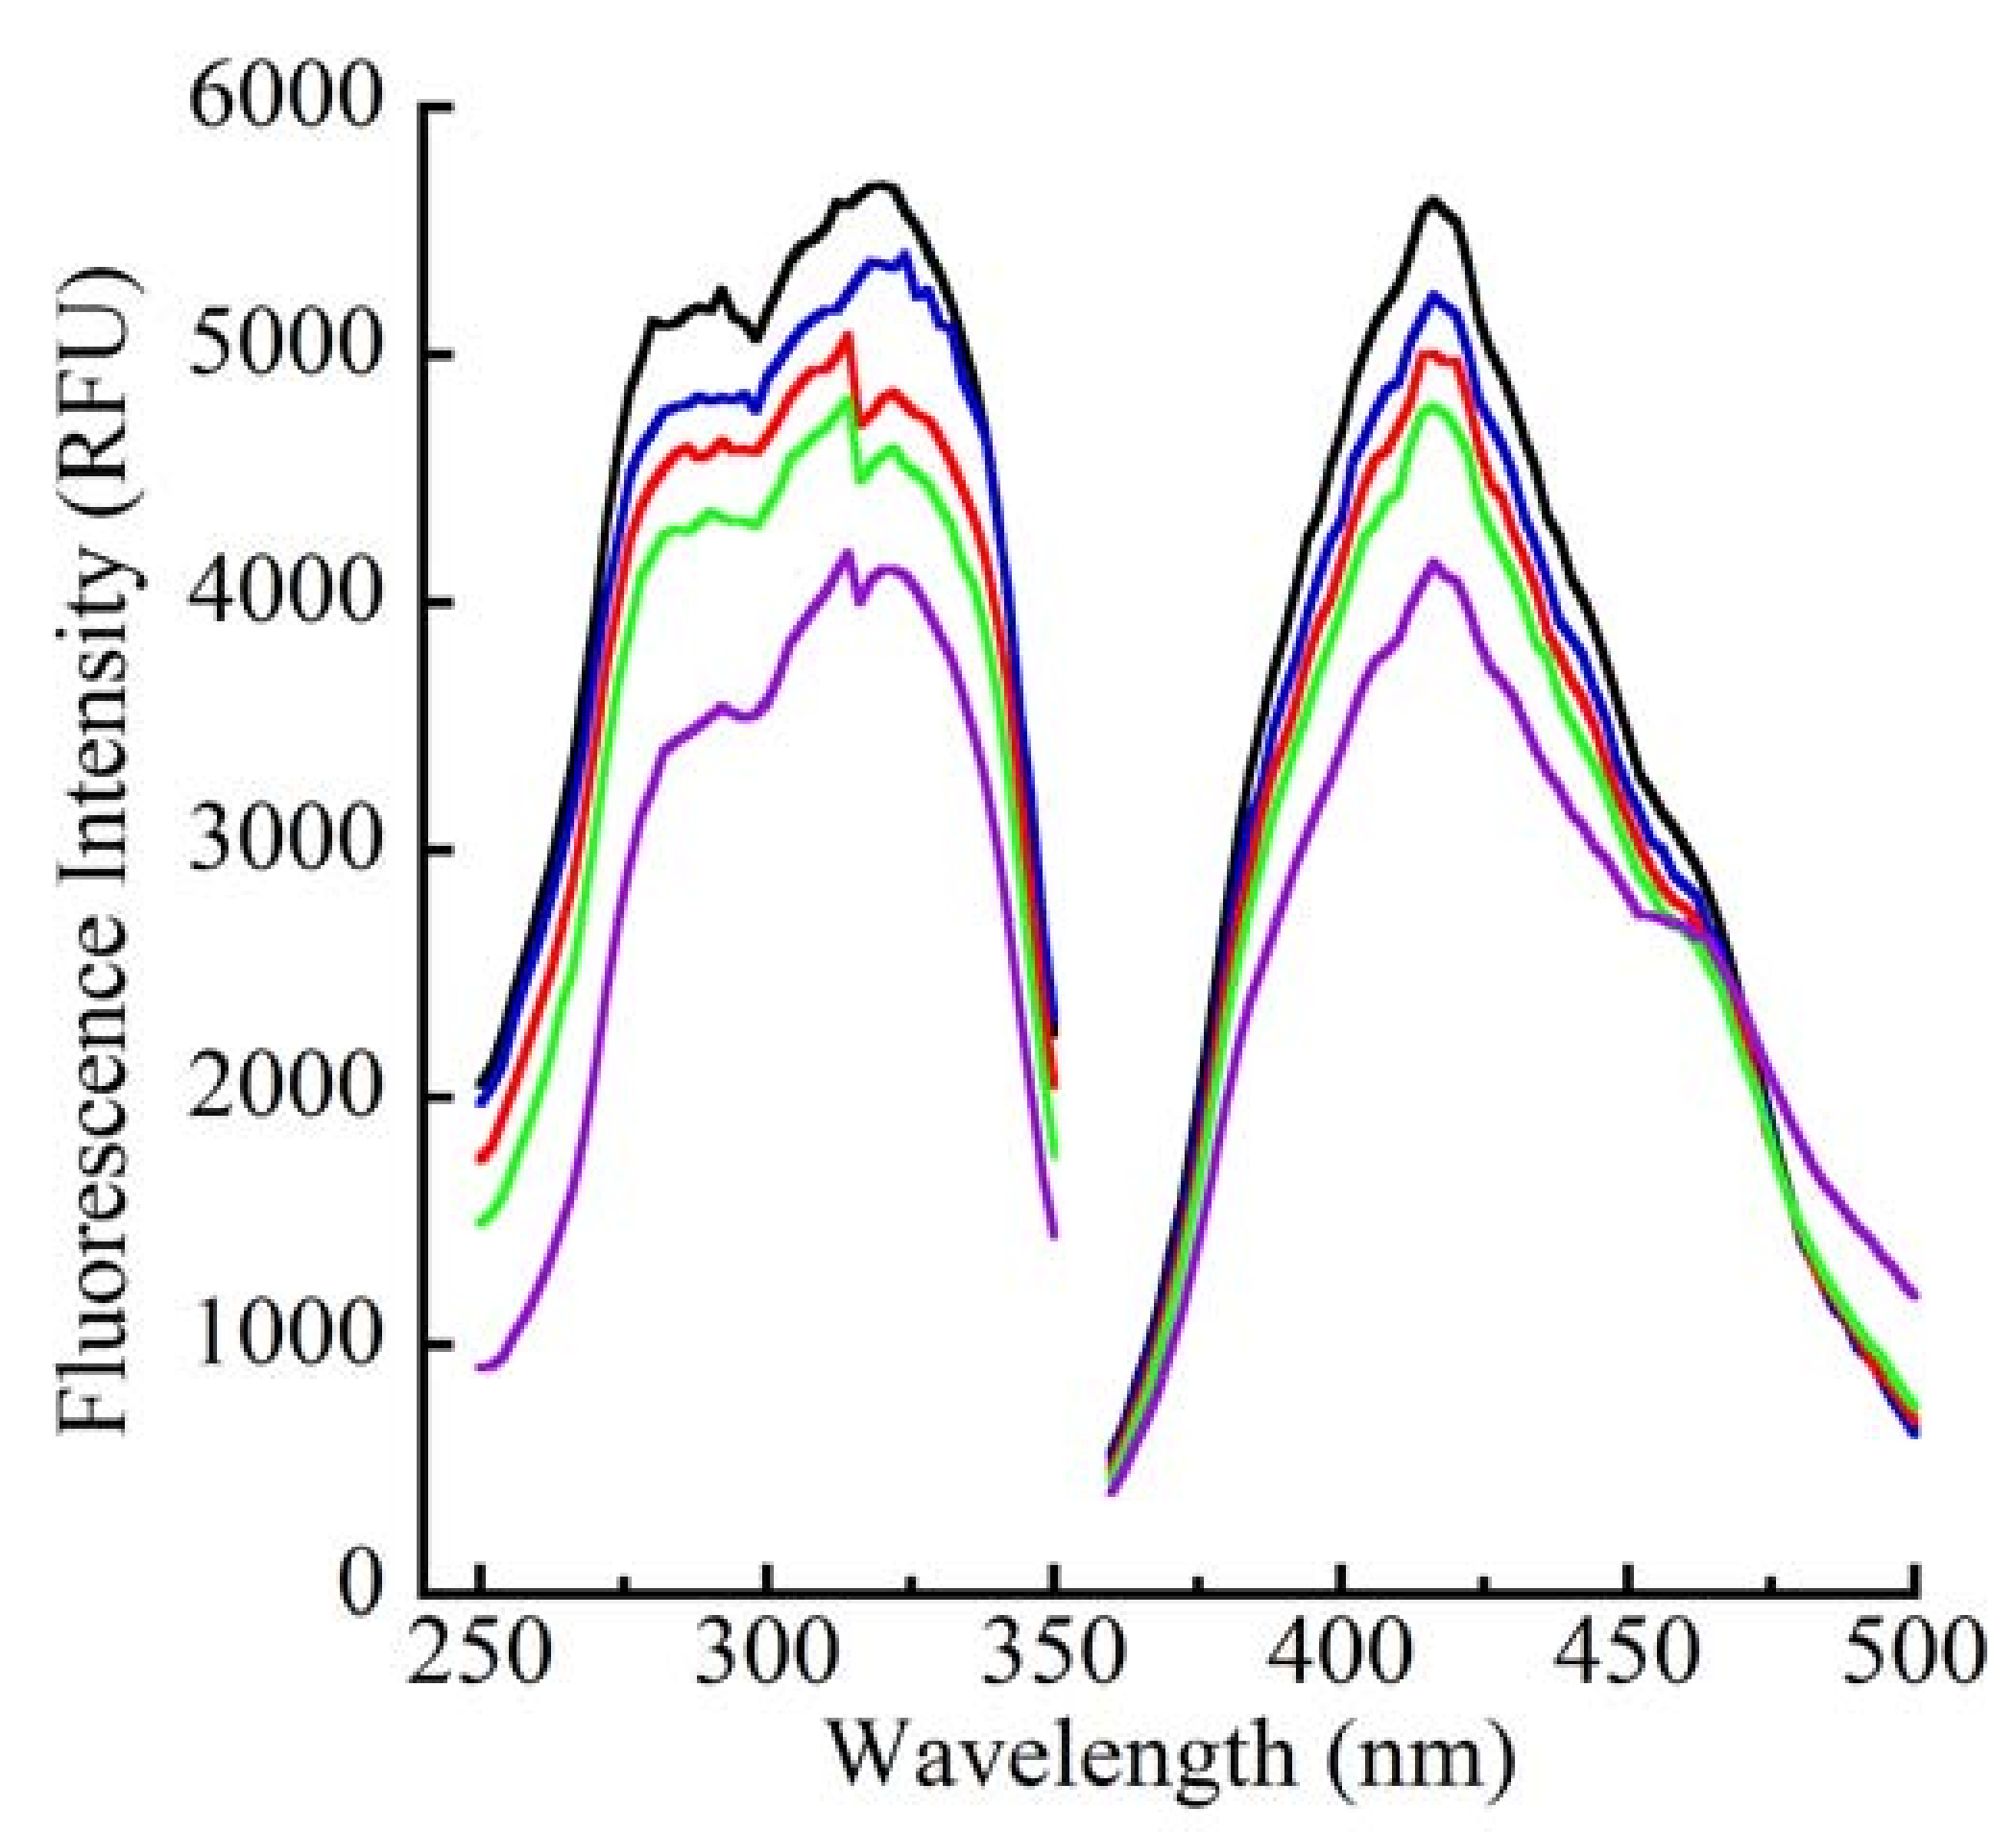
Excitation and emission spectra of laccase-oxidized CA. Increasing concentrations of laccase were reacted with 250 μM CA in 100 μL of citrate buffer, pH 4.5. Reactions were carried out in 96-well UV-transparent microplate and stopped at 30 min through the addition of 250 mM KOH. The pH 4.5 reactions were cloudy due to the formation of DHPs. The cloudiness disappeared upon basification yielding clear solutions that were scanned over the excitation wavelengths of 250 to 350 nm in 2 nm intervals (λem, 416 nm) (left panel). The black tracing with the highest fluorescence is the excitation spectrum of 250 μM unmodified CA. The profiles with decreasing fluorescence intensities represent the excitation spectra of CA oxidized by 0.01 (blue), 0.05 (red), 0.1 (green) and 0.25 (purple) μg/mL laccase. Samples were then excited using 310 nm wavelength and the emission was scanned between 360 and 500 nm in 2 nm intervals (right panel). The black tracing with the highest fluorescence intensity is the emission spectrum of 250 μM unmodified CA. The tracings with progressively declining fluorescence intensities represent the emission spectra of CA oxidized using 0.01 (blue), 0.05 (red), 0.1 (green) and 0.25 (purple) μg/mL laccase.
Figure 4.
Excitation and emission spectra of laccase-oxidized CA. Increasing concentrations of laccase were reacted with 250 μM CA in 100 μL of citrate buffer, pH 4.5. Reactions were carried out in 96-well UV-transparent microplate and stopped at 30 min through the addition of 250 mM KOH. The pH 4.5 reactions were cloudy due to the formation of DHPs. The cloudiness disappeared upon basification yielding clear solutions that were scanned over the excitation wavelengths of 250 to 350 nm in 2 nm intervals (λem, 416 nm) (left panel). The black tracing with the highest fluorescence is the excitation spectrum of 250 μM unmodified CA. The profiles with decreasing fluorescence intensities represent the excitation spectra of CA oxidized by 0.01 (blue), 0.05 (red), 0.1 (green) and 0.25 (purple) μg/mL laccase. Samples were then excited using 310 nm wavelength and the emission was scanned between 360 and 500 nm in 2 nm intervals (right panel). The black tracing with the highest fluorescence intensity is the emission spectrum of 250 μM unmodified CA. The tracings with progressively declining fluorescence intensities represent the emission spectra of CA oxidized using 0.01 (blue), 0.05 (red), 0.1 (green) and 0.25 (purple) μg/mL laccase.
![Molecules 15 01645 g004]()
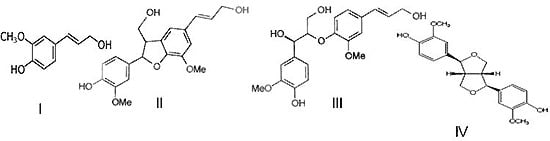
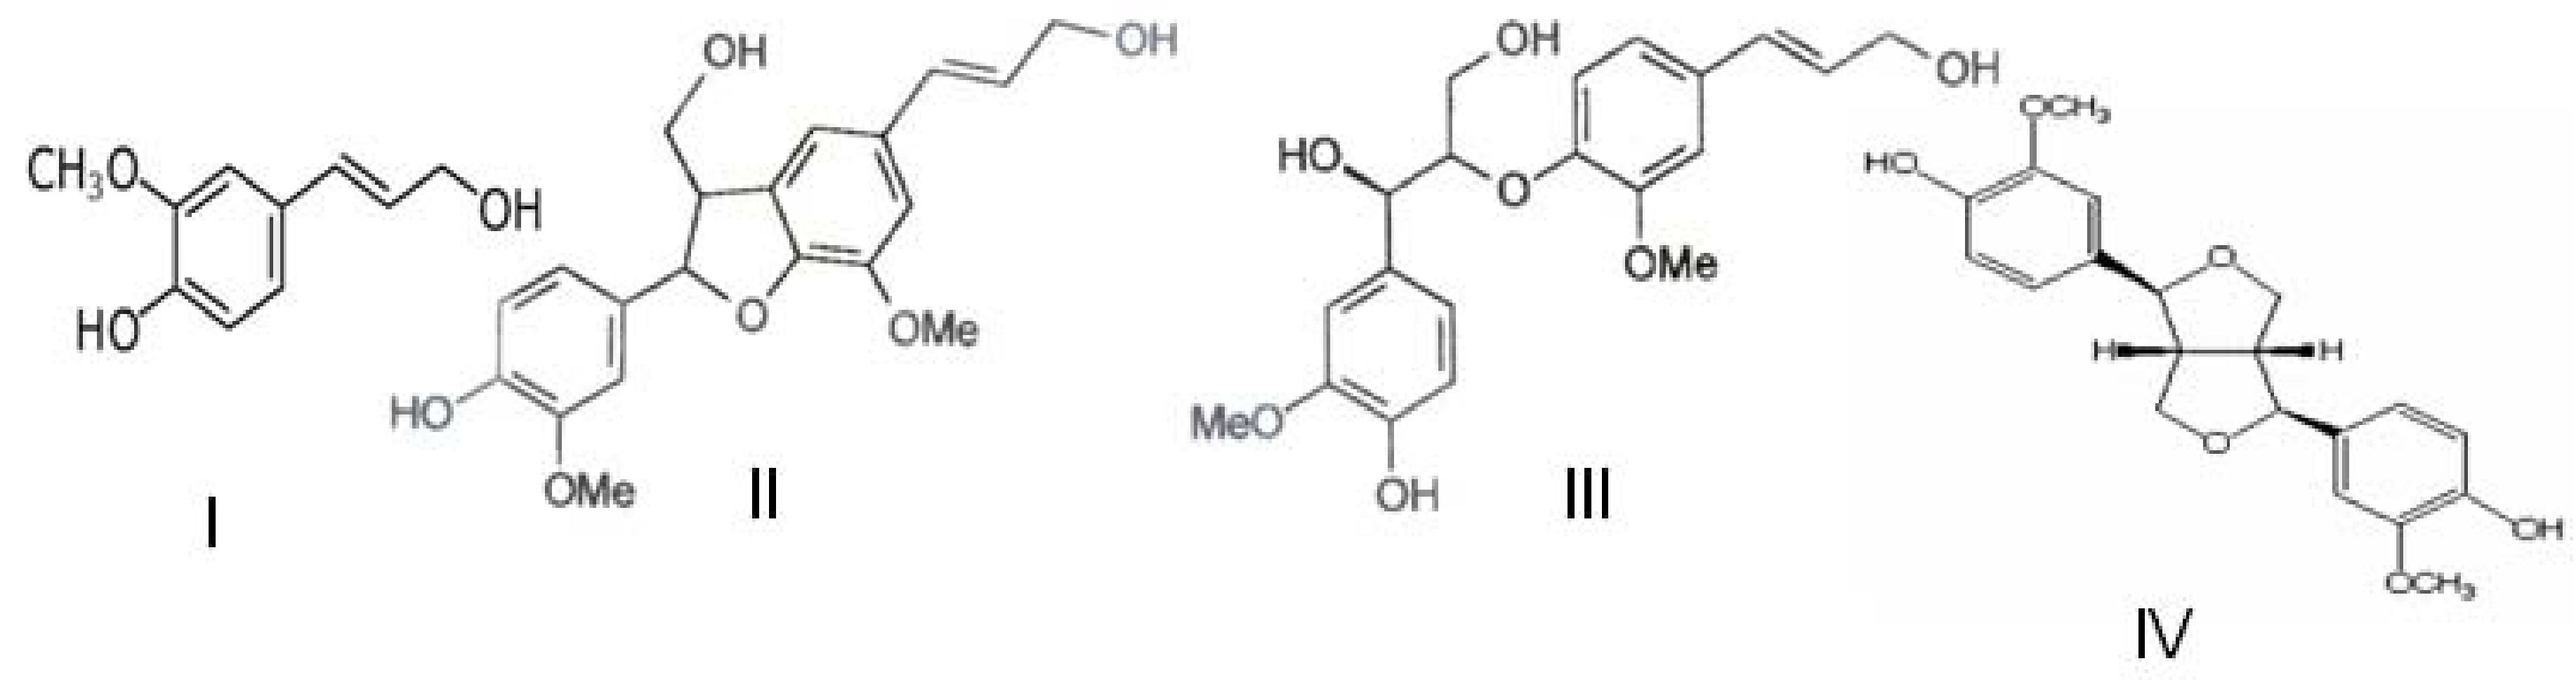
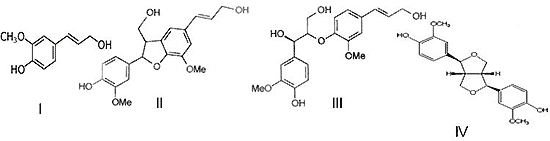
Scheme 1.
Chemical structures of CA and its main oxidation products. The various compounds shown are: coniferyl alcohol or CA (I), β-5 dehydrodimer or dehydrodiconiferyl alcohol (II), β-O-4 dehydrodimer or guaiacylglycerol β-O-4 coniferyl alchol ether (III) and β-β-dehydrodimer or pinoresinol (IV). It should be noted that compound III occurs in two different diastereoisomeric configurations of erythro-guaiacylglycerol-β-coniferyl ether and threo-guaiacylglycerol-β-coniferyl ether. In addition to these compounds, the so called dehydrogenation polymers (DHPs) and oligomers might also be formed depending upon the catalytic conditions such as the type and amount of enzyme (laccase or peroxidase) used, the duration of catalysis, reaction temperature, the concentration of the substrate, and other conditions.
Figure 5.
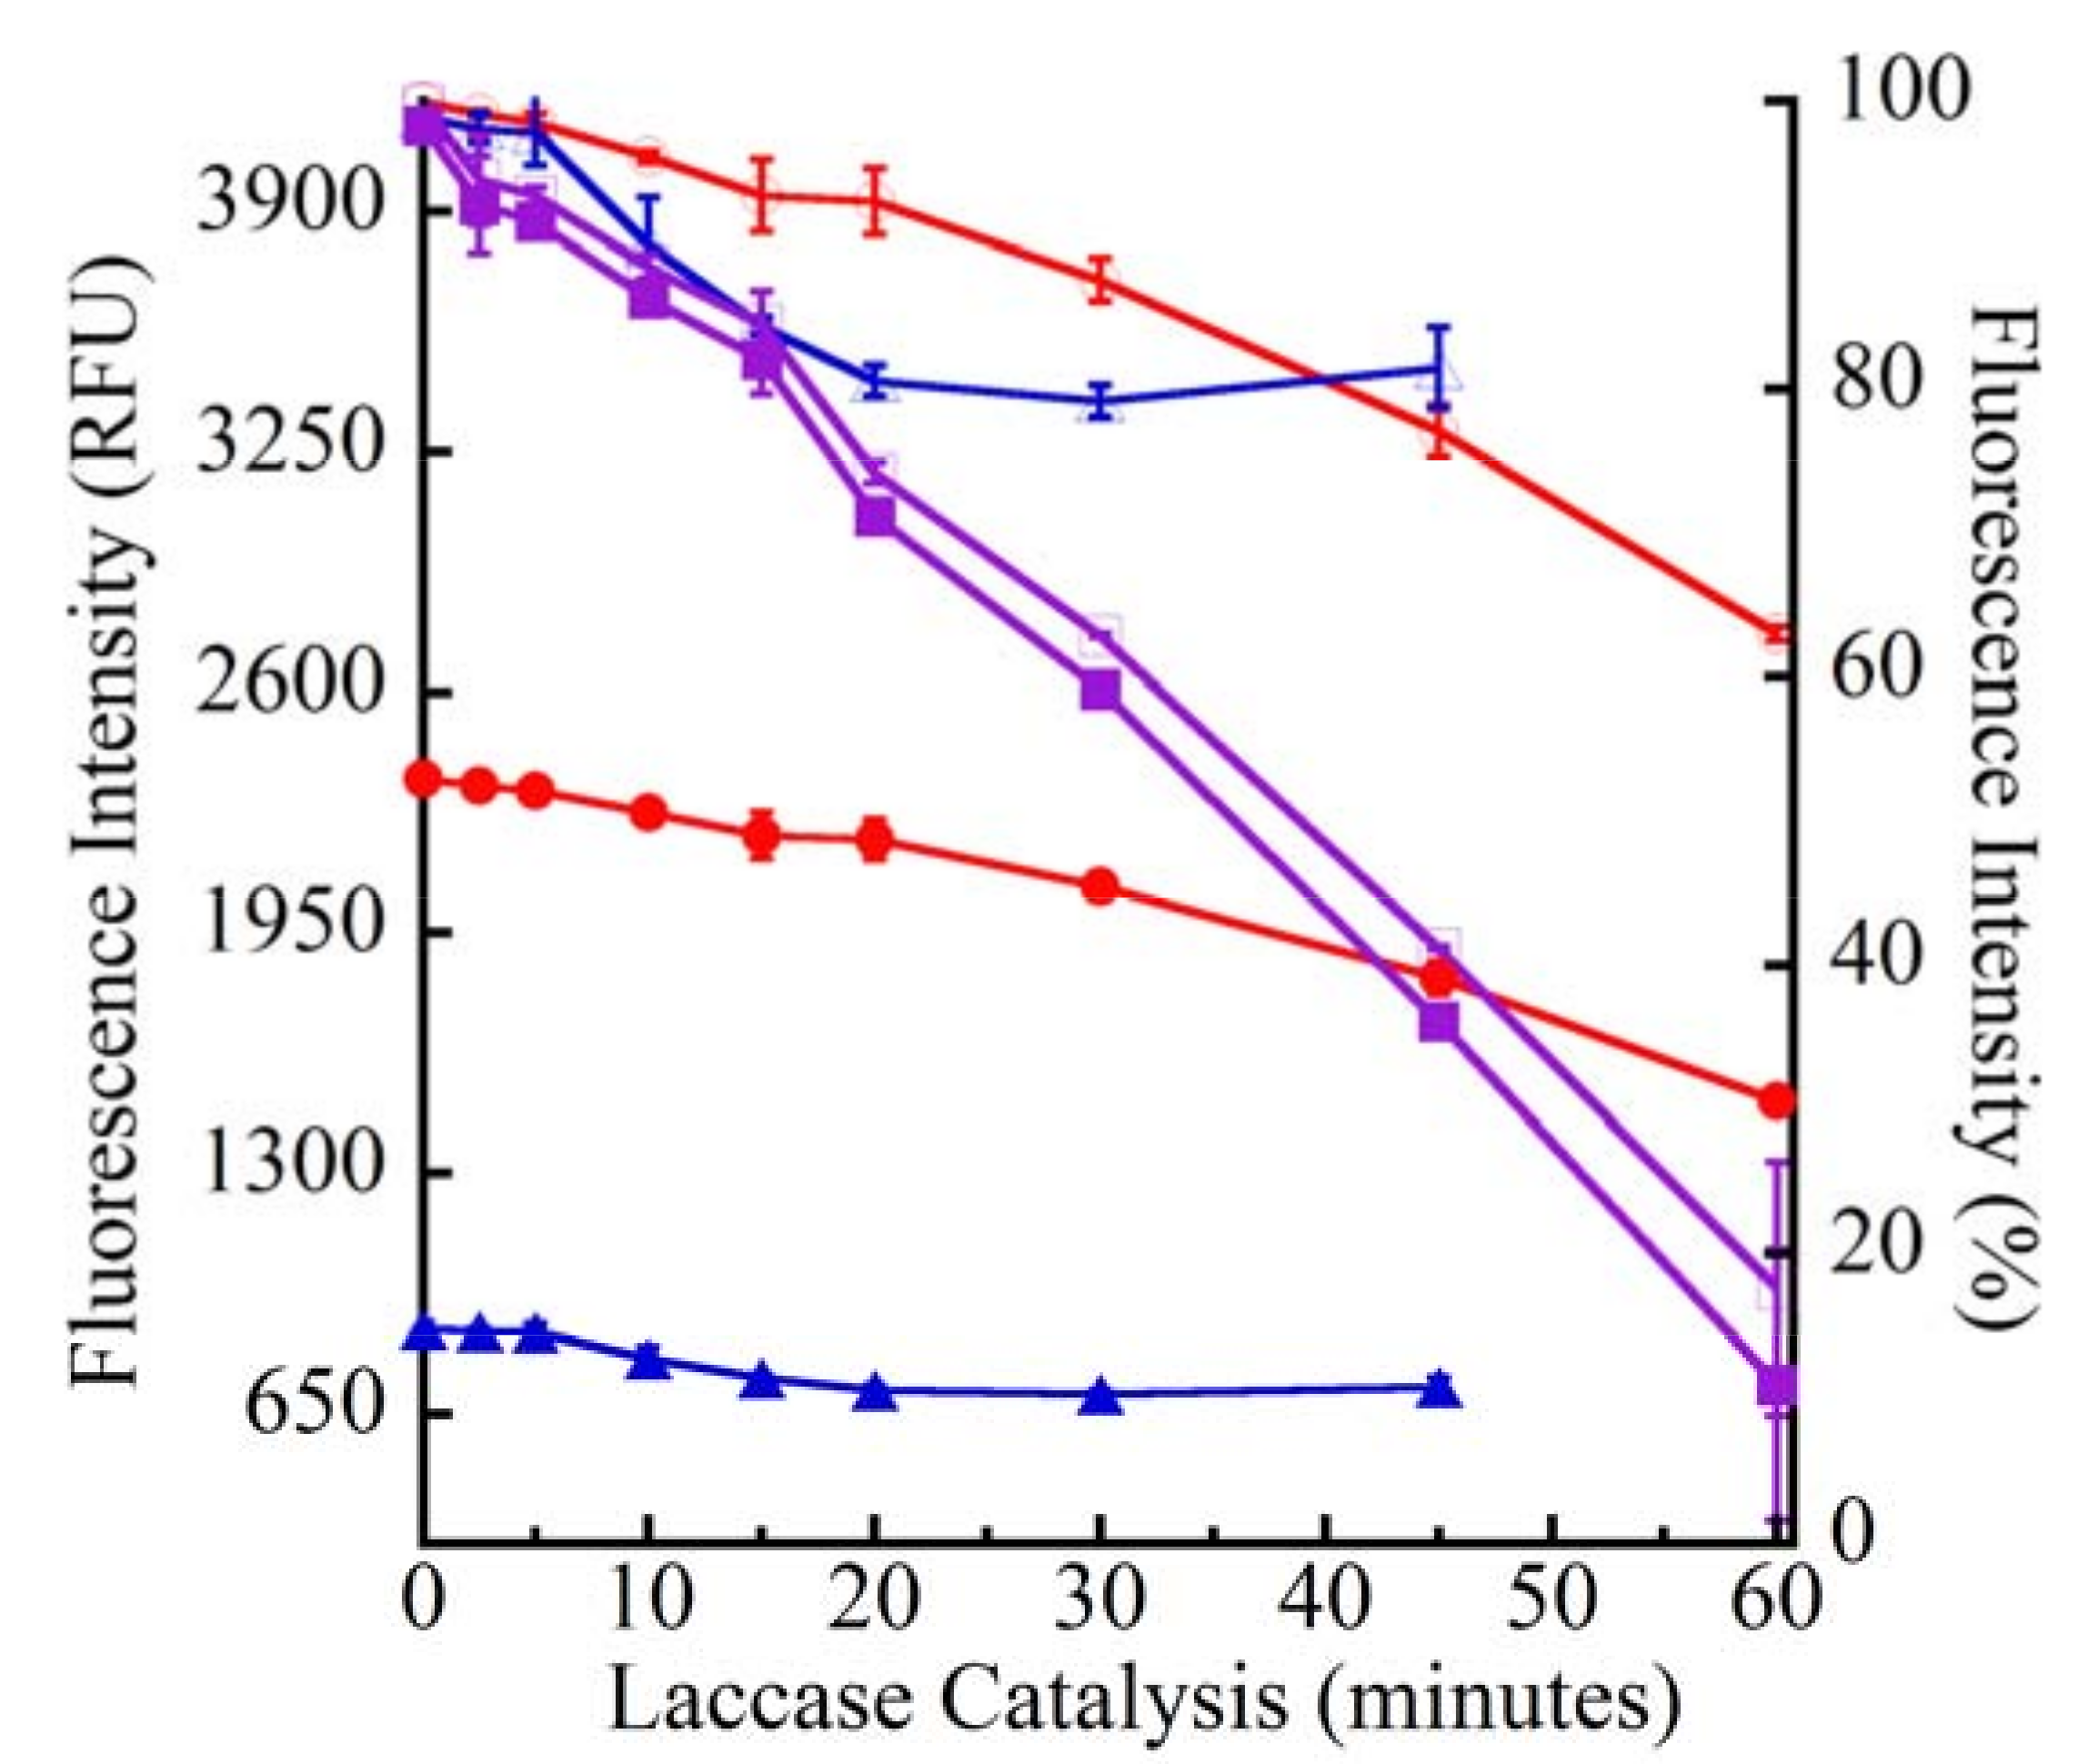
Laccase pseudo-kinetic oxidation of CA. Laccase (0.1 μg/mL) was used to oxidize 500 μM CA in pH 4.5 buffer in 96-well UV-transparent microplate. Identical reaction sets were stopped at the indicated time points using base (100 mM NaOH). The CA samples were then excited using 290 nm wavelength and the emission was monitored at 416 nm. The CA samples analyzed were purchased from Alfa Aesar (open and closed triangles, blue tracings), Acros Organics (open and closed circles, red tracings) and Sigma-Aldrich (open and closed squares, purple tracings). Open symbols represent percent decrease in fluorescence intensity and closed symbols are fluorescence intensities (RFU).
Figure 5.
Laccase pseudo-kinetic oxidation of CA. Laccase (0.1 μg/mL) was used to oxidize 500 μM CA in pH 4.5 buffer in 96-well UV-transparent microplate. Identical reaction sets were stopped at the indicated time points using base (100 mM NaOH). The CA samples were then excited using 290 nm wavelength and the emission was monitored at 416 nm. The CA samples analyzed were purchased from Alfa Aesar (open and closed triangles, blue tracings), Acros Organics (open and closed circles, red tracings) and Sigma-Aldrich (open and closed squares, purple tracings). Open symbols represent percent decrease in fluorescence intensity and closed symbols are fluorescence intensities (RFU).
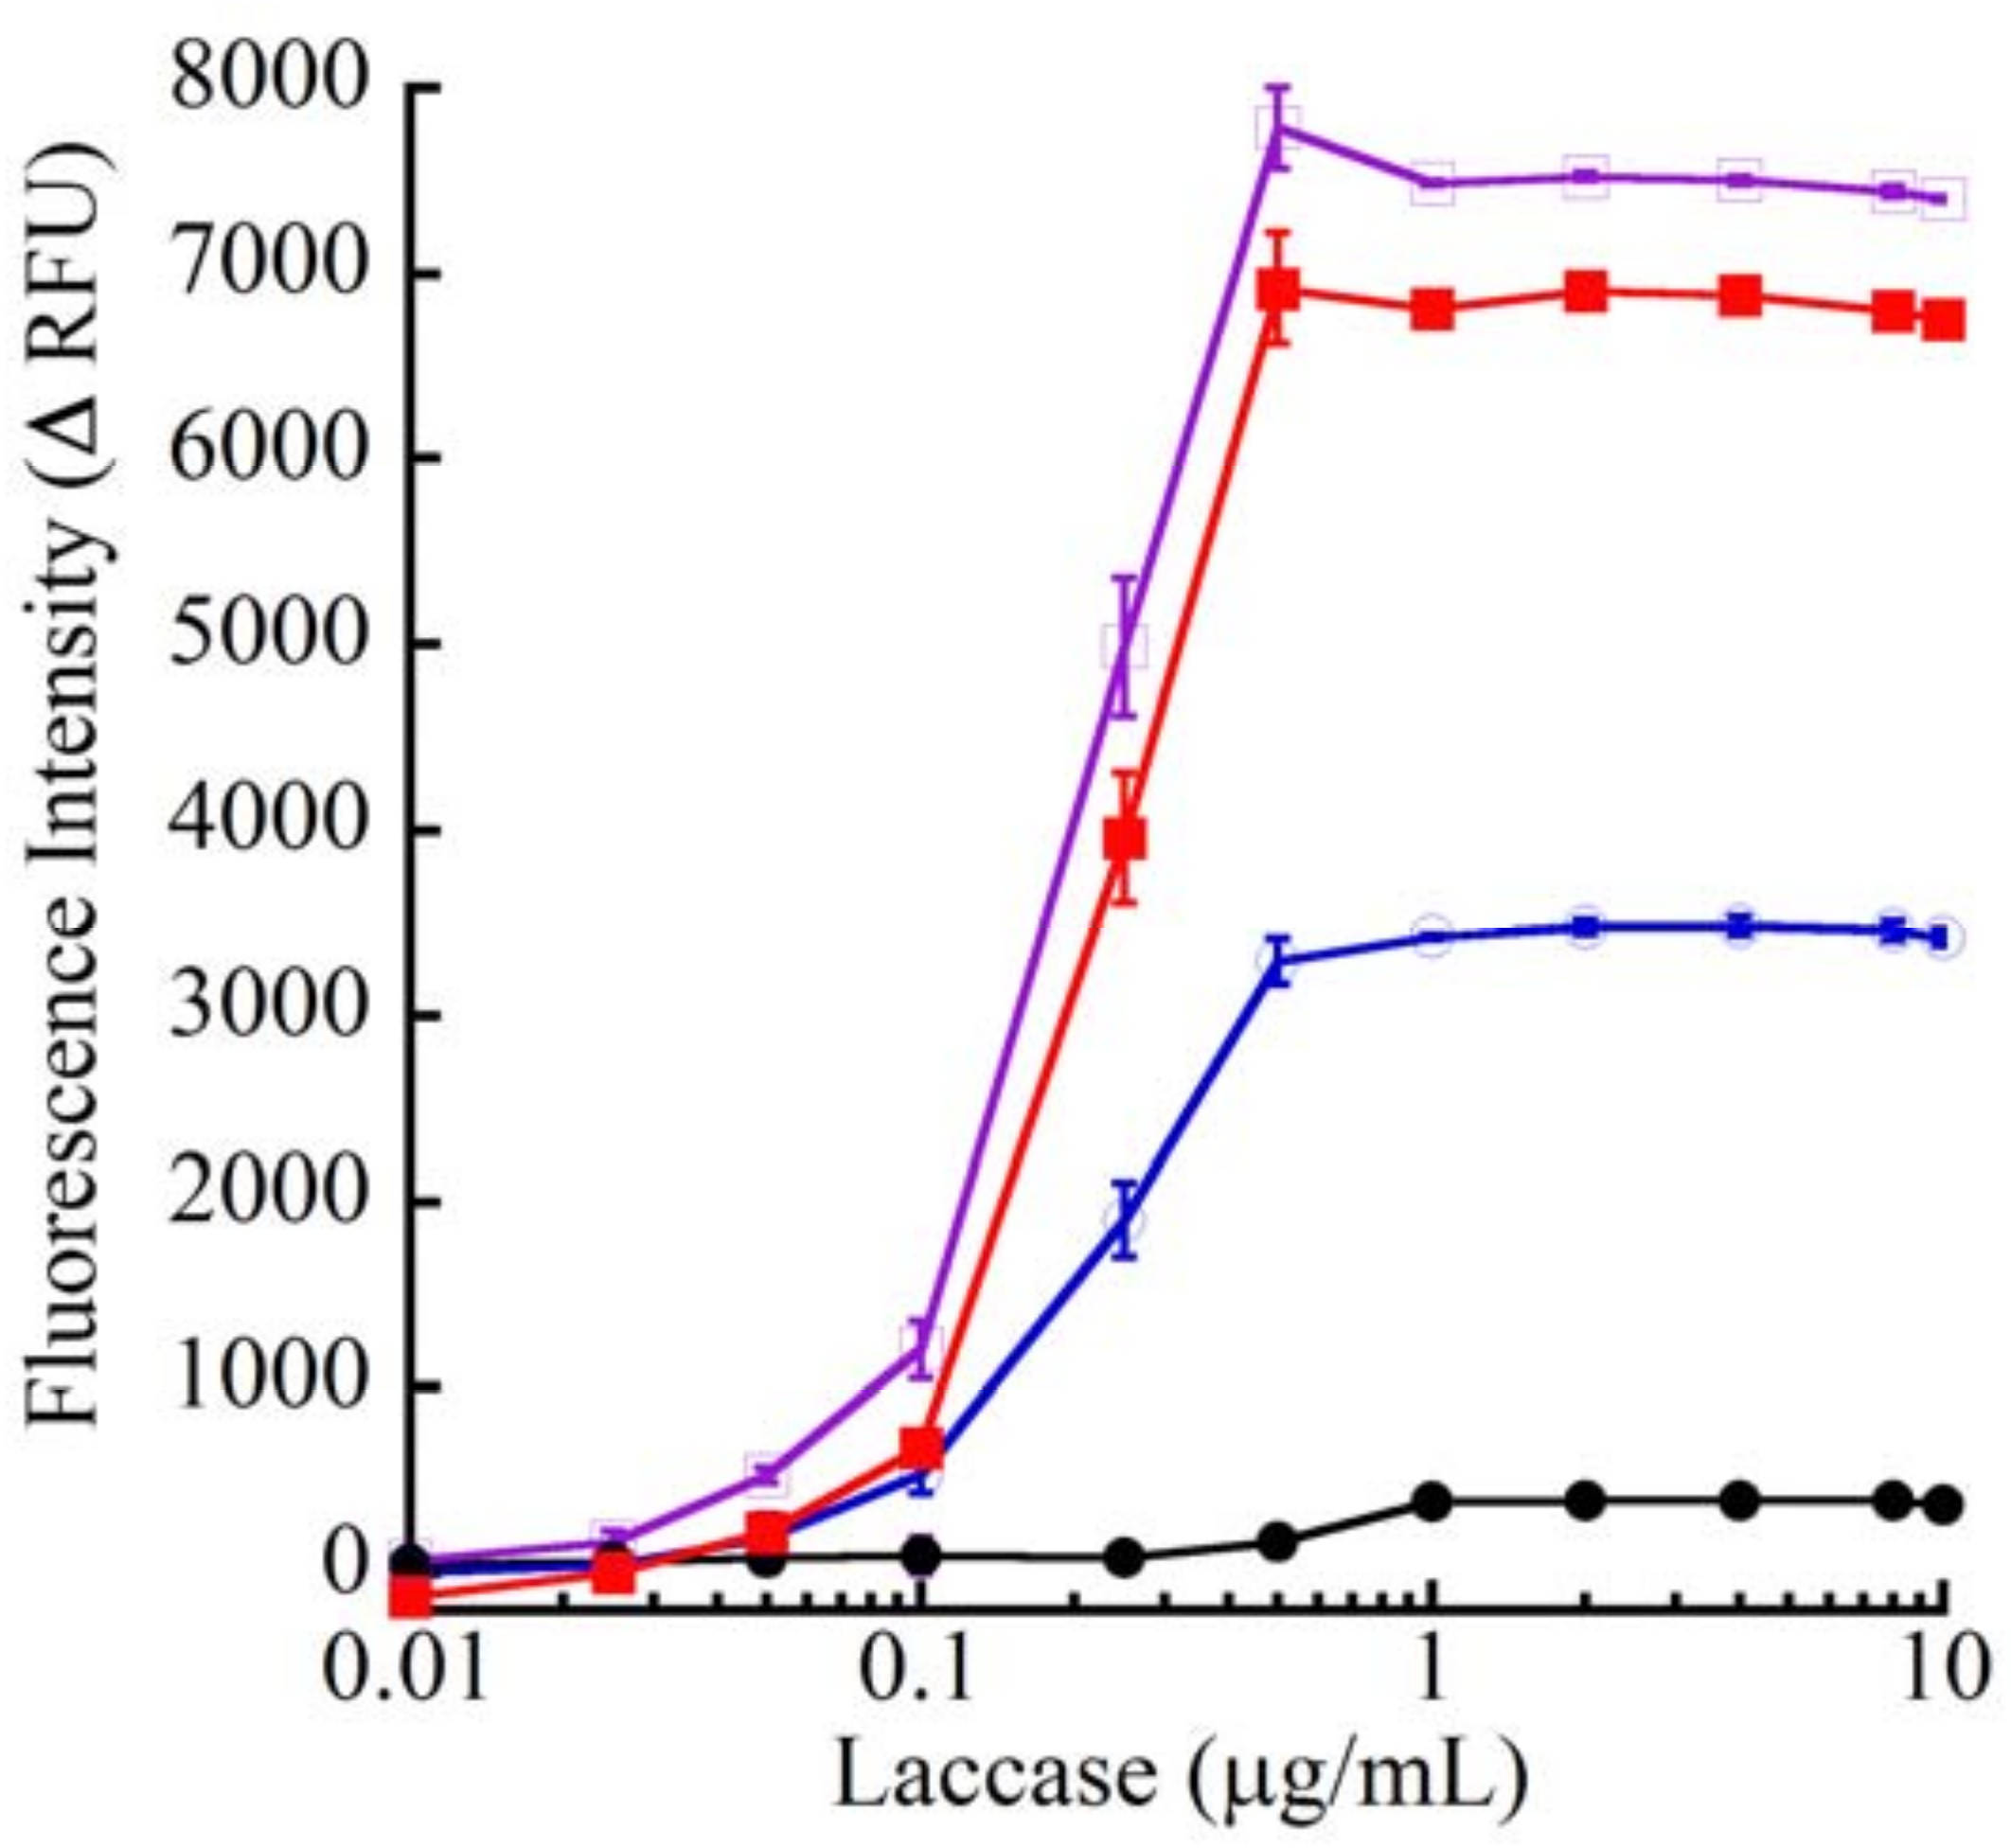
Figure 6.
Laccase dose-response for CA oxidation. Increasing concentrations of laccase were used to oxidize 500 μM CA for 60 min. Reactions were carried out in 96-well white plate (100 μL/well) and stopped using 250 mM KOH (endpoint mode). Fluorescence was measured at 416 nm after exciting the samples using 290 nm (open squares, purple tracing), 310 nm (closed squares, red tracing), 340 nm (open circles, blue tracing) and 360 nm (closed circles, black tracing).
Figure 7.
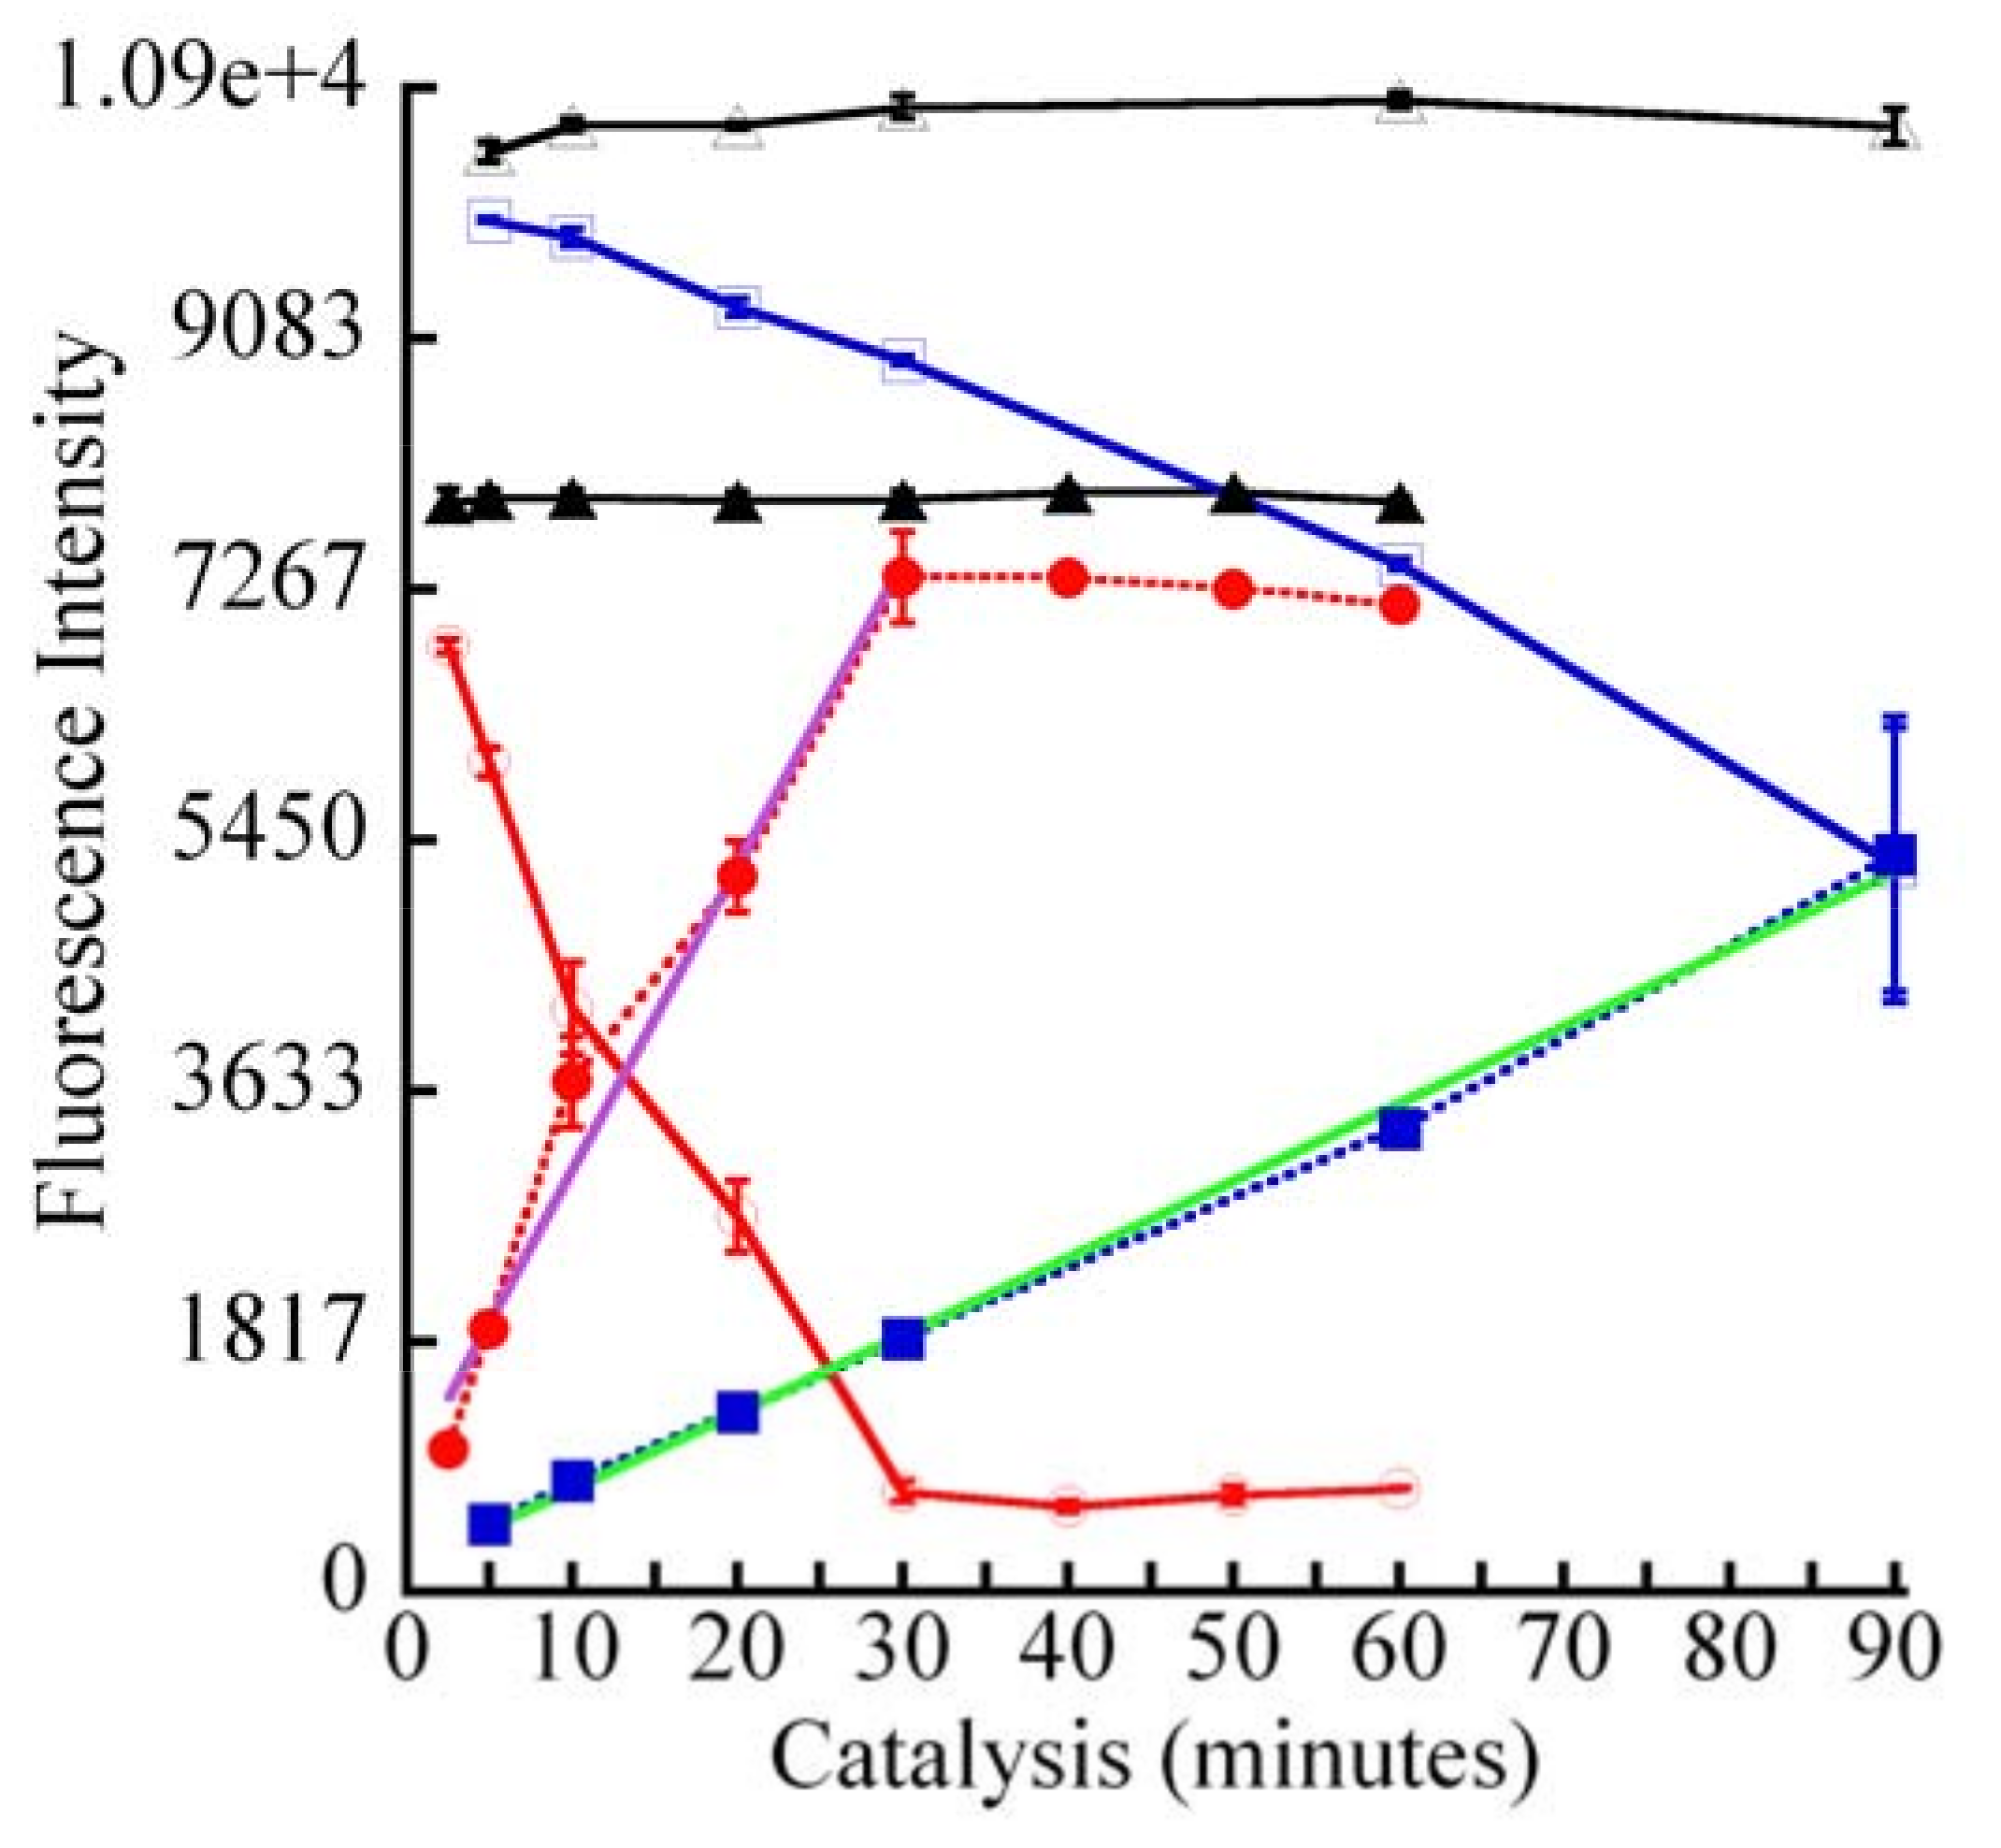
Pseudo-kinetics of laccase- and peroxidase-catalyzed oxidation of CA. Laccase (0.5 μg/mL) or peroxidase (0.1 μg/mL) was reacted with 250 μM CA in 96-well white plates for the indicated duration and then stopped with 250 mM KOH. Fluorescence was measured using λex of 290, 310 and 340 nm with λem of 416 nm. Due to the nearly identical kinetic profiles, only the data from λex of 290 nm is shown. The black tracings are “control” fluorescence from unmodified CA during peroxidase (closed triangles) or laccase (open triangles) catalysis. Closed circles (red dotted tracing) represent Δ RFU from peroxidase oxidized CA with linearity (r2) between 2.5 and 30 min of 0.978 (solid purple curve fit). Open circles (solid red tracing) are decreasing emission intensities over time following peroxidase catalysis. Open squares connected by the solid blue tracing represent fluorescence decline due to laccase oxidation of CA. Closed squares connected by dotted blue tracing are the upward trajectory of Δ RFU values from laccase-oxidized CA. Linearity (r2; solid green tracing) was 0.997.
Figure 7.
Pseudo-kinetics of laccase- and peroxidase-catalyzed oxidation of CA. Laccase (0.5 μg/mL) or peroxidase (0.1 μg/mL) was reacted with 250 μM CA in 96-well white plates for the indicated duration and then stopped with 250 mM KOH. Fluorescence was measured using λex of 290, 310 and 340 nm with λem of 416 nm. Due to the nearly identical kinetic profiles, only the data from λex of 290 nm is shown. The black tracings are “control” fluorescence from unmodified CA during peroxidase (closed triangles) or laccase (open triangles) catalysis. Closed circles (red dotted tracing) represent Δ RFU from peroxidase oxidized CA with linearity (r2) between 2.5 and 30 min of 0.978 (solid purple curve fit). Open circles (solid red tracing) are decreasing emission intensities over time following peroxidase catalysis. Open squares connected by the solid blue tracing represent fluorescence decline due to laccase oxidation of CA. Closed squares connected by dotted blue tracing are the upward trajectory of Δ RFU values from laccase-oxidized CA. Linearity (r2; solid green tracing) was 0.997.
![Molecules 15 01645 g007]()
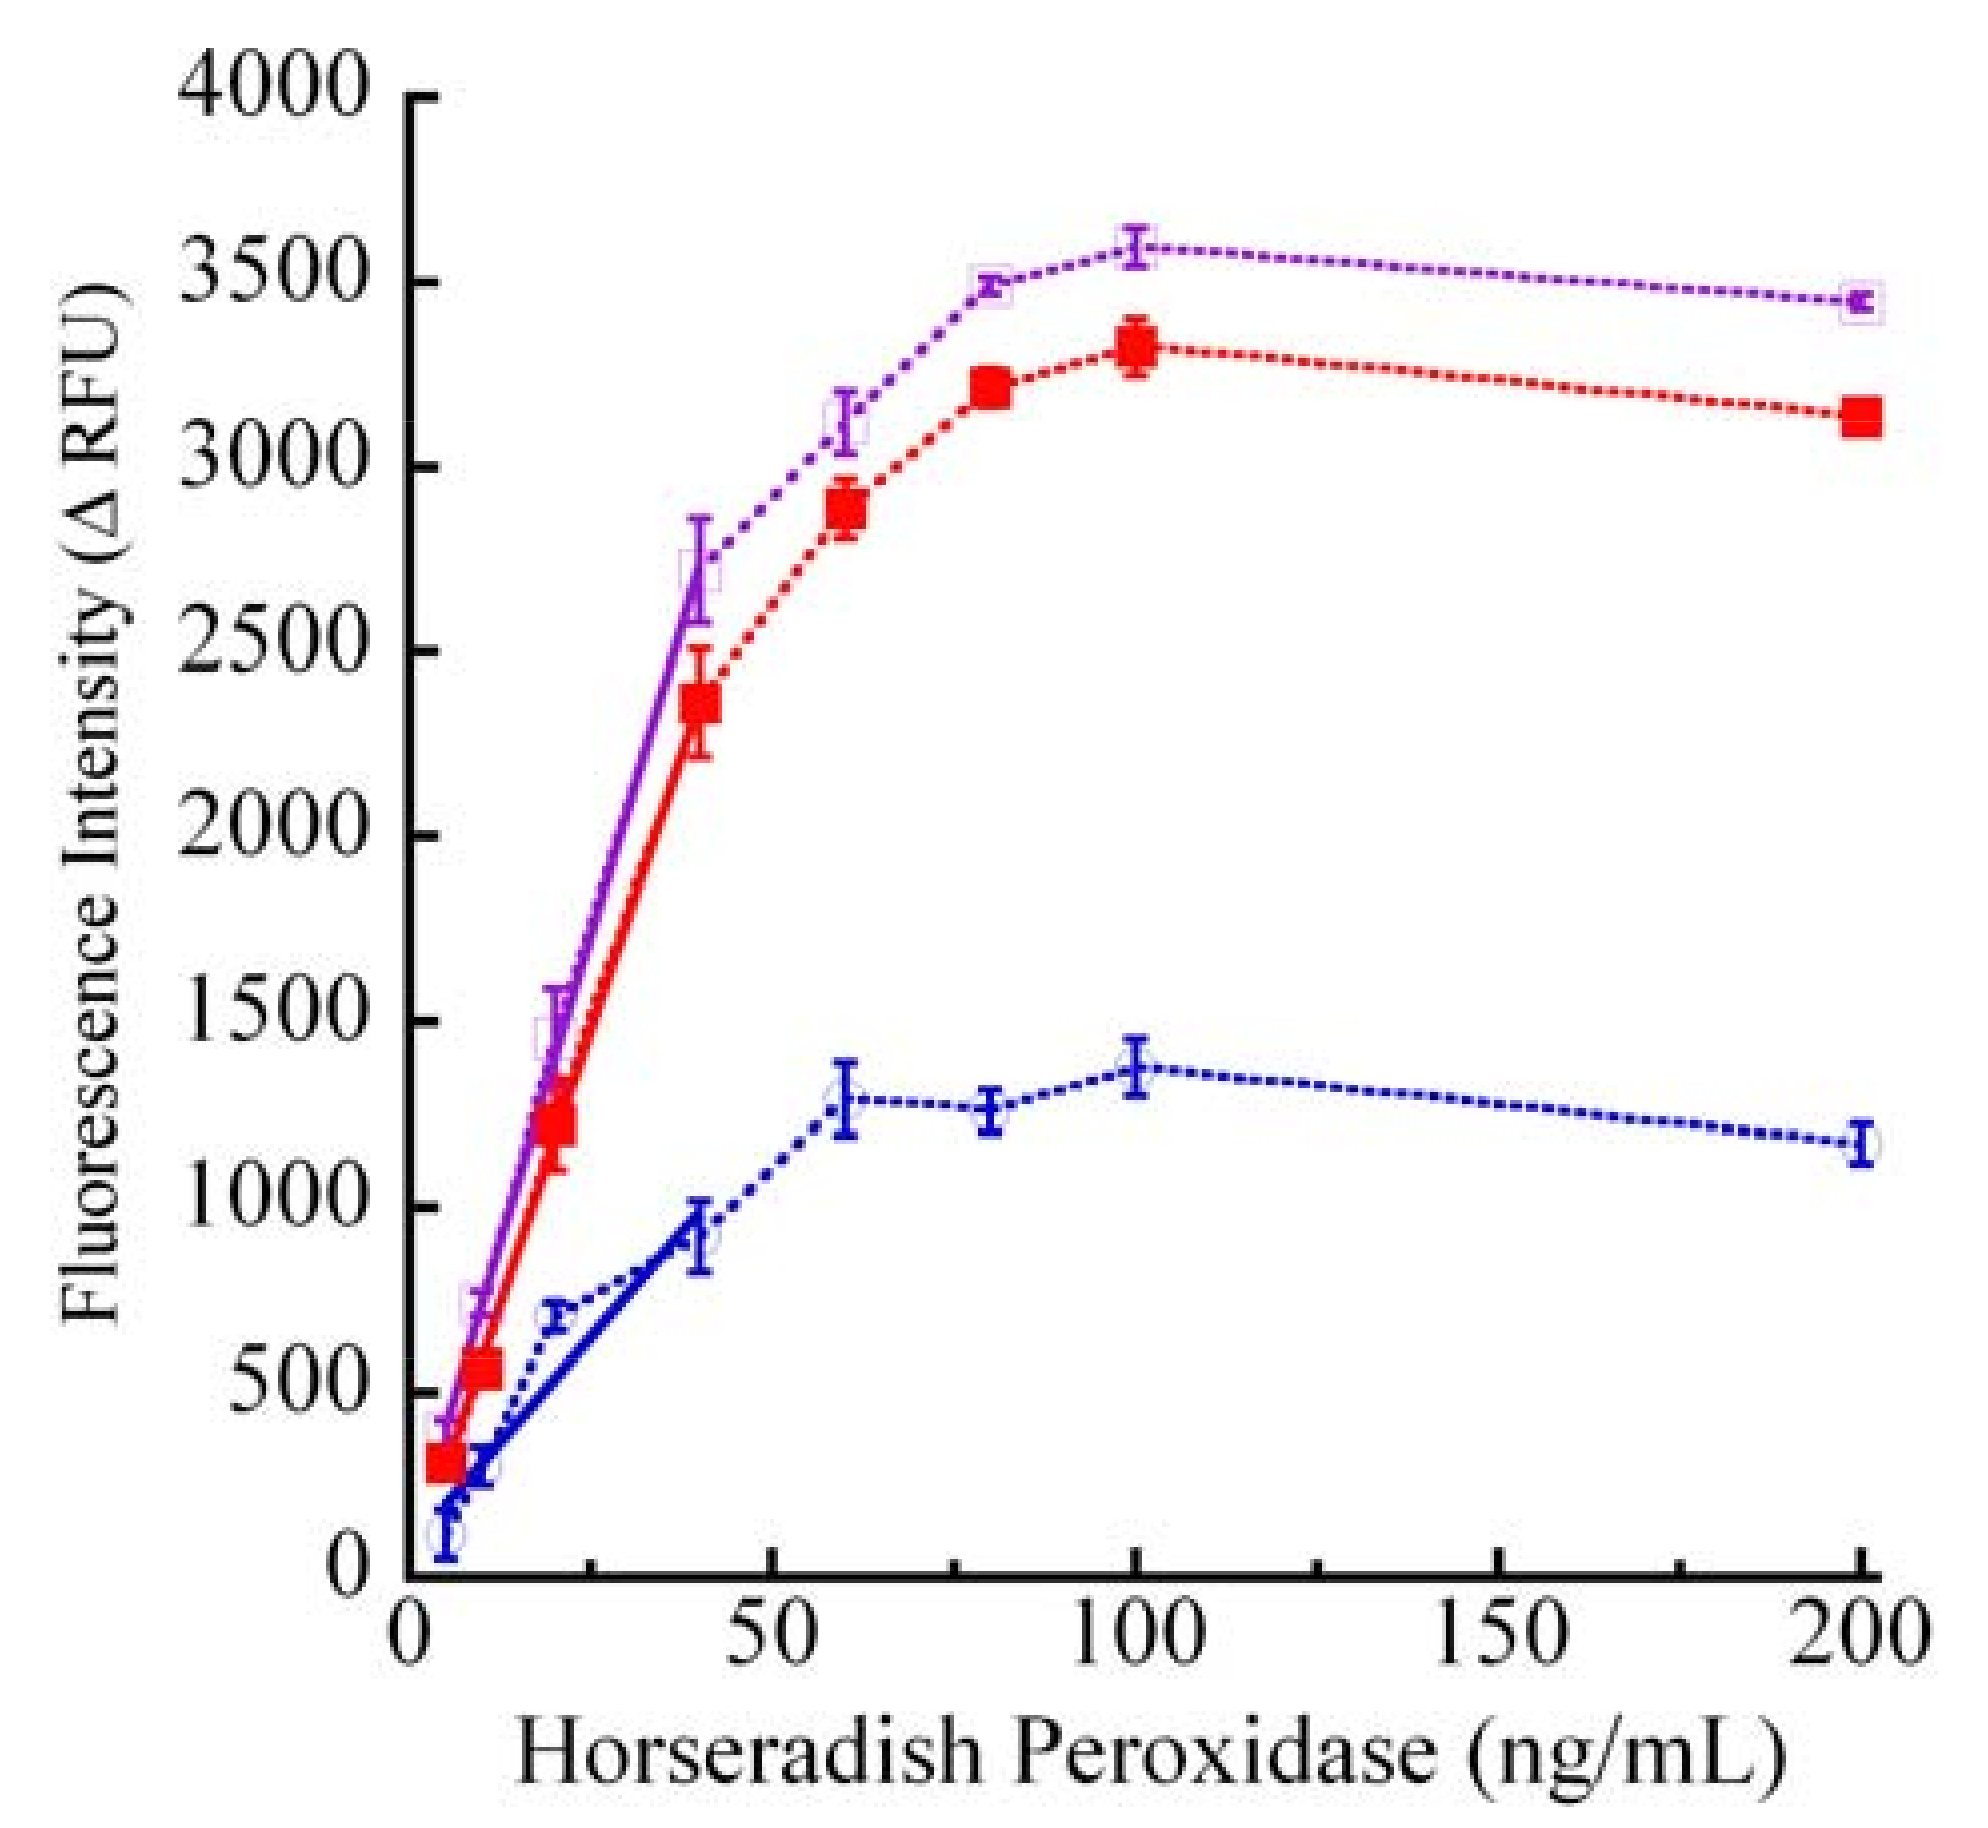
Figure 8.
Peroxidase-catalyzed CA oxidation. Increasing concentrations of horseradish peroxidase were used to oxidize 250 μM CA in the presence of 250 μM H2O2 for 30 min using 96-well UV-transparent microplate. The reaction was stopped using 100 mM NaOH and the fluorescence was measured at 416 nm following excitation using 290 (open squares, purple), 310 (closed squares, red) and 340 nm (open circles, blue) wavelengths. Dotted tracings are interpolations and solid tracings are the linear curve fit (5 to 40 ng/mL peroxidase). Linearity (r2) values were 0.999 (290 nm, solid purple), 0.999 (310 nm, solid red) and 0.903 (340 nm, solid blue).
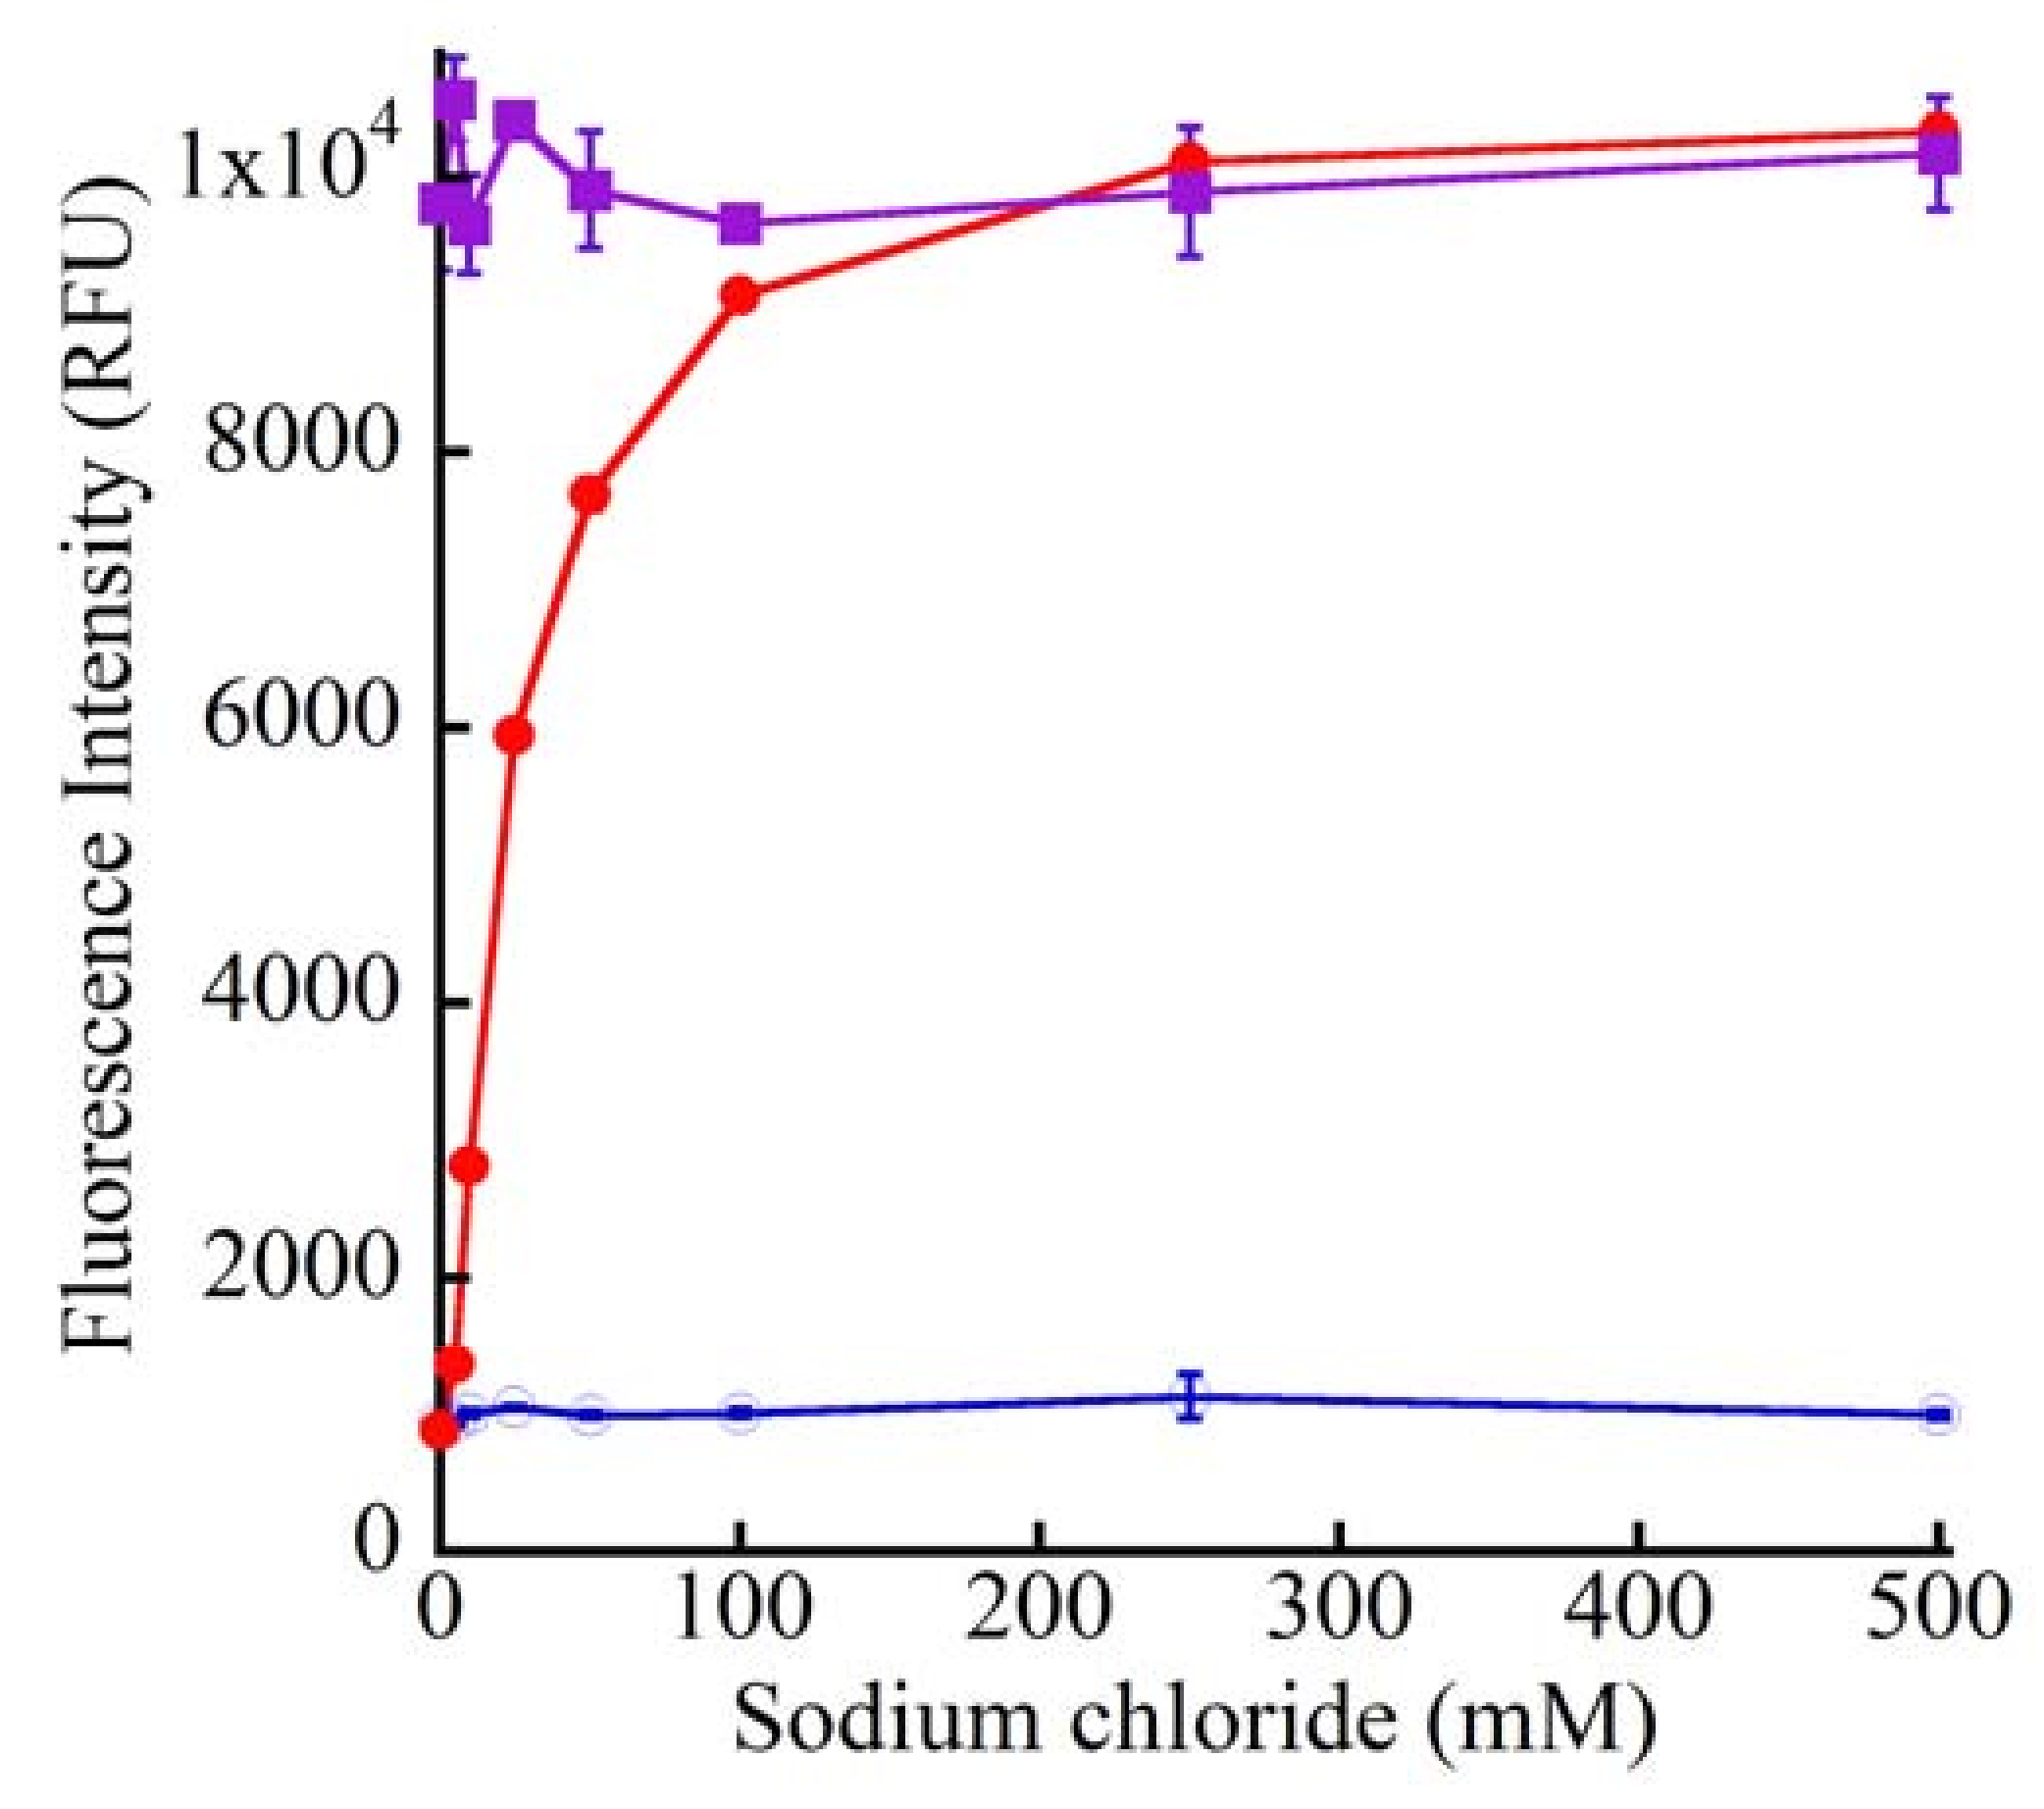
Figure 9.
Halide inhibition of laccase-catalyzed CA oxidation. Indicated concentrations of NaCl were added either during the enzymatic reactions (closed circles, red tracing) or after stopping the reactions with 250 mM KOH (open circles, blue tracing). The effect of NaCl on the fluorescence of unmodified CA is shown by the purple tracing connecting the closed squares. Nearly identical profiles were generated by exciting the samples at 290, 310 and 340 nm and measuring the emission at 416 nm. The data shown in this figure were obtained by excitation of CA at 290 nm.
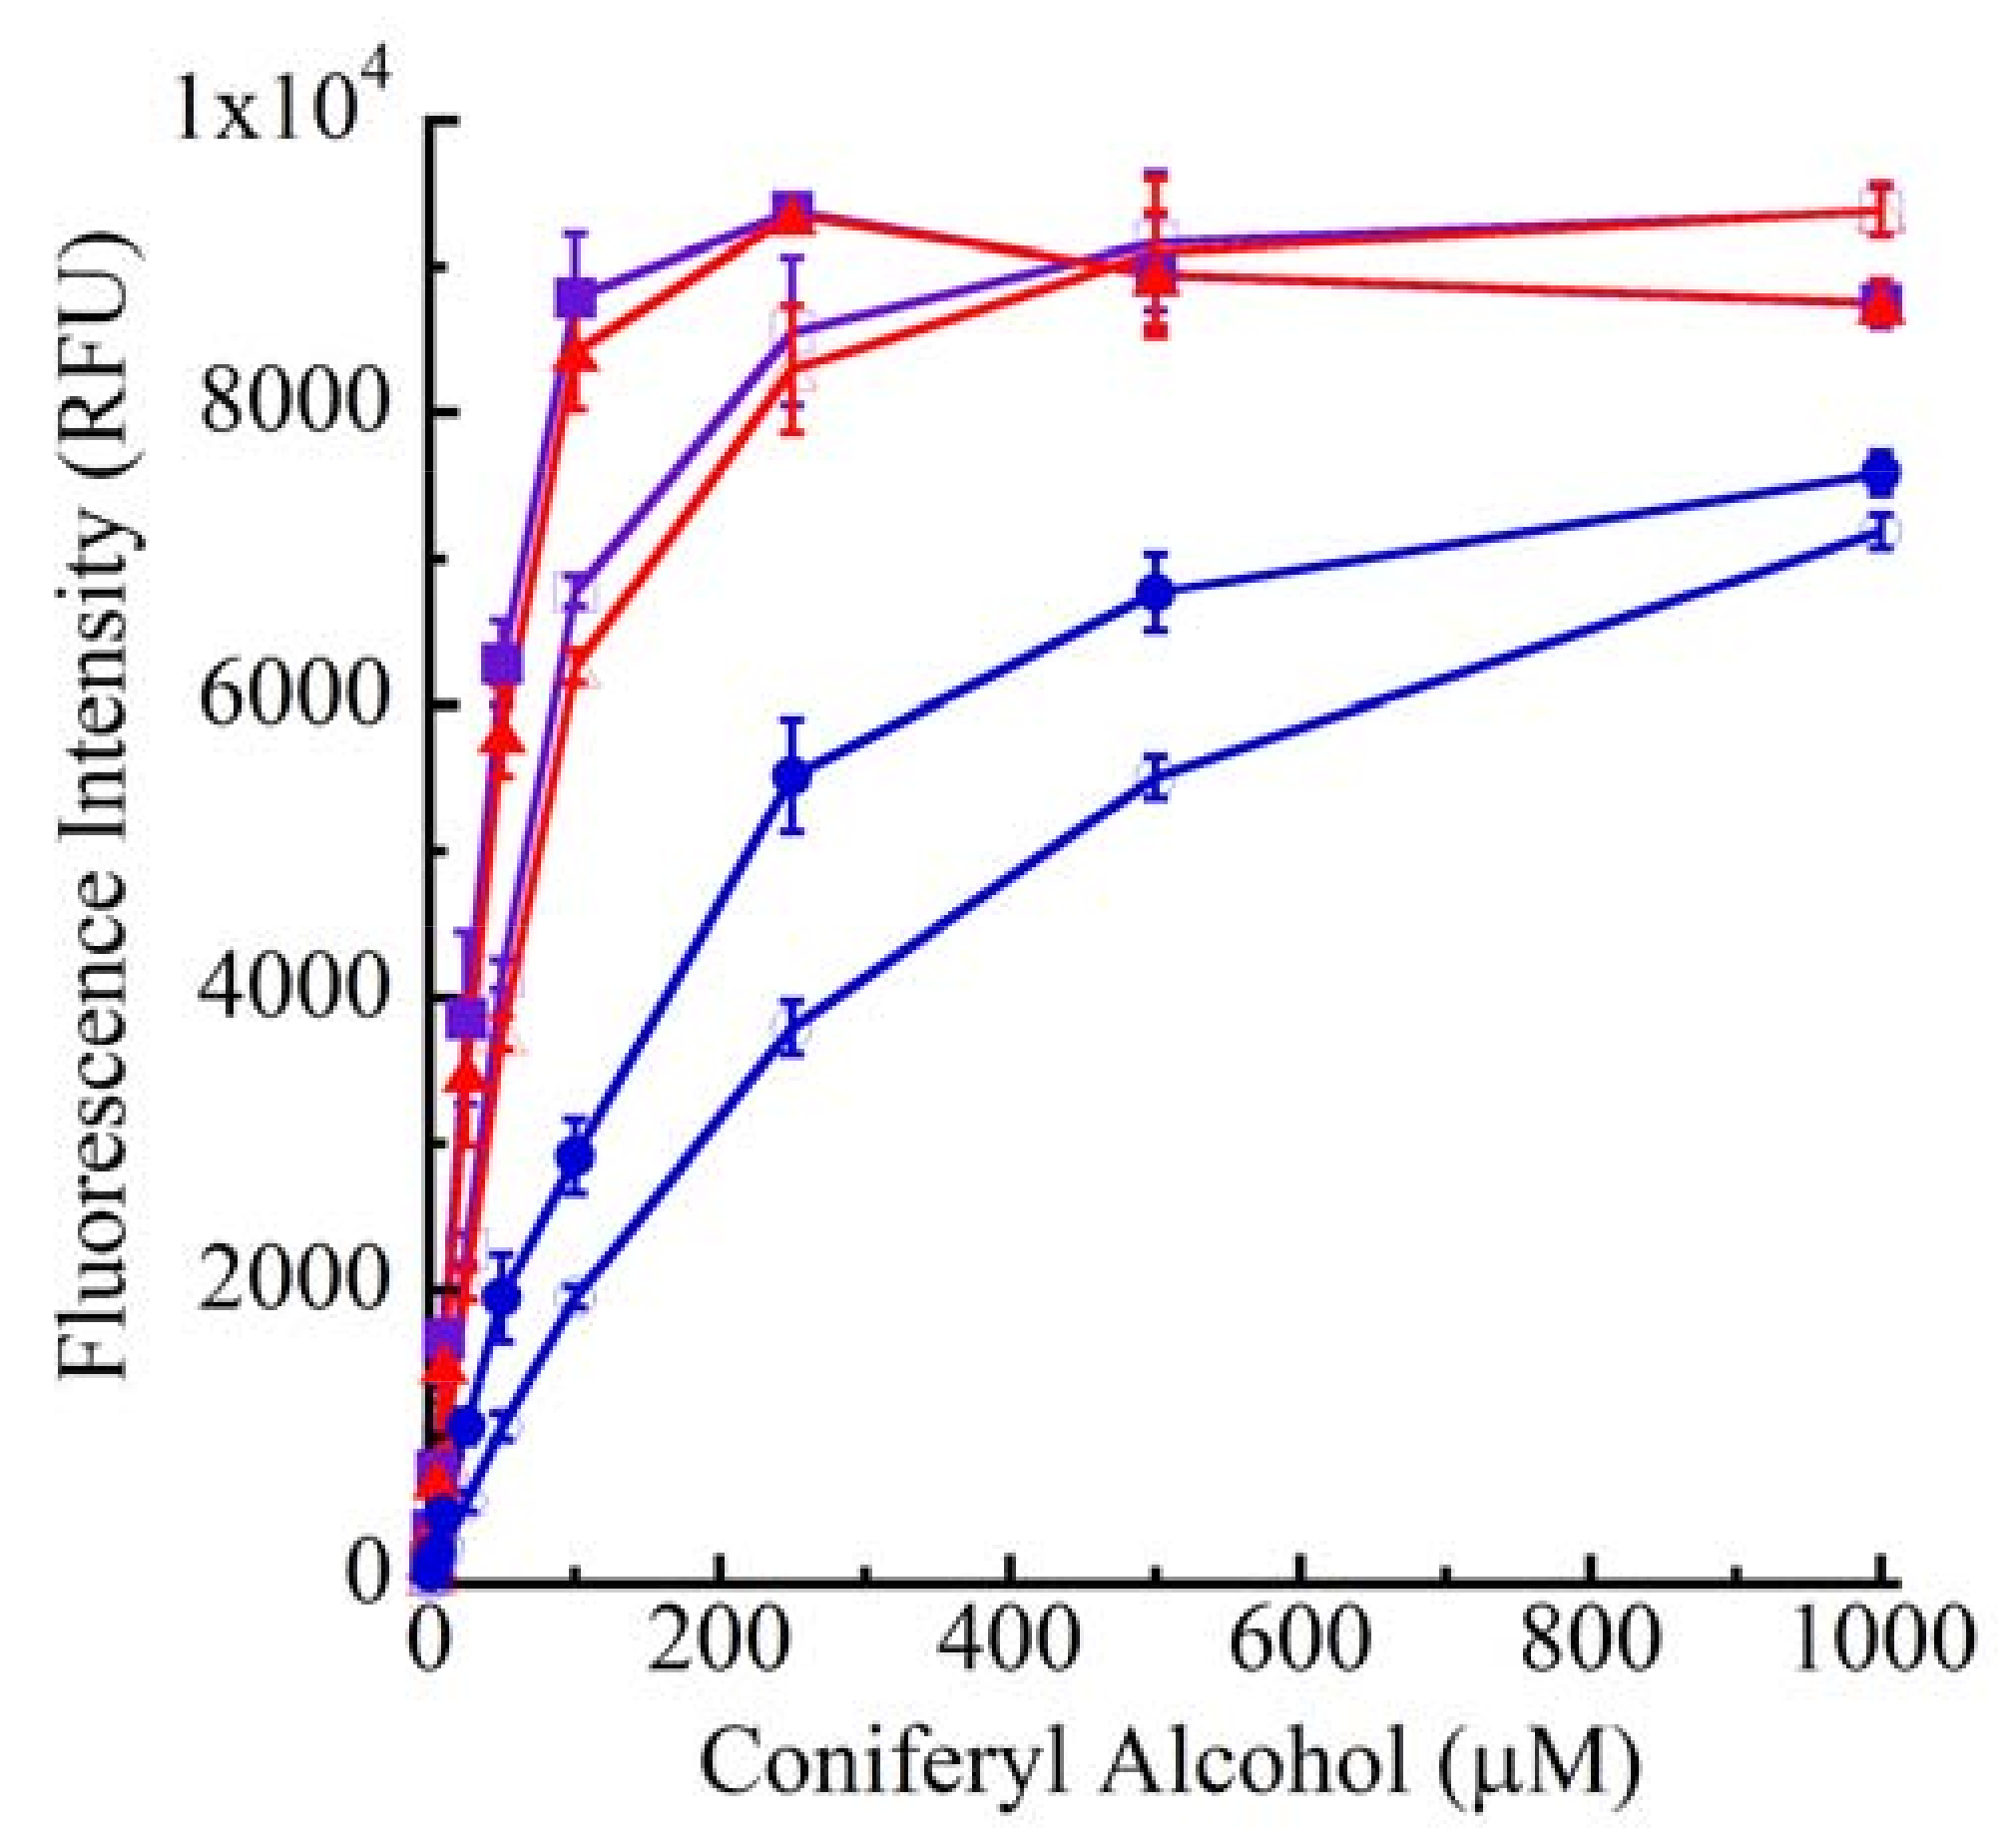
Figure 10A.
Sensitivity of CA. Increasing (1.0 to 1000 μM) concentrations of unmodified CA diluted in 100 mM NaOH were dispensed into a 384-well white plate as 25 or 50 μL solutions. Fluorescence from the samples was measured at 416 nm using the excitation wavelengths of 290 (purple tracings; open squares, 25 μL; closed squares, 50 μL), 310 (red tracings; open triangles, 25 μL; closed triangles, 50 μL) and 340 nm (blue tracings; open circles, 25 μL; closed circles, 50 μL).
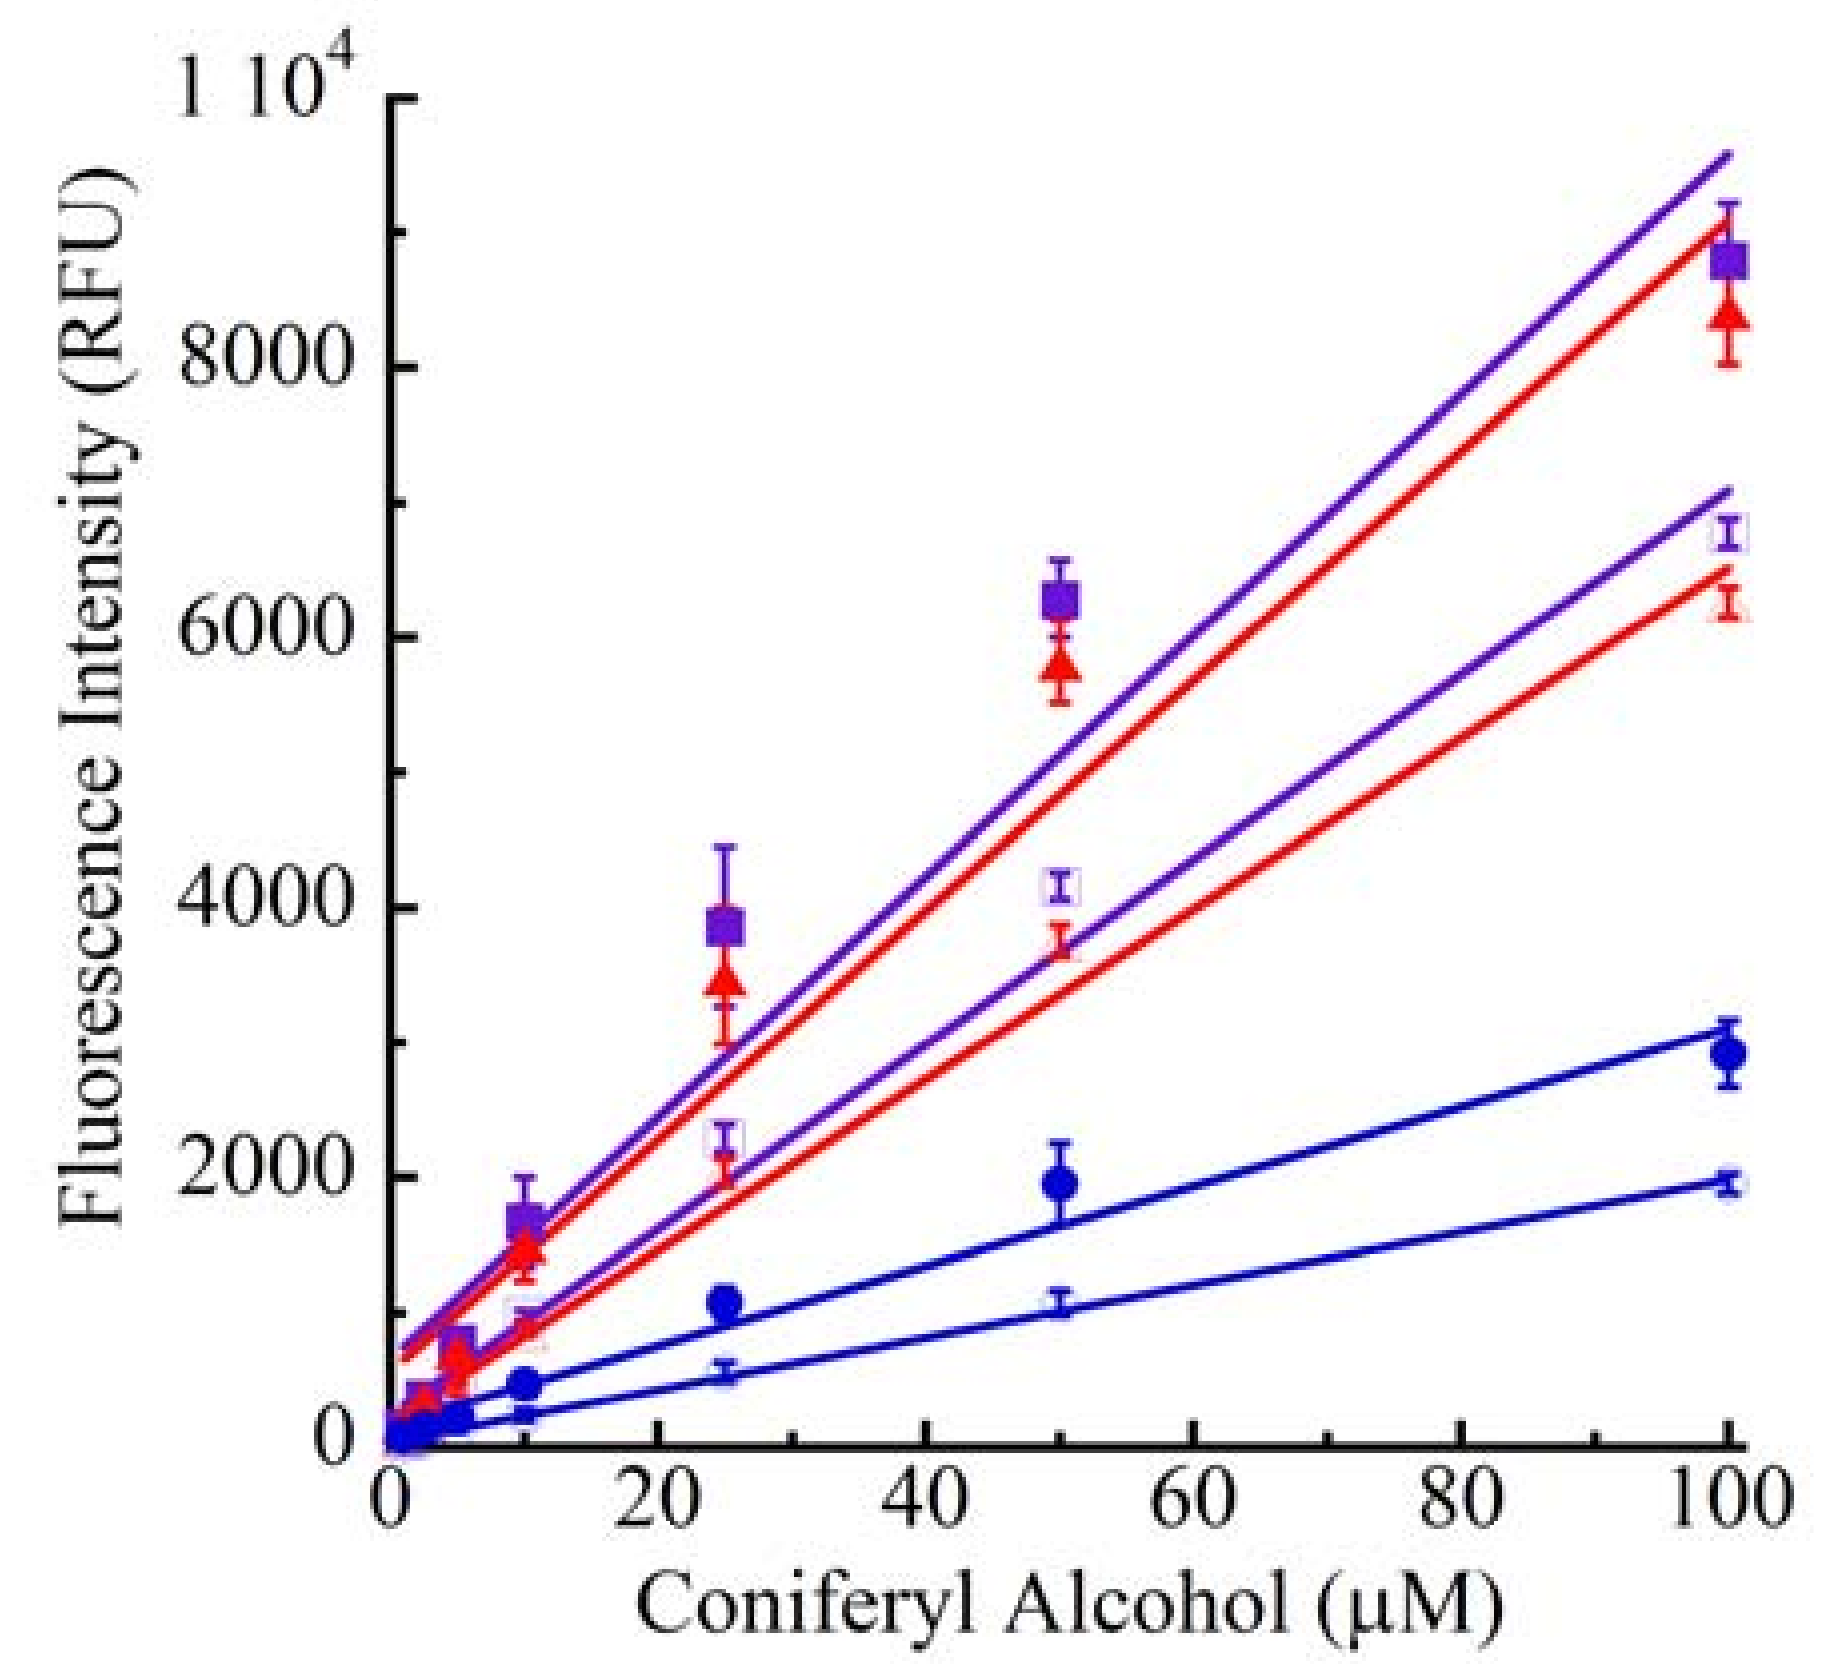
Figure 10B.
Linearity of CA Dose-Response. All conditions are described in
Figure 10A. The
r2 values were: 0.984 (λex = 290 nm, 25 μL; open squares, purple); 0.945 (λex = 290 nm, 50 μL; closed squares, purple); 0.989 (λex = 310 nm, 25 μL; open triangles, red); 0.958 (λex = 310 nm, 50 μL; closed triangles, red); 0.997 (λex = 340 nm, 25 μL; open circles, blue) and 0.973 (λex = 340 nm, 50 μL; closed circles, blue).
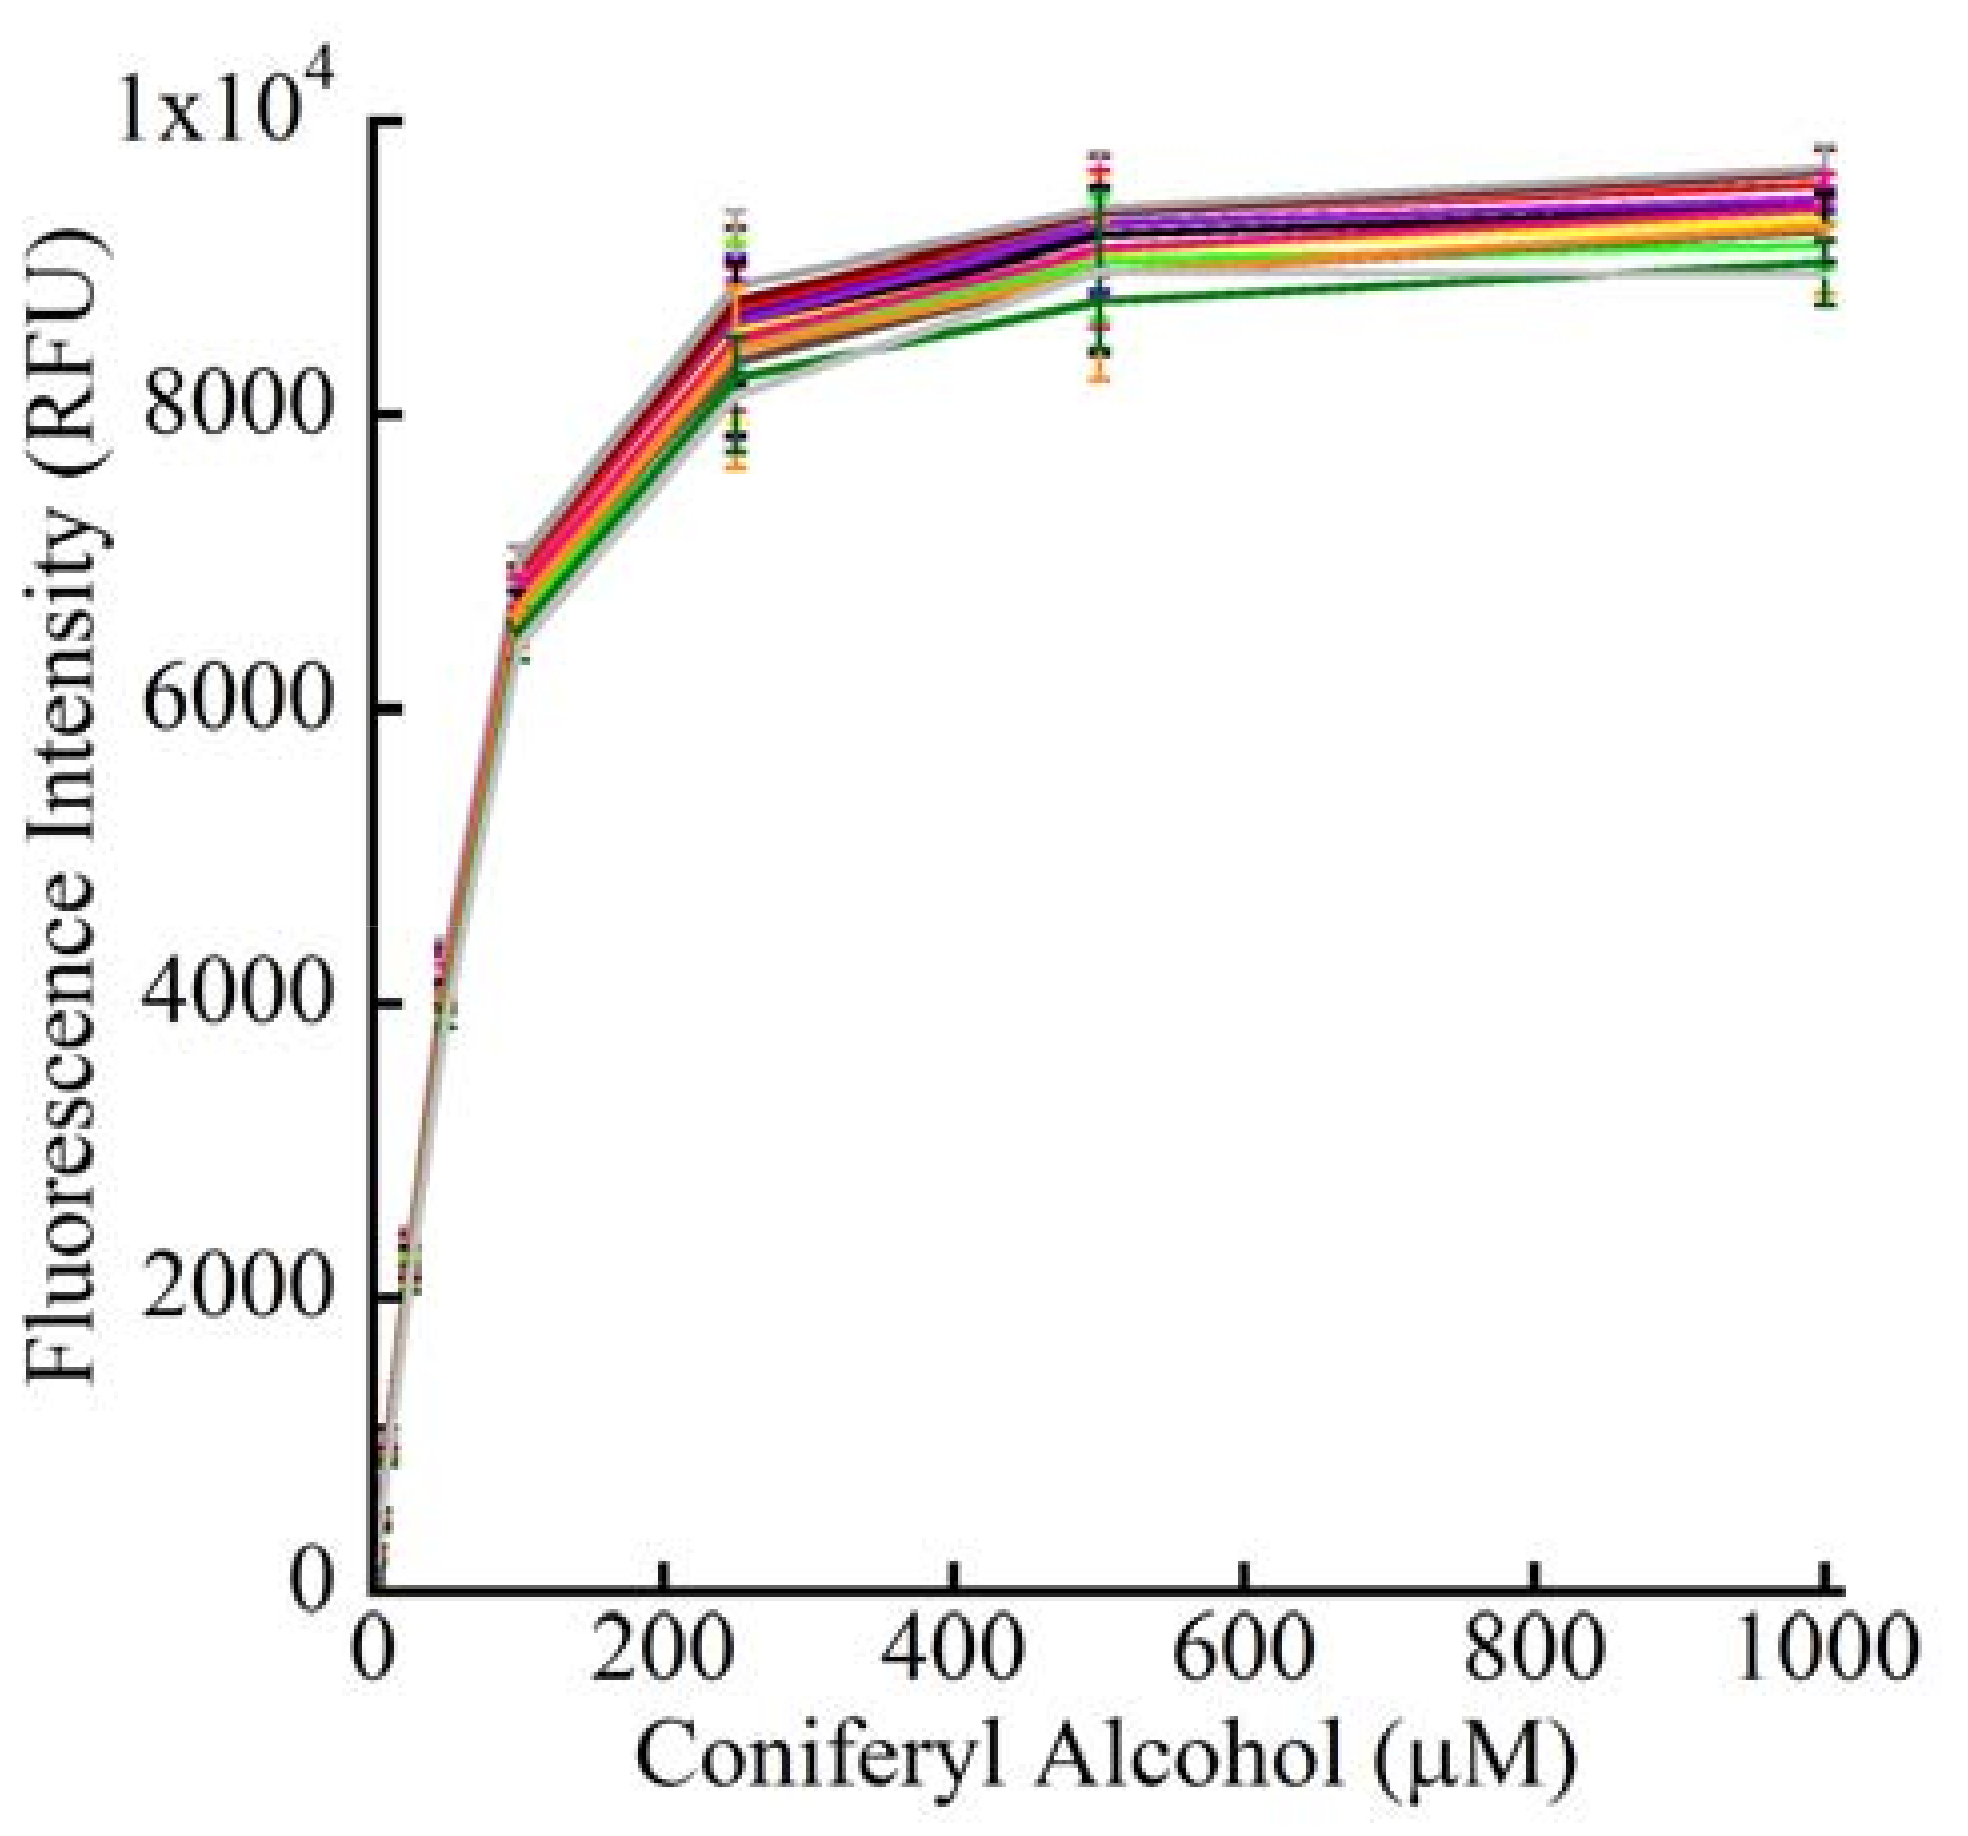
Figure 11A.
Concentration dependence of CA photostability. Increasing concentrations of CA were dispensed into 384-well microplate. The data from the 25 μL reactions (λex, 310 nm; λem = 416 nm) are shown. The tracings represent measurements taken at the following intervals (min): 5 (black), 10 (blue), 20 (red), 30 (purple), 45 (bright green), 60 (yellow), 120 (aqua), 180 (maroon), 240 (dark grey), 300 (magenta), 360 (brown), 420 (orange), 480 (dark green) and 1440 (light grey).
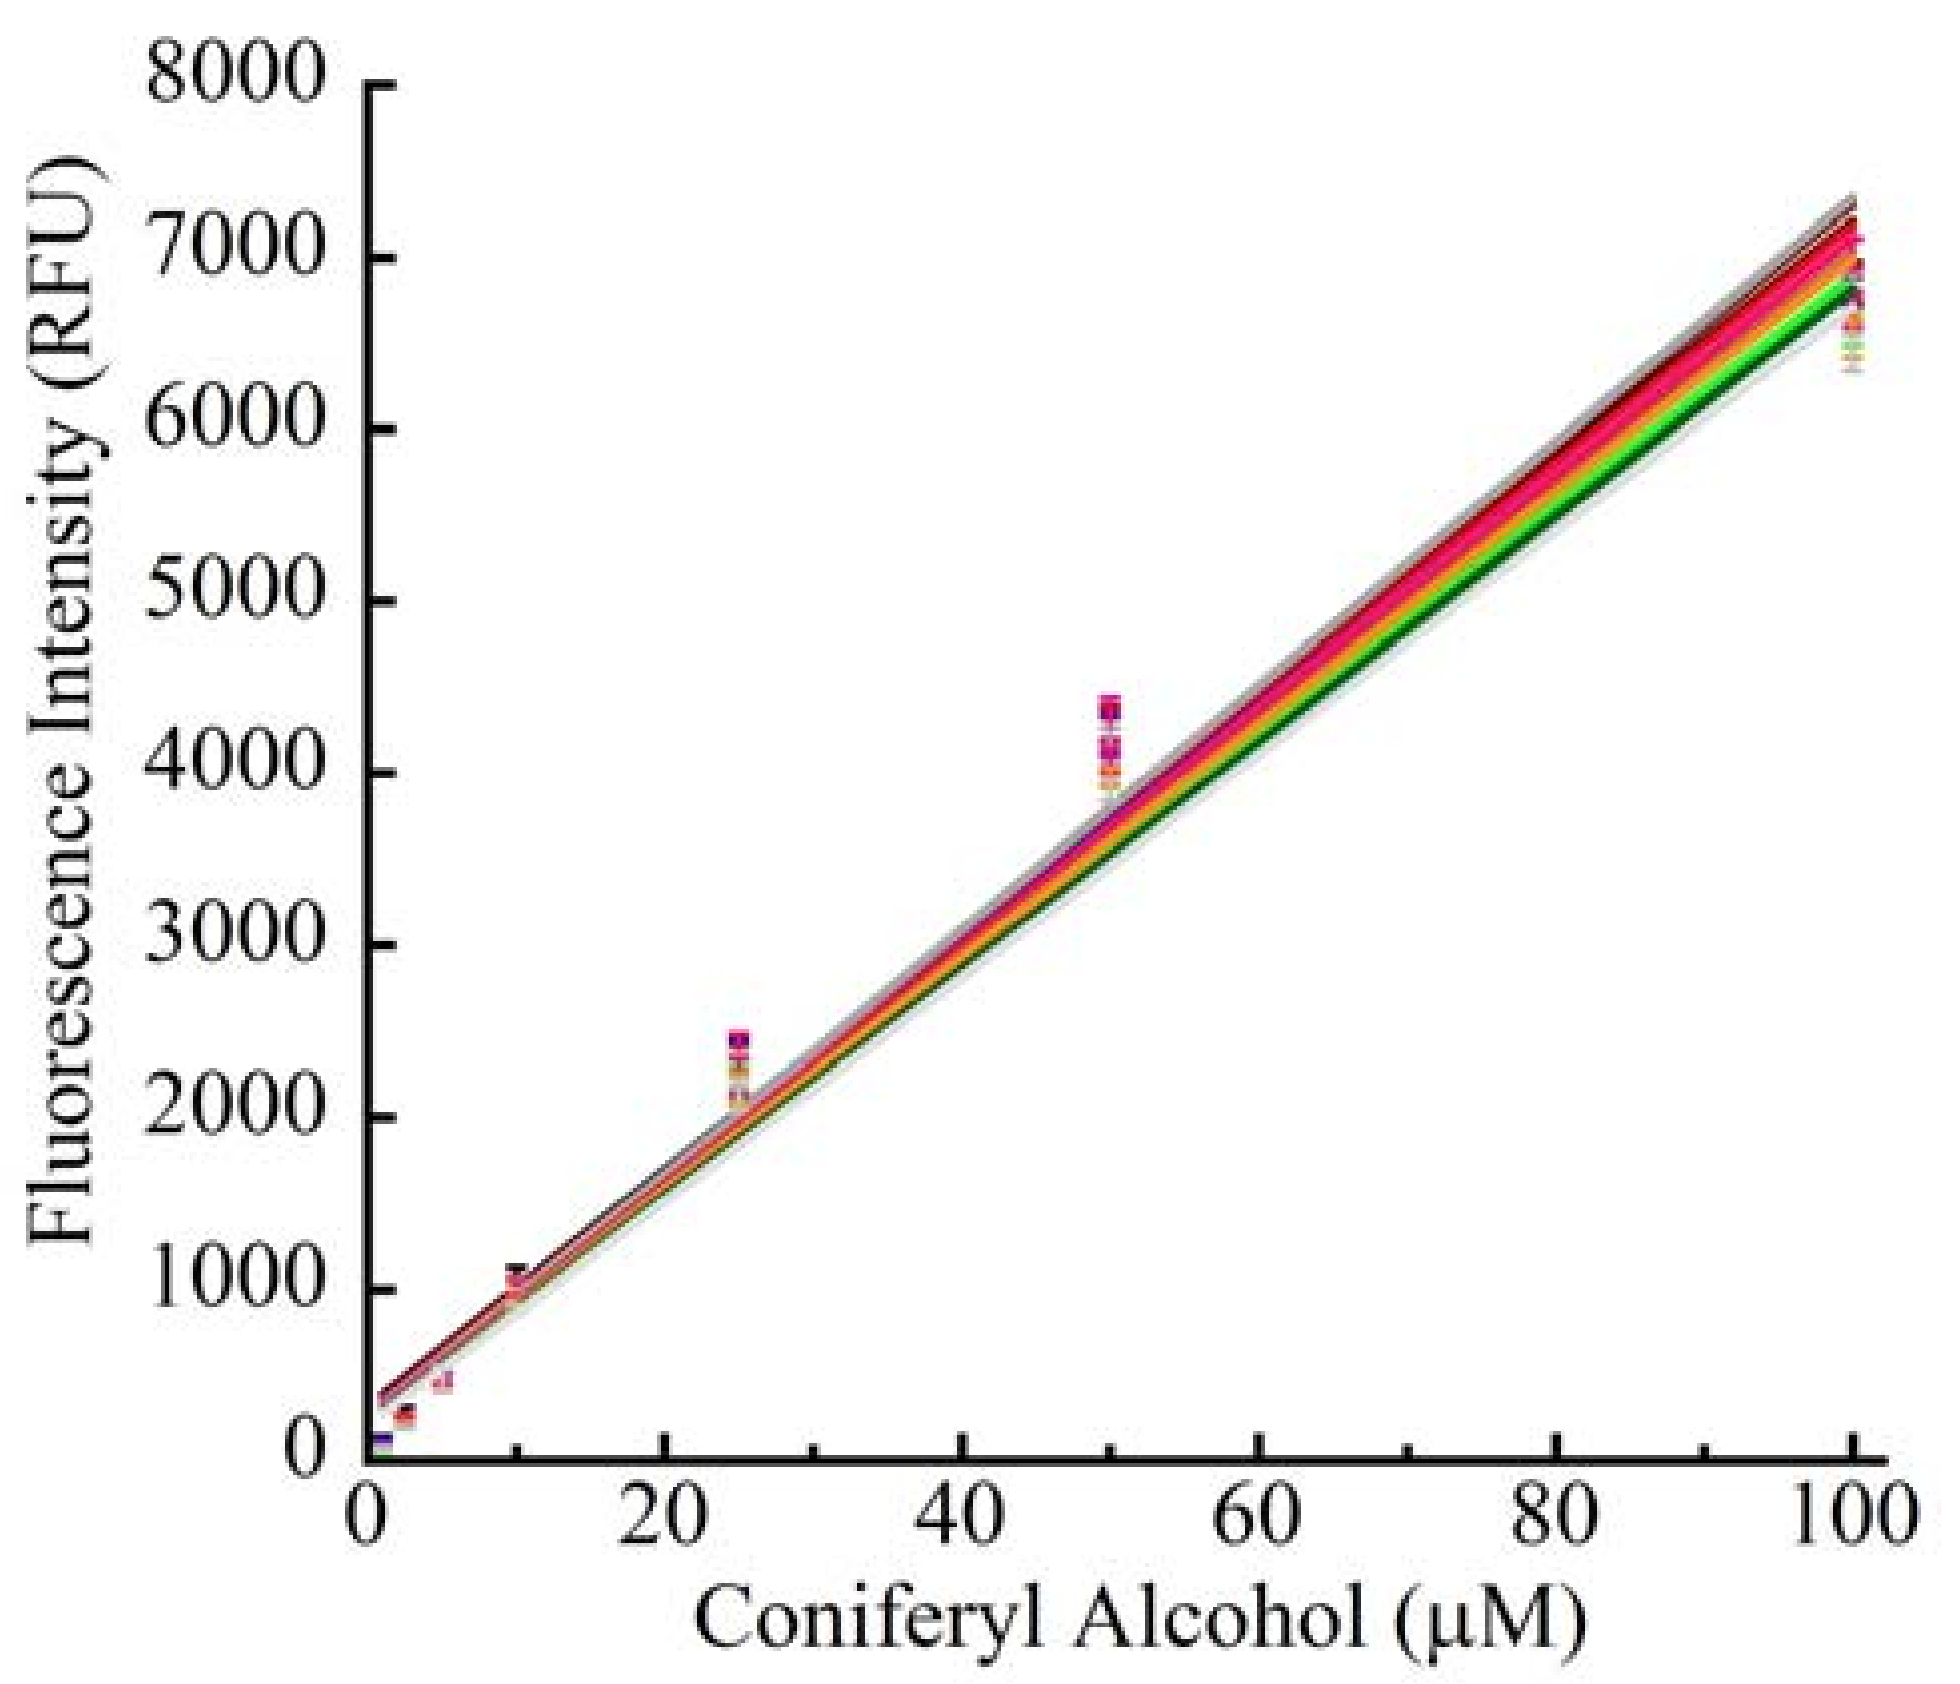
Figure 11B.
Linearity of CA photostability. This figure shows the negligible effects on linearity between 1.0 to 100 μM CA over the various interrogation times. The correlation of coefficient,
r2 was 0.985 ± 0.001 for
n = 14; an error of <0.2% from CA samples subjected to 42 cycles of excitation/emission over a 24 h period. All other conditions and the colored tracings representing measurements between 5 and 1440 min are the same as those described for
Figure 11A.
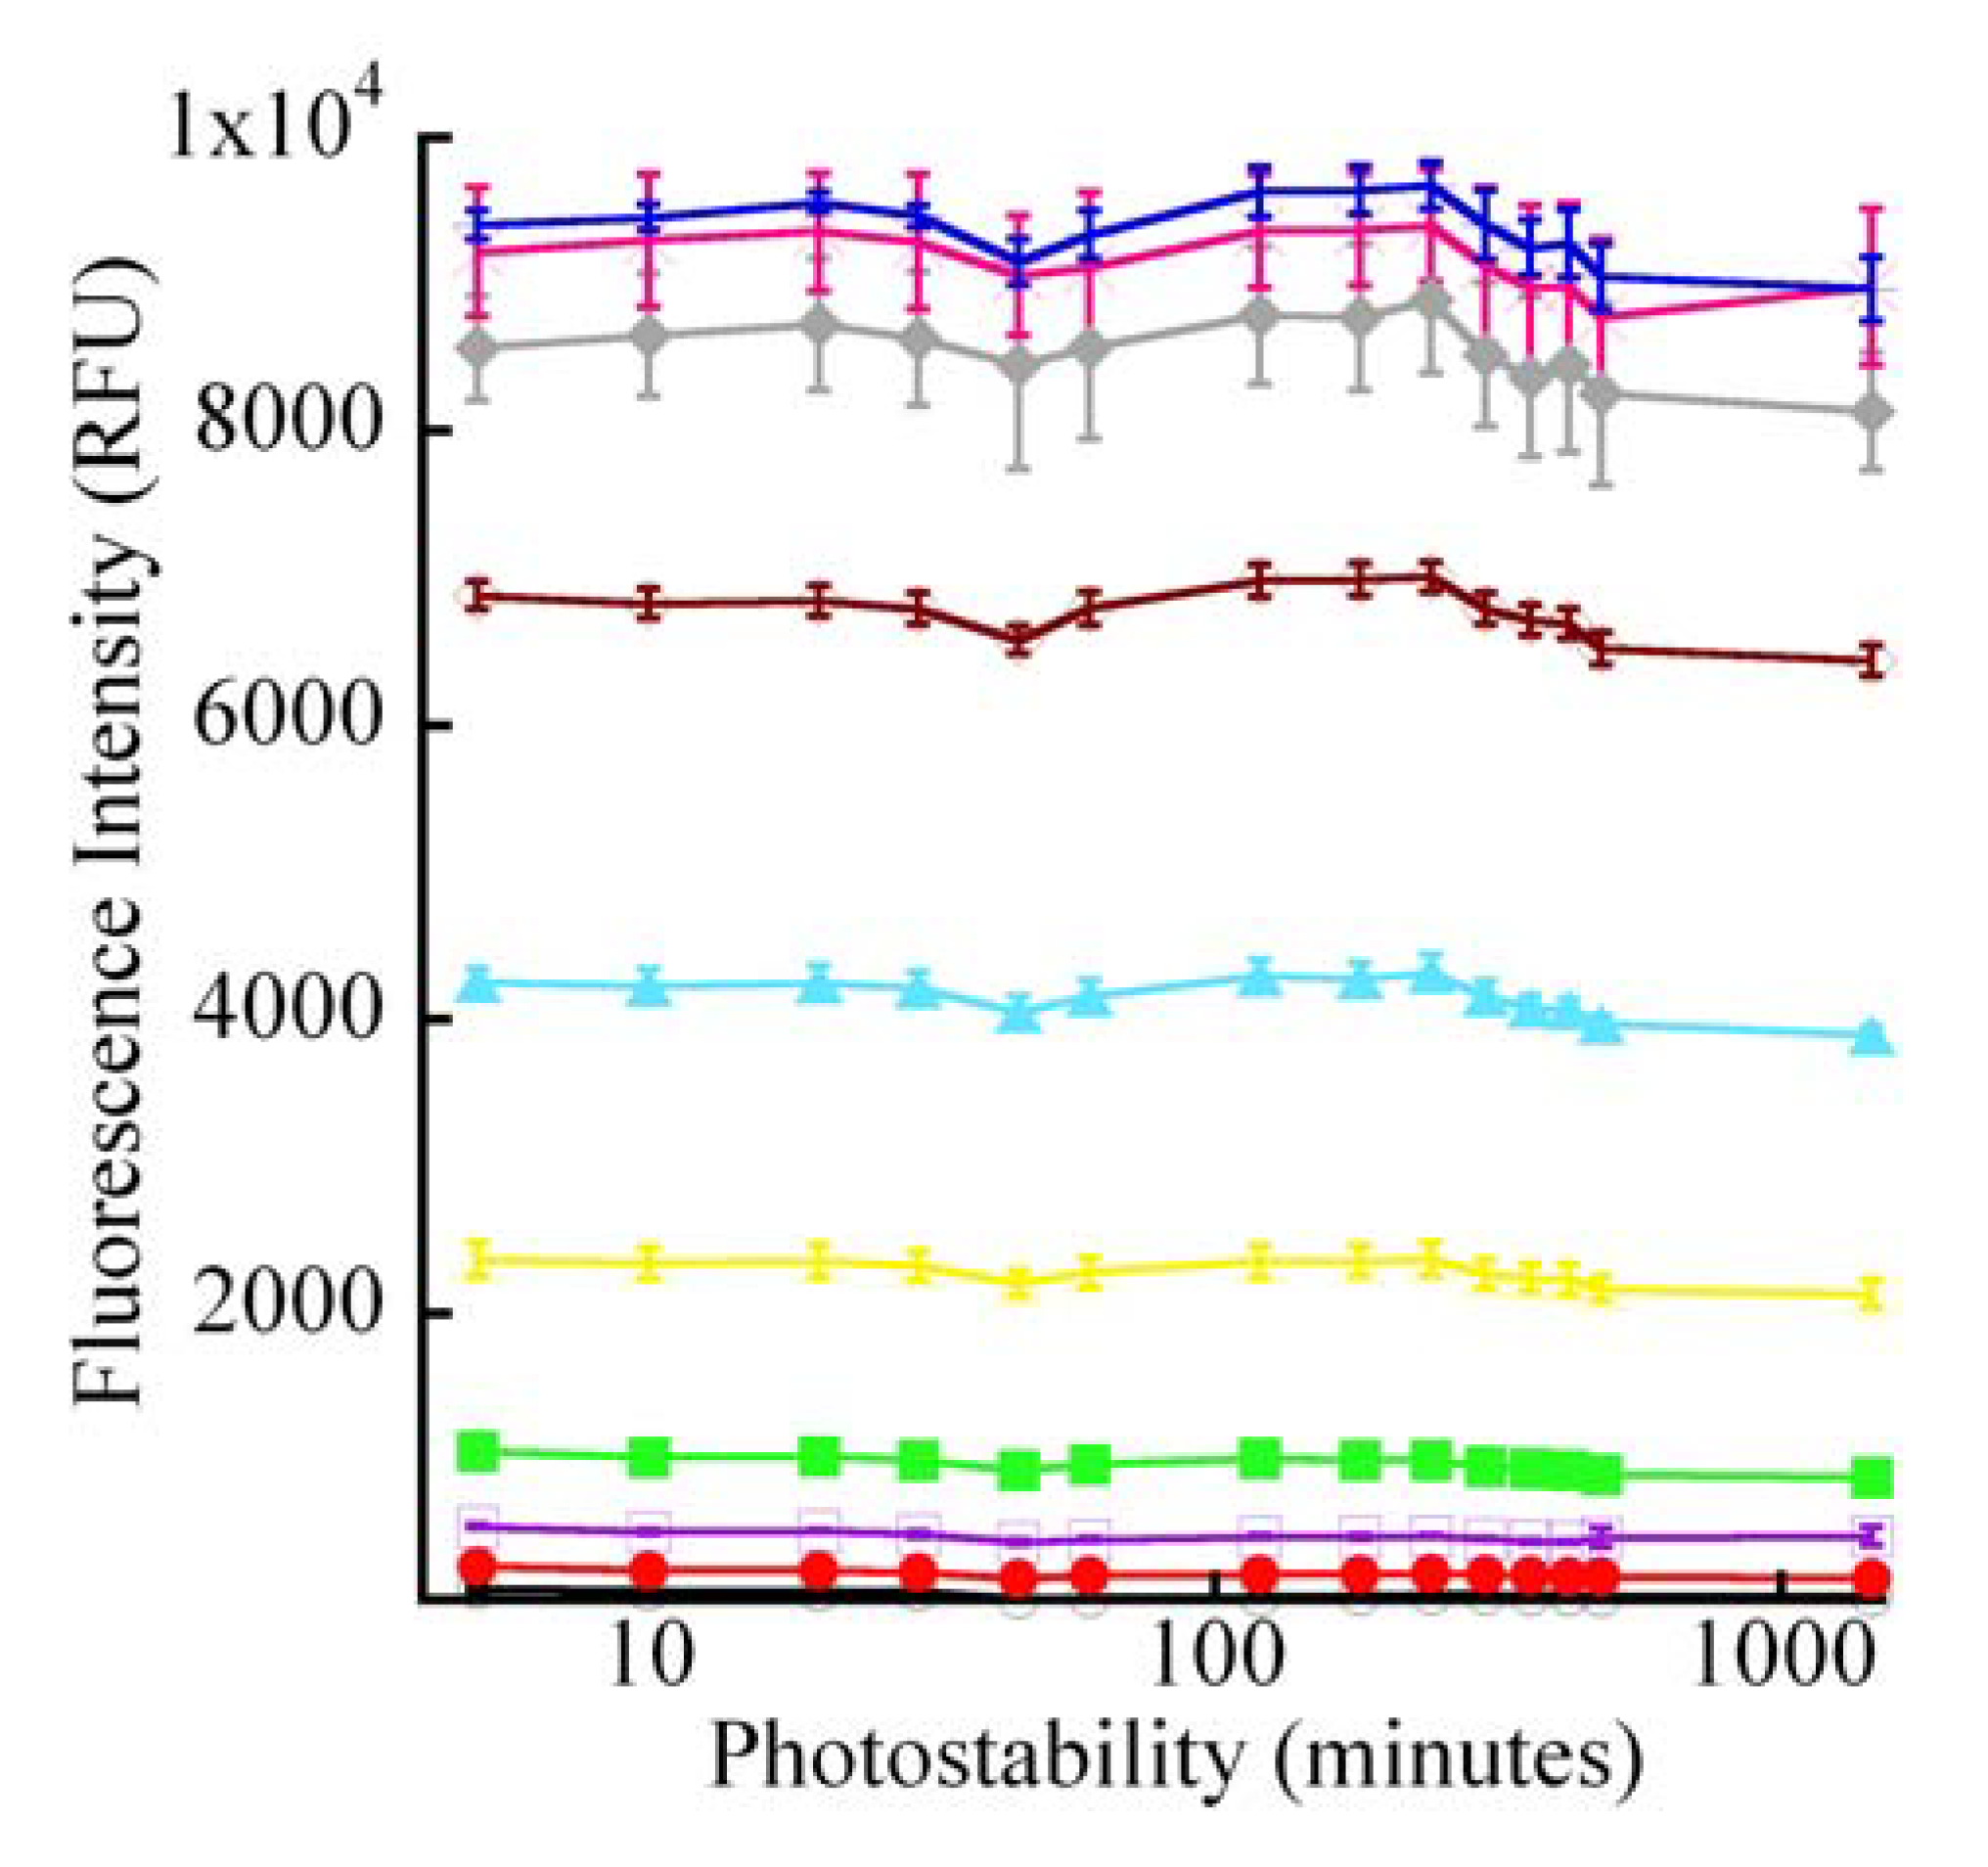
Figure 12.
Time dependence of CA photostability. This figure shows the photostability of CA over time. All other reaction conditions were as described for
Figure 11A and
Figure 11B. The concentrations (μM) of CA are as follows: 1.0 (open circles, black), 2.5 (closed circles, red), 5 (open squares, purple), 10 (closed squares, green), 25 (open triangles, yellow), 50 (closed triangles, aqua), 100 (open diamonds, maroon), 250 (closed diamonds, grey), 500 (crosses, magenta) and 1000 (plusses, blue).
Table 1.
Limits of detection (LOD) and quantitation (LOQ) of CA.*
Table 1.
Limits of detection (LOD) and quantitation (LOQ) of CA.*
| Excitation wavelength (λ) | LOD (μM) | LOD (ppb) | LOQ (μM) | LOQ (ppm) | Linearity (r2) |
|---|
| 290 nm | 1.5 | 263 | 6.5 | 1.2 | 0.989 |
| 310 nm | 1.5 | 259 | 7.7 | 1.4 | 0.970 |
| 340 nm | 2.5 | 435 | 6.7 | 1.2 | 0.910 |


