Modeling the LPS Neutralization Activity of Anti-Endotoxins

Abstract
:
Introduction
Results and Discussion
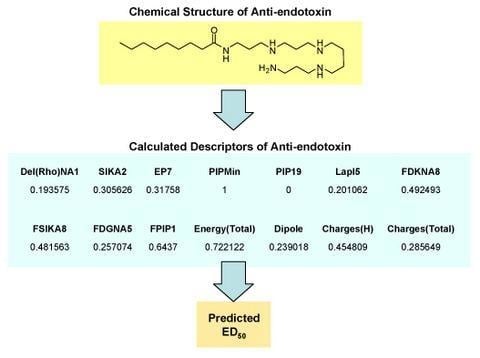
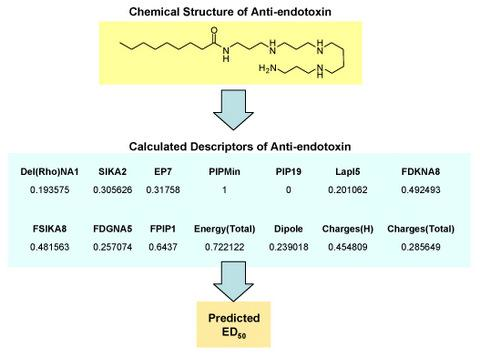
Structural considerations
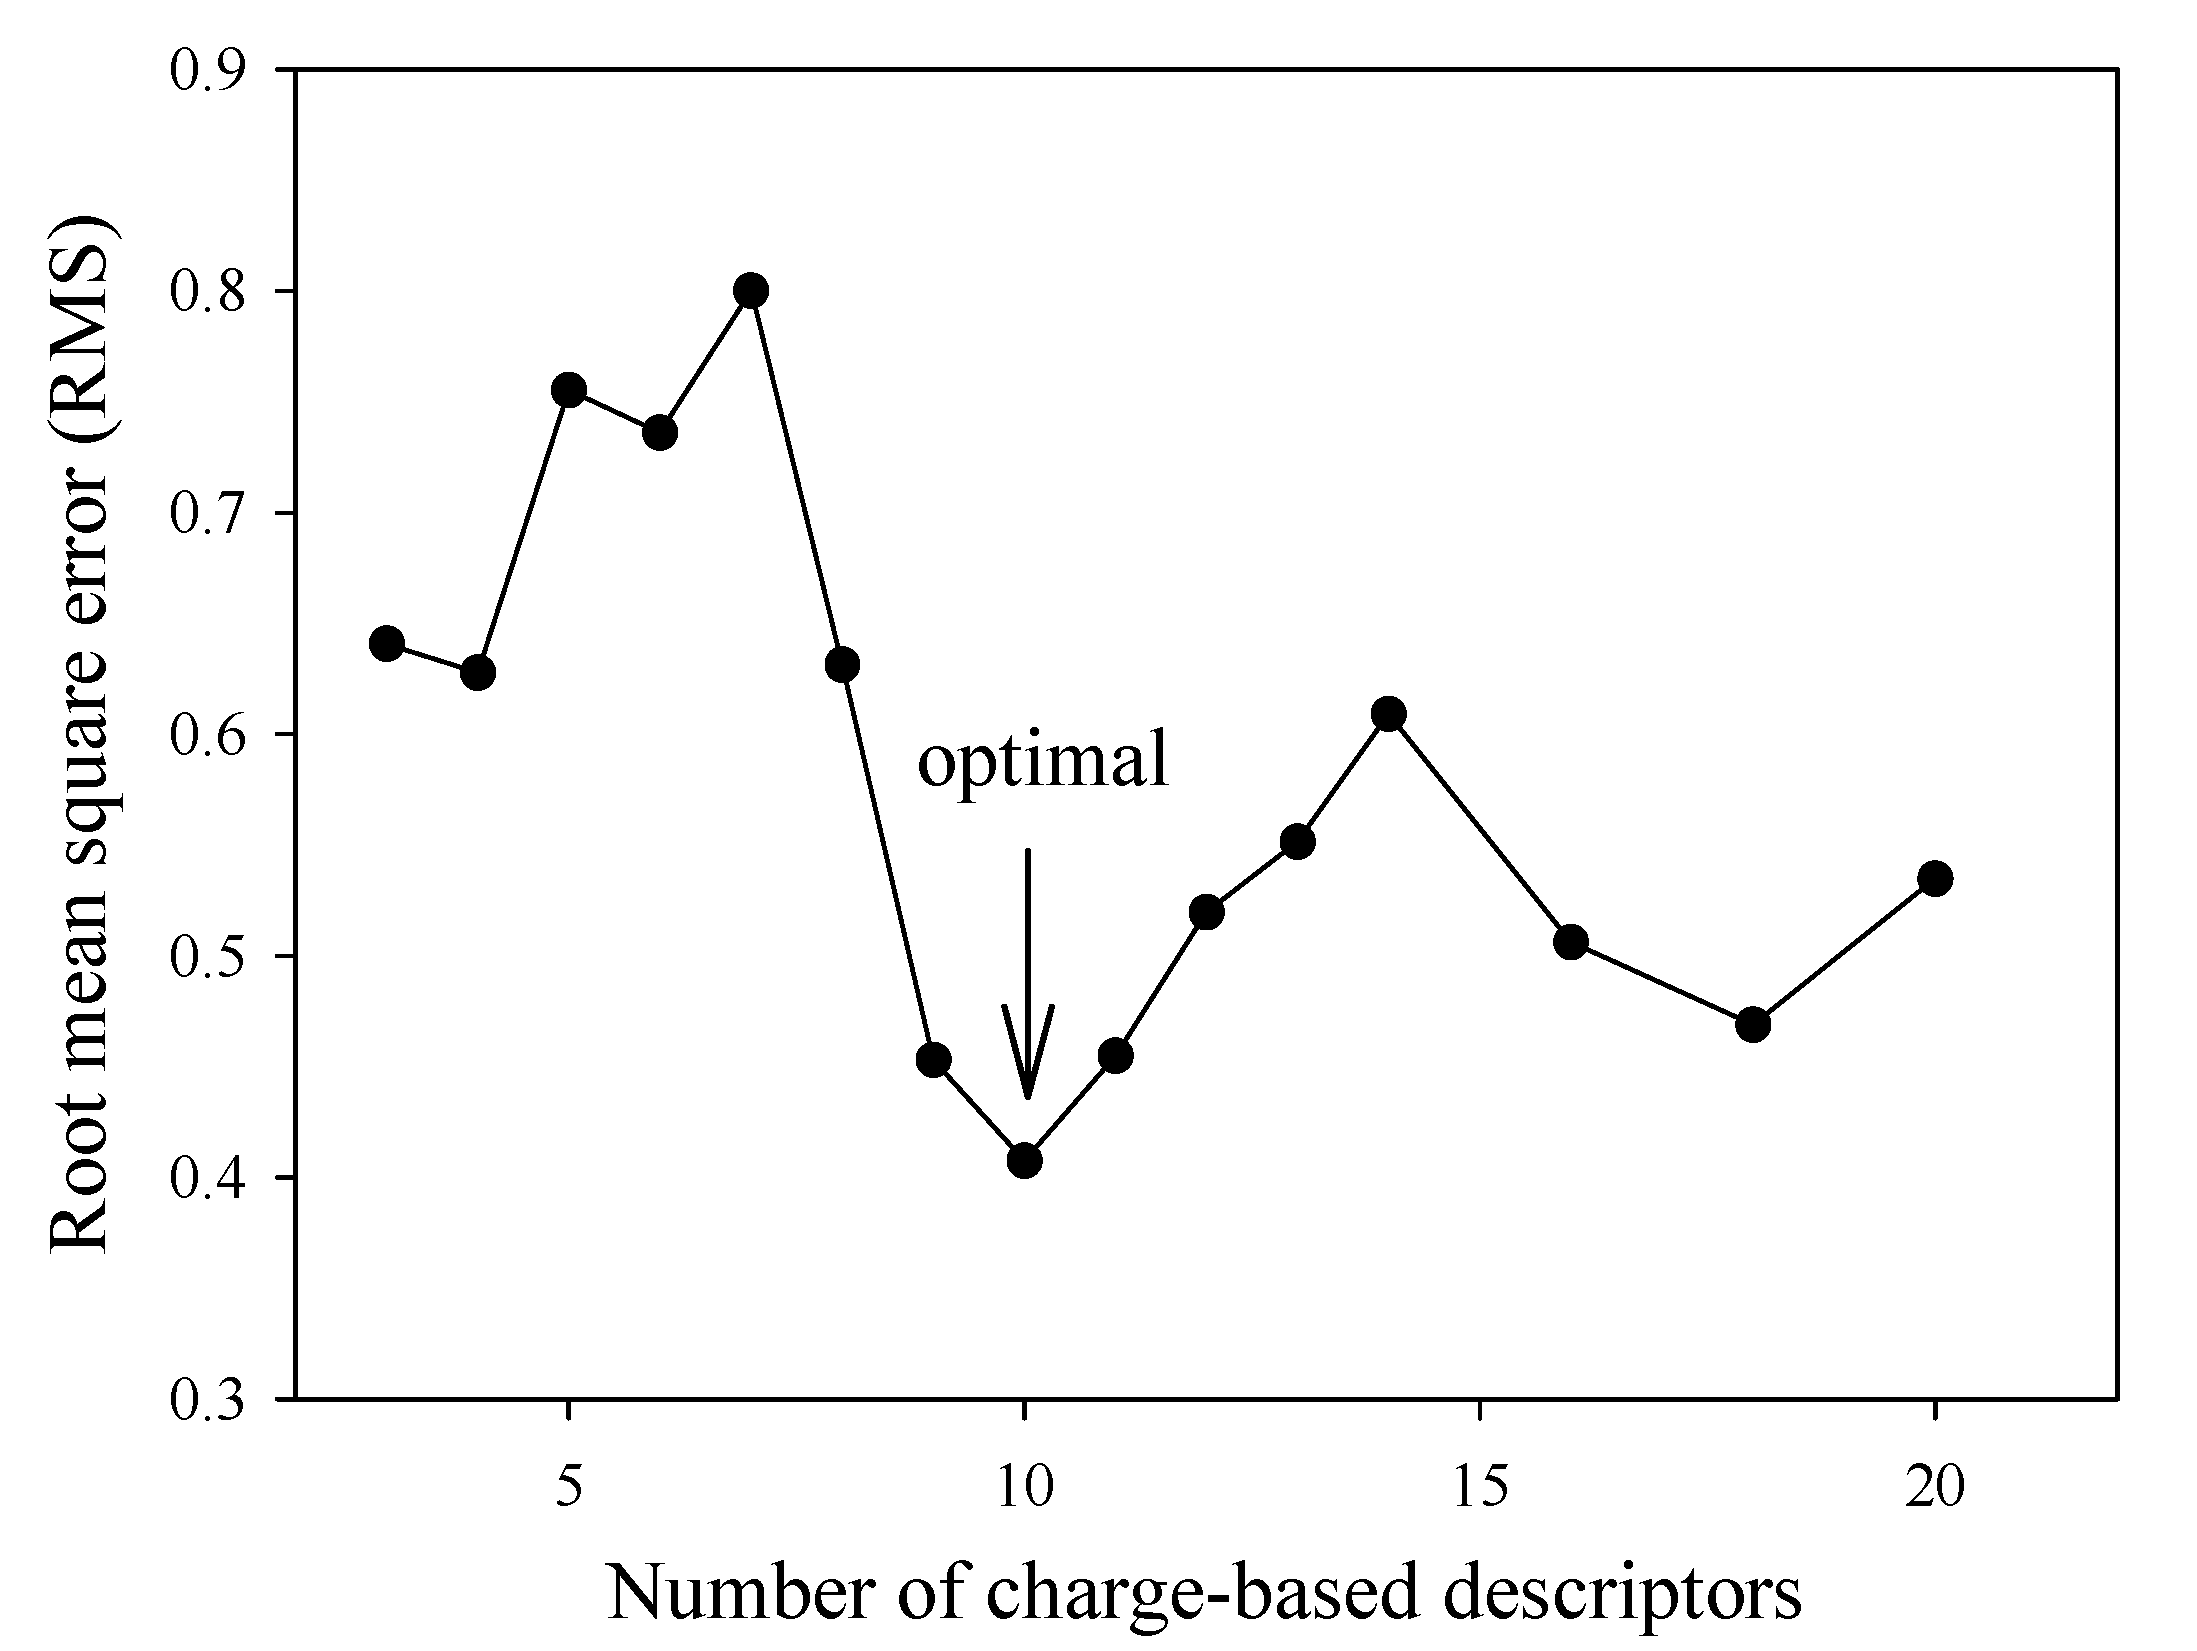
Variable reduction
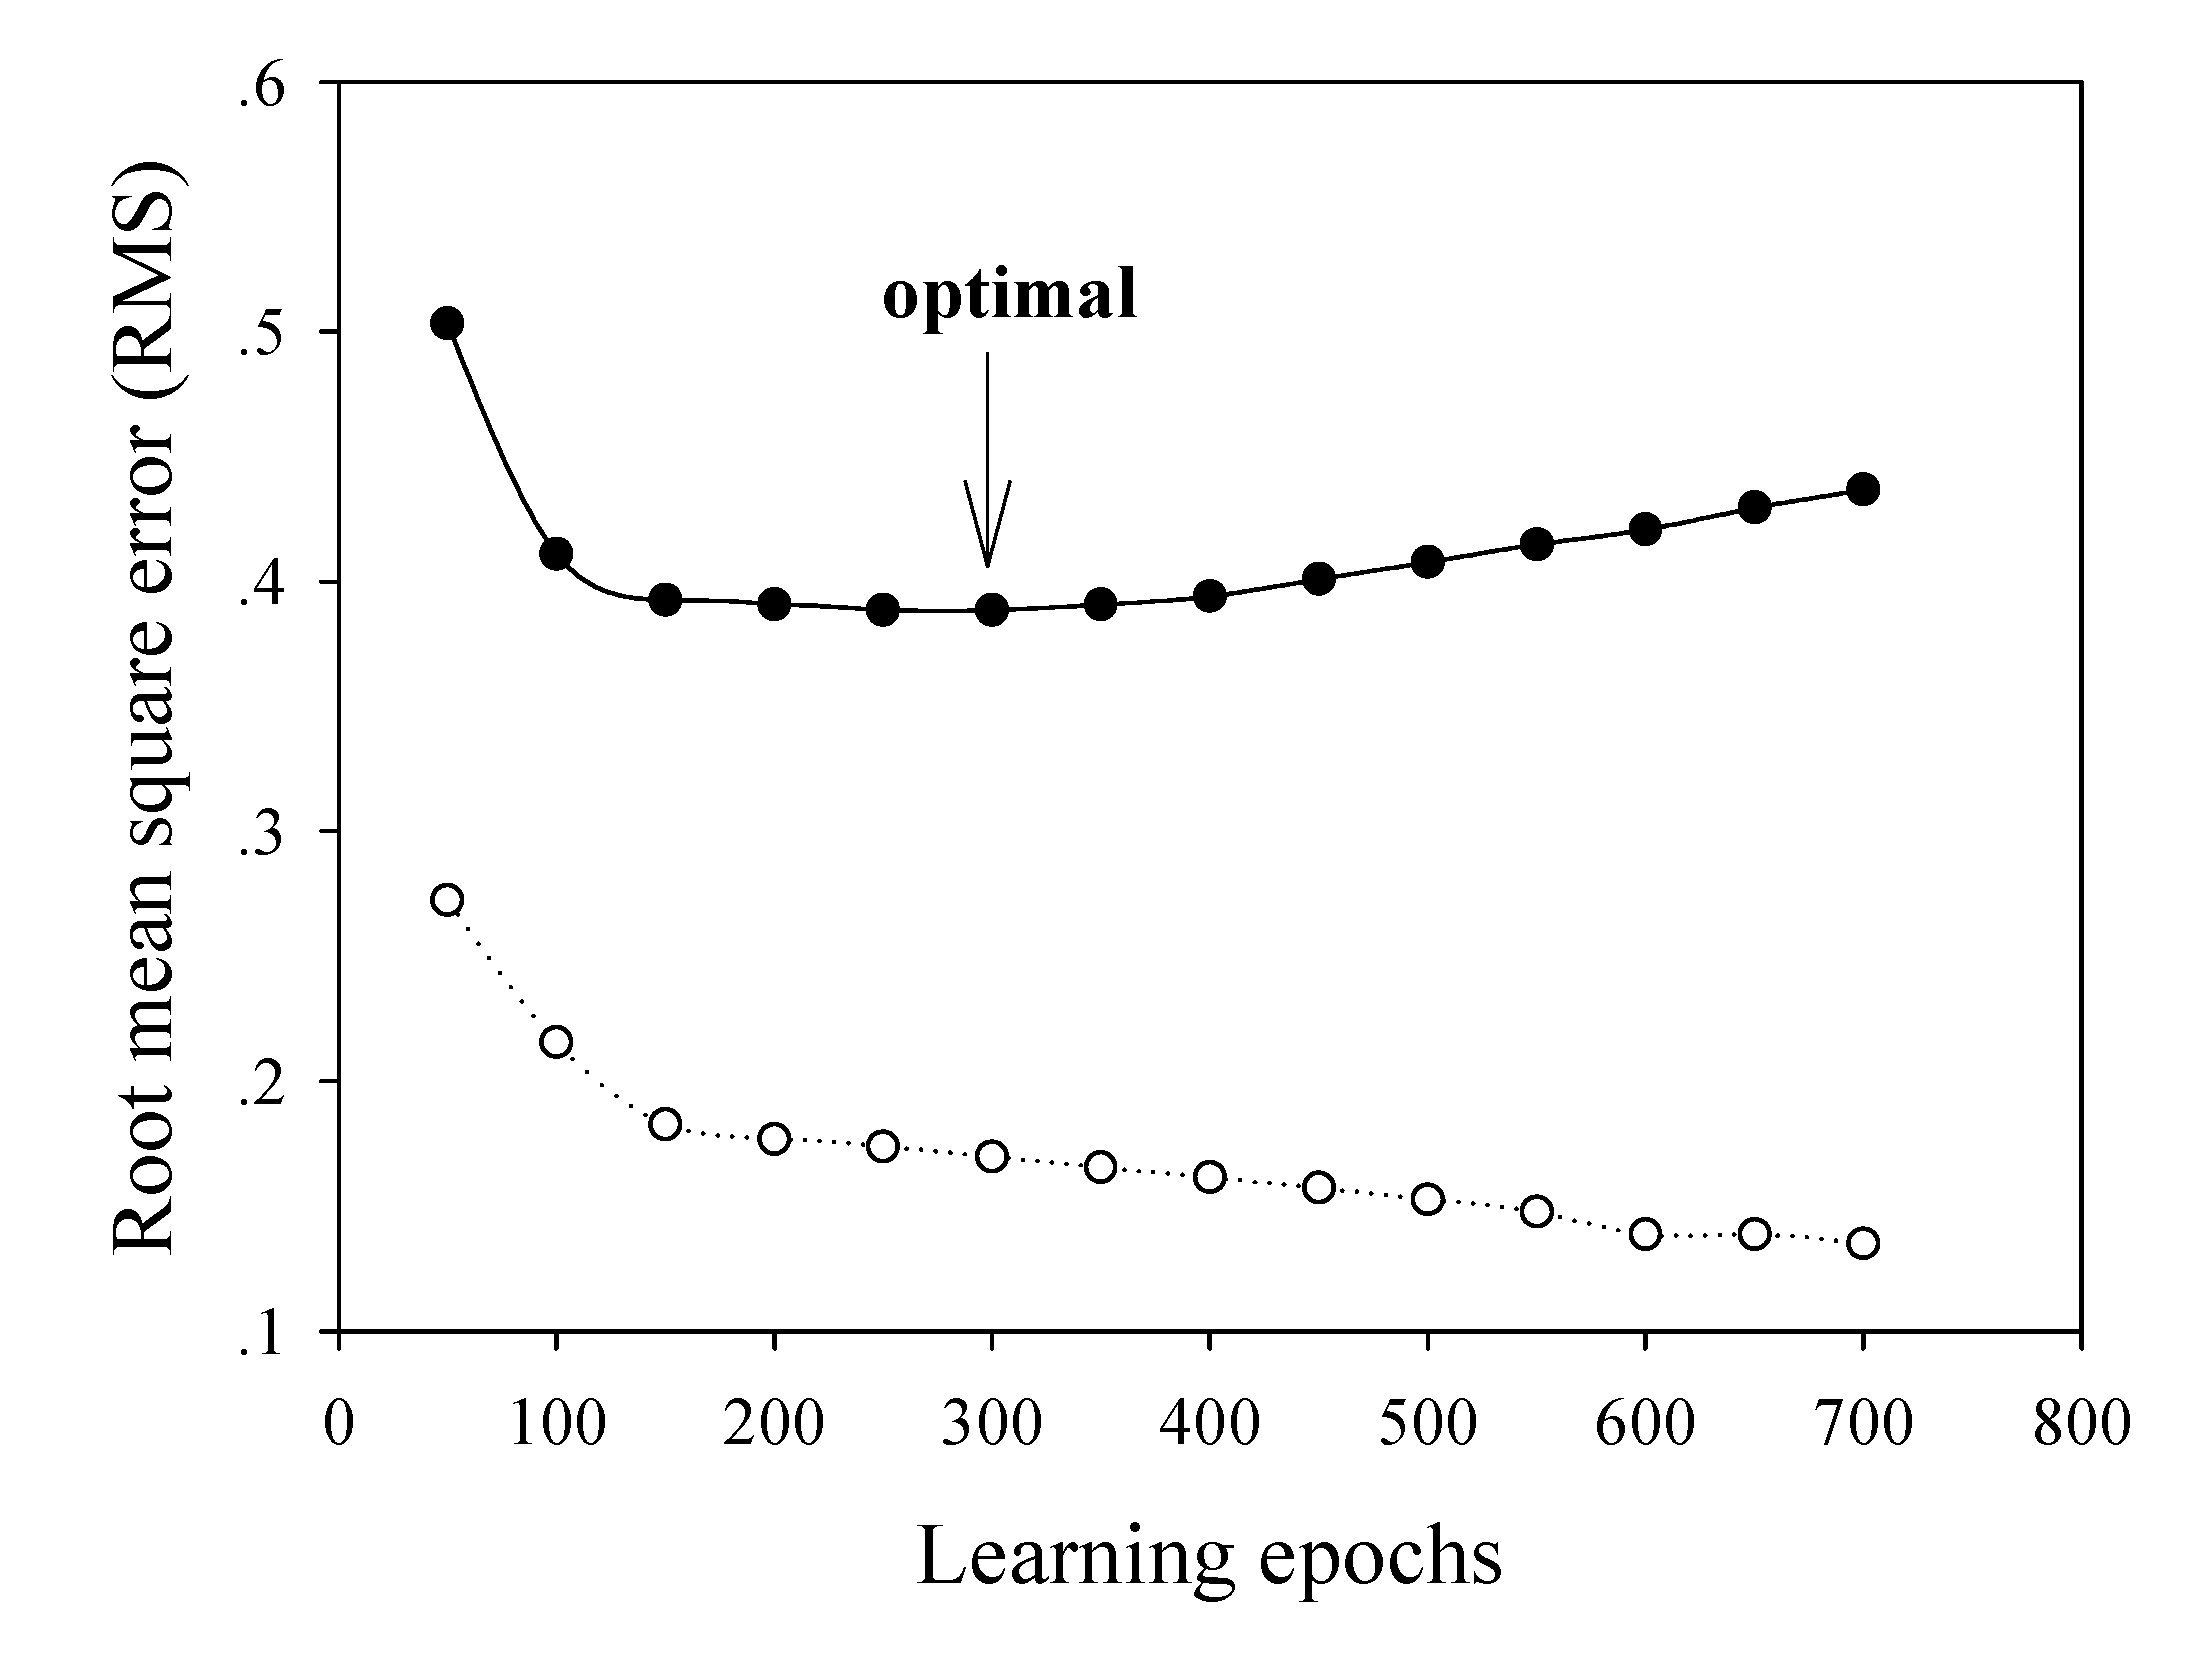
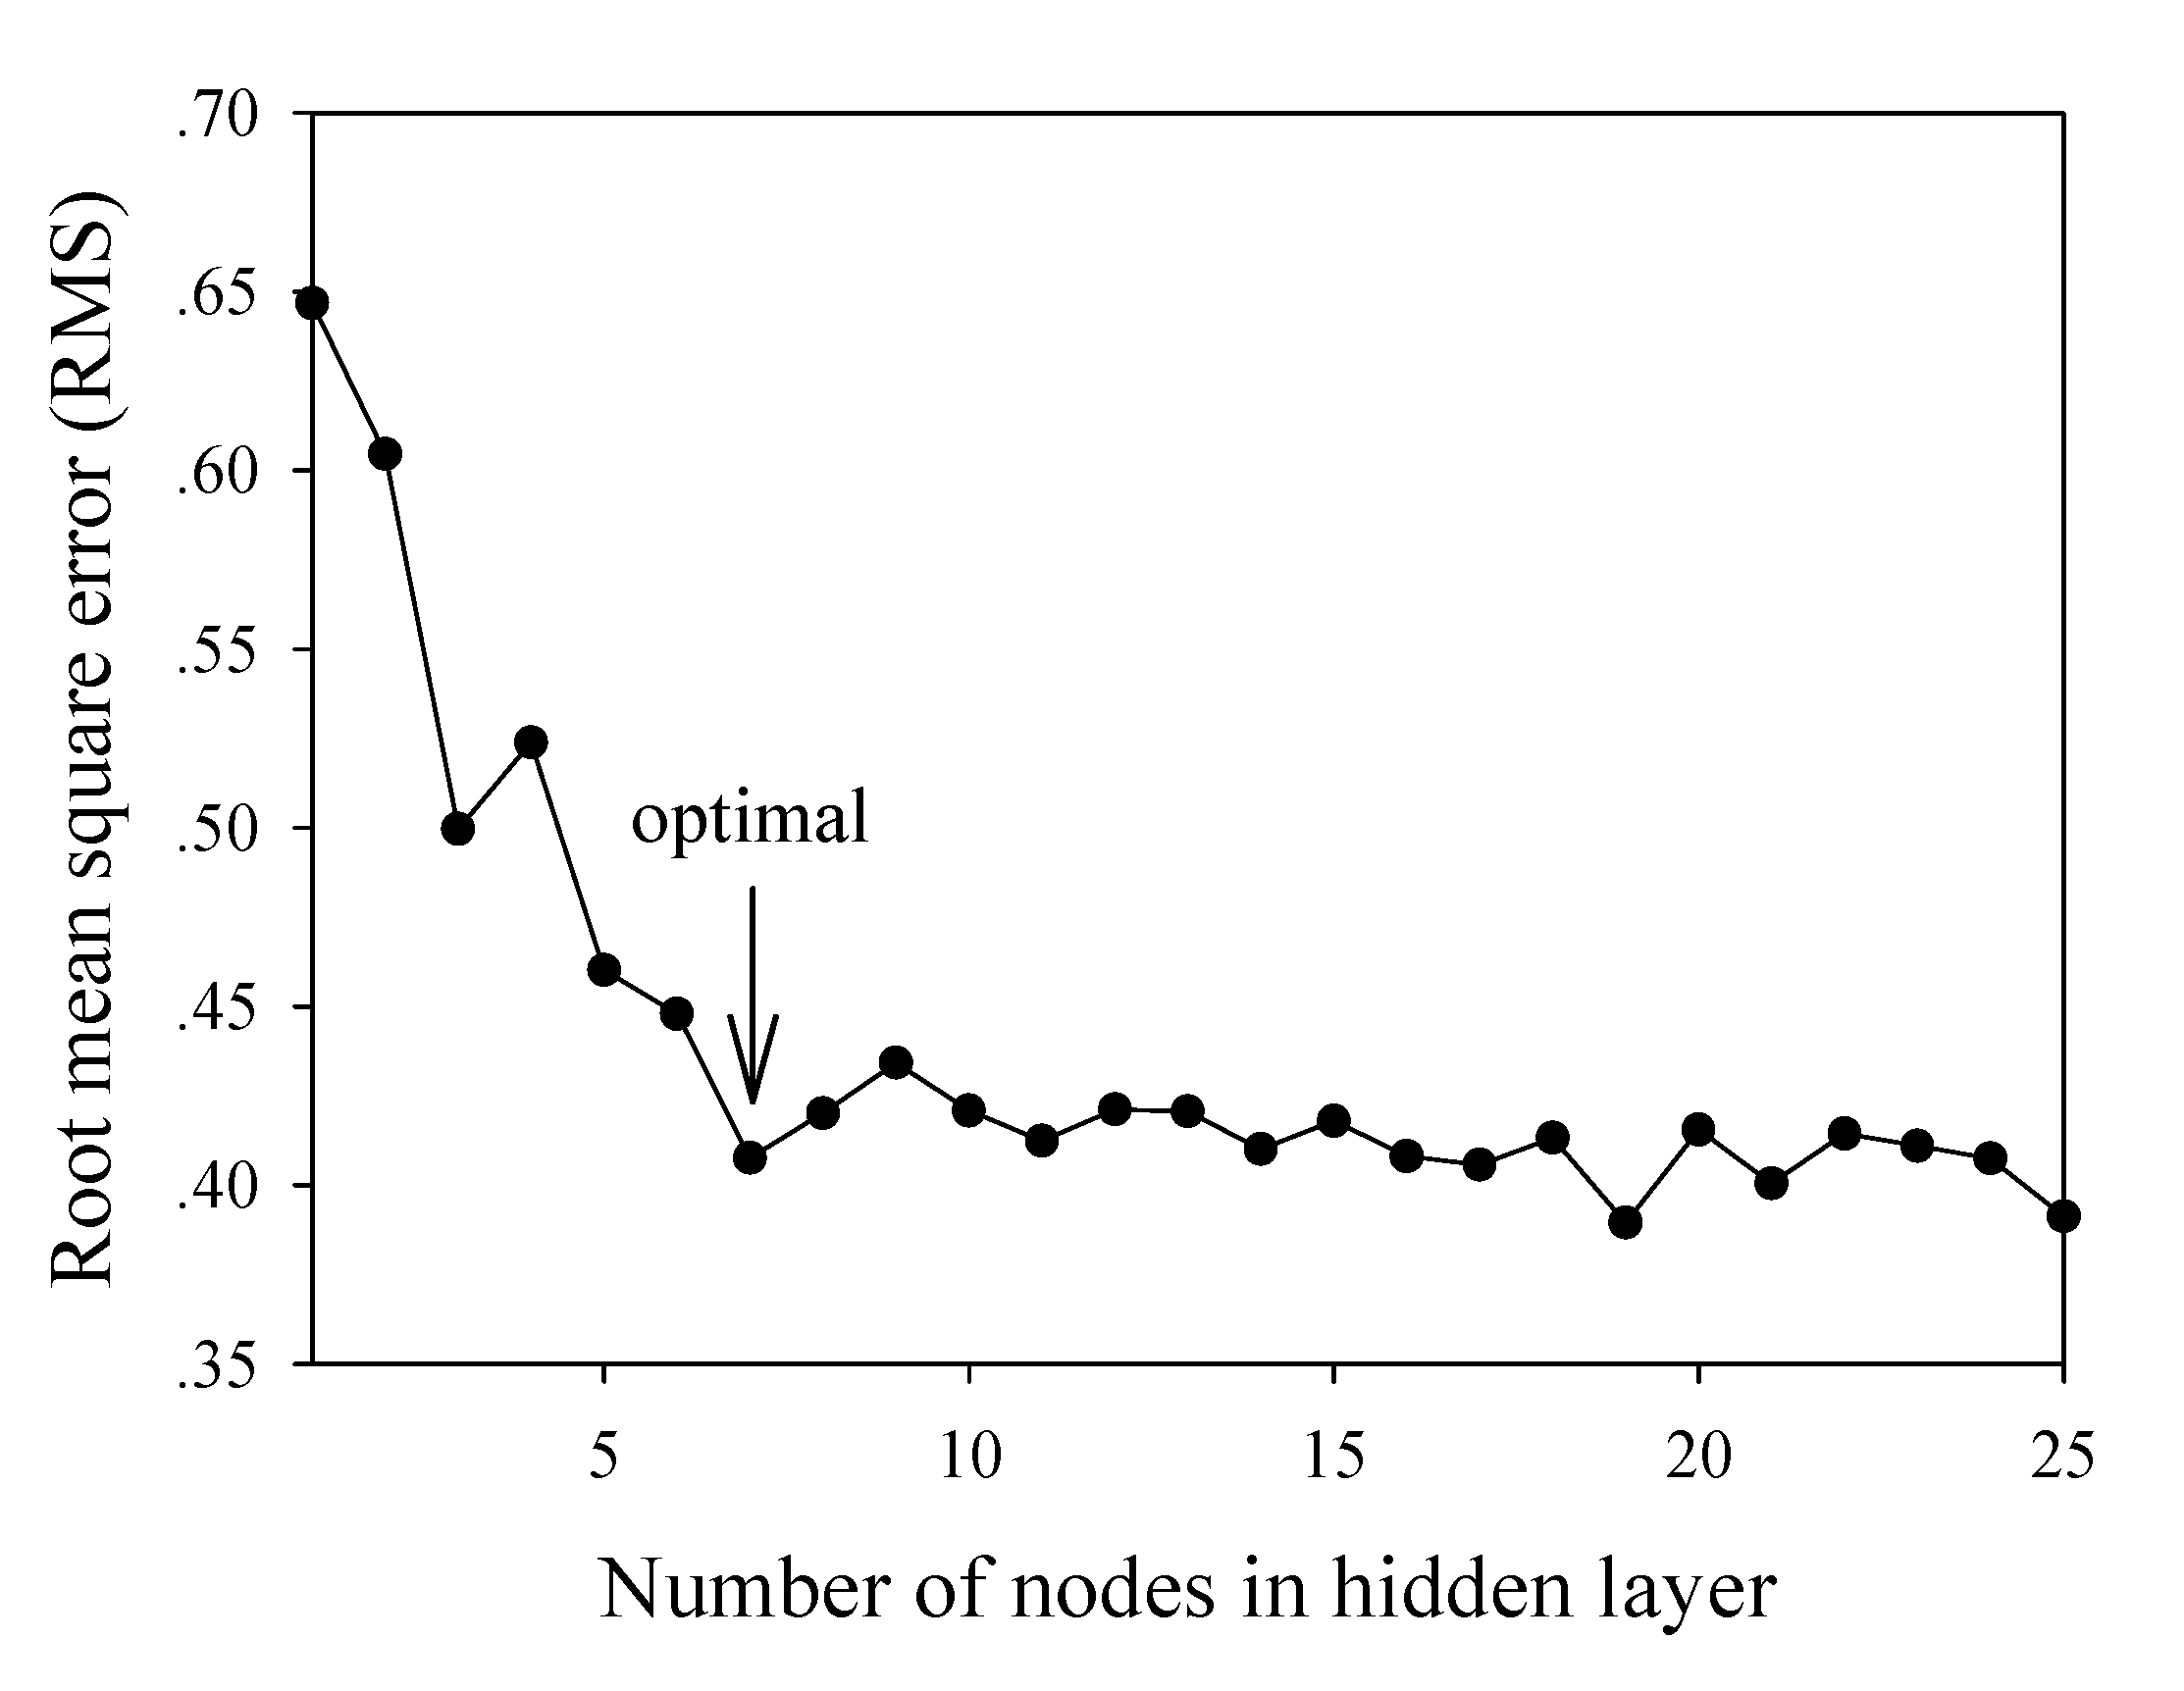
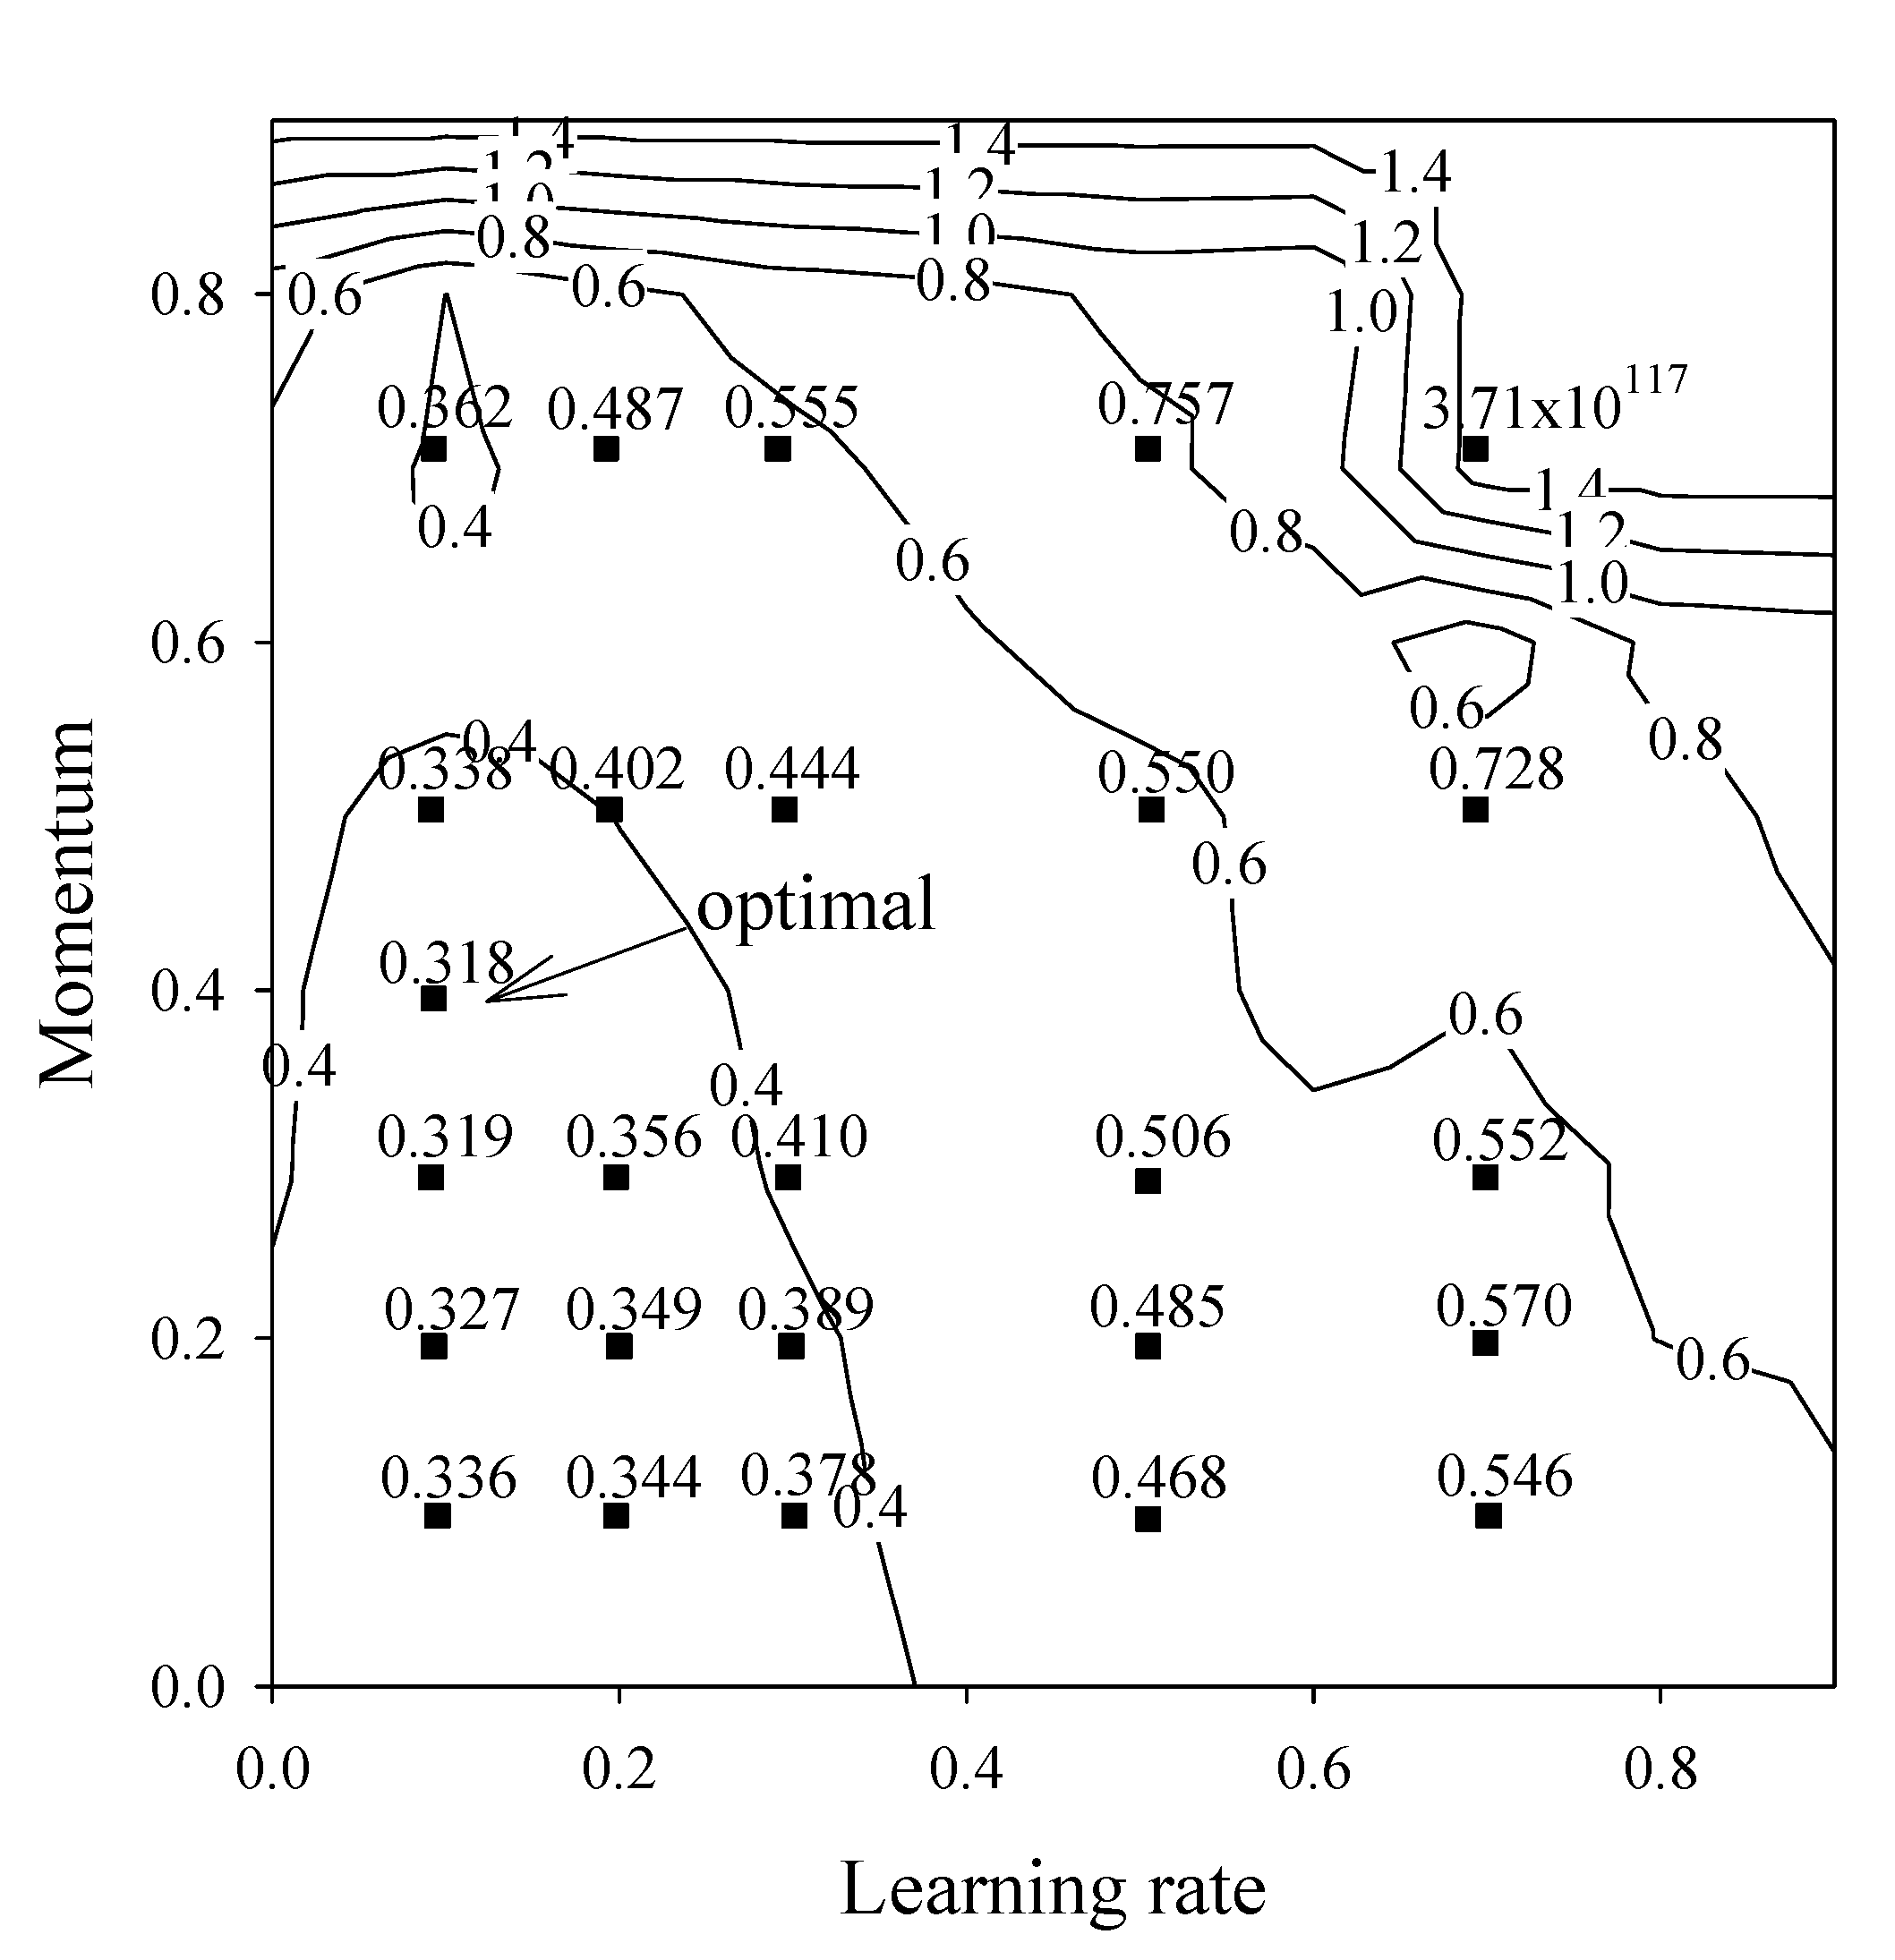
Parameter optimization


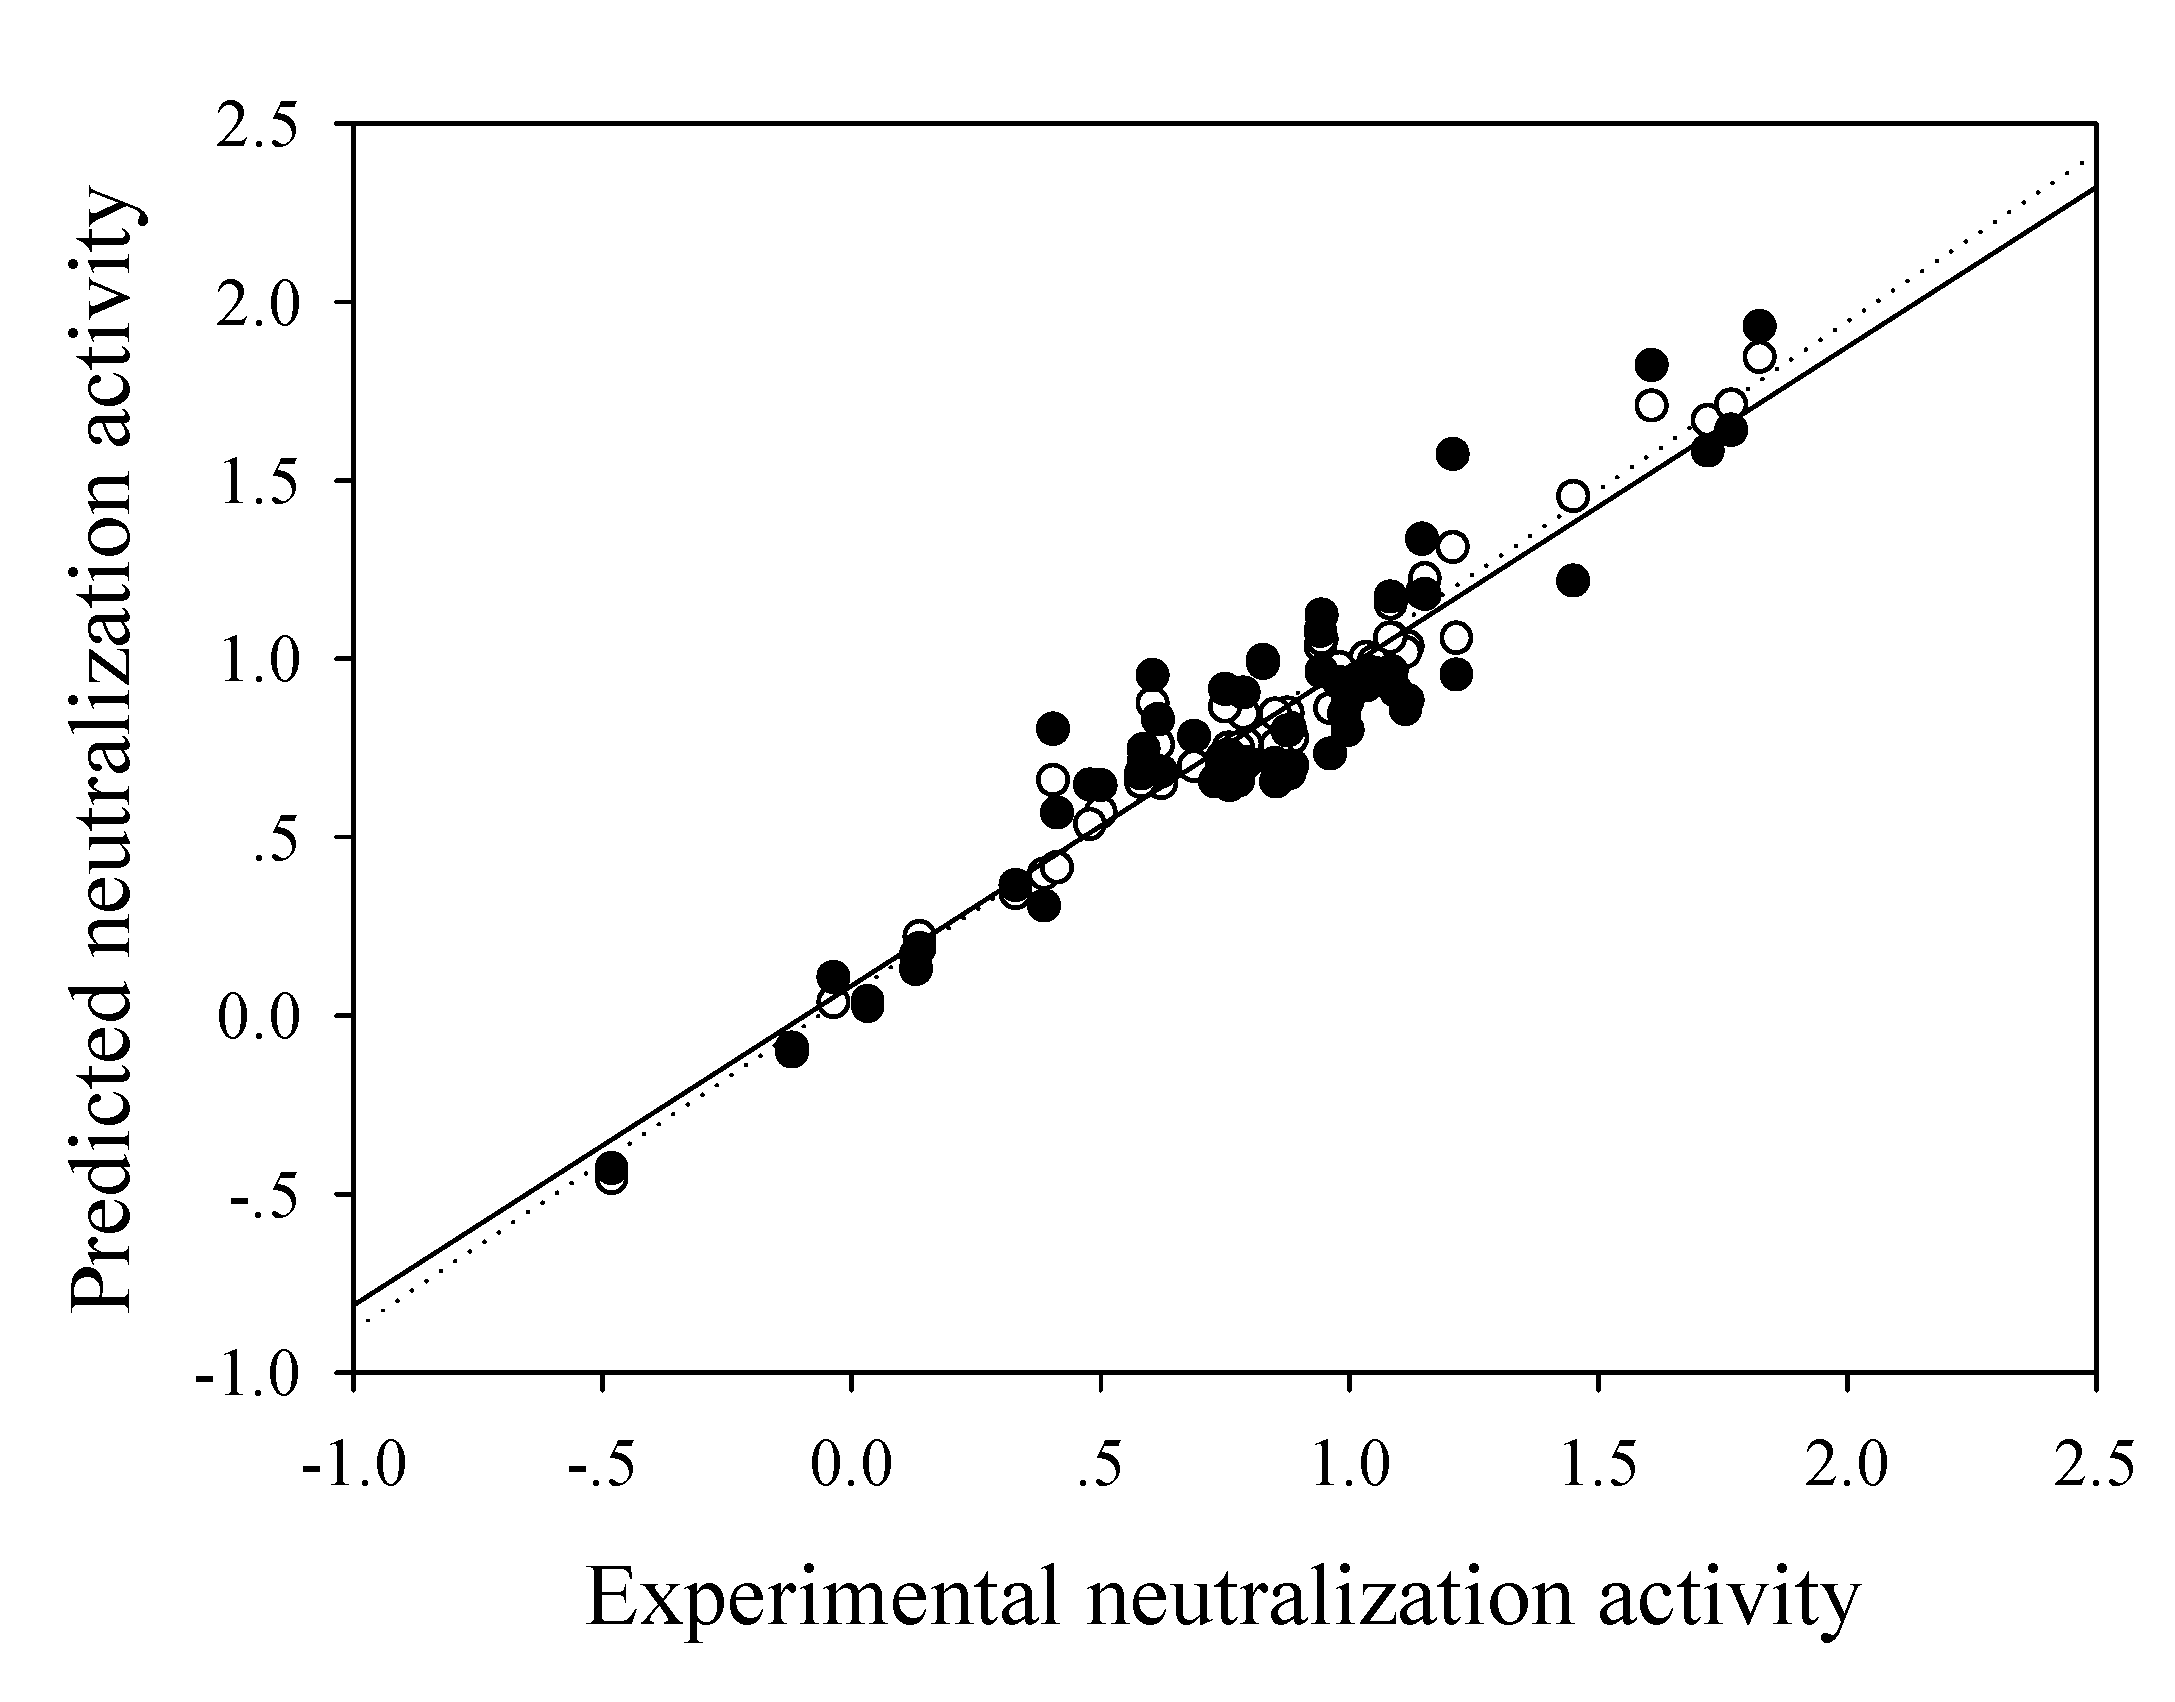
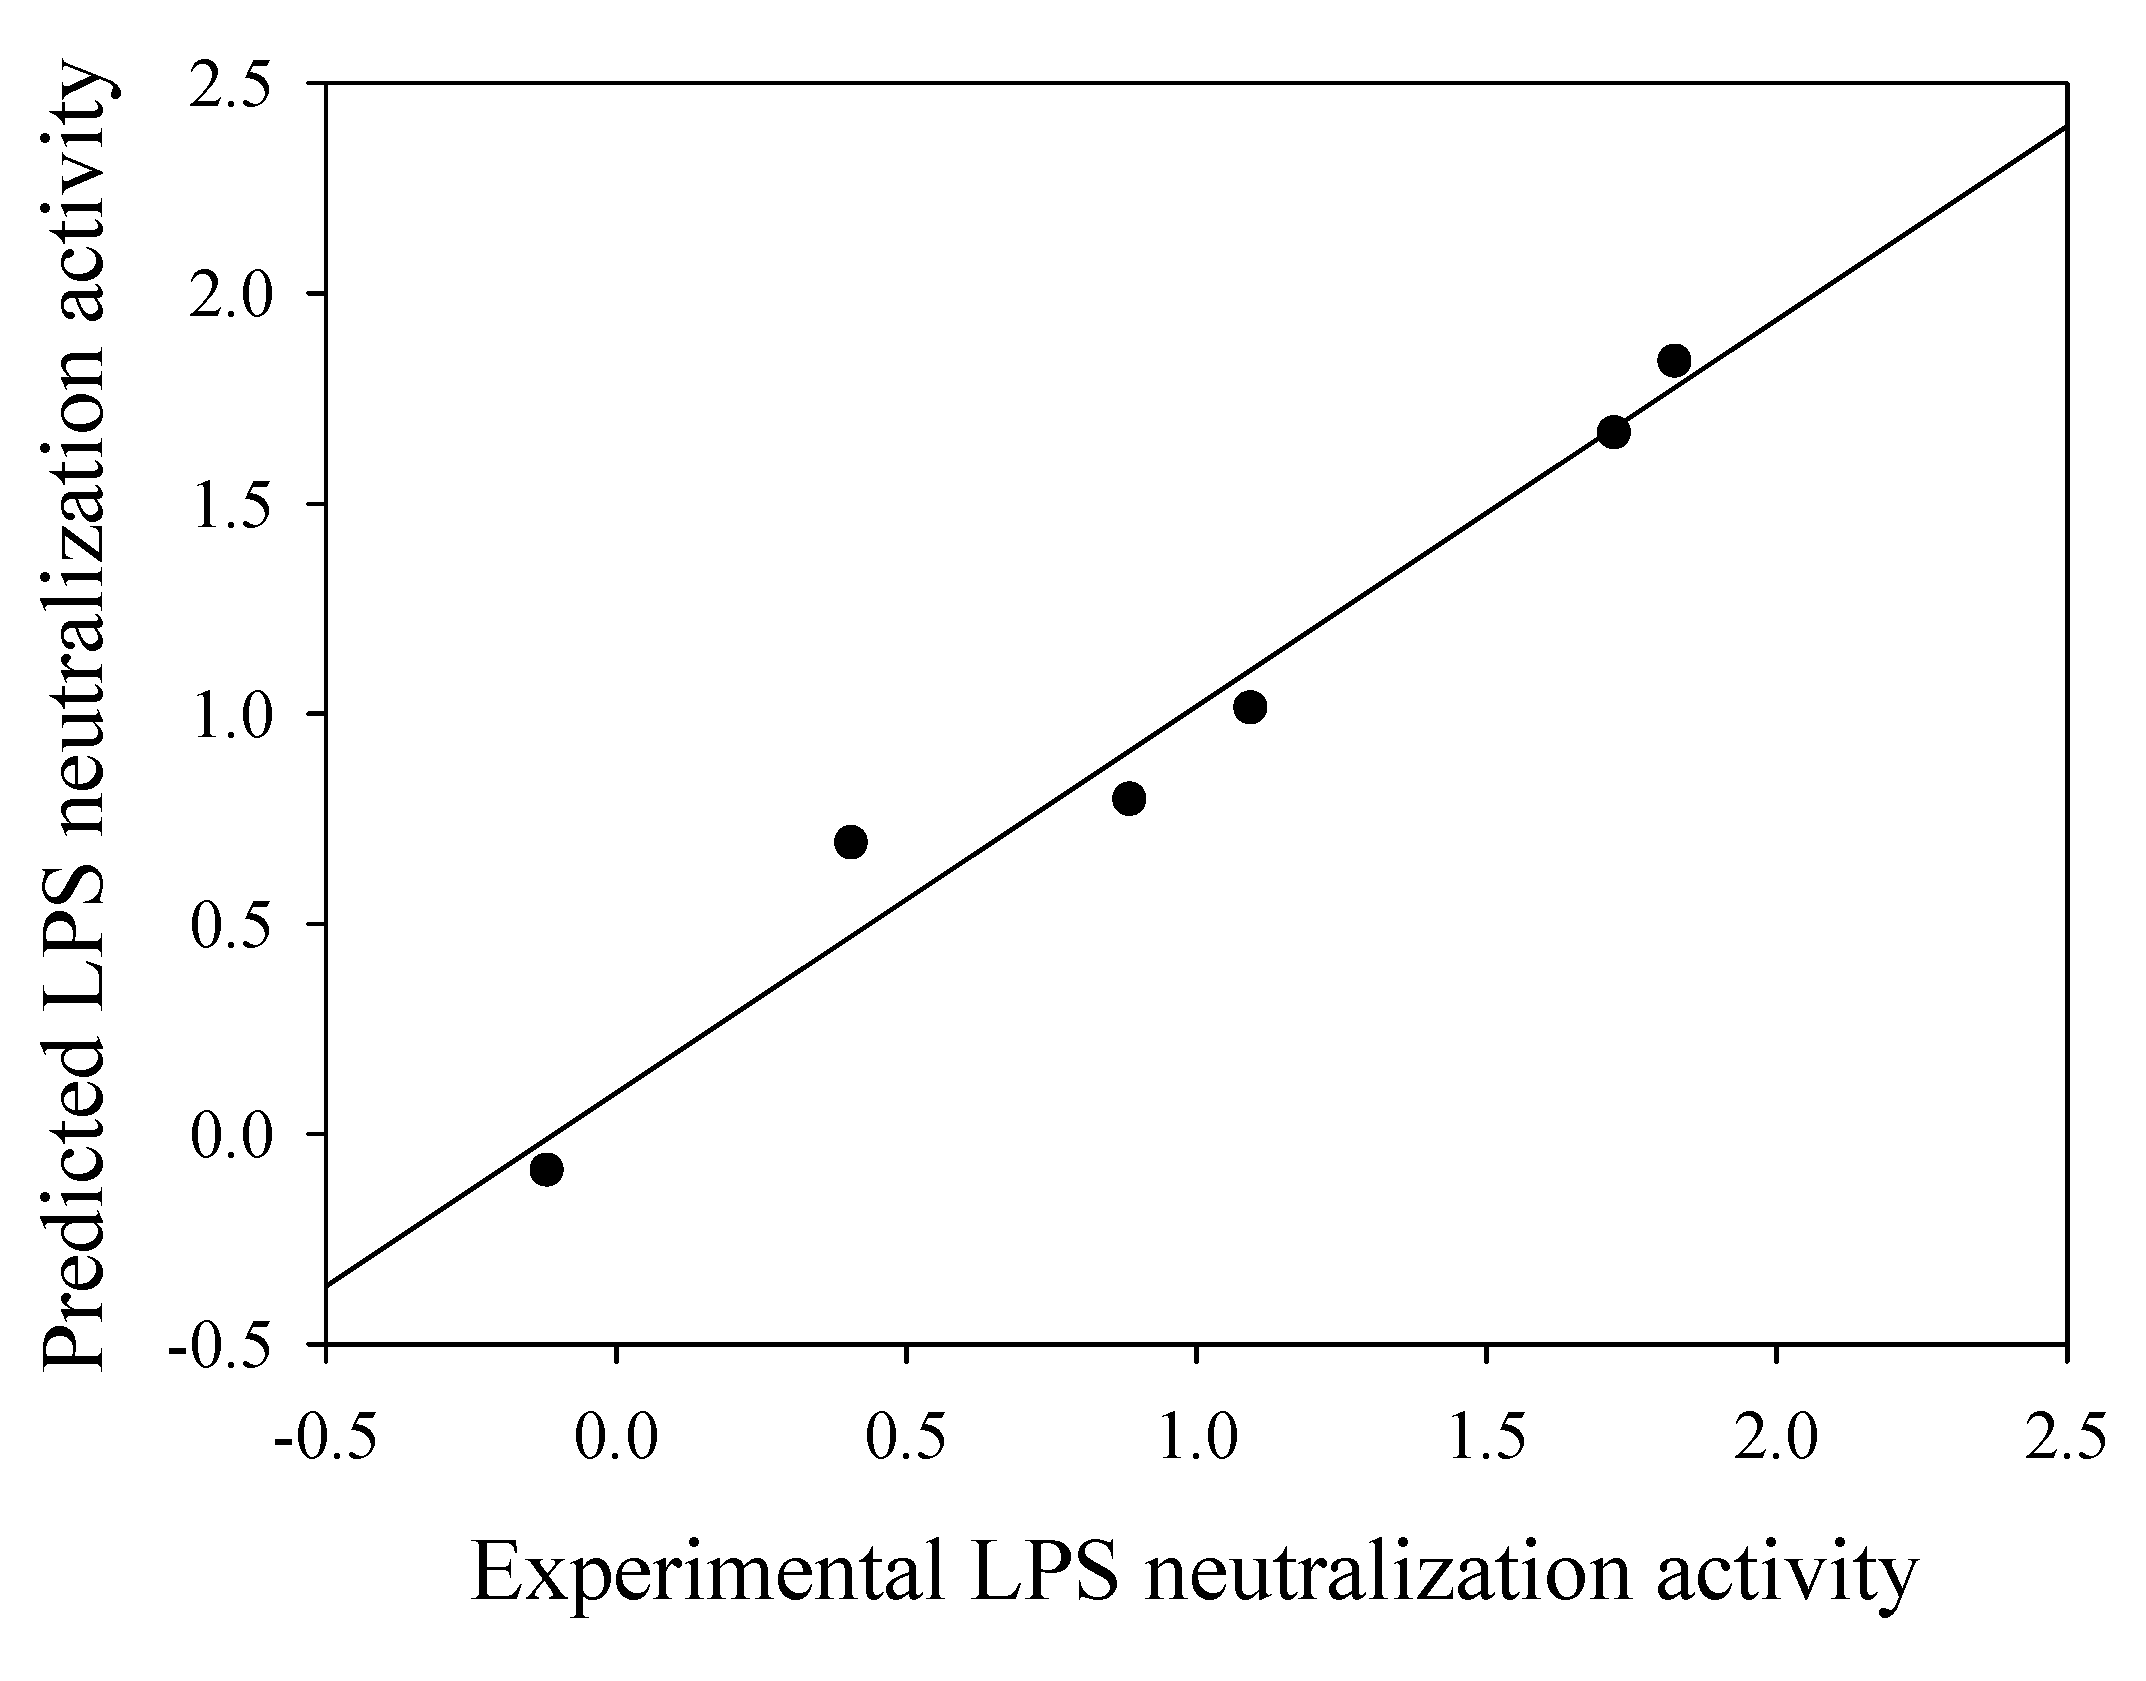
Prediction of LPS neutralization activity using artificial neural network

| Model | N | rTr | RMSTr | rCV | RMSCV | R2 | R2adj | F ratio | Critical F value |
|---|---|---|---|---|---|---|---|---|---|
| 1 | 73 | 0.938 | 0.167 | 0.781 | 0.287 | 0.610 | 0.524 | 6.480 | 1.866a |
| 2 | 69 | 0.942 | 0.158 | 0.728 | 0.341 | 0.530 | 0.419 | 4.350 | 1.879b |
| 3 | 64 | 0.947 | 0.141 | 0.857 | 0.221 | 0.734 | 0.665 | 9.658 | 1.899c |
| 4 | 63 | 0.952 | 0.146 | 0.823 | 0.250 | 0.677 | 0.591 | 7.186 | 1.904d |
| 5 | 60 | 0.972 | 0.124 | 0.907 | 0.186 | 0.823 | 0.773 | 14.946 | 1.918e |
| 6 | 58 | 0.980 | 0.124 | 0.930 | 0.162 | 0.865 | 0.825 | 19.680 | 1.929f |
Conclusions
Experimental
Data collection
Descriptor generation

Descriptor reduction
| No. | Compound Name | Exp. ED50 | Exp. logED50 | Pred. logED50 | Residual | |||||||||
|---|---|---|---|---|---|---|---|---|---|---|---|---|---|---|
| 1c | N1-Acetyl-1,16-diamino-4,8,13triazahexadecane tetrakis(trifluoroacetic acid) | 107.450 | 2.031 | 1.395 | 0.636 | |||||||||
| 2 | N1-Nonanoyl-1,16-diamino-4,8,13-triazahexadecane tetrakis(trifluoroacetic acid) | 0.920 | -0.036 | 0.254 | -0.290 | |||||||||
| 3 | N1-Decanoyl-1,16-diamino-4,8,13-triazahexadecane tetrakis(trifluoroacetic acid) | 1.080 | 0.033 | -0.210 | 0.243 | |||||||||
| 4 | N1-Pentadecanoyl-1,16-diamino-4,8,13-triazahexadecane tetrakis(trifluoroacetic acid) | 1.350 | 0.130 | 0.118 | 0.012 | |||||||||
| 5 | N1-Heptadecanoyl-1,16-diamino-4,8,13-triazahexadecane tetrakis(trifluoroacetic acid) | 1.370 | 0.137 | 0.335 | -0.198 | |||||||||
| 6 | N1-Nonadecanoyl-1,16-diamino-4,8,13-triazahexadecane tetrakis(trifluoroacetic acid) | 2.440 | 0.387 | 0.306 | 0.081 | |||||||||
| 7 | N1,N20-Dinonanoyl-1,20-diamino-4,8,13,17-tetrazaicosane tetrakis(trifluoroacetic acid) | 0.330 | -0.481 | -0.203 | -0.278 | |||||||||
| 8 | N1,N20-Didecanoyl-1,20-diamino-4,8,13,17-tetrazaicosane tetrakis(trifluoroacetic acid) | 0.760 | -0.119 | 0.058 | -0.177 | |||||||||
| 9f | N1,N20-Didodecanoyl-1,20-diamino-4,8,13,17-tetrazaicosane tetrakis(trifluoroacetic acid) | 6.870 | 0.837 | 0.132 | 0.705 | |||||||||
| 10f | N1,N20-Dipentdecanoyl-1,20-diamino-4,8,13,17-tetrazaicosane tetrakis(trifluoroacetic acid) | 8.670 | 0.938 | 1.518 | -0.580 | |||||||||
| 11 | N1,N20-Diheptadecanoyl-1,20-diamino-4,8,13,17-tetrazaicosane tetrakis (trifluoroacetic acid) | 52.530 | 1.72 | 1.806 | -0.086 | |||||||||
| 12 | N1,N20-Dinonadecanoyl-1,20-diamino-4,8,13,17-tetrazaicosane tetrakis(trifluoroacetic acid) | 66.730 | 1.824 | 1.658 | 0.166 | |||||||||
| 13 | (S)-1-(1-(2-(2-aminoethoxy)ethylamino)-1-oxo-3-phenylpropan-2-yl)-3-octadecylurea | 12.400 | 1.093 | 0.871 | 0.222 | |||||||||
| 14 | (S)-N-(2-(2-aminoethoxy)ethyl)-2-(2 (octadecylamino)acetamido)-3-phenylpropanamide | 2.540 | 0.405 | 0.706 | -0.301 | |||||||||
| 15 | (S)-N-(2-(2-aminoethoxy)ethyl)-2-(3-(octadecylamino)propanamido)-3-phenylpropanamide | 7.680 | 0.885 | 0.591 | 0.294 | |||||||||
| 16 | (S)-1-(1-(2-(2-aminoethoxy)ethylamino)-3-(1H-imidazol-4-yl)-1-oxopropan-2-yl)-3-octadecylurea | 13.100 | 1.117 | 0.881 | 0.236 | |||||||||
| 17 | (S)-N-(2-(2-aminoethoxy)ethyl)-3-(1H-imidazol-4-yl)-2-(2-(octadecylamino)acetamido)propanamide | 3.170 | 0.501 | 0.557 | -0.056 | |||||||||
| 18 | (S)-N-(2-(2-aminoethoxy)ethyl)-3-(1H-imidazol-4-yl)-2-(3-(octadecylamino)propanamido)propanamide | 5.380 | 0.731 | 0.869 | -0.138 | |||||||||
| 19 | 1-(2-(2-(2-aminoethoxy)ethylamino)-2-oxoethyl)-3-octadecylurea | 14.000 | 1.146 | 0.980 | 0.166 | |||||||||
| 20 | N-(2-(2-aminoethoxy)ethyl)-2-(2 (octadecylamino)acetamido)acetamide | 14.200 | 1.152 | 1.187 | -0.035 | |||||||||
| 21 | N-(2-(2-(2-aminoethoxy)ethylamino)-2-oxoethyl)-3-(nonadecylamino)propanamide | 10.800 | 1.033 | 1.025 | 0.009 | |||||||||
| 22 | (S)-1-(1-(3-aminopropylamino)-1-oxo-3-phenylpropan-2-yl)-3-octadecylurea | 8.800 | 0.944 | 0.990 | -0.046 | |||||||||
| 23 | (S)-N-(3-aminopropyl)-2-(2-(octadecylamino)acetamido)-3-phenylpropanamide | 4.130 | 0.616 | 0.707 | -0.091 | |||||||||
| 24 | (S)-N-(3-aminopropyl)-2-(3-(octadecylamino)propanamido)-3-phenylpropanamide | 5.750 | 0.760 | 0.666 | 0.094 | |||||||||
| 25 | (S)-1-(1-(3-aminopropylamino)-3-(1H-imidazol-4-yl)-1-oxopropan-2-yl)-3-octadecylurea | 4.870 | 0.688 | 0.814 | -0.126 | |||||||||
| 26f | (S)-N-(3-aminopropyl)-3-(1H-imidazol-4-yl)-2-(2-(octadecylamino)acetamido)propanamide | 6.860 | 0.836 | 0.414 | 0.422 | |||||||||
| 27 | (S)-N-(3-aminopropyl)-3-(1H-imidazol-4-yl)-2-(3-(octadecylamino)propanamido)propanamide | 3.010 | 0.479 | 0.994 | -0.515 | |||||||||
| 28c | 1-(2-(3-aminopropylamino)-2-oxoethyl)-3-octadecylurea | 6.610 | 0.82 | 1.493 | -0.673 | |||||||||
| 29b | N-(3-aminopropyl)-2-(2-(octadecylamino)acetamido)acetamide | 2420 | 3.384 | - | - | |||||||||
| 30 | N-(2-(3-aminopropylamino)-2-oxoethyl)-3-(octadecylamino)propanamide | 6.140 | 0.788 | 0.961 | -0.173 | |||||||||
| 31b | (S)-N-(5-aminopentyl)-2-(2-(octadecylamino)acetamido)-3-phenylpropanamide | 3850 | 3.585 | - | - | |||||||||
| 32 | (S)-N-(5-aminopentyl)-2-(3-(octadecylamino)propanamido)-3-phenylpropanamide | 7.510 | 0.876 | 0.861 | 0.015 | |||||||||
| 33 | (S)-1-(1-(5-aminopentylamino)-3-(1H-imidazol-4-yl)-1-oxopropan-2-yl)-3-octadecylurea | 12.100 | 1.083 | 1.343 | -0.260 | |||||||||
| 34g | (S)-N-(5-aminopentyl)-3-(1H-imidazol-4-yl)-2-(3-(octadecylamino)propanamido)propanamide | 18.700 | 1.272 | 0.702 | 0.570 | |||||||||
| 35 | 1-(2-(5-aminopentylamino)-2-oxoethyl)-3-octadecylurea | 28.200 | 1.450 | 0.944 | 0.506 | |||||||||
| 36 | N-(5-aminopentyl)-2-(2-(octadecylamino)acetamido)acetamide | 11.200 | 1.049 | 0.967 | 0.082 | |||||||||
| 37 | N-(2-(5-aminopentylamino)-2-oxoethyl)-3-(octadecylamino)propanamide | 9.770 | 0.990 | 0.900 | 0.090 | |||||||||
| 38g | 1-(3-aminopropyl)-3-octadecylurea | 3.800 | 0.580 | 0.839 | -0.259 | |||||||||
| 39 | N-(3-aminopropyl)-2-(octadecylamino)acetamide | 9.920 | 0.997 | 0.652 | 0.346 | |||||||||
| 40 | N-(3-aminopropyl)-3-(octadecylamino)propanamide | 6.210 | 0.793 | 0.794 | -0.001 | |||||||||
| 41 | 1-(5-aminopentyl)-3-octadecylurea | 8.740 | 0.942 | 0.841 | 0.101 | |||||||||
| 42 | 1-(2-(2-aminoethoxy)ethyl)-3-octadecylurea | 12.150 | 1.085 | 1.032 | 0.053 | |||||||||
| 43 | N-(5-aminopentyl)-2-(octadecylamino)acetamide | 4.030 | 0.605 | 0.908 | -0.303 | |||||||||
| 44 | N-(2-(2-aminoethoxy)ethyl)-2-(octadecylamino)acetamide | 9.160 | 0.962 | 0.797 | 0.165 | |||||||||
| 45 | N-(5-aminopentyl)-3-(octadecylamino)propanamide | 7.610 | 0.881 | 0.895 | -0.014 | |||||||||
| 46 | N-(2-(2-aminoethoxy)ethyl)-3-(octadecylamino)propanamide | 5.730 | 0.758 | 0.883 | -0.125 | |||||||||
| 47 | L-Lys-N1-spermine | 40.420 | 1.607 | 1.725 | -0.118 | |||||||||
| 48 | D-Lys-N1-spermine | 58.420 | 1.767 | 1.611 | 0.157 | |||||||||
| 49e | L-Lys-ε-(eicosanoyl)-N1-spermine | 6.460 | 0.810 | 1.052 | -0.242 | |||||||||
| 50 | D-Lys-ε-(stearoyl)-N1-spermine | 8.800 | 0.944 | 0.988 | -0.044 | |||||||||
| 51 | L-Lys-ε-(stearoyl)-N1-spermine | 16.390 | 1.215 | 0.888 | 0.327 | |||||||||
| 52 | L-Lys(ene-Δ11-stearoyl)-N1-spermine | 4.200 | 0.623 | 0.812 | -0.189 | |||||||||
| 53 | L-Lys-ε-(heptadecanoyl)-N1-spermine | 6.710 | 0.827 | 0.990 | -0.163 | |||||||||
| 54c | L-Lys-ε-(hexadecanesulfonamide)-N1-spermine | 5.930 | 0.773 | 1.277 | -0.504 | |||||||||
| 55 | D-Lys-ε-(palmitoyl)-N1-spermine | 9.940 | 0.997 | 0.926 | 0.071 | |||||||||
| 56 | L-Lys(palmitoyl)-N1-spermine | 10.740 | 1.031 | 0.962 | 0.069 | |||||||||
| 57 | L-Lys(ene-Δ9-palmitoyl)-N1-spermine | 3.820 | 0.582 | 0.494 | 0.088 | |||||||||
| 58 | L-Lys-ε-(myristoyl)-N1-spermine | 5.630 | 0.751 | 0.986 | -0.235 | |||||||||
| 59 | L-Lys-ε-(octanoyl)-N1-spermine | 12.970 | 1.113 | 1.112 | 0.002 | |||||||||
| 60b | D-Lys-ε-(isopropyl)-N1-spermine | 298.850 | 2.475 | - | - | |||||||||
| 61b | D-Lys-ε-(dimethylpropyl)-N1-spermine | 327.040 | 2.515 | - | - | |||||||||
| 62 | D-Lys-ε-(2-norbornaneacetoyl)-N1-spermine | 16.160 | 1.208 | 0.915 | 0.293 | |||||||||
| 63c | D-Lys-ε-(4-biphenycarboxamide)-N1-spermine | 7.860 | 0.895 | 1.554 | -0.659 | |||||||||
| 64 | L-Lys-ε-(4-(1-pyrene)-butanoyl)-N1-spermine | 7.090 | 0.851 | 0.296 | 0.555 | |||||||||
| 65b | L-Lys-ε-(methylpolyethyleneglycolpropionyl)-N1-spermine | 310.950 | 2.493 | - | - | |||||||||
| 66b | L-Lys-ε-(2-[2-(2-methoxyethoxy)ethoxy]acetoyl)-N1-spermine | 572.500 | 2.758 | - | - | |||||||||
| 67b | L-Lys-ε-(2-(2-methoxyethoxy)acetoyl)-N1-spermine | 495.190 | 2.695 | - | - | |||||||||
| 68 | L-Lys-ε-(hexadecyl)-N1-spermine | 5.560 | 0.745 | 0.619 | 0.126 | |||||||||
| 69 | L-Lys-ε-(ene -Δ11-hexadecyl)-N1-spermine | 2.590 | 0.413 | -0.049 | 0.462 | |||||||||
| 70 | D-Lys-ε-(n-heptyl)-N1-spermine | 3.860 | 0.587 | 0.751 | -0.164 | |||||||||
| 71 | L-Lys-ε-(n-heptyl)-N1-spermine | 5.990 | 0.777 | 0.696 | 0.081 | |||||||||
| 72 | L-Lys-ε-(bis-(n-heptyl))-N1-spermine | 2.140 | 0.330 | 0.355 | -0.025 | |||||||||
| 73 | L-Lys-ε-(n-hexyl)-N1-spermine | 7.130 | 0.853 | 0.877 | -0.024 | |||||||||
| 74 | D-(S)-Lys-ε-(ene-Δ6(3,7-dimethyl-1-octyl))-N1-spermine | 9.550 | 0.980 | 0.951 | 0.029 | |||||||||
| 75 | L-Lys-ε-(3,3-dimethyl-1-butyl)-N1-spermine | 12.070 | 1.082 | 1.174 | -0.092 | |||||||||
| 76d | D-Lys-ε-(3,3-dimethyl-1-butyl)-N1-spermine | 10.930 | 1.039 | 1.244 | -0.205 | |||||||||
| 77d | D-Lys-ε-(3-methylpropyl)-N1-spermine | 100.580 | 2.003 | 1.385 | 0.618 | |||||||||
| 78d | L-(R)-Lys-ε-((2-isoproply-5-methyl)cyclohexyl)-N1-spermine | 16.080 | 1.206 | 1.280 | -0.074 | |||||||||
| 79d | L-Lys-ε-(bis-(cyclohexyl))-N1-spermine | 4.040 | 0.606 | 0.099 | 0.507 | |||||||||
| 80d | D-Lys-ε-(4-phenylbenzyl)-N1-spermine | 3.710 | 0.569 | 0.056 | 0.513 | |||||||||
Overview of artificial neural network
Prediction of LPS neutralization activity


Internal validation procedure
Statistical analysis


 represents the mean of the residual, and N represents the sample size of the data set. The cut-off value for the absolute standardized residual was set to 2.
Acknowledgements
- Samples Availability: Not available.
References
- Hurley, J.C. Antibiotic-induced release of endotoxin: a reappraisal. Clin. Infect. Dis. 1992, 15, 840–854. [Google Scholar] [CrossRef]
- Masoud, H.; Altman, E.; Richards, J.C.; Lam, J.S. General strategy for structural analysis of the oligosaccharide region of lipooligosaccharides. Structure of the oligosaccharide component of Pseudomonas aeruginosa IATS serotype 06 mutant R5 rough-type lipopolysaccharide. Biochemistry 1994, 33, 10568–10578. [Google Scholar] [CrossRef]
- Munford, R.S. Severe sepsis and septic shock: the role of gram-negative bacteremia. Annu. Rev. Pathol. 2006, 1, 467–496. [Google Scholar] [CrossRef]
- Ulevitch, R.J.; Tobias, P.S. Recognition of gram-negative bacteria and endotoxin by the innate immune system. Curr. Opin. Immunol. 1999, 11, 19–22. [Google Scholar] [CrossRef]
- Zhang, F.X.; Kirschning, C.J.; Mancinelli, R.; Xu, X.P.; Jin, Y.; Faure, E.; Mantovani, A.; Rothe, M.; Muzio, M.; Arditi, M. Bacterial lipopolysaccharide activates nuclear factor-kappaB through interleukin-1 signaling mediators in cultured human dermal endothelial cells and mononuclear phagocytes. J. Biol. Chem. 1999, 274, 7611–7614. [Google Scholar]
- Tsiotou, A.G.; Sakorafas, G.H.; Anagnostopoulos, G.; Bramis, J. Septic shock; current pathogenic concepts from a clinical perspective. Med. Sci. Monit. 2005, 11, RA76–RA85. [Google Scholar]
- Muhle, S.A.; Tam, J.P. Design of Gram-negative selective antimicrobial peptides. Biochemistry 2001, 40, 5777–5785. [Google Scholar] [CrossRef]
- Khownium, K.; Wood, S.J.; Miller, K.A.; Balakrishna, R.; Nguyen, T.B.; Kimbrell, M.R.; Georg, G.I.; David, S.A. Novel endotoxin-sequestering compounds with terephthalaldehyde-bis-guanylhydrazone scaffolds. Bioorg. Med. Chem. Lett. 2006, 16, 1305–1308. [Google Scholar]
- Martin, G.S.; Mannino, D.M.; Eaton, S.; Moss, M. The epidemiology of sepsis in the United States from 1979 through 2000. New Engl. J. Med. 2003, 348, 1546–1554. [Google Scholar] [CrossRef]
- Moss, M.; Martin, G.S. A global perspective on the epidemiology of sepsis. Intens. Care Med. 2004, 30, 527–529. [Google Scholar] [CrossRef]
- Siegel, J.P. Antiendotoxin antibodies. Ann. Intern. Med. 1995, 122, 315–316. [Google Scholar]
- David, S.A. Towards a rational development of anti-endotoxin agents: novel approaches to sequestration of bacterial endotoxins with small molecules. J. Mol. Recognit. 2001, 14, 370–387. [Google Scholar] [CrossRef]
- David, S.A.; Silverstein, R.; Amura, C.R.; Kielian, T.; Morrison, D.C. Lipopolyamines: novel antiendotoxin compounds that reduce mortality in experimental sepsis caused by gram-negative bacteria. Antimicrob. Agents Chemother. 1999, 43, 912–919. [Google Scholar]
- Hase, S.; Rietschel, E.T. Isolation and analysis of the lipid A backbone. Lipid A structure of lipopolysaccharides from various bacterial groups. Eur. J. Biochem. 1976, 63, 101–107. [Google Scholar] [CrossRef]
- Kim, K.S.; Kang, J.H.; Cross, A.S.; Kaufman, B.; Zollinger, W.; Sadoff, J. Functional activities of monoclonal antibodies to the O side chain of Escherichia coli lipopolysaccharides in vitro and in vivo. J. Infect. Dis. 1988, 157, 47–53. [Google Scholar] [CrossRef]
- Raetz, C.R.; Whitfield, C. Lipopolysaccharide endotoxins. Annu. Rev. Biochem. 2002, 71, 635–700. [Google Scholar] [CrossRef]
- Vaarala, O.; Vaara, M.; Palosuo, T. Effective inhibition of cardiolipin-binding antibodies in gram-negative infections by bacterial lipopolysaccharide. Scand. J. Immunol. 1988, 28, 607–612. [Google Scholar] [CrossRef]
- Zahringer, U.; Lindner, B.; Rietschel, E.T. Molecular structure of lipid A, the endotoxic center of bacterial lipopolysaccharides. Adv. Carbohydr. Chem. Biochem. 1994, 50, 211–276. [Google Scholar] [CrossRef]
- Gozalbes, R.; Brun-Pascaud, M.; Garcia-Domenech, R.; Galvez, J.; Girard, P.M.; Doucet, J.P.; Derouin, F. Prediction of quinolone activity against Mycobacterium avium by molecular topology and virtual computational screening. Antimicrob. Agents Chemother. 2000, 44, 2764–2770. [Google Scholar] [CrossRef]
- Nantasenamat, C.; Isarankura-Na-Ayudhya, C.; Naenna, T.; Prachayasittikul, V. Quantitative structure-imprinting factor relationship of molecularly imprinted polymers. Biosens. Bioelectron. 2007, 22, 3309–3317. [Google Scholar] [CrossRef]
- Nantasenamat, C.; Isarankura-Na-Ayudhya, C.; Naenna, T.; Prachayasittikul, V. Prediction of bond dissociation enthalpy of antioxidant phenols by support vector machine. J. Mol. Graph. Model. 2008, 27, 188–196. [Google Scholar] [CrossRef]
- Nantasenamat, C.; Isarankura-Na-Ayudhya, C.; Tansila, N.; Naenna, T.; Prachayasittikul, V. Prediction of GFP spectral properties using artificial neural network. J. Comput. Chem. 2007, 28, 1275–1289. [Google Scholar] [CrossRef]
- Nantasenamat, C.; Naenna, T.; Isarankura-Na-Ayudhya, C.; Prachayasittikul, V. Quantitative prediction of imprinting factor of molecularly imprinted polymers by artificial neural network. J. Comput. Aid. Mol. Des. 2005, 19, 509–524. [Google Scholar] [CrossRef]
- Nantasenamat, C.; Naenna, T.; Isarankura-Na-Ayudhya, C.; Prachayasittikul, V. Recognition of DNA Splice Junction via Machine Learning Approaches. Excli J. 2005, 4, 114–129. [Google Scholar]
- Nantasenamat, C.; Piacham, T.; Tantimongcolwat, T.; Naenna, T.; Isarankura-Na-Ayudhya, C.; Prachayasittikul, V. QSAR model of the quorum-quenching N-acyl-homoserine lactone lactonase activity. J. Biol. Syst. 2008, 16, 279–293. [Google Scholar] [CrossRef]
- Worachartcheewan, A.; Nantasenamat, C.; Naenna, T.; Isarankura-Na-Ayudhya, C.; Prachayasittikul, V. Modeling the activity of furin inhibitors using artificial neural network. Eur. J. Med. Chem. 2008, 44, 1664–1673. [Google Scholar]
- Burns, M.R.; Wood, S.J.; Miller, K.A.; Nguyen, T.; Cromer, J.R.; David, S.A. Lysine-spermine conjugates: hydrophobic polyamine amides as potent lipopolysaccharide sequestrants. Bioorg. Med. Chem. 2005, 13, 2523–2536. [Google Scholar] [CrossRef]
- Frecer, V.; Ho, B.; Ding, J.L. De Novo Design of Potent Antimicrobial Peptides. Antimicrob. Agents Chemother. 2004, 48, 3349–3357. [Google Scholar] [CrossRef]
- Liu, D.; DeGrado, W.F. De novo design, synthesis, and characterization of antimicrobial beta-peptides. J. Am. Chem. Soc. 2001, 123, 7553–7559. [Google Scholar] [CrossRef]
- Wakefield, D.H.; Klein, J.J.; Wolff, J.A.; Rozema, D.B. Membrane Activity and Transfection Ability of Amphipathic Polycations as a Function of Alkyl Group Size. Bioconjugate Chem. 2005, 16, 1204–1208. [Google Scholar] [CrossRef]
- Burns, M.R.; Jenkins, S.A.; Wood, S.J.; Miller, K.; David, S.A. Structure-activity relationships in lipopolysaccharide neutralizers: design, synthesis, and biological evaluation of a 540-membered amphipathic bisamide library. J. Comb. Chem. 2006, 8, 32–43. [Google Scholar] [CrossRef]
- Zupan, J.; Gasteiger, J. Neural Networks in Chemistry and Drug Design, 2nd ed; Wiley-VCH: Weinheim, Germany, 1999. [Google Scholar]
- Bak, A.; Polanski, J. A 4D-QSAR study on anti-HIV HEPT analogues. Bioorg. Med. Chem. 2006, 14, 273–279. [Google Scholar] [CrossRef]
- Loukas, Y.L. Artificial neural networks in liquid chromatography: efficient and improved quantitative structure-retention relationship models. J. Chromatogr. A 2000, 904, 119–129. [Google Scholar] [CrossRef]
- Zhang, R.; Yan, A.; Liu, M.; Liu, H.; Hu, Z. Application of artificial neural networks for prediction of the retention indices of alkylbenzenes. Chemometr. Intell. Lab. Syst. 1999, 45, 113–120. [Google Scholar] [CrossRef]
- Agatonovic-Kustrin, S.; Zecevic, M.; Zivanovic, L. Use of ANN modelling in structure--retention relationships of diuretics in RP-HPLC. J. Pharm. Biomed. Anal. 1999, 21, 95–103. [Google Scholar] [CrossRef]
- Niculescu, S.P. Artificial neural networks and genetic algorithms in QSAR. J. Mol. Struct. (Theochem) 2003, 622, 71–83. [Google Scholar] [CrossRef]
- NIST/SEMATECH. E-Handbook of Statistical Methods. Available online: http://www.itl.nist.gov/div898/ handbook/.
- Miller, K.A.; Suresh Kumar, E.V.; Wood, S.J.; Cromer, J.R.; Datta, A.; David, S.A. Lipopolysaccharide sequestrants: structural correlates of activity and toxicity in novel acylhomospermines. J. Med. Chem. 2005, 48, 2589–2599. [Google Scholar] [CrossRef]
- MarvinSketch, Version 5.2. ChemAxon: Budapest, Hungary. Available online: http://www.chemaxon.com/product/msketch.html.
- RECON. Version 5.5. Rensselaer Polytechnic Institute: Troy, New York, U.S.A. Available online: http://www.drugmining.com/files/RECON/recondoc/WinRecon.html.
- Krasowski, M.D.; Hong, X.; Hopfinger, A.J.; Harrison, N.L. 4D-QSAR analysis of a set of propofol analogues: mapping binding sites for an anesthetic phenol on the GABA(A) receptor. J. Med. Chem. 2002, 45, 3210–3221. [Google Scholar] [CrossRef]
- Whitley, D.C.; Ford, M.G.; Livingstone, D.J. Unsupervised forward selection: a method for eliminating redundant variables. J. Chem. Inf. Comput. Sci. 2000, 40, 1160–1168. [Google Scholar] [CrossRef]
- Witten, I.; Frank, E. Data Mining: Practical Machine Learning Tools and Techniques with Java Implementations; Morgan Kaufmann: San Francisco, CA, USA, 2000. [Google Scholar]
© 2009 by the authors; licensee Molecular Diversity Preservation International, Basel, Switzerland. This article is an open-access article distributed under the terms and conditions of the Creative Commons Attribution license ( http://creativecommons.org/licenses/by/3.0/).
Share and Cite
Thippakorn, C.; Suksrichavalit, T.; Nantasenamat, C.; Tantimongcolwat, T.; Isarankura-Na-Ayudhya, C.; Naenna, T.; Prachayasittikul, V. Modeling the LPS Neutralization Activity of Anti-Endotoxins. Molecules 2009, 14, 1869-1888. https://doi.org/10.3390/molecules14051869
Thippakorn C, Suksrichavalit T, Nantasenamat C, Tantimongcolwat T, Isarankura-Na-Ayudhya C, Naenna T, Prachayasittikul V. Modeling the LPS Neutralization Activity of Anti-Endotoxins. Molecules. 2009; 14(5):1869-1888. https://doi.org/10.3390/molecules14051869
Chicago/Turabian StyleThippakorn, Chadinee, Thummaruk Suksrichavalit, Chanin Nantasenamat, Tanawut Tantimongcolwat, Chartchalerm Isarankura-Na-Ayudhya, Thanakorn Naenna, and Virapong Prachayasittikul. 2009. "Modeling the LPS Neutralization Activity of Anti-Endotoxins" Molecules 14, no. 5: 1869-1888. https://doi.org/10.3390/molecules14051869
APA StyleThippakorn, C., Suksrichavalit, T., Nantasenamat, C., Tantimongcolwat, T., Isarankura-Na-Ayudhya, C., Naenna, T., & Prachayasittikul, V. (2009). Modeling the LPS Neutralization Activity of Anti-Endotoxins. Molecules, 14(5), 1869-1888. https://doi.org/10.3390/molecules14051869