Phytohormones as Important Biologically Active Molecules – Their Simple Simultaneous Detection


Abstract
:Introduction
Results and Discussion
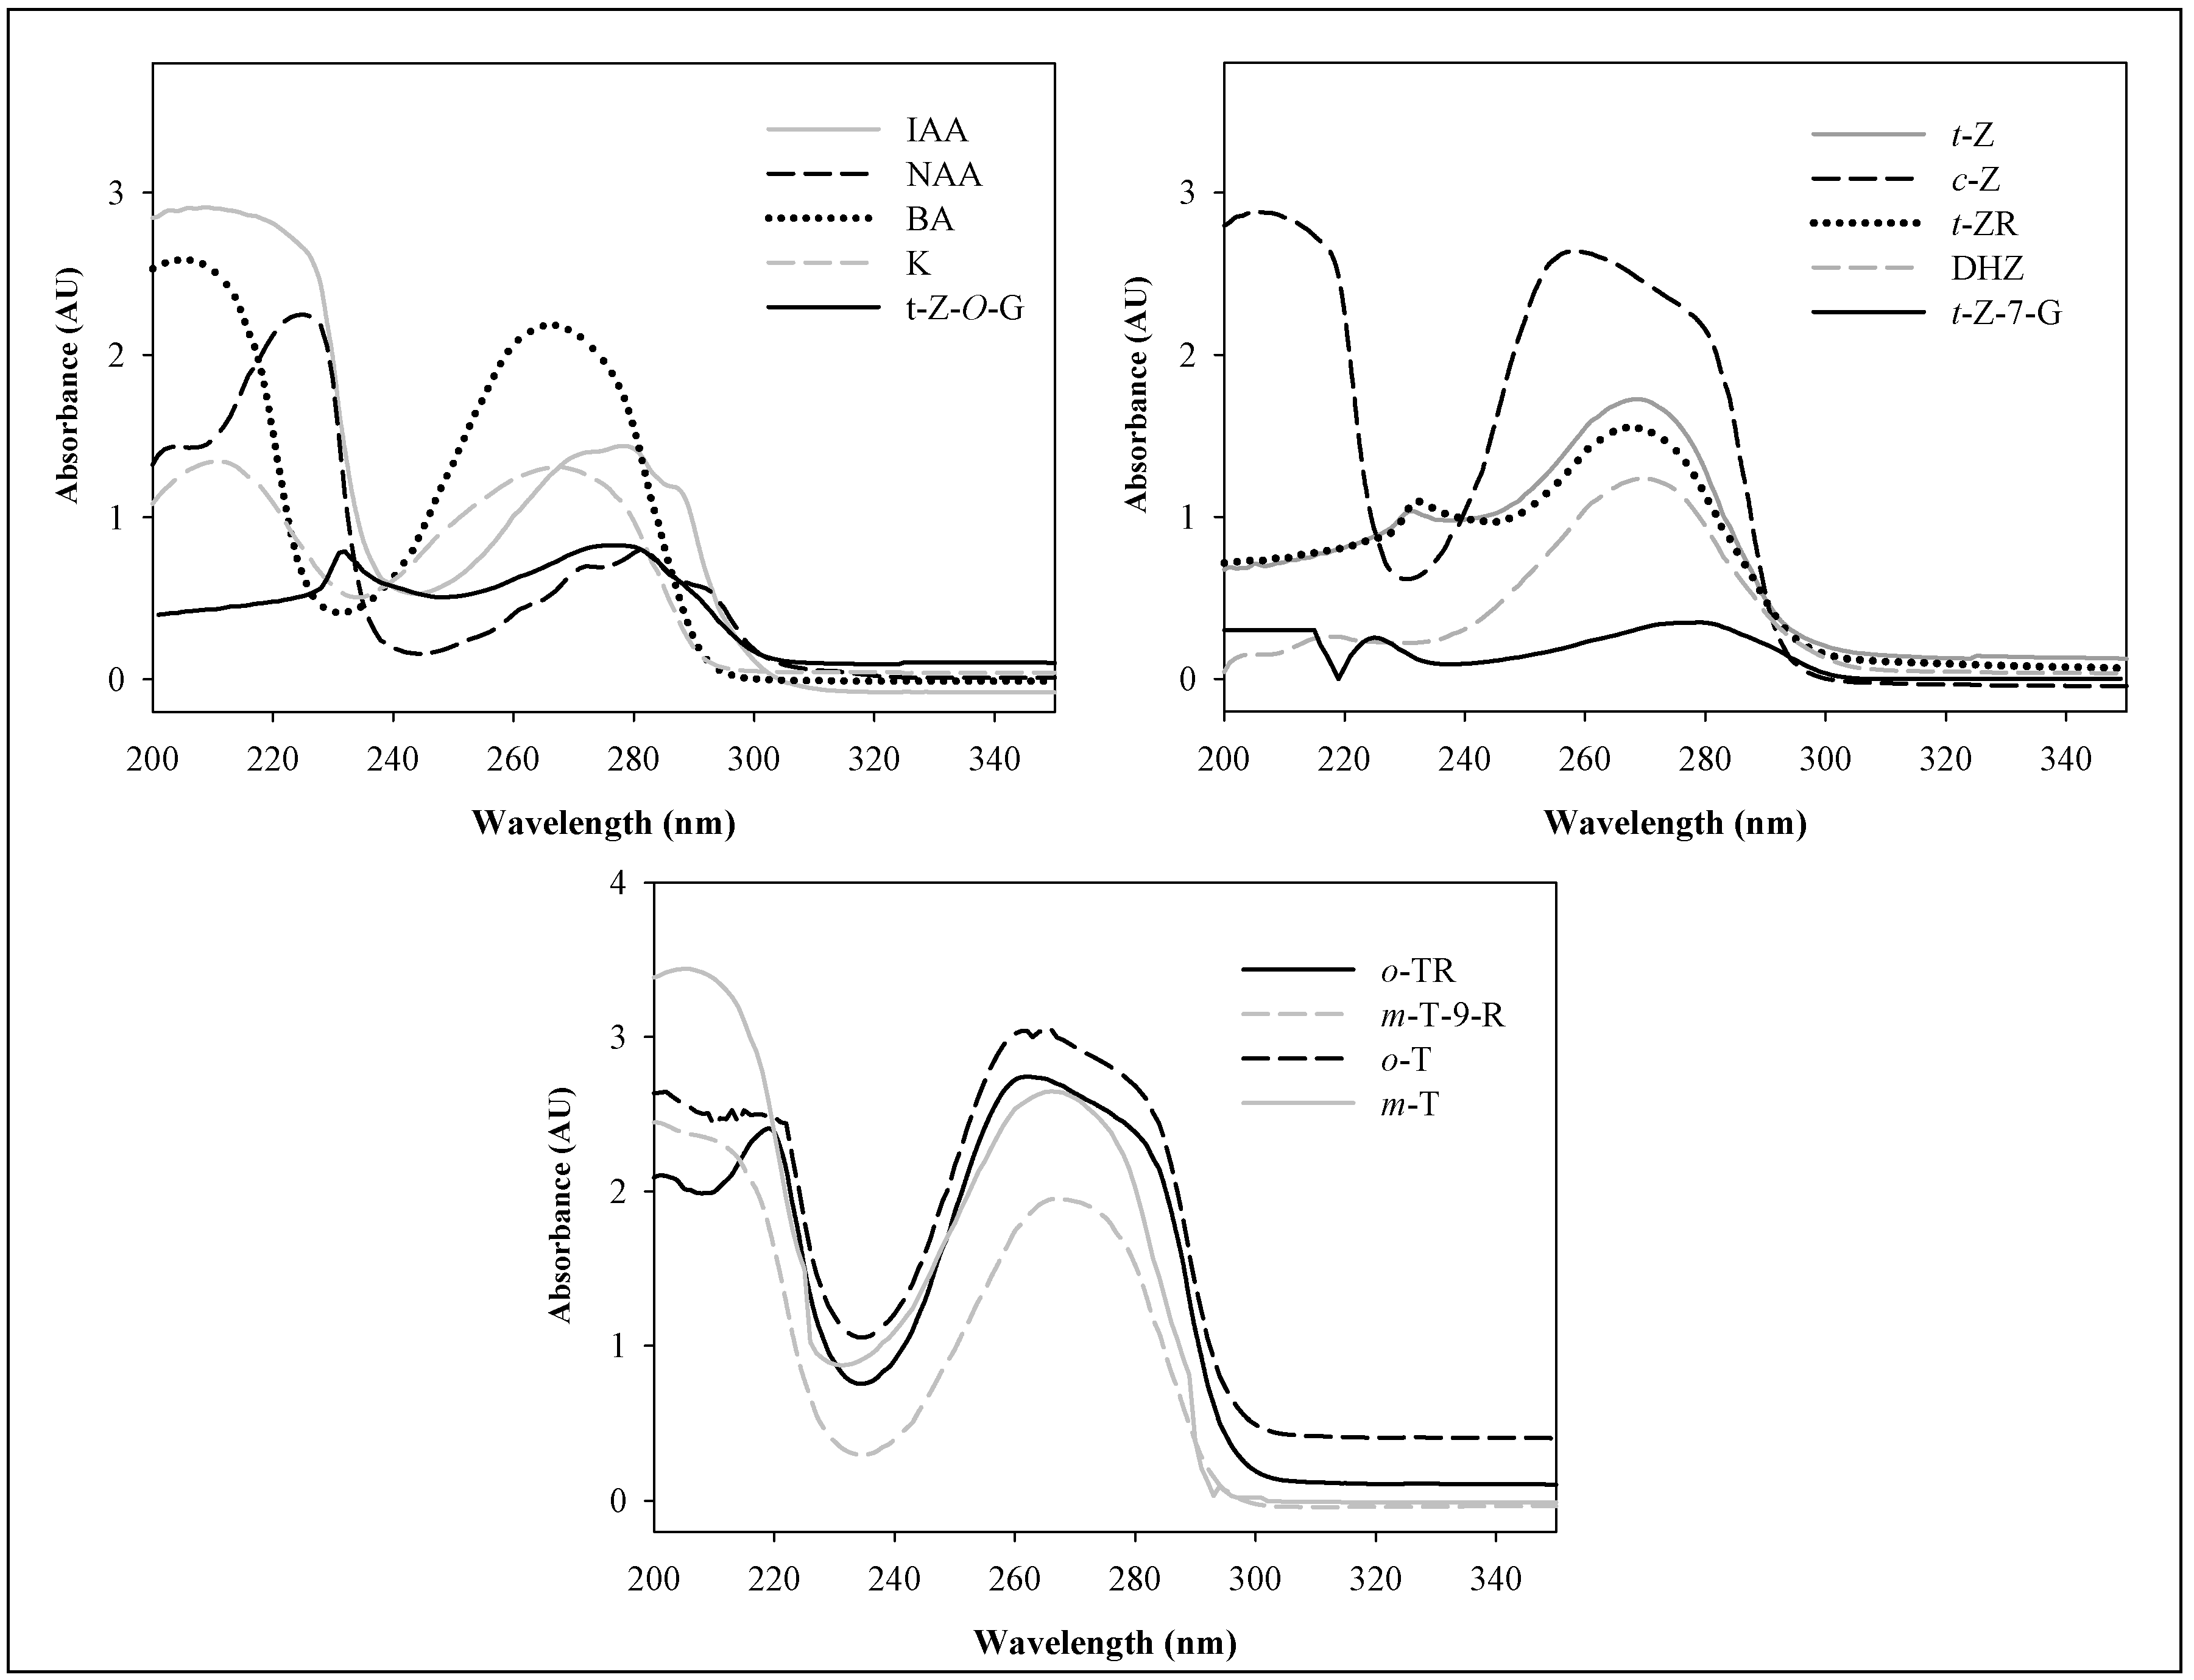
Wavelength
Column
Temperature
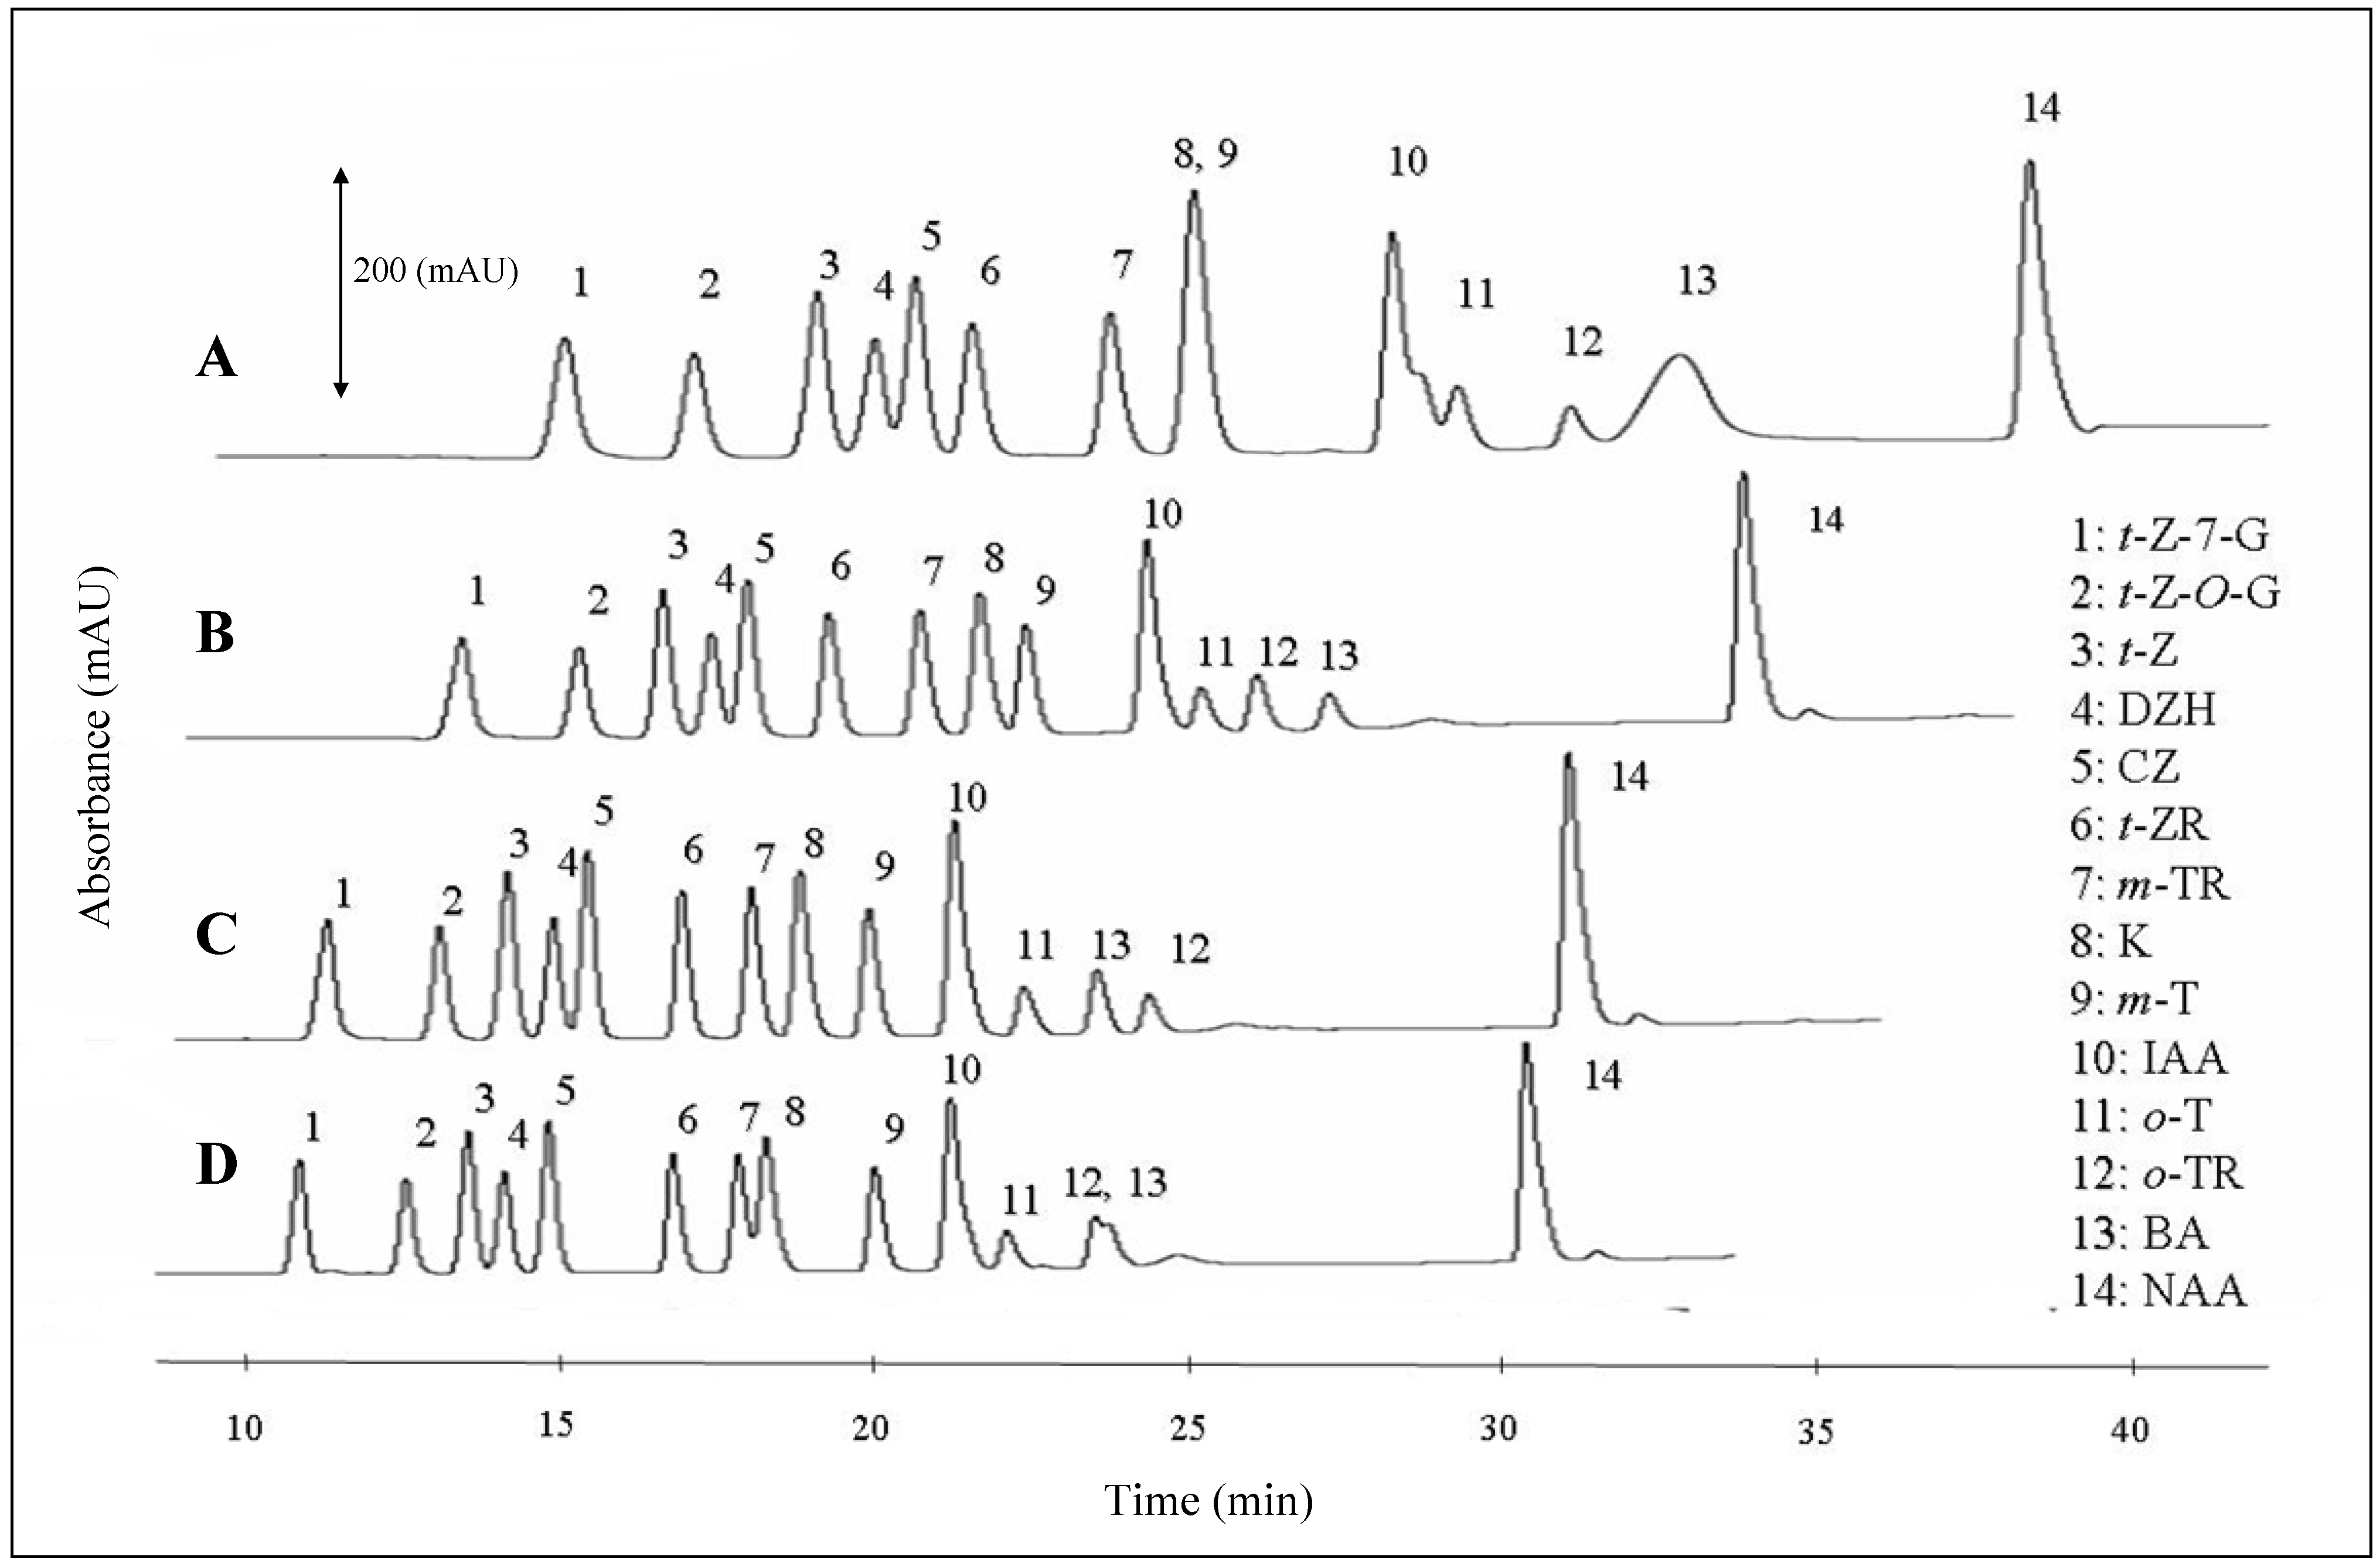
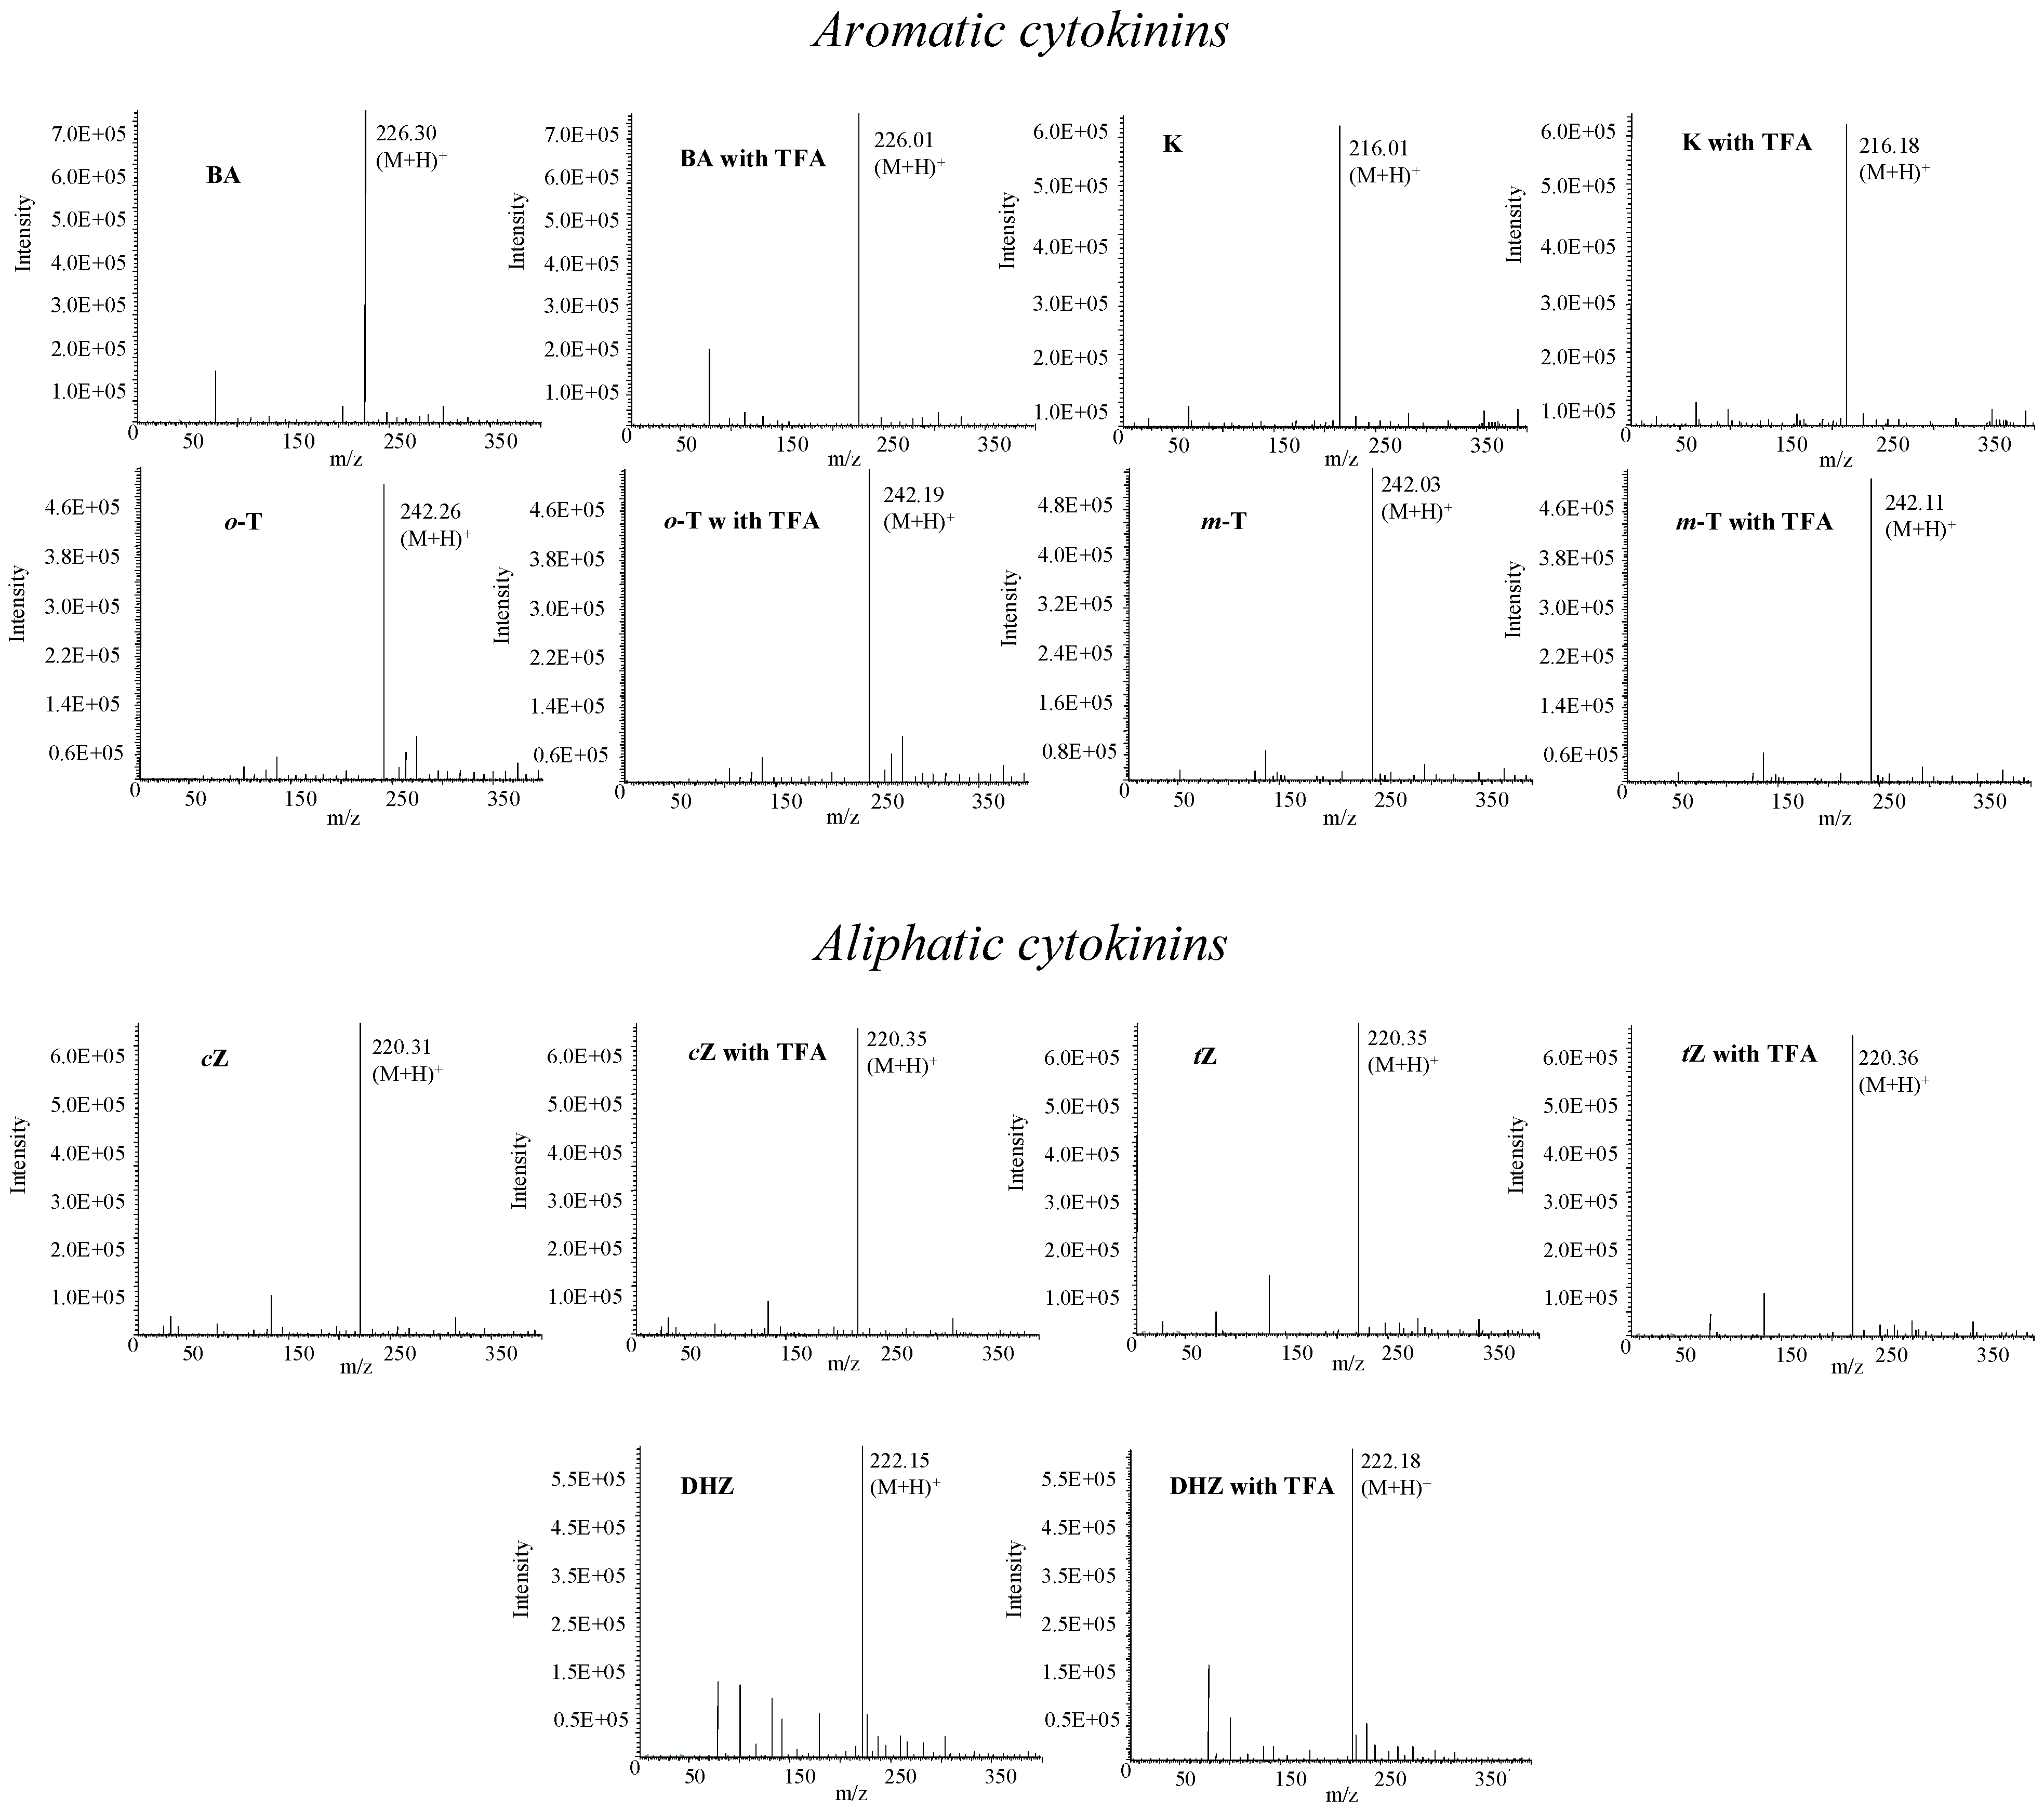
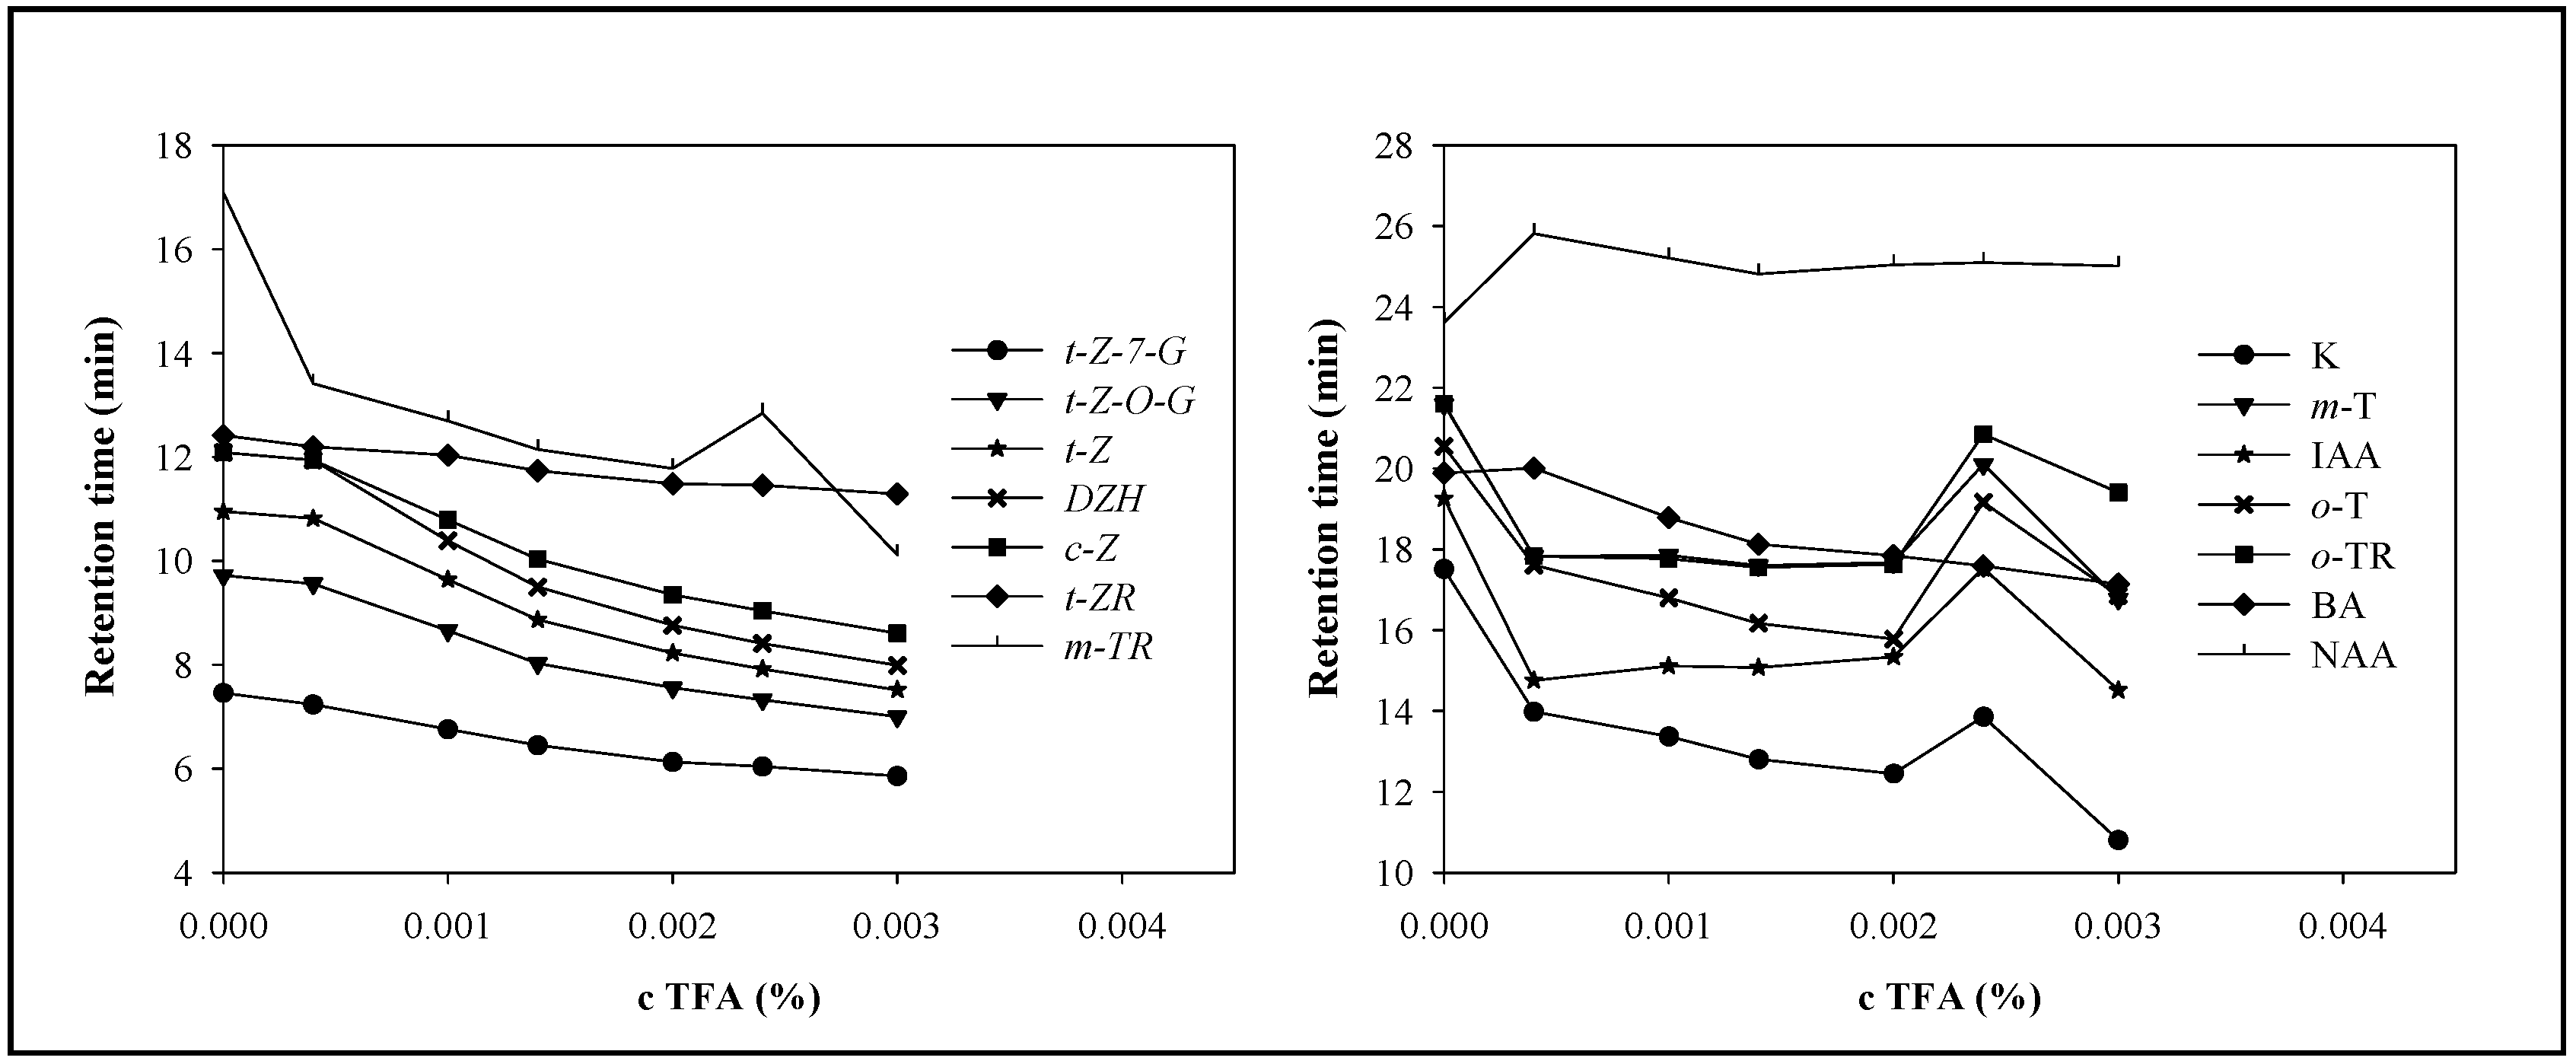
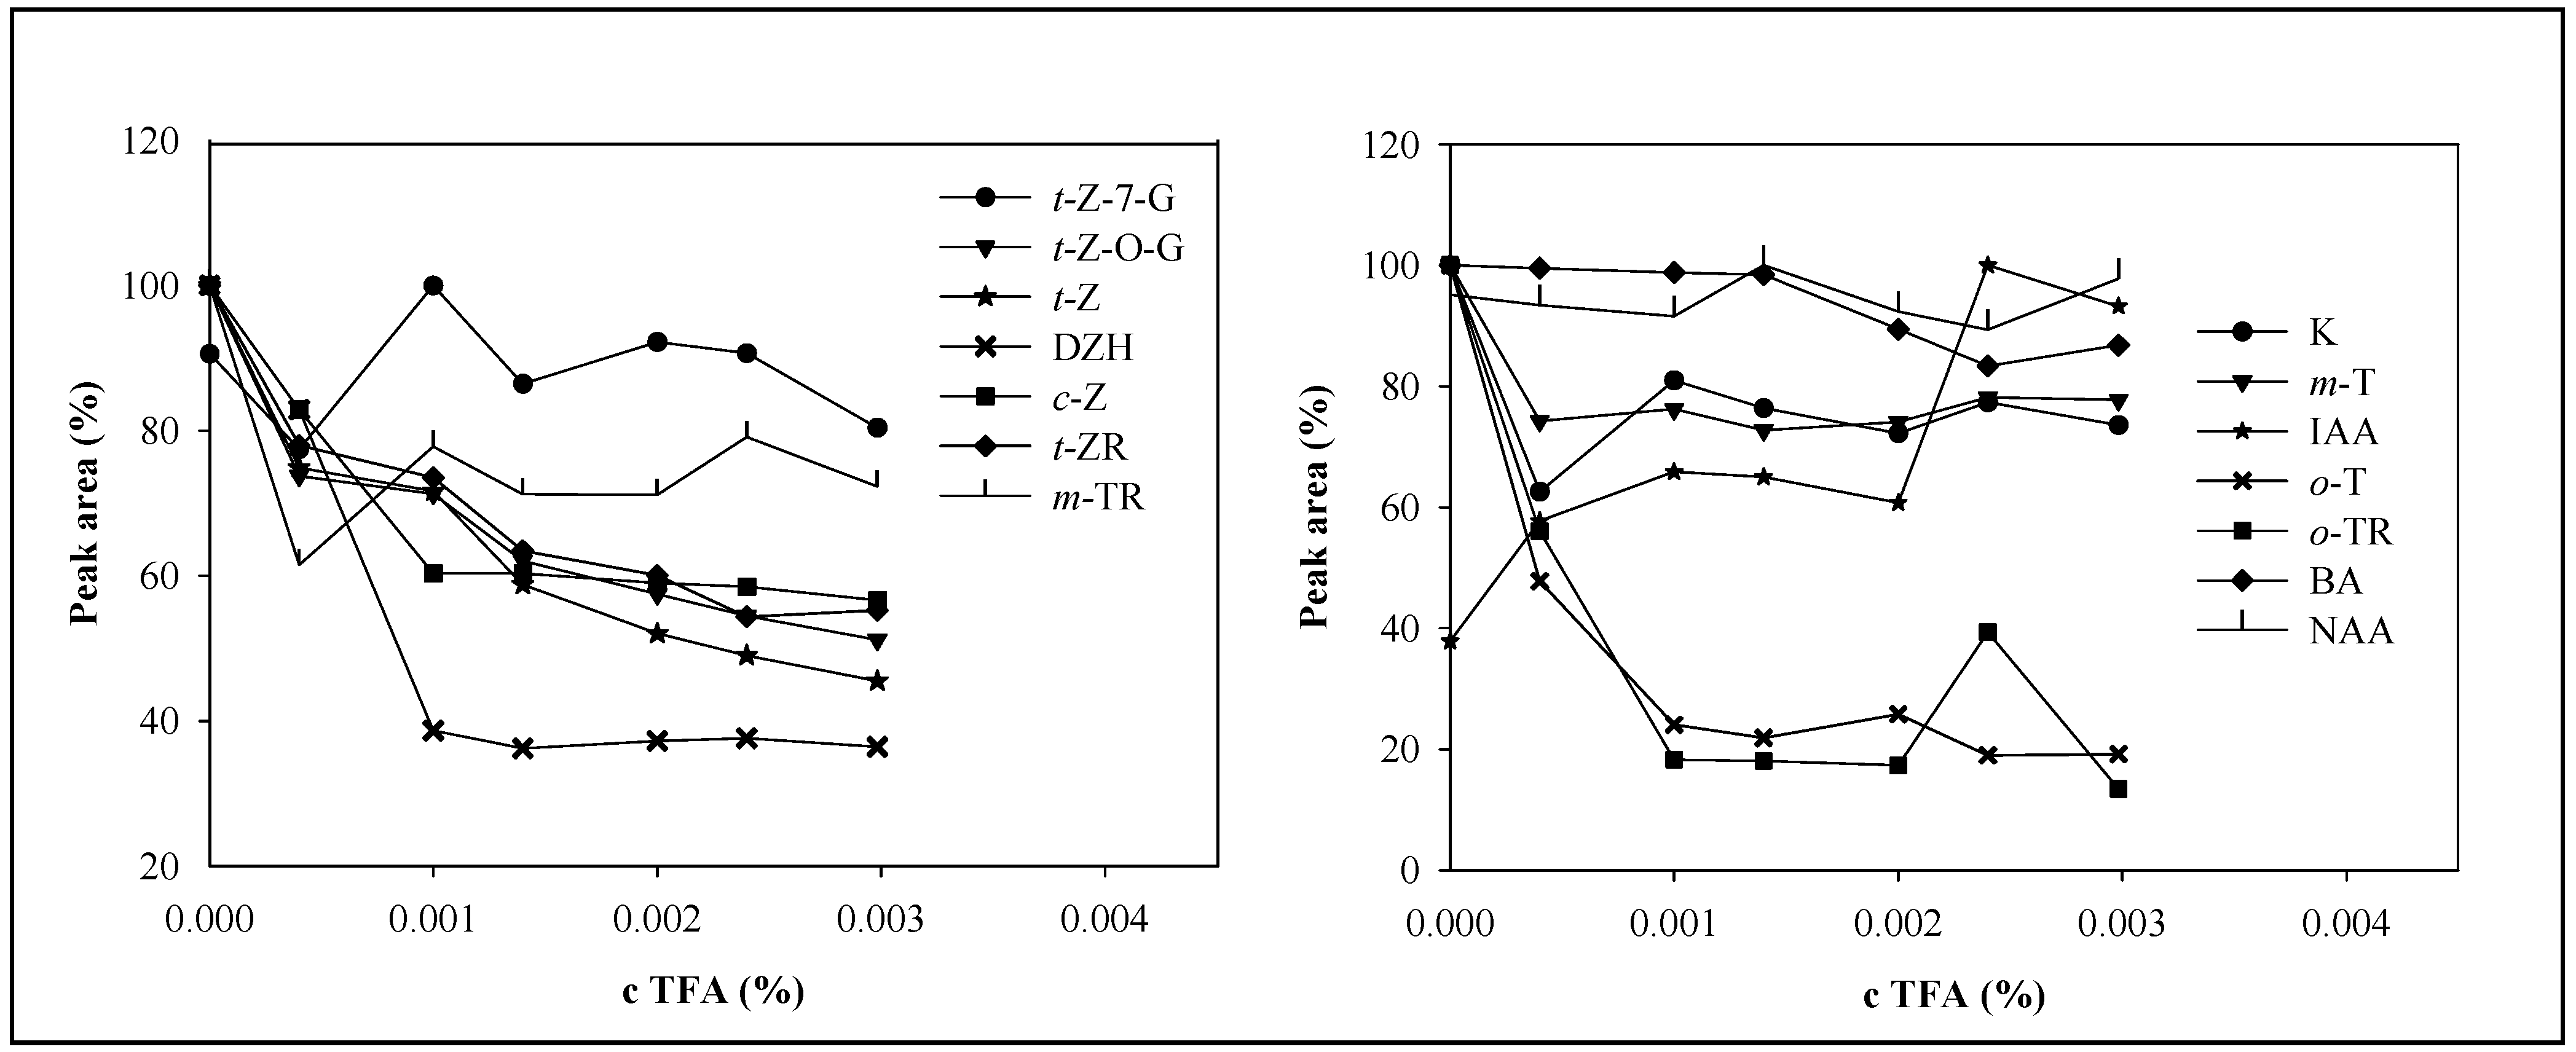
Mobile phase and the effect of trifluoroacetic acid
Gradient profile and flow rate optimisation
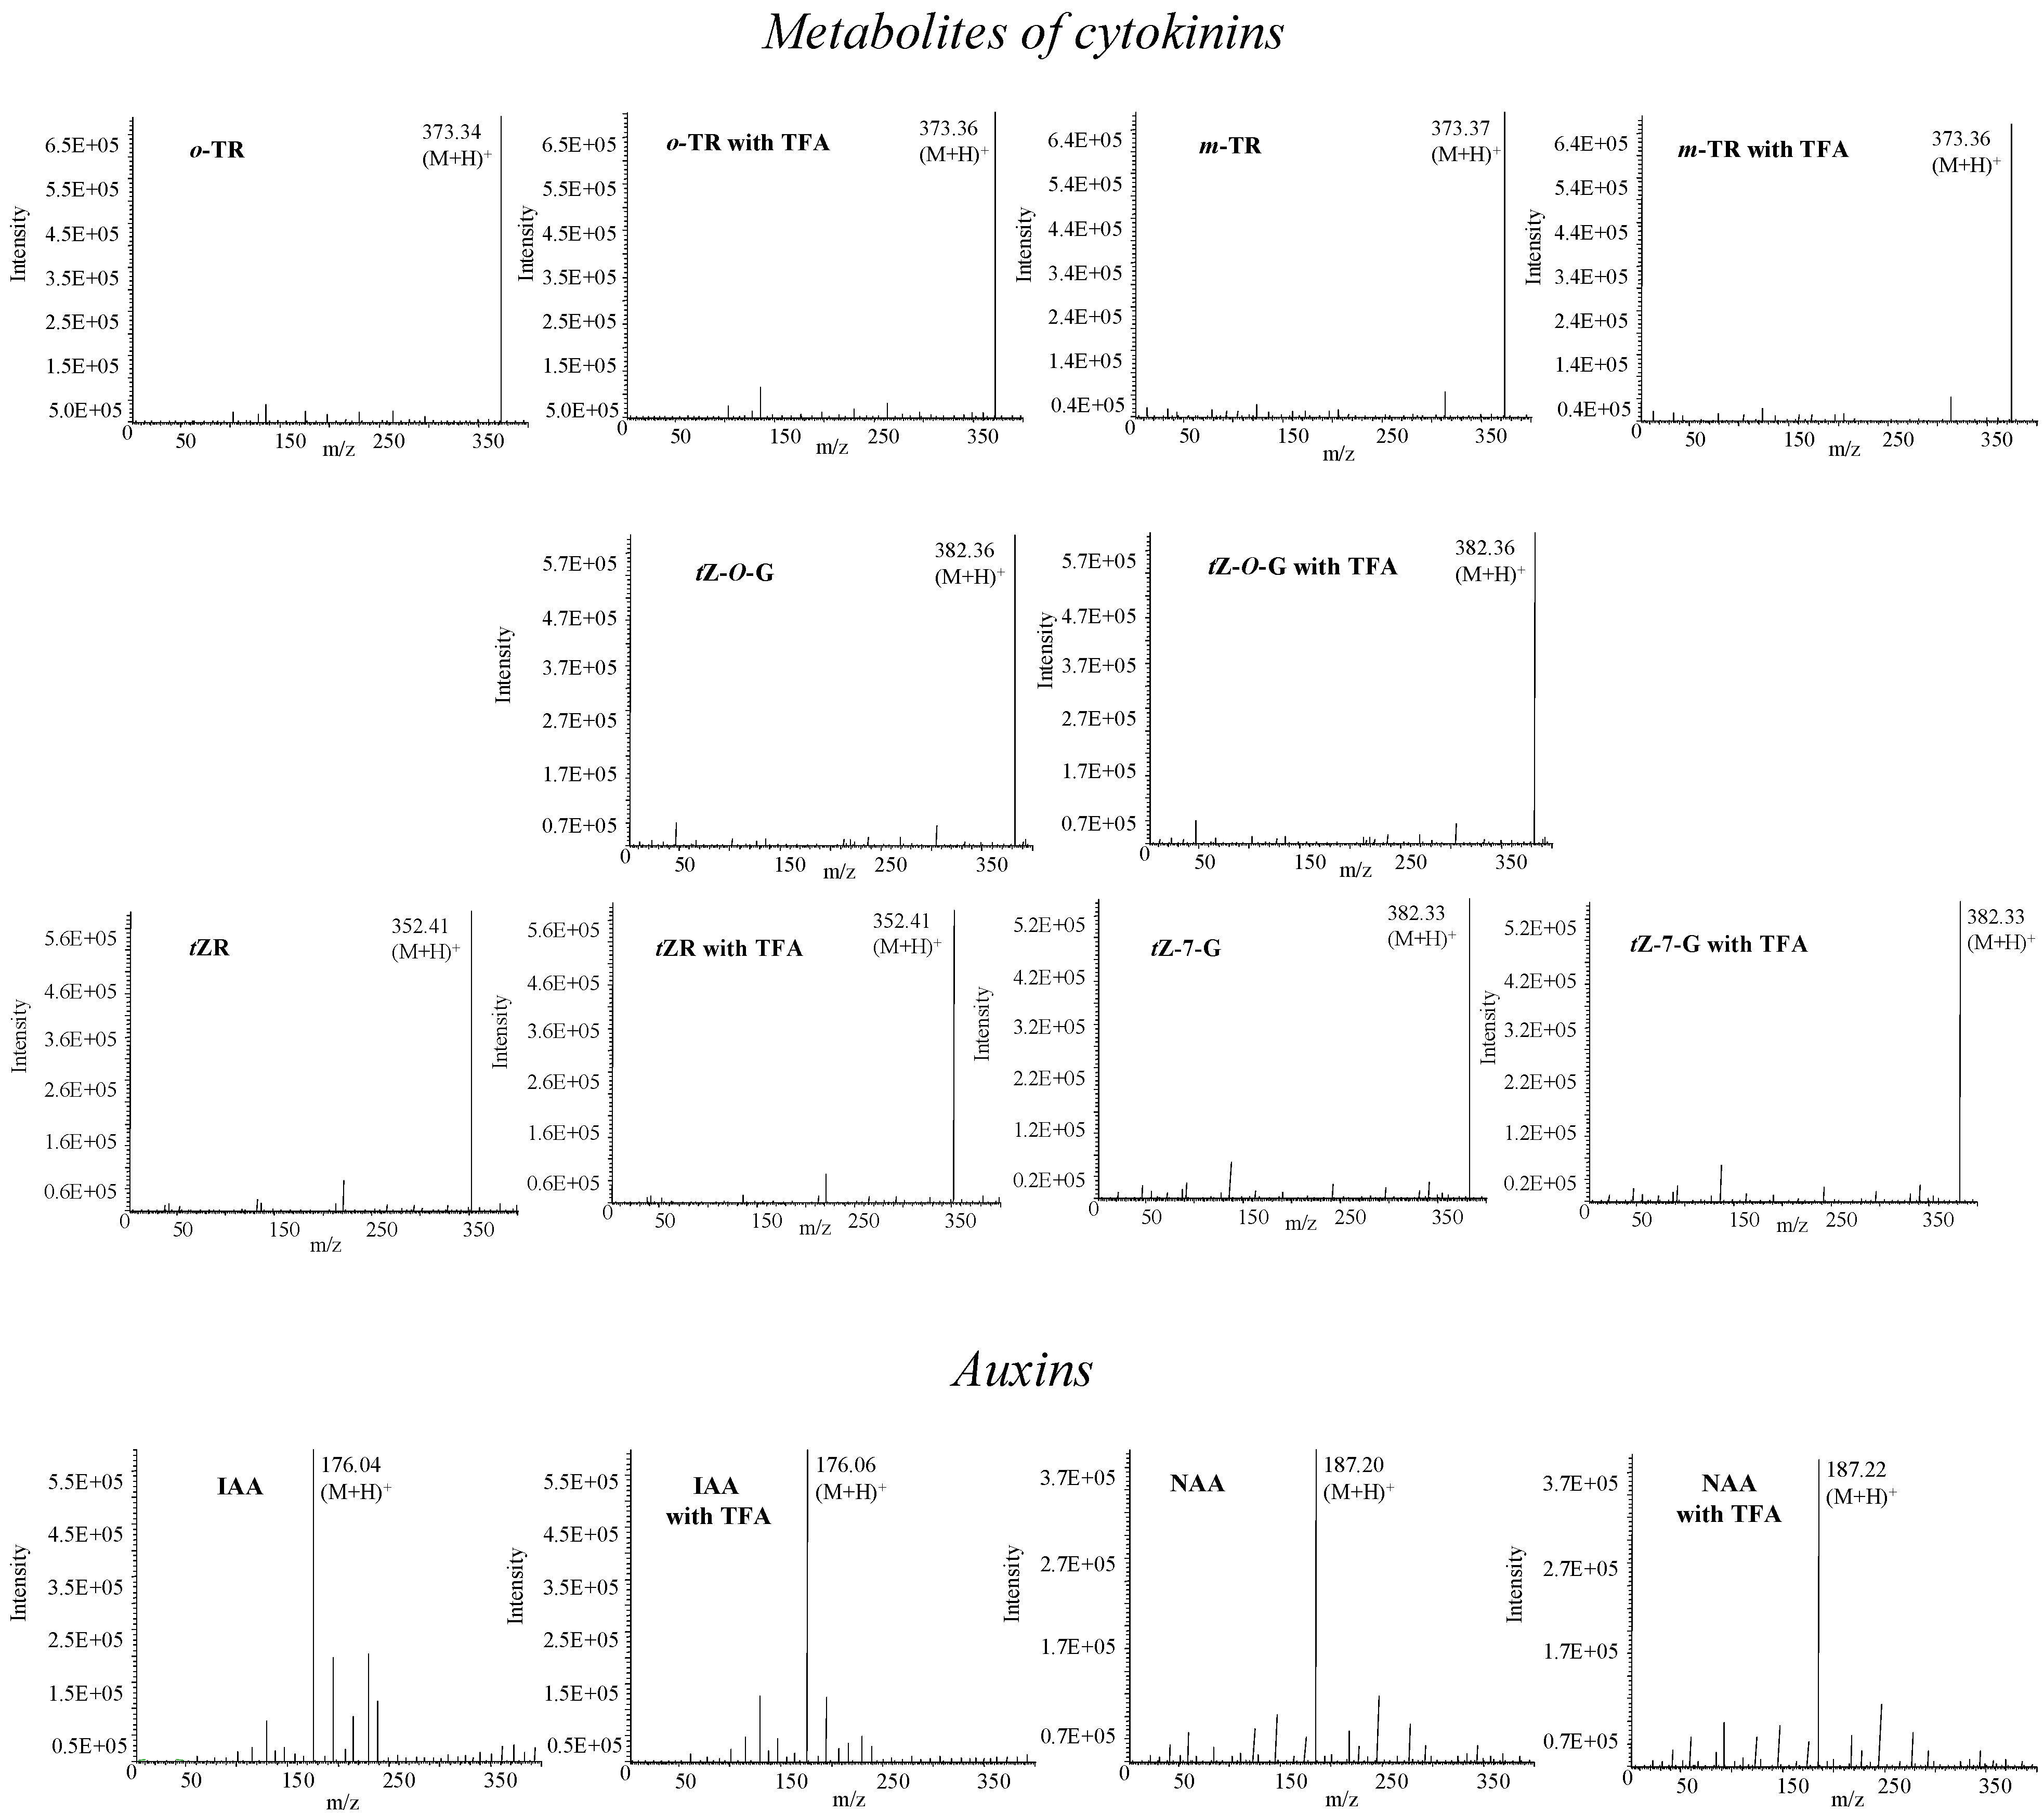
Mass spectrometry of phytohormones
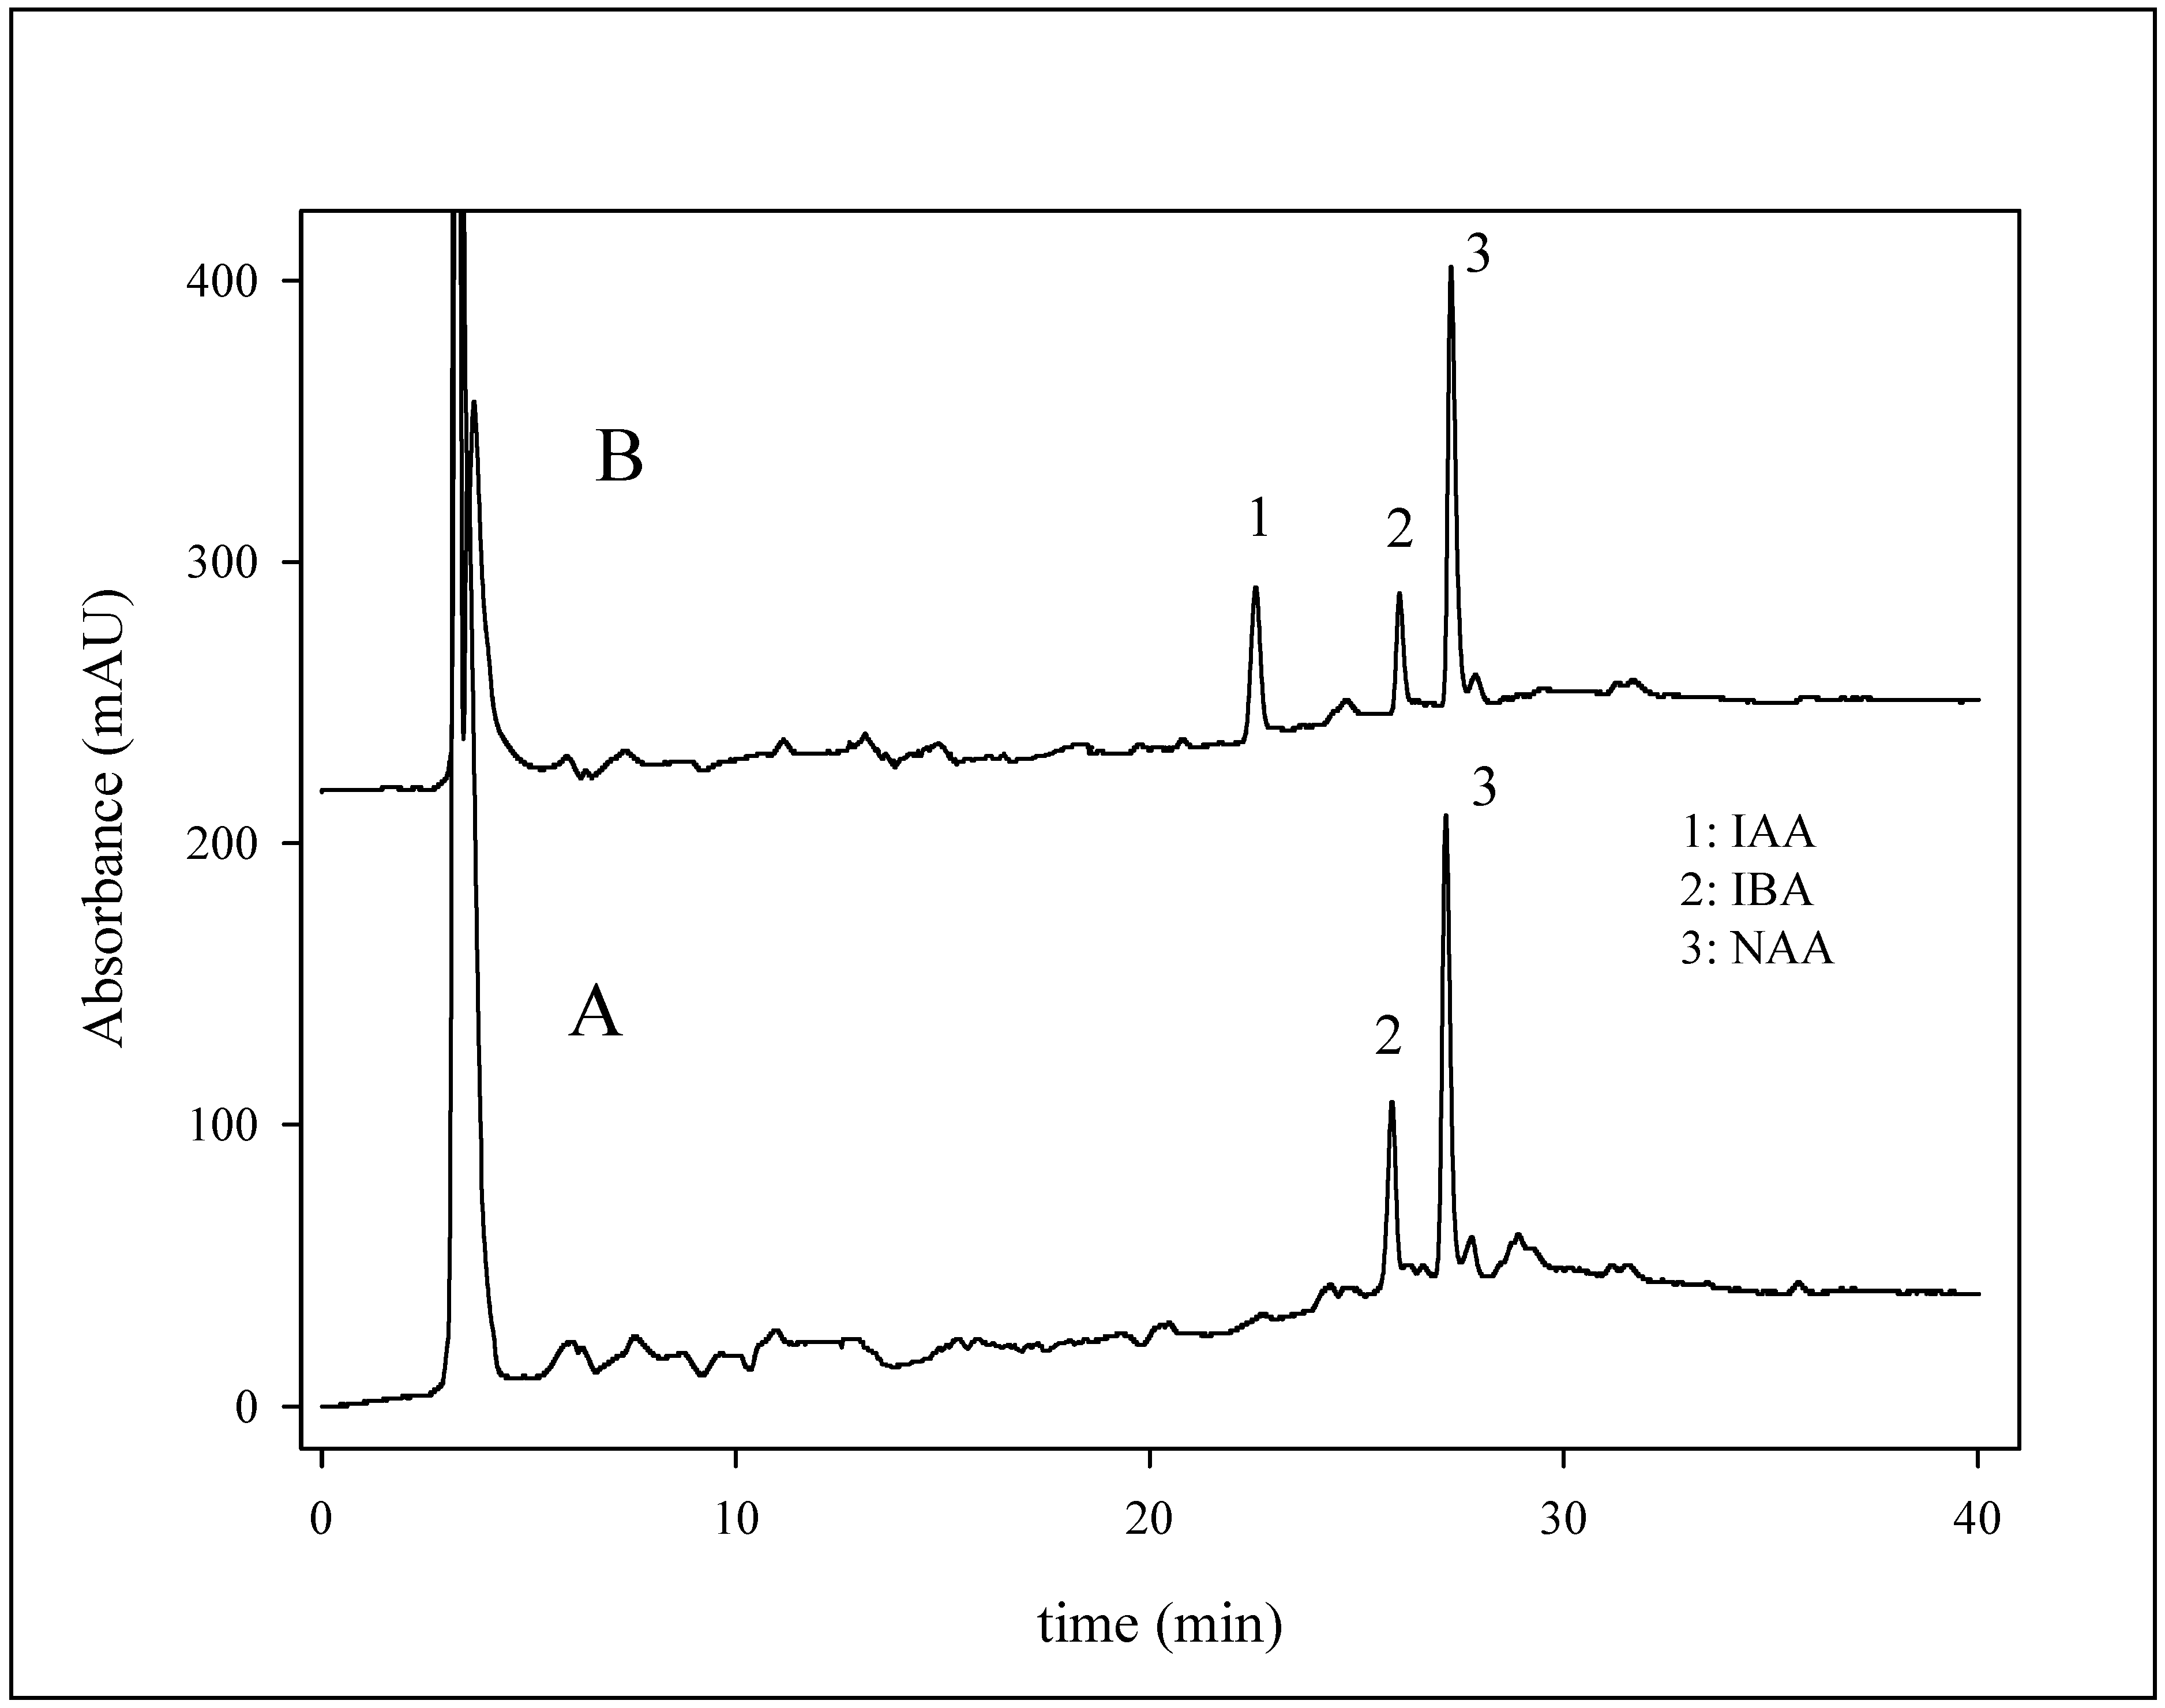
Determination of phytohormones in growth stimulator
Experimental
Chemicals
High performance liquid chromatography with UV-VIS/MS detection (HPLC/UV/VIS/MS)
Plants
Sample preparation
Descriptive statistics
Acknowledgements
References and Notes
- Swarup, K.; Benkova, E.; Swarup, R.; Casimiro, I.; Peret, B.; Yang, Y.; Parry, G.; Nielsen, E.; De Smet, I.; Vanneste, S.; Levesque, M.P.; Carrier, D.; James, N.; Calvo, V.; Ljung, K.; Kramer, E.; Roberts, R.; Graham, N.; Marillonnet, S.; Patel, K.; Jones, J.D.G.; Taylor, C.G.; Schachtman, D.P.; May, S.; Sandberg, G.; Benfey, P.; Friml, J.; Kerr, I.; Beeckman, T.; Laplaze, L.; Bennett, M.J. The auxin influx carrier LAX3 promotes lateral root emergence. Nat. Cell Biol. 2008, 10, 946–954. [Google Scholar] [CrossRef] [PubMed]
- Dhonukshe, P.; Tanaka, H.; Goh, T.; Ebine, K.; Mahonen, A.P.; Prasad, K.; Blilou, I.; Geldner, N.; Xu, J.; Uemura, T.; Chory, J.; Ueda, T.; Nakano, A.; Scheres, B.; Friml, J. Generation of cell polarity in plants links endocytosis, auxin distribution and cell fate decisions. Nature 2008, 456, 962–975. [Google Scholar] [CrossRef] [PubMed]
- De Smet, I.; Vassileva, V.; De Rybel, B.; Levesque, M.P.; Grunewald, W.; Van Damme, D.; Van Noorden, G.; Naudts, M.; Van Isterdael, G.; De Clercq, R.; Wang, J.Y.; Meuli, N.; Vanneste, S.; Friml, J.; Hilson, P.; Jurgens, G.; Ingram, G.C.; Inze, D.; Benfey, P.N.; Beeckman, T. Receptor-like kinase ACR4 restricts formative cell divisions in the Arabidopsis root. Science 2008, 322, 594–597. [Google Scholar] [CrossRef] [PubMed]
- Barendse, G.W.M.; Peeters, T.J.M. Multiple hormonal-control in plants. Acta Bot. Neerl. 1995, 44, 3–17. [Google Scholar] [CrossRef]
- Weyers, J.D.B.; Paterson, N.W. Plant hormones and the control of physiological processes. New Phytol. 2001, 152, 375–407. [Google Scholar] [CrossRef]
- Sakakibara, H. Cytokinins: Activity, biosynthesis, and translocation. Annu. Rev. Plant Biol. 2006, 57, 431–449. [Google Scholar] [CrossRef] [PubMed]
- Tarkowski, P.; Dolezal, K.; Strnad, M. Analytical methods in cytokinin research. Chem. Listy. 2004, 98, 834–841. [Google Scholar]
- Karadeniz, A.; Topcuoglu, S.F.; Inan, S. Auxin, gibberellin, cytokinin and abscisic acid production in some bacteria. World J. Microbiol. Biotechnol. 2006, 22, 1061–1064. [Google Scholar] [CrossRef]
- Tuomi, T.; Rosenqvist, H. Detection of abscisic, gibberellic and indole-3-acetic-acid from plants and microbes. Plant Physiol. Biochem. 1995, 33, 725–734. [Google Scholar]
- Gomez-Cadenas, A.; Pozo, O.J.; Garcia-Augustin, P.; Sancho, J.V. Direct analysis of abscisic acid in crude plant extracts by liquid chromatography-electrospray/tandem mass spectrometry. Phytochem. Anal. 2002, 13, 228–234. [Google Scholar] [CrossRef] [PubMed]
- Prinsen, E.; Redig, P.; Vandongen, W.; Esmans, E.L.; Vanonckelen, H.A. Quantitative-analysis of cytokinins by electrospray tandem mass-spectrometry. Rapid Commun. Mass Spectrom. 1995, 9, 948–953. [Google Scholar] [CrossRef]
- Ge, L.; Yong, J.W.H.; Goh, N.K.; Chia, L.S.; Tan, S.N.; Ong, E.S. Identification of kinetin and kinetin riboside in coconut (Cocos nucifera L.) water using a combined approach of liquid chromatography-tandem mass spectrometry, high performance liquid chromatography and capillary electrophoresis. J. Chromatogr. B. 2005, 829, 26–34. [Google Scholar] [CrossRef] [PubMed]
- Hahn, H. High-performance liquid-chromatography and its use in cytokinin determination in Agrobacterium-tumefaciens B6. Plant Cell Physiol. 1976, 17, 1053–1058. [Google Scholar]
- Lebuhn, M.; Hartmann, A. Method for the determination of indole-3-acetic-acid and related-compounds of L-tryptophan catabolism in soils. J. Chromatogr. 1993, 629, 255–266. [Google Scholar] [CrossRef]
- Nordstrom, A.; Tarkowski, P.; Tarkowska, D.; Dolezal, K.; Astot, C.; Sandberg, G.; Moritz, T. Derivatization for LC electrospray ionization-MS: A tool for improving reversed-phase separation and ESI responses of bases, ribosides, and intact nucleotides. Anal. Chem. 2004, 76, 2869–2877. [Google Scholar] [CrossRef] [PubMed]
- Hernandez, P.; Paton, F.; Hernandez, L. Voltammetric study of kinetin in a carbon fiber microelectrode. Determination by adsorptive stripping in apple extracts. Electroanalysis 1997, 9, 1372–1374. [Google Scholar] [CrossRef]
- Novak, O.; Tarkowski, P.; Tarkowska, D.; Dolezal, K.; Lenobel, R.; Strnad, M. Quantitative analysis of cytokinins in plants by liquid chromatography-single-quadrupole mass spectrometry. Anal. Chim. Acta 2003, 480, 207–218. [Google Scholar] [CrossRef]
- Chiwocha, S.; Rouault, G.; Abrams, S.; von Aderkas, P. Parasitism of seed of Douglas fir (Pseudotsuga menziesii) by the seed chalcid, Megastigmus spermotrophus, and its influence on seed hormone physiology. Sex. Plant Reprod. 2007, 20, 19–25. [Google Scholar] [CrossRef]
- Chiwocha, S.D.S.; Abrams, S.R.; Ambrose, S.J.; Cutler, A.J.; Loewen, M.; Ross, A.R.S.; Kermode, A.R. A method for profiling classes of plant hormones and their metabolites using liquid chromatography-electrospray ionization tandem mass spectrometry: an analysis of hormone regulation of thermodormancy of lettuce (Lactuca sativa L.) seeds. Plant J. 2003, 35, 405–417. [Google Scholar] [CrossRef] [PubMed]
- Chiwocha, S.D.S.; Cutler, A.J.; Abrams, S.R.; Ambrose, S.J.; Yang, J.; Ross, A.R.S.; Kermode, A.R. The etr1-2 mutation in Arabidopsis thaliana affects the abscisic acid, auxin, cytokinin and gibberellin metabolic pathways during maintenance of seed dormancy, moist-chilling and germination. Plant J. 2005, 42, 35–48. [Google Scholar] [CrossRef] [PubMed]
- Ge, L.Y.; Tan, S.; Yong, J.W.H.; Tan, S.N. CE for cytokinin analyses: A review. Electrophoresis 2006, 27, 4779–4791. [Google Scholar] [CrossRef] [PubMed]
- Zheng, B.; Yang, H.X.; He, J.L. Quantitative analysis of plant hormones with capillary electrophoresis. Chin. J. Anal. Chem. 1999, 27, 704–707. [Google Scholar]
- Liu, J.; Li, S.F.Y. Separation and determination of auxins by capillary electrophoresis. J. Liq. Chromatogr. Relat. Technol. 1996, 19, 1697–1713. [Google Scholar] [CrossRef]
- Olsson, J.C.; Andersson, P.E.; Karlberg, B.; Nordstrom, A.C. Determination of plant indoles by capillary electrophoresis with amperometric detection. J. Chromatogr. A. 1996, 755, 289–298. [Google Scholar] [CrossRef]
- Hoyerova, K.; Gaudinova, A.; Malbeck, J.; Dobrev, P.I.; Kocabek, T.; Solcova, B.; Travnickova, A.; Kaminek, M. Efficiency of different methods of extraction and purification of cytokinins. Phytochemistry 2006, 67, 1151–1159. [Google Scholar] [CrossRef] [PubMed]
- Lopez-Carbonell, M.; Gabasa, M.; Jáuregui, O. Enhanced determination of abscisic acid (ABA) and abscisic acid glucose ester (ABA-GE) in Cistus albidus plants by liquid chromatography-mass spectrometry in tandem mode. Plant Physiol. Biochem. 2009, 47, 256–261. [Google Scholar] [CrossRef] [PubMed]
- Owen, S.J.; Abrams, S.R. Measurement of plant hormones by liquid chromatography-mass spectrometry. Methods Mol. Biol. 2009, 495, 39–51. [Google Scholar] [PubMed]
- Gazdik, Z.; Reznicek, V.; Adam, V.; Zitka, O.; Jurikova, T.; Krska, B.; Matuskovic, J.; Plsek, J.; Saloun, J.; Horna, A.; Kizek, R. Use of liquid chromatography with electrochemical detection for the determination of antioxidants in less common fruits. Molecules 2008, 13, 2823–2836. [Google Scholar] [CrossRef] [PubMed]
- Petrlova, J.; Mikelova, R.; Stejskal, K.; Kleckerova, A.; Zitka, O.; Petrek, J.; Havel, L.; Zehnalek, J.; Adam, V.; Trnkova, L.; Kizek, R. Simultaneous determination of eight biologically active thiol compounds using gradient elution-liquid chromatography with Coul-Array detection. J. Sep. Sci. 2005, 29, 1166–1173. [Google Scholar] [CrossRef]
- Potesil, D.; Petrlova, J.; Adam, V.; Vacek, J.; Klejdus, B.; Zehnalek, J.; Trnkova, L.; Havel, L.; Kizek, R. Simultaneous femtomole determination of cysteine, reduced and oxidized glutathione, and phytochelatin in maize (Zea mays L.) kernels using high-performance liquid chromatography with electrochemical detection. J. Chromatogr. A. 2004, 1084, 134–144. [Google Scholar] [CrossRef]
- Klejdus, B.; Petrlova, J.; Potesil, D.; Adam, V.; Mikelova, R.; Vacek, J.; Kizek, R.; Kuban, V. Simultaneous determination of water- and fat-soluble vitamins in pharmaceutical preparations by high-performance liquid chromatography coupled with diode array detection. Anal. Chim. Acta. 2003, 520, 57–67. [Google Scholar] [CrossRef]
- Klejdus, B.; Vacek, J.; Adam, V.; Zehnalek, J.; Kizek, R.; Trnkova, L.; Kuban, V. Determination of isoflavones in soybean food and human urine using liquid chromatography with electrochemical detection. J. Chromatogr. B. 2004, 806, 101–111. [Google Scholar] [CrossRef] [PubMed]
- Grill, E.; Winnacker, E.L.; Zenk, M.H. Phytochelatins - the principal heavy-metal complexing peptides of higher-plants. Science 1985, 230, 674–676. [Google Scholar] [CrossRef] [PubMed]
- Zenk, M.H. Heavy metal detoxification in higher plants - A review. Gene. 1995, 179, 21–30. [Google Scholar] [CrossRef]
- Cobbett, C.; Goldsbrough, P. Phytochelatins and metallothioneins: Roles in heavy metal detoxification and homeostasis. Annu. Rev. Plant Biol. 2002, 53, 159–182. [Google Scholar] [CrossRef] [PubMed]
- Hall, J.L. Cellular mechanisms for heavy metal detoxification and tolerance. J. Exp. Bot. 2002, 53, 1–11. [Google Scholar] [CrossRef] [PubMed]
- Babula, P.; Adam, V.; Opatrilova, R.; Zehnalek, J.; Havel, L.; Kizek, R. Uncommon heavy metals, metalloids and their plant toxicity: a review. Environ. Chem. Lett. 2008, 6, 189–213. [Google Scholar] [CrossRef]
- Diopan, V.; Shestivska, V.; Adam, V.; Macek, T.; Mackova, M.; Havel, L.; Kizek, R. Determination of content of metallothionein and low molecular mass stress peptides in transgenic tobacco plants. Plant Cell Tissue Organ Cult. 2007, 94, 291–298. [Google Scholar] [CrossRef]
- Supalkova, V.; Huska, D.; Diopan, V.; Hanustiak, P.; Zitka, O.; Stejskal, K.; Baloun, J.; Pikula, J.; Havel, L.; Zehnalek, J.; Adam, V.; Trnkova, L.; Beklova, M.; Kizek, R. Electroanalysis of plant thiols. Sensors 2007, 7, 932–959. [Google Scholar] [CrossRef]
- Klejdus, B.; Zehnalek, J.; Adam, V.; Petrek, J.; Kizek, R.; Vacek, J.; Trnkova, L.; Rozik, R.; Havel, L.; Kuban, V. Sub-picomole high-performance liquid chromatographic/mass spectrometric determination of glutathione in the maize (Zea mays L.) kernels exposed to cadmium. Anal. Chim. Acta. 2003, 520, 117–124. [Google Scholar] [CrossRef]
- Causon, R. Validation of chromatographic methods in biomedical analysis - Viewpoint and discussion. J. Chromatogr. B. 1996, 689, 175–180. [Google Scholar] [CrossRef]
- Bugianesi, R.; Serafini, M.; Simone, F.; Wu, D.Y.; Meydani, S.; Ferro-Luzzi, A.; Azzini, E.; Maiani, G. High-performance liquid chromatography with coulometric electrode array detector for the determination of quercetin levels in cells of the immune system. Anal. Biochem. 2000, 284, 296–300. [Google Scholar] [CrossRef] [PubMed]
- Long, G.L.; Winefordner, J.D. Limit of detection. Anal. Chem. 1983, 55, A712–A724. [Google Scholar]
- Annesley, T.M. Ion suppression in mass spectrometry. Clin. Chem. 2003, 49, 1041–1044. [Google Scholar] [CrossRef] [PubMed]
Sample Availability: Samples of the compounds of interest are available from the authors. |


| min | MeOH (%) | Water (%) | Water with 0.02% TFA (%) |
|---|---|---|---|
| 0 | 2 | 93 | 5 |
| 20 | 55 | 40 | 5 |
| 30 | 35 | 60 | 5 |
| Phytohormone | Regression | R2 | a LOD (ng/mL) | b LOQ (ng/mL) | c R.S.D. (%) | d Recovery (%) |
|---|---|---|---|---|---|---|
| Aliphatic cytokinins | ||||||
| t-Z | y = 91.193x - 10.217 | 1 | 60 | 200 | 4.4 | 96 |
| c-Z | y = 88.334x - 3.5650 | 0.9996 | 50 | 170 | 5.5 | 98 |
| DHZ | y = 54.361x - 10.050 | 0.9998 | 110 | 360 | 5.9 | 95 |
| Aromatic cytokinins | ||||||
| BA | y = 41.432x - 11.270 | 0.9988 | 130 | 430 | 4.6 | 87 |
| K | y = 82.169x - 35.783 | 0.9991 | 70 | 230 | 4.5 | 98 |
| m-T | y = 65.262x + 0.8680 | 0.9995 | 50 | 160 | 5.2 | 95 |
| o-T | y = 56.429x - 33.103 | 0.9935 | 140 | 460 | 5.5 | 96 |
| Metabolites of cytokinins | ||||||
| t-ZR | y = 85.878x - 5.3040 | 0.9999 | 60 | 200 | 5.2 | 92 |
| t-ZG | y = 34.709x - 6.4040 | 0.9999 | 150 | 500 | 5.5 | 105 |
| t-ZOG | y = 42.958x - 9.007 | 1 | 130 | 430 | 5.8 | 103 |
| m-TR | y = 77.946x - 47.529 | 0.9995 | 80 | 260 | 4.8 | 95 |
| o-TR | y = 47.491x - 13.702 | 0.9988 | 120 | 400 | 4.5 | 98 |
| Auxins | ||||||
| IAA | y = 408.970x - 136.390 | 0.9945 | 20 | 70 | 4.8 | 97 |
| NAA | y = 283.760x + 6.652 | 0.9985 | 20 | 70 | 3.9 | 99 |
© 2009 by the authors; licensee Molecular Diversity Preservation International, Basel, Switzerland. This article is an open-access article distributed under the terms and conditions of the Creative Commons Attribution license (http://creativecommons.org/licenses/by/3.0/).
Share and Cite
Diopan, V.; Adam, V.; Havel, L.; Kizek, R. Phytohormones as Important Biologically Active Molecules – Their Simple Simultaneous Detection. Molecules 2009, 14, 1825-1839. https://doi.org/10.3390/molecules14051825
Diopan V, Adam V, Havel L, Kizek R. Phytohormones as Important Biologically Active Molecules – Their Simple Simultaneous Detection. Molecules. 2009; 14(5):1825-1839. https://doi.org/10.3390/molecules14051825
Chicago/Turabian StyleDiopan, Vaclav, Vojtech Adam, Ladislav Havel, and Rene Kizek. 2009. "Phytohormones as Important Biologically Active Molecules – Their Simple Simultaneous Detection" Molecules 14, no. 5: 1825-1839. https://doi.org/10.3390/molecules14051825
APA StyleDiopan, V., Adam, V., Havel, L., & Kizek, R. (2009). Phytohormones as Important Biologically Active Molecules – Their Simple Simultaneous Detection. Molecules, 14(5), 1825-1839. https://doi.org/10.3390/molecules14051825