Abstract
The molecular recognition features of tolbutamide with four synthetic hosts have been studied by means of NMR titrations, NOESY experiments and Monte Carlo (MC) conformational search. The interaction strength and the most probable structure reveal new insights on the recognition phenomena of this urea derivative in comparison with close related compounds.
Introduction
In preceding papers we have carried out a systematic study of host-guest complexes using urea and biotin related compounds of biological interest as guests, with the final purpose of mimicking the function of natural receptors by means of an iterative optimisation approach [1,2,3]. Here we have applied the same methodology to a new guest, the anti-diabetic oral hypoglycaemic agent tolbutamide (1), this compound is a sulfonylurea related to our previously studied guests, namely biotin methyl ester (2), N,N'-dimethylurea (3), 2-imidazolidone (4), N,N'-trimethylenurea (5) and barbital (6), but in this case with a sulfonyl group that can change its properties (Figure 1).
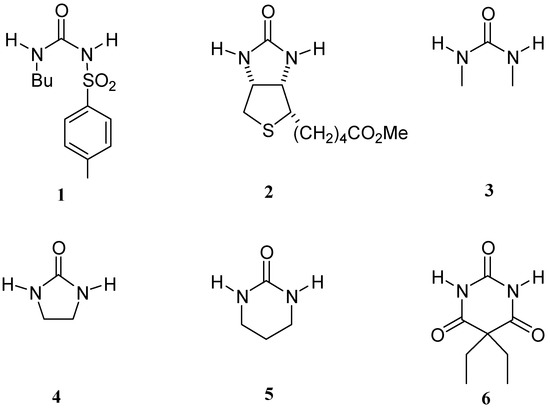
Figure 1.
Structure of tolbutamide (1) and related guests.
We have studied the complexes formed between tolbutamide and four synthetic hosts (Figure 2), namely N,N’-bis(6-methylpyridin-2-yl)-1,3-benzenedicarboxamide (I), 4-chloro-N,N’-bis(6-methyl-pyridin-2-yl)-2,6-pyridinedicarboxamide (II), N,N’,N’’-tris(6-methylpyridin-2-yl)-1,3,5-benzene-tricarboxamide (III) and N,N’,N’’-tris(7-methyl-1,8-naphthyridin-2-yl)-1,3,5-benzenetricarboxamide (IV).
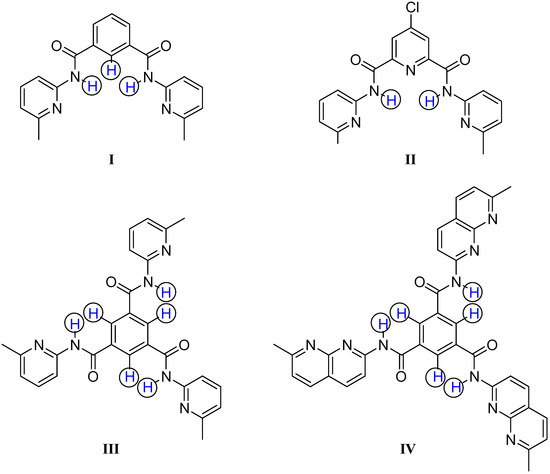
Figure 2.
Structures of hosts I-IV.
1H-NMR titrations have been performed to measure the binding constants (Kb) of hosts I, III and IV with tolbutamide by a direct method, using the Chemical Induced Shifts (CIS) of the benzenic protons and the NHs of the 1,3-dicarboxamide groups (protons within a circle in Figure 2). Due to the interaction between host II and water, the competitive titration method was needed to determine its Kb value, measuring the NH-CIS of the urea moiety in tolbutamide and the H2O-CIS [2,4].
As we have previously proven, a careful determination of the best concentrations of host and guest must be carried out to measure the binding constants with the lowest error [1]. All the titrations have been performed in such a way that the saturation fractions of both host and guest are between 20%-80%, avoiding situations where the chemical induced shifts of the monitored protons are zero. In these conditions a soft titration curve, with no linear behavior, is obtained and the data are non-linearly fitted by the use of the Sigmaplot software package, giving curves like the one shown in Figure 3.
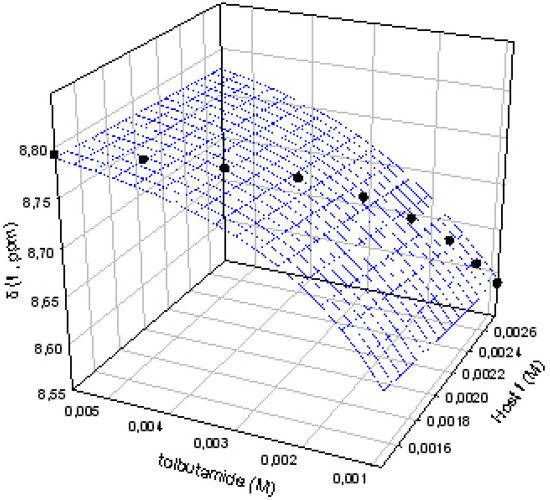
Figure 3.
Titration curve for the complex I:1.
All complexes have been modelled using Monte Carlo conformational search with the AMBER force field (MacroModel v.8.1, see Experimental Section). This procedure affords the most probable structure of the complex and allows us to get useful information about the binding mode of the guest.
Results and Discussion
Binding constants
The experimental binding constants Kb measured in CDCl3 at 300 K for complexes of hosts I-IV with tolbutamide (1) are gathered in Table 1, together with the values previously measured by us with the other guests 2-6 [1,2], given for comparative purposes.

Table 1.
Experimental binding constants Kb (M-1) at 300 K.
| I | II | III | IVa | |
|---|---|---|---|---|
| tolbutamide (1) | 600 | 735 | 900 | 820 |
| 2 | 975 | 3600 | 4000 | 148000 |
| 3 | < 10 | < 10 | 34 | - |
| 4 | 1450 | 140 | 4800 | 33000 |
| 5 | 2300 | 100 | 5700 | 21000 |
| 6 | 2375 | 275 | 6100b | - |
aThe Kb values with guests 3 and 6 were not determined due to the lack of solubility of the complexes. b This complex shows a 2:1 stoichiometry with a second Kb equal to 1400 M-1 [3].
Tolbutamide forms complexes of similar stability with all hosts, although there is a considerable difference in the structure of these compounds. Guests such as biotin methyl ester (2) establish a weak interaction with I, but a very strong one with IV - actually the obtained complex is the strongest one ever found between a biotin analog and a synthetic receptor [3].
Another difference of tolbutamide is the behavior of the signals, of both the hosts and the guest, in the 1H-NMR spectra. With the other guests 2-6 the Kb determination was carried out following the chemical induced shift of the protons indicated with a circle in Figure 2. Therefore, for hosts I, III and IV two different protons can be used, the benzenic and the amide protons. However, in the titrations of tolbutamide there was no variation on the signals of the benzenic protons indicating an interaction through a different binding mode. On the other hand, for tolbutamide, during the titration, a shift in the signals was only observed for the NH proton next to the sulfonyl group while the other NH proton remained unchanged. To explain this different behavior we have used the information provided by the modelling of these complexes.
Molecular modelling. Structure of the complexes
In Figure 4 three minimized structures, found in the MC search, are shown. The structure shown in Figure 4a belongs to the complex between host I and 2-imidazolidone (4) and it represents the usual mode of binding for this kind of compounds - through the urea moiety.
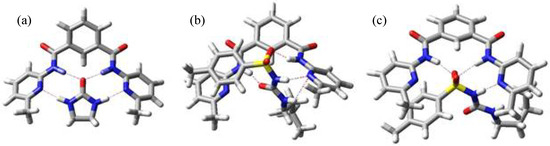
Figure 4.
Minimum energy structure for complexes I:4 (a), I:1 (b) and I:1(NOESY) (c) .
Modelling of complex I:1 afforded the structure shown in Figure 4b (-73.4 kJ mol-1), but this structure does not explain the experimental data obtained during the NMR titration, where only the chemical shift of NH signal next to sulfonyl group changes, indicating that the other NH close to butyl substituent is not interacting with the host. Trying to get some information about the relative position of p-tolyl and butyl substituents we carried out NOESY experiments. In this fashion we observed weak cross peaks, indicating the closeness of the p-tolyl protons of tolbutamide (1) to the methyl group of host I and of the guest butyl protons to the host pyridine ones. Introducing this information in a new MC search we obtained the structure shown in Figure 4c (-63.4 kJ mol-1), where now the hydrogen bonds are formed between the sulfonyl group of the guest and the NH amides of the host, and between the NH bonded to the sulfonyl and the N atom in pyridine, in agreement with experimental data.
The discrepancy between theoretical prediction and experimental results arises from the fact that in tolbutamide, the preferred conformation to interact with the hosts is not through the urea moiety with formation of four hydrogen bonds, but rather it involves the acidic NH as well as the sulfonyl group and only three hydrogen bonds intervene.
The minimum energy structure for complexes of tolbutamide (1) with hosts II, III and IV are shown in Figure 5. In all cases the binding mode is the same that we found in the complex with host I, in agreement with the experimental data.
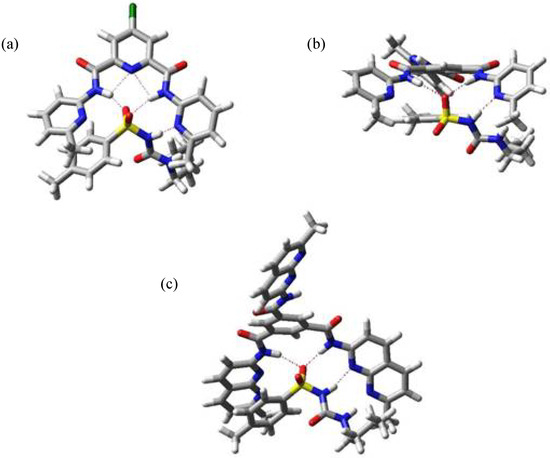
Figure 5.
Minimum energy structure for complexes II:1 (a), III:1 (b) and IV:1 (c).
From these data it is clear that tolbutamide (1) behaves rather different from the other studied ureas because the sulfonyl group not only increases considerably the acidity of the contiguous NH but also modifies the conformation in the complex. In all cases the conformation for tolbutamide is the Z,Z one, with the NH protons opposite to urea carbonyl, unlike guests 2 to 6. The effect of the sulfonyl compensates the small Kb value that could be expected due to the rotational isomers of this molecule.
Conclusions
The binding mode of tolbutamide is driven by the presence of the sulfonyl group, because of that this compound shows a host-guest chemistry totally different from other ureas where the interaction takes place through the urea moiety. We have proven how the use of NMR titrations and molecular modelling allows one to reach a deeper understanding of the molecular recognition features of urea derivatives.
Experimental Section
General
The guest tolbutamide (1) is commercially available (> 99%). The preparation of hosts I, II, III and IV has already been described by us [2,3].
NMR Titrations
Each 1H-NMR titration was carried out at least three times in a 9.4 Tesla spectrometer at 300 K in CDCl3 as a solvent (deuterium content > 99.8%, water content <0.01%). The syringes are from Hamilton-Bonaduz, 5 μL (divisions 0.05 μL), 10 μL (divisions 0.1 μL), 250 μL (divisions 5 μL) and the balance for weighting the host and the guest a Metler AE260-Delta Range (error ±0.00005 g). 1H NMR titrations are used in order to quantify Kb values, these titrations are carried out following the Chemical Induced Shift (CIS) in one or several protons of host or guest while the concentration of the complex formed is changed by the addition of one of the components. There are a large number of ways to fit the data from a titration [5], but that consisting in non-linear curve fitting is generally accepted as the method with the lowest error in the determination of Kb values, in comparison to others that employ approximations to reach a linear relationship between δ and Kb. To fit the experimental data the Sigmaplot 8.1 program from SPSS Science Software Gmbh was employed. The basic equation used in this kind of titrations is represented by (Eq. (1)), showing the relationship between chemical shifts (δ), concentrations of host H, guest G and complex C, and the binding constant Kb = [C]/([H][G]), this equation is valid only for 1:1 stoichiometry as is our case [6].
δOBS = (δC–δH) ({(1+[G]/[H] +1/Kb[H])/2} – {(1+[G]/[H]+1/Kb[H])2/4 – [G]/[H]}1/2)+ δH
In order to obtain Kb values with the lowest error the titrations are carried out in the 20-80% saturation range for the compound which CIS is being followed. This condition determines the concentrations to be used in the titrations for both host and guest and a calculation has to be done to find those concentrations that best cover the whole range of p in order to get the maximum information from the titration curve. The parameter p is defined as the relationship between the complex concentration and the maximum possible concentration at that point of the titration. The accuracy in the concentration range to be used in titrations is usually disregarded in most publications in the host-guest field, affording Kb values totally different from those obtained following this procedure. The error determined by this magnitude is intrinsic to the measurement method and it is not reflected by the standard deviation (Sd) which is a measure of the fit goodness of the data employed.
The titrations for the complex between host IV and water are carried out on the same way (20-80% saturation range), water concentration being determined by the integration of its NMR signal. The host sample for the titration is prepared with freshly distilled CDCl3 and 4 Å molecular sieves are added to keep water at the minimum concentration; in this way all the samples had an initial saturation range between 20-30%, so the titration was carried out in the right saturation range.
Titrations between host IV and biotin methyl ester (2) are carried out by the same method, but keeping the concentration of water under 1 mM in order to avoid any competitive behaviour of the water. For host IV competitive titrations are used, the CIS of the two guests are measured while aliquots of the host are added. The fitting of the data to Equation (2) allowed us to obtain a relative Kb for the guest we are studying, and since the Kb for the complex IV:water was previously measured we can calculate the value for the complex IV:guest.
Kb(water) / Kb(guest) = [(1/Fguest)-1] / [(1/Fwater)-1]
Fwater and Fguest are the molar fractions of water and guest that are bound to the host, if no another equilibria arise (which it has been proved with titrations of the guest versus water), then Fi = (δi,Free – δiObserved)/( δi,Free – δi,Complexed).
MM calculations
MacroModel v.8.1, with the GB/SA model for chloroform was used to perform the molecular simulations of the complexes [7]. All calculations were achieved with Montecarlo (MC) conformational analyses. Minimisation is carried out using Polak-Ribiere conjugate gradient optimiser. In a typical MC run a MCMM is never performed with less than 8000 steps, to carry out the search both torsional rotations in host and guest and translation/rotation (10 Å/360º) of the guest is performed, for all the MC a cutoff is applied to van der Waals, electrostatic and H-bond interactions with 7, 12 and 4 Å respectively. These calculations were carried out with the AMBER* force field as implemented in the version of the program.
Acknowledgements
An FPI fellowship to one of us (F H R) and economic support from the MCyT of Spain (project number BQU2003-00976) is greatly acknowledged.
References
- Claramunt, R; Herranz, F; Santa María, M.D.; Jaime, C.; De Federico, M.; Elguero, J. “Towards the design of host-guest complexes: biotin and urea derivatives versus artificial receptors”. Biosensors Bioelectron. 2004, 20, 1242–1249. [Google Scholar] [CrossRef]
- Claramunt, R; Herranz, F; Santa María, M.D.; Pinilla, E.; Torres, M.R.; Elguero, J. “Molecular recognition of biotin, barbital anf tolbutamide with new synthetic receptors”. Tetrahedron 2005, 61, 5089–5100. [Google Scholar] [CrossRef]
- Herranz, F; Santa María, M.D.; Claramunt, R. “Molecular Recognition: Improved Binding of Biotin Derivatives with Synthetic Receptors”. J. Org. Chem. 2006, 71, 2944–2951. [Google Scholar] [CrossRef]
- Adrian, J.C.; Wilcox, C. S. ”Chemistry of synthetic receptors and functional group arrays. 15. The effects of added water on thermodynamic aspects of hydrogen bond based molecular recognition in chloroform”. J. Am. Chem. Soc. 1991, 113, 678–680. [Google Scholar] [CrossRef]
- Fielding, L. “Determination of Association Constants (Ka) from Solution NMR Data”. Tetrahedron 2000, 56, 6151–6170. [Google Scholar] [CrossRef]
- Hirose, K. “A practical guide for the determination of binding constants”. J. Incl. Phenom. Macrocycl. Chem. 2001, 39, 193–209. [Google Scholar] [CrossRef]
- MacroModel, Schrödinger LLC. 2004. http://www.schrodinger.com.
- Sample availability: Contact the authors.
© 2006 by MDPI (http://www.mdpi.org). Reproduction is permitted for noncommercial purposes.