
Analysis of Improvement of BIM-Based Digitalization in Engineering, Procurement, and Construction (EPC) Projects in China


The Department of Real Estate and Construction, Faculty of Architecture, The University of Hong Kong, Pokfulam Road, Hong Kong 999077, China
*
Authors to whom correspondence should be addressed.
†
The first two authors have contributed equally.
Appl. Sci. 2021, 11(24), 11895; https://doi.org/10.3390/app112411895
Submission received: 6 October 2021
/
Revised: 26 November 2021
/
Accepted: 6 December 2021
/
Published: 14 December 2021
(This article belongs to the Special Issue BIM Implementation to Meet the Changing Demands of the Construction Industry)
Abstract
:Digitalization is considered a dynamic change process powered by the rapid development of innovative concepts (e.g., building information modeling) that brings substantial potential benefits to the construction industry. However, previous studies of the benefits of digitalization (BIM) were mainly based on laboratory data rather than actual practices, which compromised the reliability of the results for construction practitioners. This study investigated the impact of digitalization in EPC construction projects by integrating descriptive statistics and survey-based exploratory factor analysis (SEFA). After a detailed review of related studies and meetings with experts, ten main variables and 14 unified variables were identified. The data on these variables were collected by questionnaire surveys and the extraction of information from project documentation. A total of 62 participants from 33 EPC construction projects responded to the questionnaire survey. The SEFA results indicated that digitalization can improve both the cost and time performance, with greater potential for improvement in time performance for EPC projects. In a scenario with limited digitalization implementation, this research could motivate future researchers to develop more applied research and guidelines to achieve best practices in the domain of the digitalization of construction projects.
1. Introduction
Digitalization is believed to be a transformative process dynamically led by the vast benefits obtained from the rapid growth of smart technologies, automation, concept and connectivity, which have brought magnificent potential benefits to the construction industry from both cost and time perspectives [1]. To exploit digitalization’s advantages in the construction sectors, the UK government launched the Digital Built Britain strategy to implement the construction industry’s digitalization, and building information modeling (BIM) is considered to represent the integration of digital technologies and innovative concepts for the construction sector’s digitalization [1,2,3]. As one of the leading economies and home to many of digital technology integration (BIM)’s adopters and investors globally, similar to the UK, China is encouraging all industries to embrace a broader digital landscape and promoting the newest resources of digitalization (e.g., BIM technology, BIM strategy, BIM concept) among all researchers and practitioners [2]. China’s government released the 14th Five Year Plan [4] by assigning the mission of ensuring the progression of the construction industry’s digitalization to reformed large state-owned enterprises (LSOEs).
Engineering, procurement, and construction (EPC) projects, defined as projects (usually as a mega-project) regulated by an EPC contract, allow the main contractor to take responsibility for the detailed engineering design, procurement, and construction until the commission and handover phase [5]. Many researchers and practitioners believe that the EPC method can exploit the potential for minimizing project delays with the improvement of information centralization and offers the possibility for improving the experience of end customers [6]; it is widely adopted by Chinese construction companies (not least LSOEs) [7] and has resulted in considerable shifts in their benefits [8]. With a guarantee from LSOEs under EPC regulation, it has been suggested that the EPC primary constructor has greater freedoms and motivation to keep tracing progress and updating the contingency analysis to ensure the quality of the project, instead of prioritizing rushed deliveries [9].
Laboratory experiments on BIM’s uses in the construction sector have already demonstrated its numerous benefits [10] and raised many researchers’ and practitioners’ concerns about the actual performance of these techniques in terms of time and cost aspects. Many international institutions from construction, architecture, civil engineering, and even the finance industry have investigated the benefits of digital technologies in construction projects in their methods [11]. However, compared to laboratory experiments, actual project experiments contain abundant uncontrolled variable factors (e.g., reluctance from stakeholders, fraud involving sensitive data, culture, and price index) [12], which reduce the reliability of data information and their interpretation [13]. In order to extend digitalization (e.g., the implementation of advanced digital techniques in construction projects), a locally aimed and reliable analysis should be established for understanding how digitalization impacts construction projects, as well as the direction of construction’s digitalization at a local scale, instead of generalizing for each country or even each state. However, many local government sectors and institutions promote BIM with data from overseas, which may result in misinterpretations among national researchers and practitioners that may even hinder the progression of the digitalization of construction in China [14].
This study aims to develop a consequence-oriented analysis to interpret the true impact of an improvement in BIM-based digitalization in EPC construction projects locally and acceptably. First, the current BIM situation in the Chinese construction industry, the leading digital technologies, the detailed EPC contract mechanism, and the market size of EPC construction projects in China are demonstrated through a literature review in order to provide readers with an understanding of the background of this study. Secondly, some local institutions and companies were invited to help as consultants and data collectors in this study. Meanwhile, a questionnaire containing basic required information (e.g., project manager information, engineer information) and key project information (e.g., design cost, building cost, project period, and cost factor) was designed and authorized, and on-site investigations were scheduled in order to collect constructors’ opinions on BIM and its performance. With the results of this study, a relatively authentic and locally aimed discussion is performed on how digitalization (BIM integration) impacts construction projects’ performance. Furthermore, this study exploits the results and project data to explore the main directions of digital technology implementation in local construction projects and how local construction companies engage in digitalization. Some limitations of the study are noted, and future research directions are provided in the Conclusions.
2. Literature Review
2.1. Features of the EPC Project
EPC projects have the potential to address issues of high complexity by introducing an integrated thought process during design, procurement, construction, and commissioning. In an EPC project, the general contractor, as a single entity, assumes responsibility for the design, execution, and completion of the project and, at the same time, deals with a wide range of risks from organizational, socio-political, economic, environmental, and other perspectives [15]. Many researchers have studied the more concentrated allocation of risk within the organization to customers and general contractors [16]. Therefore, it is suggested that trust-based organizational relationships, such as partnerships, can directly promote organizational capacity and risk management and affect risk management by improving organizational capacity, thus improving project performance [15,16,17].
In an EPC project, the contractor assumes all responsibility from the beginning. This includes the provision of engineering services, material procurement, and construction services. With the rapid development of the global economy and the development of various industrial sectors, the popularity of EPC project procurement has increased [6]. The demand for EPC projects is influenced by population growth (e.g., labor cost) [18], national economic growth (e.g., ease of material acquisition, price index) [19], sustainable development (e.g., government policy, regulation) [15], and other factors (e.g., expert skills) [1,2,3].
EPC projects involve many people, use many resources, and face many uncertainties and risks, which will affect the project performance [17,20]. As with most projects operating in a worldwide business environment, EPC project participants need to quantify the business impact of related digital technology investments. Many participants believe that if they invest in digitalization, they will immediately improve their operating efficiency and improve their performance standards, and one of the new methods and technologies in this area is the building formation model (BIM) [20,21,22].
2.2. Integration of BIM with Other Digital Technologies
The building information model was created to address the lack of coordination among architecture, engineering, and architecture participants. Decades of BIM development have made it easy for these participants to exchange data (e.g., Internet of Things, 3D printing, Geographic Information Systems) [23,24] and collaborate in real time, from concept design through the detailed construction drawing stages and throughout the project life cycle (e.g., asset information management, facility management, Building Automation Systems) [24].
The trend today is to combine other established concepts with 4D/5D BIM (e.g., 4D printing, VR/AR) with standardized construction delivery methods and complementary processes/technologies (e.g., Integrated Design and Delivery Solutions) [25]. Some researchers have noted that the introduction of the concept of digital twins in architecture and the built environment began to generate a heated discussion on social media regarding its description, definition, and interaction with BIM concepts [26]. Meanwhile, some artificial intelligence solutions, such as natural language processing, risk reduction, automation optimization, and block-chain implementation, used in construction engineering and management have raised a range of concerns among BIM-related researchers [27].
2.3. Performance of BIM in Construction Projects
In a study of seven cases of building projects using precast concrete structures, a performance analysis found that BIM eliminated up to 50% of design errors [28], and it was verified that the BIM-aided design reduced construction waste by 4.3–15.2% in two example projects [29]. In a case study of a project involving a structural engineering firm, Kaner et al. [30] analyzed the impact of BIM on correcting design errors, reexamining the design of complex parts, and analyzing the time improvement of the field drawing process.
While the additional electrical system installation cost resulting from the design modification accounted for 1–2% of the total heavy industry cost, the exact cost was reduced by 0.2% in a BIM-assisted hospital project [31]. In BIM-assisted projects, the number of design modifications in mechanical systems was decreased by 47% [32]. BIM was applied to pre-construction design and development, where 55 conflicts were identified in the final phase, thus avoiding USD 124,500 in damage, and an additional 590 conflicts were added to the MEP system before installation, resulting in total savings of USD 564,220 [33]. The net effect of BIM was found to be 25%, not including 75% of the total BIM cost savings, given that conflicts can be resolved traditionally [34].
2.4. Building Type in China’s EPC Projects
Usually, in order for Chinese people to live, study, and work, they must live and engage in production and in a variety of cultural and social activities within housing, called buildings, such as houses, schools, theaters, etc. According to the literature, building uses can be divided into civil, industrial, and agricultural [35]. Civil buildings can be divided into residential buildings and public buildings. According to the differences in their use, industrial buildings can be divided into plants and warehouses (the authors classify the buildings in a given region according to their specific types) [36].
According to Article 5.1.1 of the Building Regulation (GB50016-2014), civil buildings can be divided into single multi-story and high-rise civil buildings according to the height and number of floors. In high-rise civil buildings, according to their height, the building’s area of use and floors can be divided into one class or two classes (the authors consider these building types as residential types) [35].
The first types of high-rise residential buildings are those with a height greater than 54 m (including those with commercial service outlets), and the second types of high-rise residential buildings are those with a height greater than 27 m but not greater than 54 m (including those with commercial service outlets). Single-story and multi-story residential buildings have a height of no more than 27 m (including those with commercial service outlets).
The commercial service network mentioned here refers to shops, post offices, savings offices, barbershops, and other small commercial rooms set up on the first floor or first and second floors of residential buildings with a building area of no more than 300 m2 per unit (the authors refer to these building types as commercial types).
As the highest form of the current real estate model, HOPSCA is a new composite real estate model that grows by integrating urban functions, with large-scale and complex spaces, and streamlines the organization. La Defense, first established in 1986 in Paris, is an urban complex integrating hotels, office buildings, ecological parks, shopping malls, clubs, and high-end residences. The HOPSCA model of HOTEL+OFFICE+PARK+SHOPPINGMALL+CONVENTION+APARTMENT embodies the development of the double-track model of business-supporting facilities and life services. It is a modern agglomeration area with a perfect overall layout, apparent functional features, diversification, and multiple levels. It represents a new and modern type of commercial real estate [37].
2.5. The Challenges of COVID-19
COVID-19 has caused widespread socio-economic disruption, with devastating effects in many areas of life. Much of what we know about the true health of the architecture, engineering, and construction (AEC) industry in the face of COVID-19 is based on very limited data [38].
The ongoing COVID-19 emergency has clearly created new challenges for AEC industry personnel, such as the difficulty of maintaining public health or ensuring that their and relevant institutions’ responses are ethical. As values clash in the response to the crisis, AEC participants have had to prioritize some at the expense of others: the immediate and complete shutdown of public life may be the most effective in stopping the spread of COVID-19; nonetheless, these industries are also struggling with supply chain disruptions and labor shortages [38,39].
The extraction of raw materials for the production of building materials, the entire construction industry, material transportation, inspection, labor, etc., are facing challenges. AEC industries in many countries rely heavily on imported building materials such as steel, windows, joinery, tiles, float glass, and curtain walls, and China is the world’s largest exporter of building materials [40]. Supplies of these building materials have been disrupted amid China’s response to the spread of COVID-19, leading to widespread lockdowns and temporary closures of manufacturing plants. Many AEC industry personnel and experts have been affected by the virus and quarantined, resulting in a shortage of labor, which has caused delays in construction projects and exerted a negative impact on the digitalization process [41].
3. Research Methodology
This study aimed to investigate whether laboratory-based experimental results regarding the time and cost performance impact of digitalization are consistent with those of real-life projects in China. The results should provide Chinese practitioners and researchers with a more accurate assessment of the benefits of digitalization in the Chinese construction industry, eliminating the need to rely on laboratory results, as most practitioners in China do. Meanwhile, the study also aimed to interpret the primary trends of digital technology implementation in Chinese construction projects in order to visualize the future path of digitalization in the Chinese construction industry. The research methodology included four stages, from preparation to performance analysis.
3.1. Stage 0: Preparation
3.1.1. Identification of Main Variables
When conducting the consequence-oriented analysis of this study, the variable factors associated with the utilization of digital technology in experiments and real projects were discussed and further identified after a meeting of collaborating practitioners from the architecture, construction, and engineering industry, and also some companies representing the construction supply chain. The main variables are shown in Table 1.
3.1.2. Identification of Project Criteria
In order to control the variable factors regarding the utilization of digital technology in experiments and actual projects and to unify the project environments, construction projects under EPC specifications and operated by LSOEs with advanced digital technology implementations were selected; furthermore, appointments were scheduled and authorized by these LSOEs and by project managers [42,43,44]. The unified environment factor criteria were followed (Table 2):
3.1.3. Questionnaire Design
The questionnaire consisted of 15 questions covering the background information of the respondents (e.g., job, position in the project), questions (e.g., how do you rate digital technology in your occupation?) to collect their opinions regarding advanced digital technology implementation, and six mixed questions (e.g., as part of your occupation, have you ever faced one or more of the following problems which can be improved or solved by recently implemented digital technology? Please select, if other, please specify) regarding the problems in local projects and recently implemented digital technologies in local projects.
3.1.4. Requirements of Project Documentation
With a half-month-long discussion about the feasibility of sensitive data collection and the convenience of collecting data with cooperators and other institutions, an acknowledgment of the project documentation requirements was accepted by both cooperators and other institutions. The content of the project documentation consisted of (1) basic project information, (2) key digital technology(ies) implemented in the project, (3) achievements resulting from implementation of key digital technology(ies), and (4) future view of digitalization based on experience.
3.2. Stage 1: Data Collection
3.2.1. Questionnaire
The questionnaire was finalized by 22 December 2018. Considering the long holidays—for example, New Year (1 January 2019), Chinese New Year (4 February 2019), and the traditional Chinese Lantern Festival (19 February 2019)—and issues surrounding COVID-19, 46 questionnaires were completed by target respondents via unofficial phone interviews and transcribed by researchers, while 16 were completed face-to-face (performed during on-site project investigation), and the questionnaire dataset was compiled by 18 May 2020.
3.2.2. On-Site Project Investigation
Collaborating institutions arranged four on-site project investigations, as shown in Table 3.
3.2.3. Project Documentation
The required project documentation, which contains basic project information, digital technology implementation information, major challenges of projects, achievements after utilizing digital technology, and future blueprints of digitalization in construction projects based on project experiences, was emailed to the target project managers in order to collect the necessary data from the cooperating institutions. The documentation data were collected by 18 May 2020.
3.3. Stage 2: Rough Data Clearing
3.3.1. Questionnaire
Data from a total of 62 questionnaires were compiled in the dataset and respondents occupied a varied range of positions in the project, as shown in Table 4.
3.3.2. On-Site Project Investigation
Considering the fraud and bias problems associated with questionnaires and project documentation due to culture, sensitivity, intentions, and personal attitudes, etc., in order to validate the reliability and authenticity of the results of this study, four unfinished projects were selected under the principles of convenience and representativeness, and some accurate digital technology (e.g., 3D modeling, site tablet) implementation situations were documented and also recorded in the form of images.
3.3.3. Project Documentation
3.4. Stage 3: Performance Analysis
3.4.1. Cost Performance
Based on certain data in the project documentation (e.g., clash detected amount, potential material savings in scheduling optimization, material savings in the construction phase), the cost performance was calculated and analyzed using two measures, namely actual cost saving in RMB/m2 (ACS) and potential cost saving in in RMB/m2 (PCS) indicated at the design stage, where
ACS = (contract sum − actual cost)/total building area
PCS = (potential cost saving at design phase)/(total building area)
ACS is realized as savings in construction cost, while PCS is a laboratory-based theoretical measure of savings in construction cost using digitized technologies. A comparison of ACS and PSC shows how well the cost saving potential generated from laboratory data during the design stage was achieved in practice.
3.4.2. Time Performance
Based on data collected from the project documentation (e.g., time saving in the design phase, time saving in on-site layout, time saving in training installers), the time performance was calculated and analyzed using two measures, namely actual project time saved (ATS) and potential time that can be saved indicated at the design phase (%), where:
ATS = ((actual project time saved)/(total contract period)) × 100%
PTS = ((potential time saving in design phase)/(total contract period)) × 100%
ATS is realized as the savings in construction time, while PCT is a laboratory-based theoretical measure of savings in construction time using digitized technologies. A comparison of ATS and PTC shows how well the time saving potential generated from laboratory data during the design stage is achieved in practice.
4. Data and Results
This section presents the opinions of different stakeholders regarding unethical practices, BIM functions, and various types of construction-related information, as well as contractors’ opinions on information sharing in the BIM context and their attitudes towards BIM adoption.
4.1. Technology Utilization and the Difficulty(ies) Faced during the Project
4.1.1. Summary of the Key Purposes of Local Construction Project Participators
The results regarding difficulties were derived from the multiple-choice question about the challenges that the projects encountered, which motivated the companies to adopt BIM. Table 7 shows the primary purposes (difficulties) that our respondents (62 responders) mentioned in 33 cases, with reference to the frequency and the percentage of cases. It can be seen from Table 7 that difficulties in the construction schedule, unexpected safety problems, barriers in the data environment, and low visualization on a project occurred the most (over 70%).
4.1.2. Summary of the Key Digital Technologies Related to Solving Difficulty(s) in a Local Construction Project
The results for technology utilization were derived from the multiple-choice question about utilizing BIM to solve difficulties (their answers in the difficulties section). As Table 8 shows, the highlighted difficulties, including managing construction safety (No. 1), controlling construction quality (No. 1), and planning site layout (No. 3) resulted in a complex situation that required more technologies (see the requirement of technology in the ‘Tech & Describe’ column of Table 8) or needed a higher digitalization level for an EPC project participant. However, the need for techniques of estimating cost, designing special structures, and building multi-disciplinary technical design (tied for last place) showed minimal importance (the lowest requirement for specific techniques).
4.2. Improvement of Digitalization Benefit in Cost Performance
Some respondents refused to indicate their financial information due to confidentiality concerns. Hence, only 27 cases’ cost performance data were collected. Table 9 shows the designated cost saving via the adoption of additional technologies besides the traditional ones, and the actual cost saving generated with a higher rate of technology utilization.
4.3. Improvement of Digitalization Benefit in Time Performance
Considering the low rate of comparing new-generation technology and traditional technology among the respondents, 25 samples containing more comprehensive data were collected, and the results are listed in Table 10.
4.4. Utilization of Technology in On-Site Projects for Particular Purposes
Table 11 indicates the frequency with which each technology used for a specific purpose, where 3D modeling was the most popular technology used in our sample cases. Moreover, 3D laser scanning, VR, oblique photography, and IoT were also frequently used digitization technologies.
5. Analysis and Discussion
Based on the above results, this section aims to discuss how the improvement of digitalization (utilization of BIM-based technology) impacts EPC projects to enhance the cost and time performance by analyzing the sample data.
5.1. Impacts of Digitalization Improvement on EPC Projects’ Cost Performance
One of the aims of this research was to estimate the benefit that would be achieved in terms of cost performance by utilizing new digital technologies in real-life EPC projects. To achieve this, three indicators were developed, described in this section, namely (1) the Cost Achievement Ratio (car); (2) the Potential Cost Saving Index (pcsi); and (3) the Actual Cost Saving Index (acsi).
As mentioned previously, the realized cost benefits resulting from the adoption of new-generation digital technology can be measured by a comparison of the potential cost saving predicted during the design stage and the actual cost saved during construction compared to the contract sum. The former is measured by the pcsi and the latter is measured by the acsi. The ratio of acsi to psci is a measure of how well the use of digital technologies enhances the cost performance; therefore, the Cost Achievement Ratio is defined as:
where
Cost Achievement Ratio (car) = acsi/pcsi × 100%
Potential Cost Saving Index (pcsi) = PCS/(contract cost per m2) × 10,000
Actual Cost Saving Index (acsi) = ACS/(contract cost per m2) × 10,000
The car, pcsi, and acsi of the sampled projects are shown in Figure 1.
5.1.1. Distribution of Cost Performance
It is shown in Figure 1 that only one case’s real cost saving (asi = 28) surpassed the expectated cost saving (psi = 4), and four cases (psi = 58; 100; 42; 51) showed no changes between the total actual construction cost and the contract price (asi = 0). The average Cost Achievement Index was 46.54%, and the median value was 50%, which is shown in the frequency distribution (with the exclusion of the highest score and the lowest score for amendment) in Figure 2.
5.1.2. Discussion of Time Performance
With a similar result to the result for cost performance, there was insufficient evidence of the building type variable’s (see Table 1) impact on period factors, since the building types of (1) three neutral cases, respectively, were commercial, specialty, and residential; (2) the surpassed case was HOPSCA; (3) and the declined case was a specialty.
Time savings data from Aylesbury Crown Court’s report indicate that the project was typically around 60 days ahead of schedule and there was a time saving of a couple weeks during the design phrase [45]. In contrast to the cost saving results, the mean estimated time saving during this phase was 93 days, and the mean actual time saving during the completion stage was 34 days; meanwhile, the mean actual time saving would have changed to 56 days if the biased sample (project delayed for 484 days due to some unknown reasons) was excluded.
With a short expert group discussion, the main potential causes of the variation in the time performance with each latest digital technology applied in the EPC projects were inferred as follows:
- (1)
- the discrepancy in process requirements resulted in the labor time;
- (2)
- the discrepancy in materials or structure resulted in the assembly time;
- (3)
- the information asymmetry between constructors and owners resulted in unethical practices;
- (4)
- the negative impact of COVID-19 during the period of 2019–2020 resulted in a disappointing delay in the worst case.
5.1.3. Discussion of Cost Performance
The responses to the questions about the impact of building type on cost performance showed a high level of agreement (see Table 1); however, the building type of only one successful case was commercial; the building types of the four neutral cases, respectively, were commercial, religious, HOPSCA, and residential. According to the utilization of the latest digital technologies, there is no substantial evidence to indicate the impact of building type on cost saving.
According to reports by Endeavour House and Festival Place, the estimated cost saving during the construction phase should be in the range of 8.5–9.5% [46]. The estimated mean cost saving during the construction phase was 3.24% and the final mean value in real practice was 1.36%.
With a short expert group discussion, the leading potential causes of the variation in the cost performance when each latest digital technology was applied in the EPC projects were inferred as follows:
- (1)
- the regional discrepancy in urban areas resulted in labor costs;
- (2)
- the regional discrepancy in the material market resulted in the price of the material;
- (3)
- the discrepancy in information transparency between constructors and owners resulted in expense claims;
- (4)
- the discrepancy in the technical level of engineers resulted in different estimated data;
- (5)
- the discrepancy in statistical methods resulted in different performance data.
5.2. Impacts of Digitalization Improvement on EPC Project’s Time Performance
In terms of time, the effects of labor and sub-constructors on the process were included in the salary or payment factors of cost performance, and this research focused on the final delivery time and the setting delivery time to reveal the variation in time. Three indicators are introduced this section: (1) the Time Execution Ratio (ter); (2) the Potential Speed Up Index (psui); (3) the Actual Speed Up Index (asui).
As mentioned previously, the realized time benefits resulting from the adoption of new-generation digital technology can be measured by a comparison of the potential time saving predicted during the design stage and the actual time saved during construction compared to the contract sum. The former is measured by the psui and the latter is measured by the asui. The ratio of asui to psui is a measure of how well the use of digital technologies enhances the time performance; therefore, the Time Execution Ratio is defined as:
Time Execution Ratio (ter) = ATS/PTS × 100%
In order to determine the potential cost saving more directly, the potential saving index can be calculated using Equation (9) and is displayed in Figure 2 (psui).
Potential speed up index (psui) = PTS × 100
In order to determine the potential cost saving more directly, the actual saving index can be calculated using Equation (10) and is displayed in Figure 2 (asui).
Actual speed up index (asui) = ATS × 100
The ter, psui, and asui of the sampled projects are shown in Figure 3.
Distribution of Time Performance
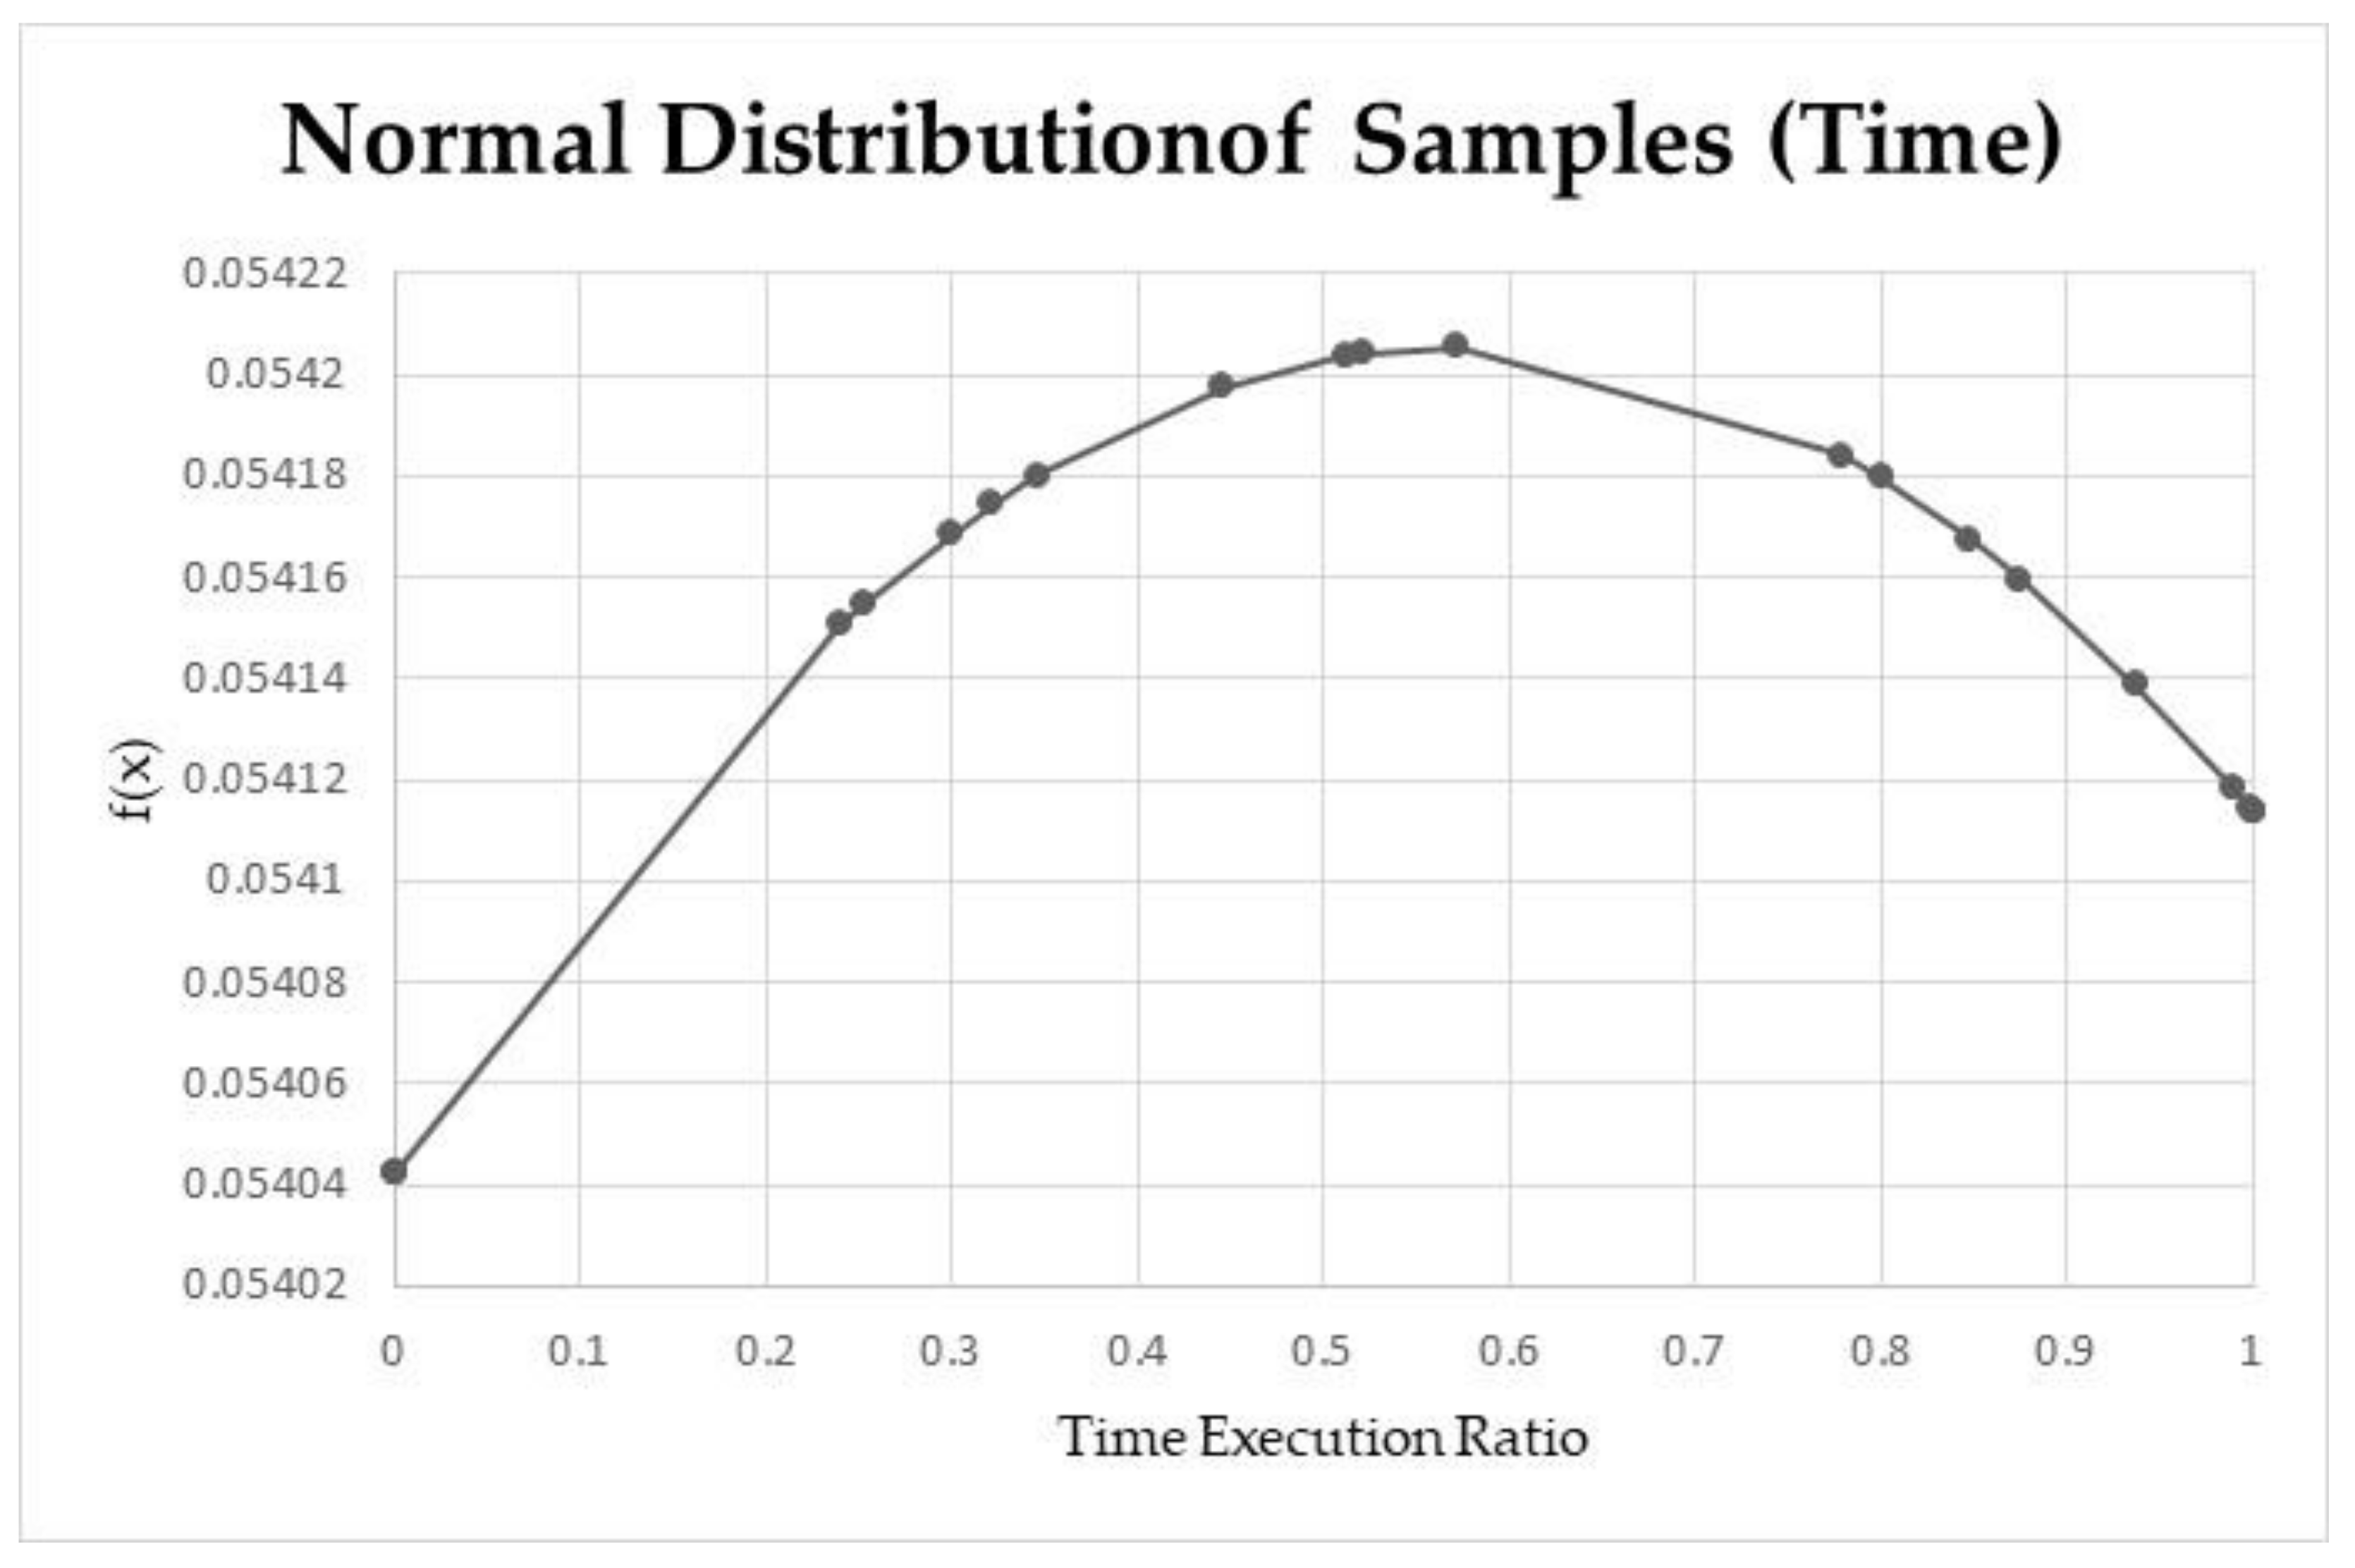
It is shown in Figure 3 that only one case’s real time improvement (asui = 3) surpassed the expected time improvement (psui = 2.638), while three cases (psui = 4.63; 4.75; 16.) showed no changes between the total actual construction period and contract setting period (asi = 0), and one case declined, with asui = −34.57 against psui = 6. The average Time Execution Ratio was 59.74%, and the median was 57.18%, which was slightly right-skewed (with the exclusion of the highest score and the lowest score), as shown in Figure 4.
6. Conclusions
6.1. The Novelty and the Advantages of This Research
This research investigated the gap between the potential impacts of BIM-oriented digitalization improvement and its actual impacts in 33 EPC projects through on-site inspection, documentation collection, and a questionnaire survey. For a better understanding of the gap in the impact from design practices during the design phase to the real consequences during the completion stage, the “Cost Achievement Ratio” and “Time Execution Ratio” were introduced to estimate these gaps (see Section 5.1 and Section 5.2). For further analysis, four performance indexes, the (1) Potential Cost Saving Index, (2) Actual Cost Saving Index, (3) Potential Speed Up Index, and (4) Actual Speed Up Index, were introduced with a suggested scale factor.
Our investigated EPC project data cover representative cities from two-thirds of Chinese territory (advantage on distinct scope), collect 16 categories or combinations of building type (advantage on building scope), and most projects were implemented with the China State Construction Engineering Corporation (advantage of technological-level consistency and BIM strategy similarity). In order to acquire comprehensive data, four processing on-site projects were visited to improve the data accuracy.
6.2. Short Summary of Research
It was found that (1) BIM-oriented digital technology utilization on an EPC project will bring a significant improvement in cost performance and time performance (see Table 9 and Table 10); (2) the results of the predicted improvement during the design stage are probably more optimistic than the results for real projects (see Table 9 and Table 10); (3) the test results for time performance and cost performance show that digital technology utilization has more advantages when compromising the project period compared to the reduction on a budget (see Figure 1 and Figure 3); (4) the analysis of the normal distribution on cost performance and time performance indicates that the prediction of the construction period has higher accuracy (Time Execution Ratio vs. Cost Achievement Ratio) than the estimation of project costs (see Figure 2 and Figure 4).
6.3. The Current BIM-Based Digitalization Level of On-Site Projects and Suggestions
In May 2011, the UK government published a futuristic building strategy aimed at reducing the cost of public sector assets. This futuristic building strategy requires building suppliers to apply for government tenders to be considered for BIM Level 2, which also promotes the phased roll-out of BIM Level 3 across all central procurement projects by 2016. BIM Level 2 contains 3D CAD, 2D drafting, and a common data environment strategy that should be launched at BIM Level 1, and the advanced methodology (named the BIM Execution Plan) of collaborative working and streamlined information exchange. Excluding the requirements of BIM Level 2, the BIM Level 3 concept promotes a simultaneous model that operates for all participants to reduce the cost of conflicting information, which means that BIM is a single, open, standard data server integration tool rather than a typical working platform [47,48,49].
Similar to the UK government, the Chinese government’s construction mandates are in favor of the BIM concept, promoting the adoption of BIM in real practices and pushing BIM towards to higher levels [50]. According to the analysis of the project documentation, most EPC project participants occupied an early stage of improving the existing Level 2 model with 3D BIM utilization (see Table 11); only a few of them realized their shortsightedness regarding BIM’s integration with other new technologies and systems, and there was no evidence that any participants implemented the BIM concept at the level of developing fresh business models. With the explanation in the roadmap of BIM levels, most of the current construction project participants should adopt BIM in integration with more digital technologies (e.g., artificial intelligence, block-chain) and more advanced methods (e.g., digital twin, construction engineering management) instead of utilizing BIM as a drawing technique.
6.4. Limitations and Recommendations
The results of this research were conducted with an on-site case-based dataset provided by digitalization-adopting project participants. Further research should collect more samples from project participants who hold negative or neutral attitudes toward digitalization or using the latest digital technology. Meanwhile, the type of building factor should be excluded from the primary variables, and some new factors (e.g., region, market price index) need to be considered in the future.
The results of this research are biased due to the limitations. Nonetheless, there are several proven benefits of BIM-based digitalization improvement reflected in this research, which can be compared with other, similar types of solutions, including different statistical methods introduced by other researchers. The various outcomes of performance could not completely elucidate the causal link between digitalization improvement and cost and project period, yet it should aid in promoting the development of further research.
Author Contributions
Y.Z.—conceptualization, investigation, data creation, writing—original draft; L.C.M.T.—supervision, writing—review and editing, K.W.C.—supervision, critique and enhancement. All authors have read and agreed to the published version of the manuscript.
Funding
This research received no external funding.
Institutional Review Board Statement
Not applicable.
Informed Consent Statement
Not applicable.
Data Availability Statement
The data presented in this study are available on request from the corresponding author. The data are not publicly available due to the raw/processed data required to reproduce these findings cannot be shared at this time as the data also forms part of an ongoing study.
Conflicts of Interest
The authors declare no conflict of interest.
References
- Yin, M.; Tang, L.; Zhou, T.; Wen, Y.; Xu, R.; Deng, W. Automatic layer classification method-based elevation recognition in architectural drawings for the reconstruction of 3D BIM models. Autom. Constr. 2020, 113, 103082. [Google Scholar] [CrossRef]
- Tang, L.; Chan, G.; Chen, C.; Zhang, Z.; Zheng, Y.; Yi, X.; Mok, A.; Mak, D. CIC BIM Adoption Survey 2020—Public-Facing Report; Construction Industry Council: Hong Kong, China, 2021. [Google Scholar] [CrossRef]
- Wen, Y.; Tang, L.; Ho, D. A BIM-based space-oriented solution for hospital facilities management. Facilities 2021, 39, 689–702. [Google Scholar] [CrossRef]
- Sartorio, S.; Chikhladze, S.; Seohyun, H.; Cardonnet, E.; Repaci, D. Focus—The Chinese 14th Five-Year Plan toward 2025 and Beyond. Available online: https://www.researchgate.net/publication/350236567_Focus-The_Chinese_14th_five-year_plan_toward_2025_and_beyond (accessed on 21 October 2021).
- Sholeh, M.; Fauziyah, S. Current state mapping of the supply chain in engineering procurement construction (EPC) project: A case study. MATEC Web Conf. 2018, 195, 06015. [Google Scholar] [CrossRef]
- Hansen, S. Study on the Management of EPC Projects. Int. J. Civ. Struct. Environ. Infrastruct. Eng. Res. Dev. (IJCSEIERD) 2015, 5, 11–22. [Google Scholar]
- Li, H.; Lv, L.; An, X.; Dong, G. Profit-Sharing Mechanism of Large EPC Project considering the Behavior of Fairness Concern. Adv. Civ. Eng. 2020, 2020, 3725254. [Google Scholar] [CrossRef]
- Wang, T.; Tang, W.; Du, L.; Duffield, C.; Wei, Y. Relationships among Risk Management, Partnering, and Contractor Capability in International EPC Project Delivery. J. Manag. Eng. 2016, 32, 04016017. [Google Scholar] [CrossRef]
- Wagner, R. EPC 4.0: The quest for reducing CAPEX in EPC projects. Organ. Technol. Manag. Constr. Int. J. 2020, 12, 2245–2255. [Google Scholar] [CrossRef]
- Piselia, M. 4D BIM implementation to improve EPC project performance from contractor’s perspective. A case study. IOP Conf. Ser. Mater. Sci. Eng. 2020, 930, 012011. [Google Scholar] [CrossRef]
- Tang, W.; Lei, Z.; Wang, S.; Xie, K.; Zhang, Q. Integrated procurement in international EPC projects. Qinghua Daxue Xuebao J. Tsinghua Univ. 2017, 57, 838–844. [Google Scholar] [CrossRef]
- Im, H.; Ha, M.; Kim, D.; Choi, J. Development of an Ontological Cost Estimating Knowledge Framework for EPC Projects. KSCE J. Civ. Eng. 2021, 25, 1578–1591. [Google Scholar] [CrossRef]
- Abanda, H.; Kamsu-Foguem, B.; Tah, J. BIM—New rules of measurement ontology for construction cost estimation. Eng. Sci. Technol. Int. J. 2017, 20, 443–459. [Google Scholar] [CrossRef]
- Liu, X.; Li, Z.; Jiang, S. Ontology-Based Representation and Reasoning in Building Construction Cost Estimation in China. Future Internet 2016, 8, 39. [Google Scholar] [CrossRef] [Green Version]
- Du, L.; Tang, W.; Liu, C.; Wang, S.; Wang, T.; Shen, W.; Huang, M.; Zhou, Y. Enhancing engineer–procure–construct project performance by partnering in international markets: Perspective from Chinese construction companies. Int. J. Proj. Manag. 2016, 34, 30–43. [Google Scholar] [CrossRef]
- Gong, P.; Zeng, N.; Ye, K.; König, M. An empirical study on the acceptance of 4D BIM in EPC projects in China. Sustainability 2019, 11, 1316. [Google Scholar] [CrossRef] [Green Version]
- AlMaian, R.Y.; Needy, K.L.; Walsh, K.D.; Alves, T.D. A Qualitative Data Analysis for Supplier Quality-Management Practices for Engineer-Procure-Construct Projects. J. Constr. Eng. Manag. 2016, 142, 04015061. [Google Scholar] [CrossRef]
- Ham, N.; Moon, S.; Kim, J.H.; Kim, J.-J. Economic Analysis of Design Errors in BIM-Based High-Rise Construction Projects: Case Study of Haeundae L Project. J. Constr. Eng. Manag. 2018, 144, 05018006. [Google Scholar] [CrossRef]
- Aranda, J.Á.; Martin-Dorta, N.; Naya, F.; Conesa-Pastor, J.; Contero, M. Sustainability and Interoperability: An Economic Study on BIM Implementation by a Small Civil Engineering Firm. Sustainability 2020, 12, 9581. [Google Scholar] [CrossRef]
- Back, W.E.; Moreau, K.A. Cost and Schedule Impacts of Information Management on EPC Process. J. Manag. Eng. 2000, 16, 59–70. [Google Scholar] [CrossRef]
- Oyarhossein, M.A.; Bayat Ghiasi, S.H.; Khiali, V. Identifying Barriers of Implementing BIM in Construction. Tech. Rom. J. Appl. Sci. Technol. 2021, 3, 9–20. [Google Scholar] [CrossRef]
- Sacks, R.; Eastman, C.; Lee, G.; Teicholz, P. BIM Handbook: A Guide to Building Information Modeling for Owners, Designers, Engineers, Contractors, and Facility Managers; Wiley: Hoboken, NJ, USA, 2018; ISBN 9781119287537. [Google Scholar] [CrossRef]
- Liu, X.; Wang, X.; Wright, G.; Cheng, J.; Li, X.; Liu, R. A State-of-the-Art Review on the Integration of Building Information Modeling (BIM) and Geographic Information System (GIS). ISPRS Int. J. Geo Inf. 2017, 6, 53. [Google Scholar] [CrossRef] [Green Version]
- Onungwa, I.; Olugu-Uduma, N.; Shelden, D.R. Cloud BIM Technology as a Means of Collaboration and Project Integration in Smart Cities. SAGE Open 2021, 11, 215824402110332. [Google Scholar] [CrossRef]
- Jang, R.; Collinge, W. Improving BIM asset and facilities management processes: A Mechanical and Electrical (M&E) contractor perspective. J. Build. Eng. 2020, 32, 101540. [Google Scholar] [CrossRef]
- Alonso, R.; Borras, M.; Koppelaar, R.H.E.M.; Lodigiani, A.; Loscos, E.; Yöntem, E. SPHERE: BIM Digital Twin Platform. Proceedings 2019, 20, 9. [Google Scholar] [CrossRef] [Green Version]
- Pan, Y.; Zhang, L. Roles of artificial intelligence in construction engineering and management: A critical review and future trends. Autom. Constr. 2021, 122, 103517. [Google Scholar] [CrossRef]
- Sacks, R.; Eastman, C.M.; Lee, G. Process improvements in precast concrete construction using top-down parametric 3-D computer-modeling. PCI J. 2003, 48, 46–55. [Google Scholar] [CrossRef]
- Won, J.; Cheng, J.; Lee, G. Quantification of construction waste prevented by BIM-based design validation: Case studies in South Korea. Waste Manag. 2016, 49, 170–180. [Google Scholar] [CrossRef]
- Kaner, I.; Sacks, R.; Kassian, W.; Quitt, T. Case studies of BIM adoption for precast concrete design by mid-sized structural engineering firms. J. Inf. Technol. Constr. 2008, 13, 303–323. [Google Scholar]
- Khanzode, A.; Fischer, M.; Reed, D. Benefits and lessons learned of implementing building virtual design and construction(VDC) technologies for coordination of mechanical, electrical, and plumbing (MEP) systems on a large healthcare project. J. Inf. Technol. Constr. 2008, 13, 324–342. [Google Scholar]
- Williams, M. Building-Information Modeling Improves Efficiency, Reduces Need for Changes. Available online: http://www.bizjournals.com/louisville/print-edition/2011/07/08/building-information-modeling-improves.html (accessed on 17 August 2021).
- Azhar, S. Building information modeling (BIM): Trends, benefits, risks, and challenges for the AEC industry. Leadersh. Manag. Eng. 2011, 11, 241–252. [Google Scholar] [CrossRef]
- Lee, G.; Park, K.; Won, J. D3 City project: Economic impact of BIM-assisted design validation. Autom. Constr. 2012, 22, 577–586. [Google Scholar] [CrossRef]
- Ministry of Public Security, PRC. Gb50016-2014 Code for Fire Prevention in Building Design; China Planning Press: Beijing, China, 2014. [Google Scholar]
- National Standard of the People’s Republic of China. GB 50352-2019: Uniform Standard for Design of Civil Buildings; China Architecture & Building Press: Beijing, China, 2019. [Google Scholar]
- Qin, Z.; Yu, Y.; Liu, D. The Effect of HOPSCA on Residential Property Values: Exploratory Findings from Wuhan, China. Sustainability 2019, 11, 471. [Google Scholar] [CrossRef] [Green Version]
- Nguyen, V.T.; Nguyen, B.N.; Nguyen, T.Q.; Dinh, H.T.; Chu, A.T. The Impact of the COVID-19 on the Construction Industry in Vietnam. Int. J. Built Environ. Sustain. 2021, 8, 47–61. [Google Scholar] [CrossRef]
- Rainey, S.; Mormina, M.; Lignou, S.; Nguyen, J.; Larsson, P. The Post-Normal Challenges of COVID-19: Constructing Effective and Legitimate Responses. Sci. Public Policy 2021, 48, 592–601. [Google Scholar] [CrossRef] [PubMed]
- Timilsina, S.; Ojha, S.; Dhungana, B. Impact of Covid-19 on Construction Industry of Nepal. Mod. Econ. 2021, 12, 1232–1244. [Google Scholar] [CrossRef]
- Ndukwe, C.; Liu, J.; Chan, T. Impact of COVID-19 on the China-Australia Construction Supply Chain. In Proceedings of the 25th International Symposium on Advancement of Construction Management and Real Estate, Wuhan, China, 28–30 November 2020; pp. 1275–1291, ISBN 978-981-16-3586-1. [Google Scholar] [CrossRef]
- UK BIM Framework. Guidance. Available online: https://www.ukbimframework.org/guidance/ (accessed on 17 August 2021).
- UK NBS. BIM Levels Explained. Available online: https://www.thenbs.com/knowledge/bim-levels-explained (accessed on 17 August 2021).
- Anonymous. The New Policy at Home and Abroad | BIM Policy Standard Summary List (Detailed). Available online: https://www.sohu.com/a/240872439_760987 (accessed on 17 August 2021).
- McGraw-Hill. The Business Value of BIM in Europe. Getting Building Information Modelling to the Bottom Line in the United Kingdom, France and Germany. 2010. Available online: http://images.autodesk.com/adsk/files/business_value_of_bim_in_europe_smr_final.pdf (accessed on 21 October 2021).
- BSI. Constructing the Business Case: Building Information Modelling; British Standards Institution and Building SMART UK: London/Surrey, UK, 2010. [Google Scholar]
- United-BIM. BIM Maturity Levels Explained—Level 0, Level 1, Level 2, Level 3. Available online: https://www.united-bim.com/bim-maturity-levels-explained-level-0-1-2-3/ (accessed on 21 October 2021).
- Carlos Terol. BIM Level 3: Is the Industry Ready? Available online: https://www.globalcad.co.uk/bim-level-3-is-the-industry-ready/ (accessed on 21 October 2021).
- Esser, S.; Vilgertshofer, S.; Borrmann, A. Graph-based version control for asynchronous BIM level 3 collaboration. In Proceedings of the 28th EG-ICE International Workshop on Intelligent Computing in Engineering, Berlin, Germany, 6–8 June 2021. [Google Scholar]
- Zhang, K.; Jia, J. Promotion of the Application of BIM in China—A BIM-Based Model for Construction Material Recycling. Recycling 2021, 6, 16. [Google Scholar] [CrossRef]
Figure 1.
Cost performance of 27 projects.
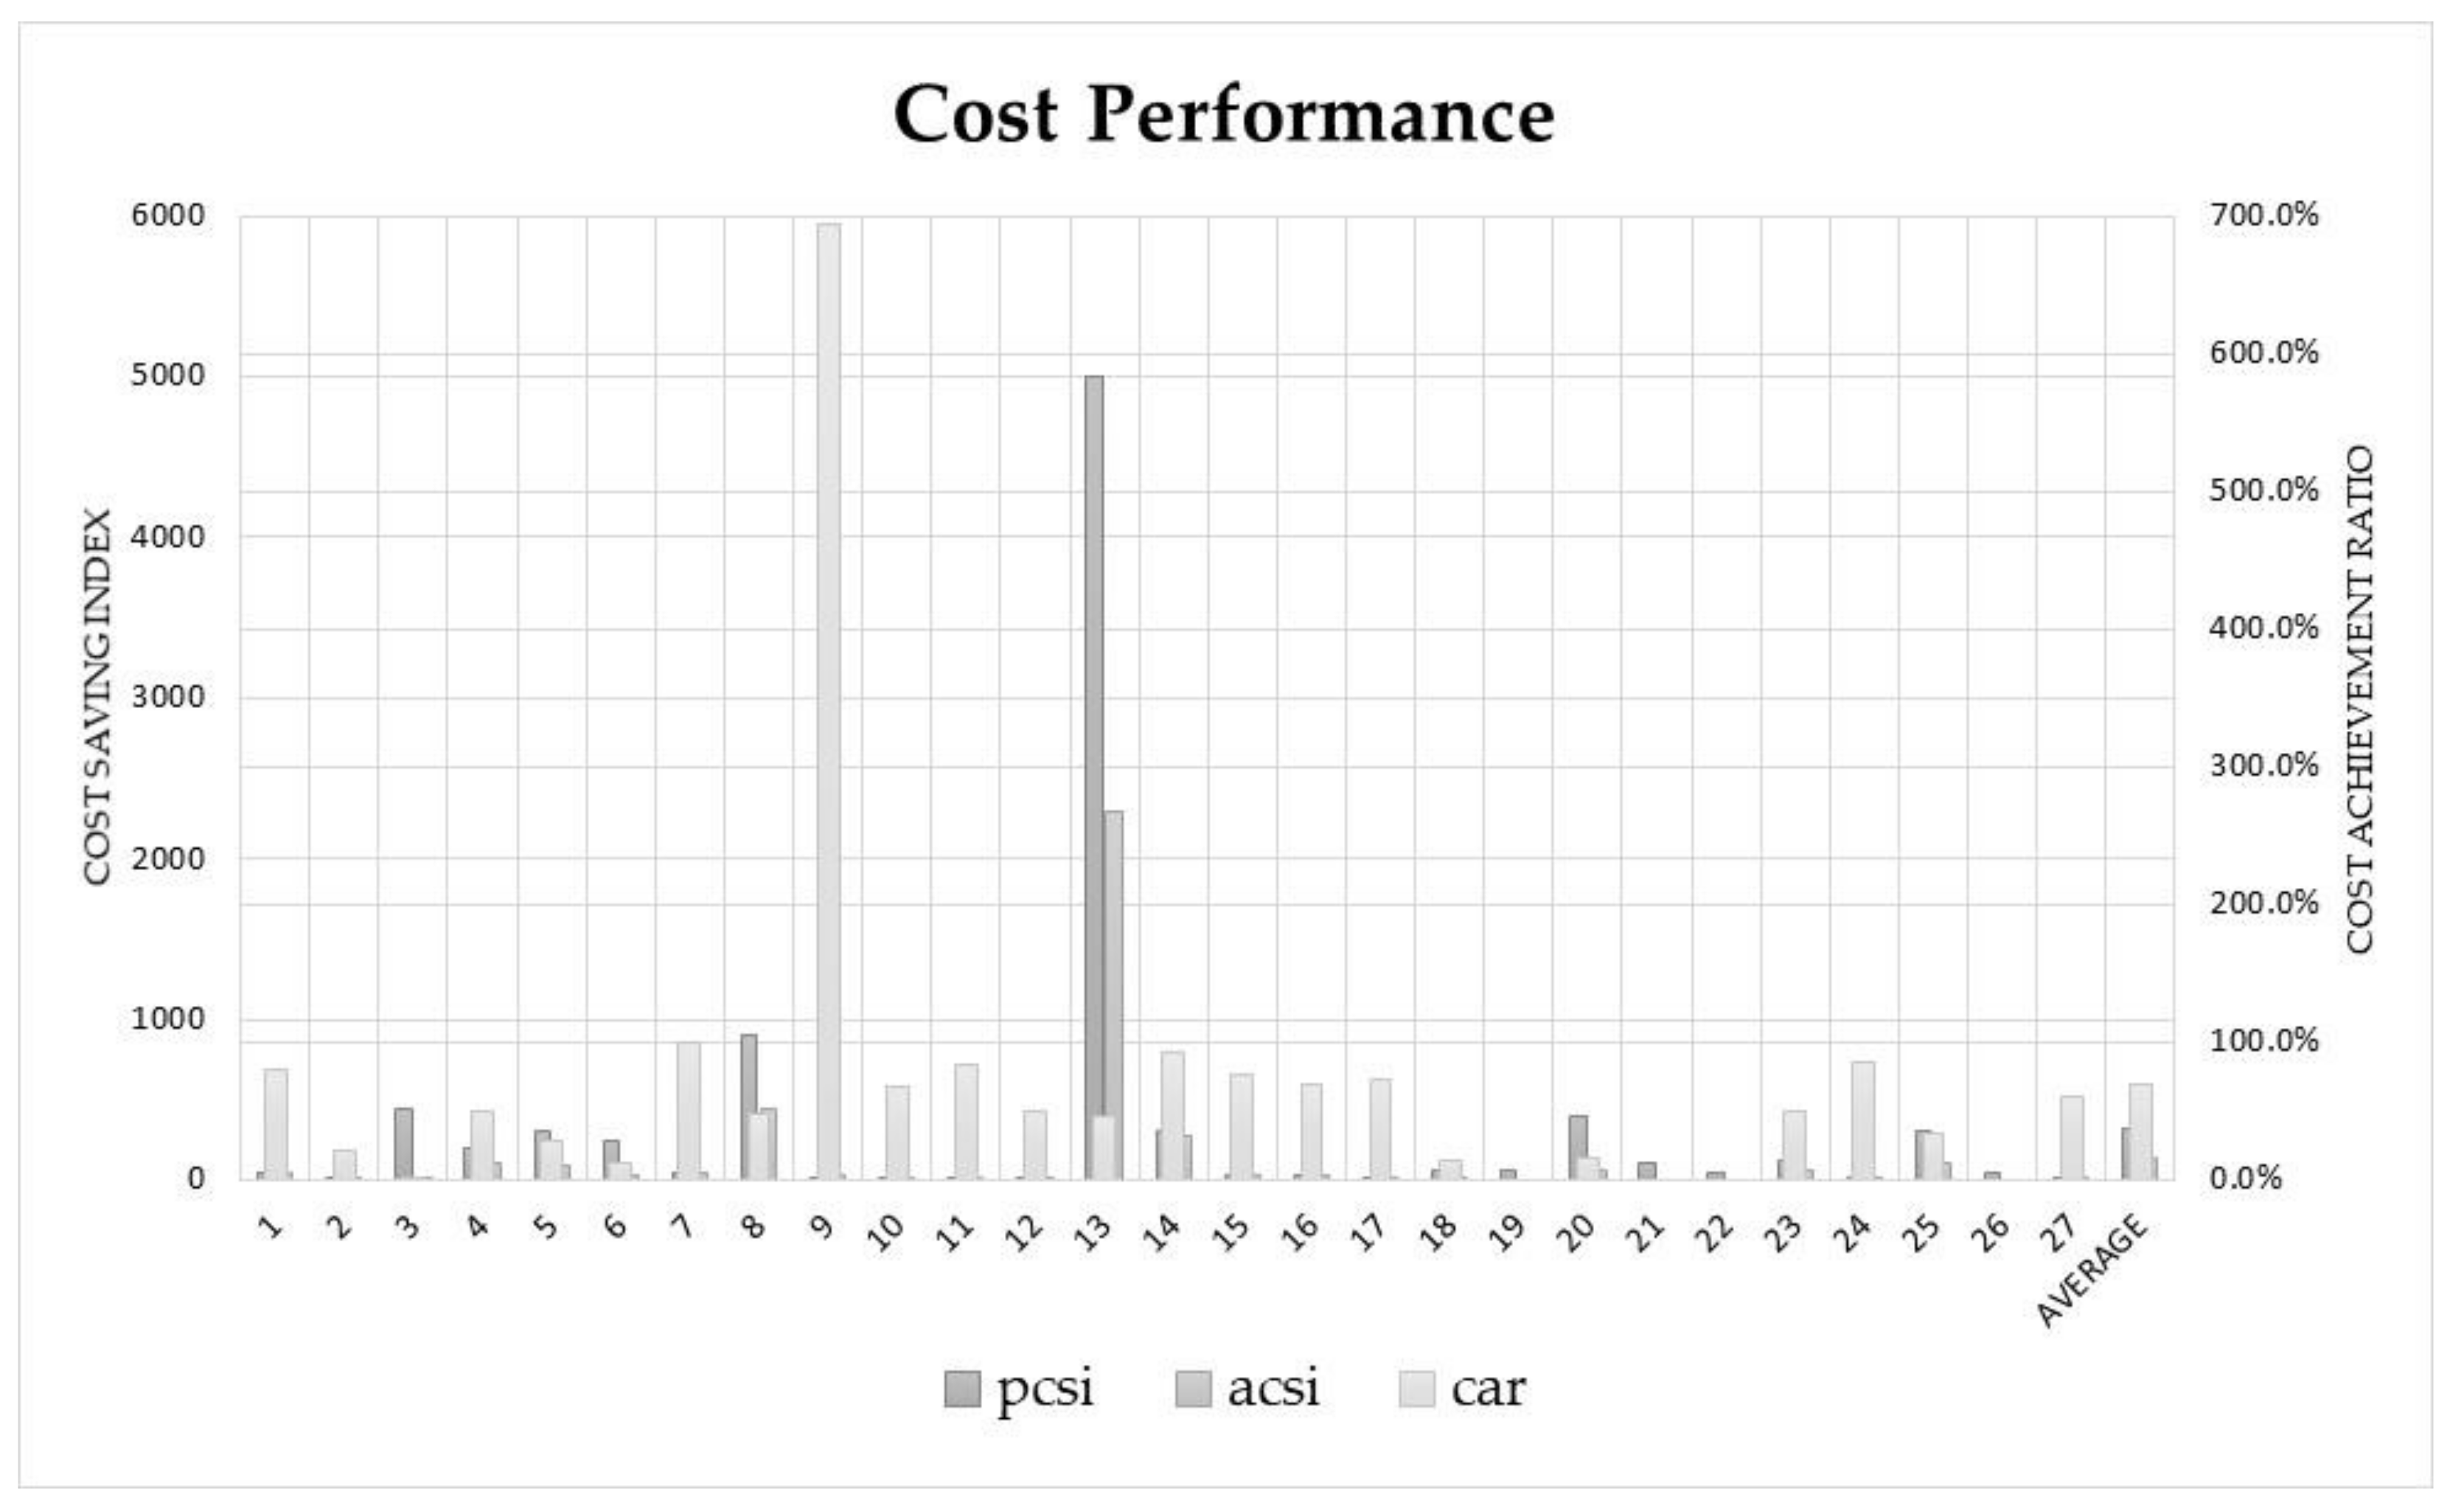
Figure 2.
Normal distribution (25 samples).
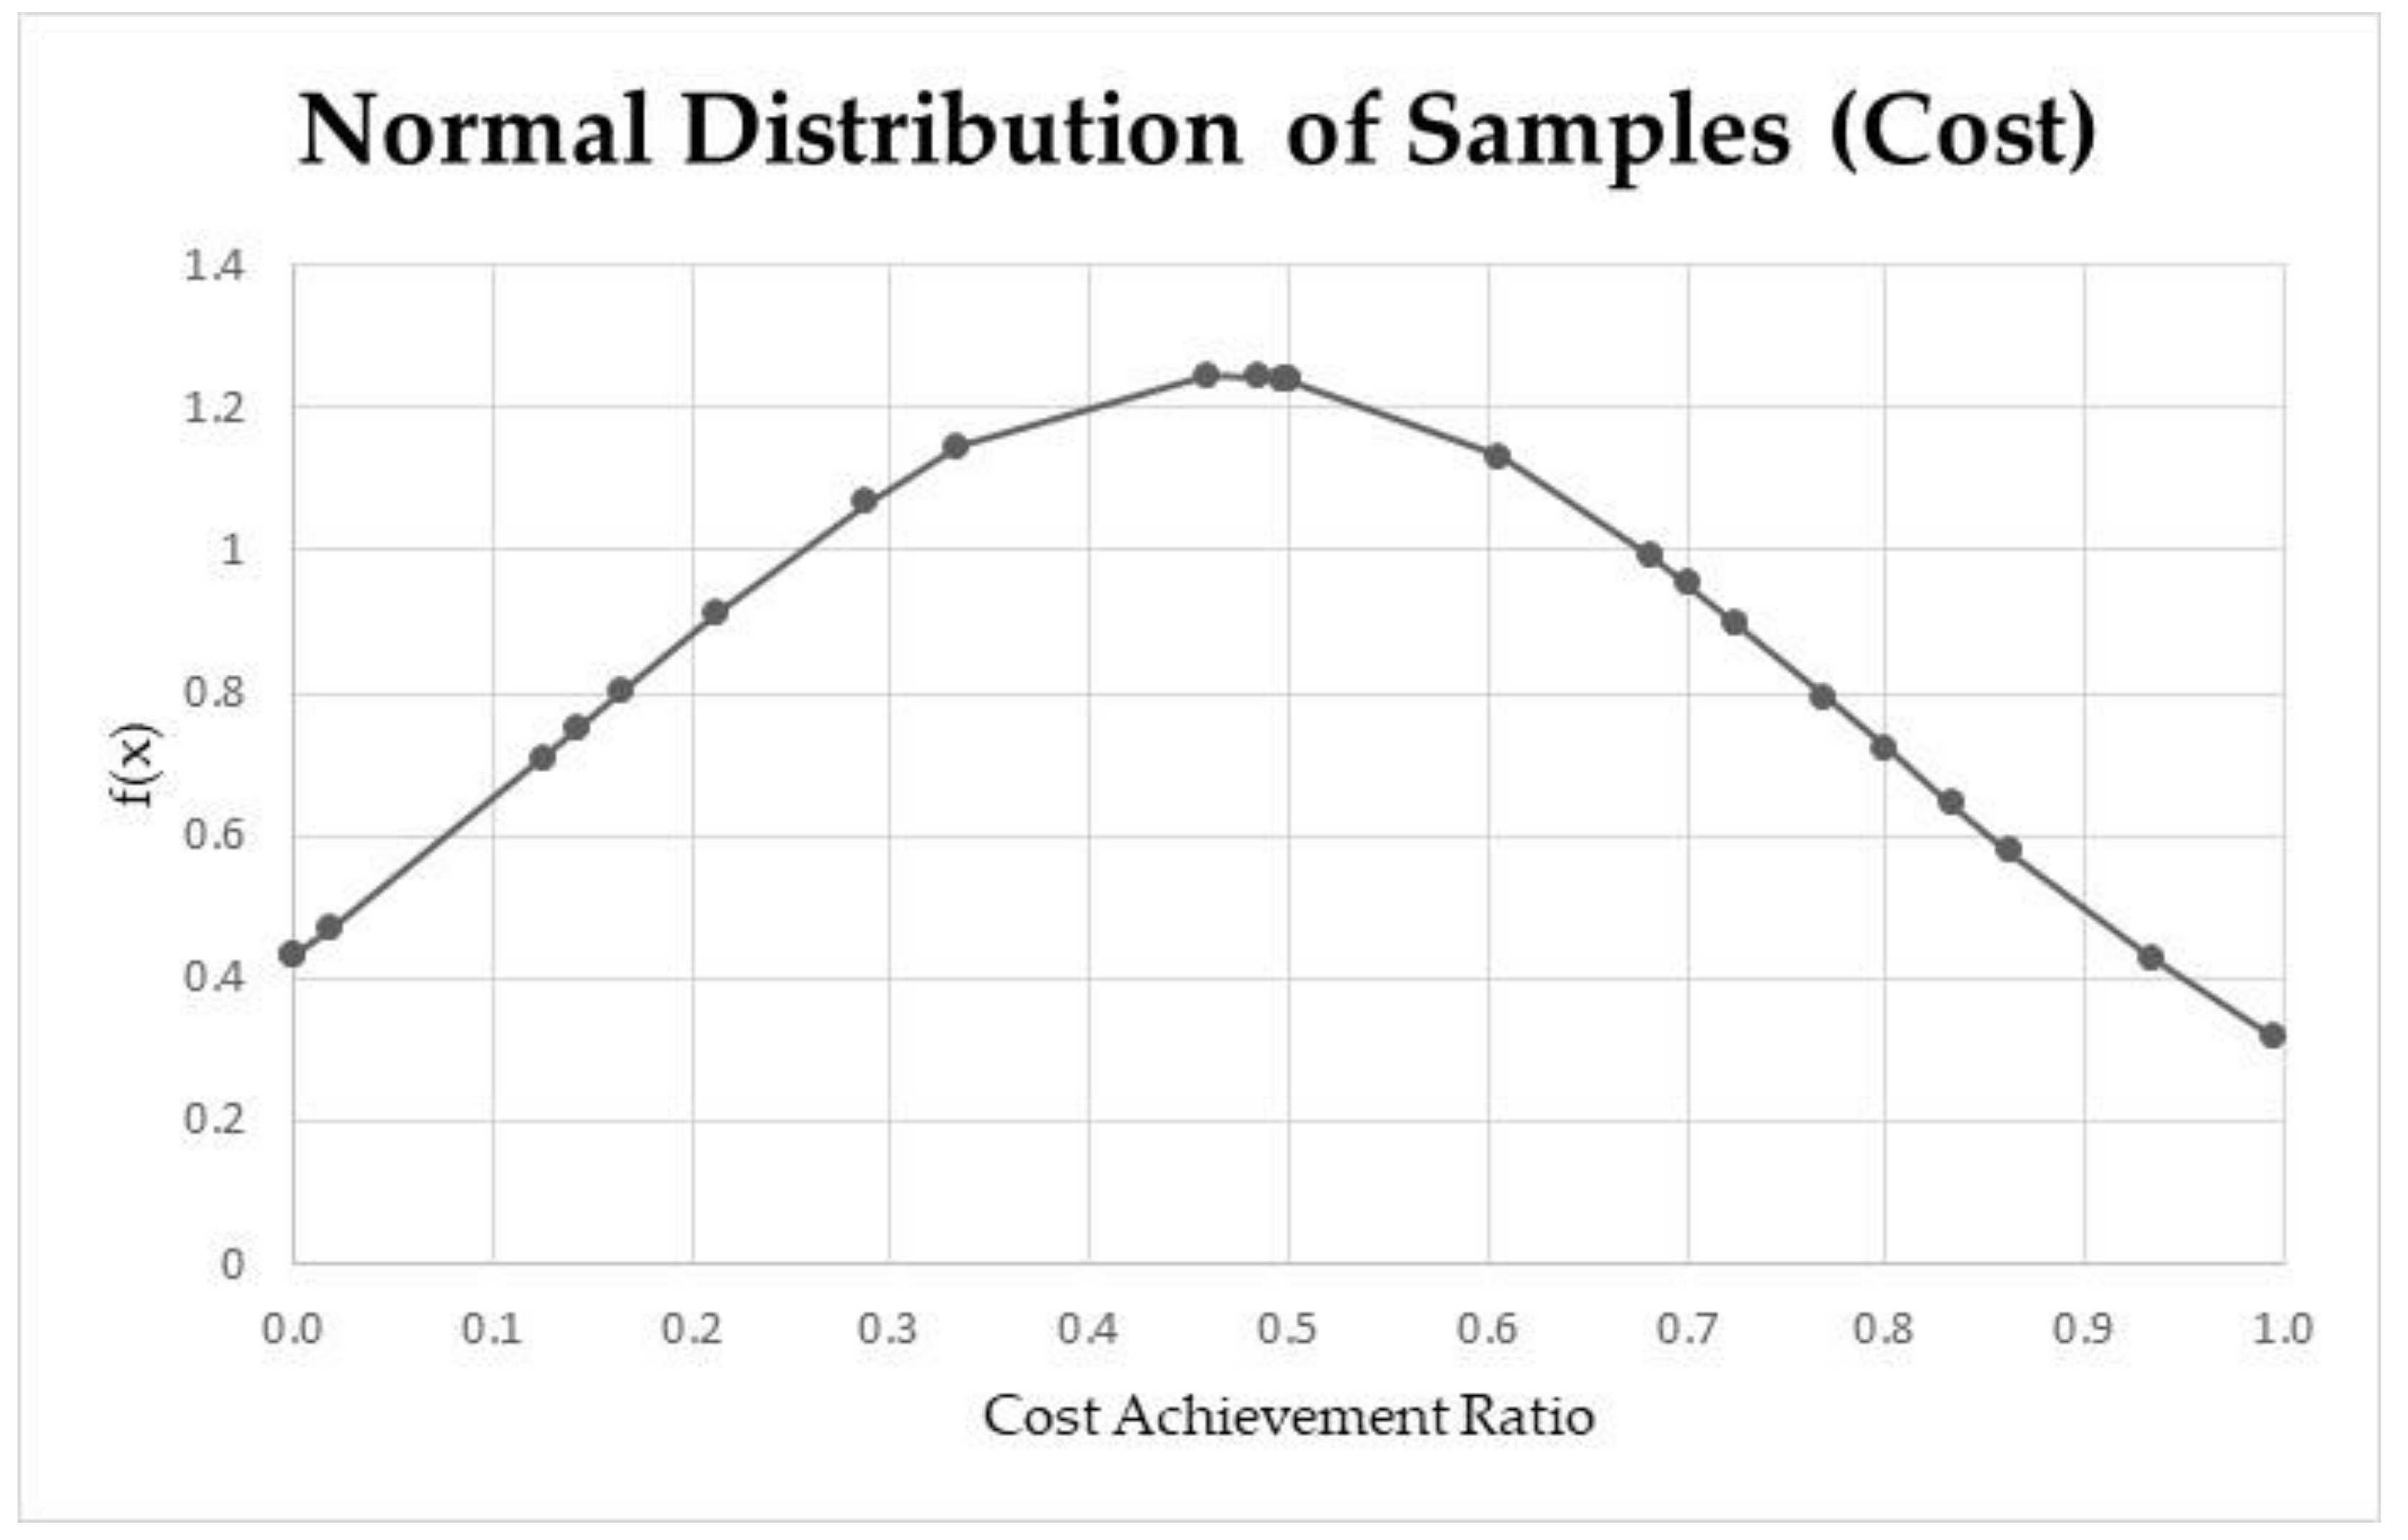
Figure 3.
Time performance.
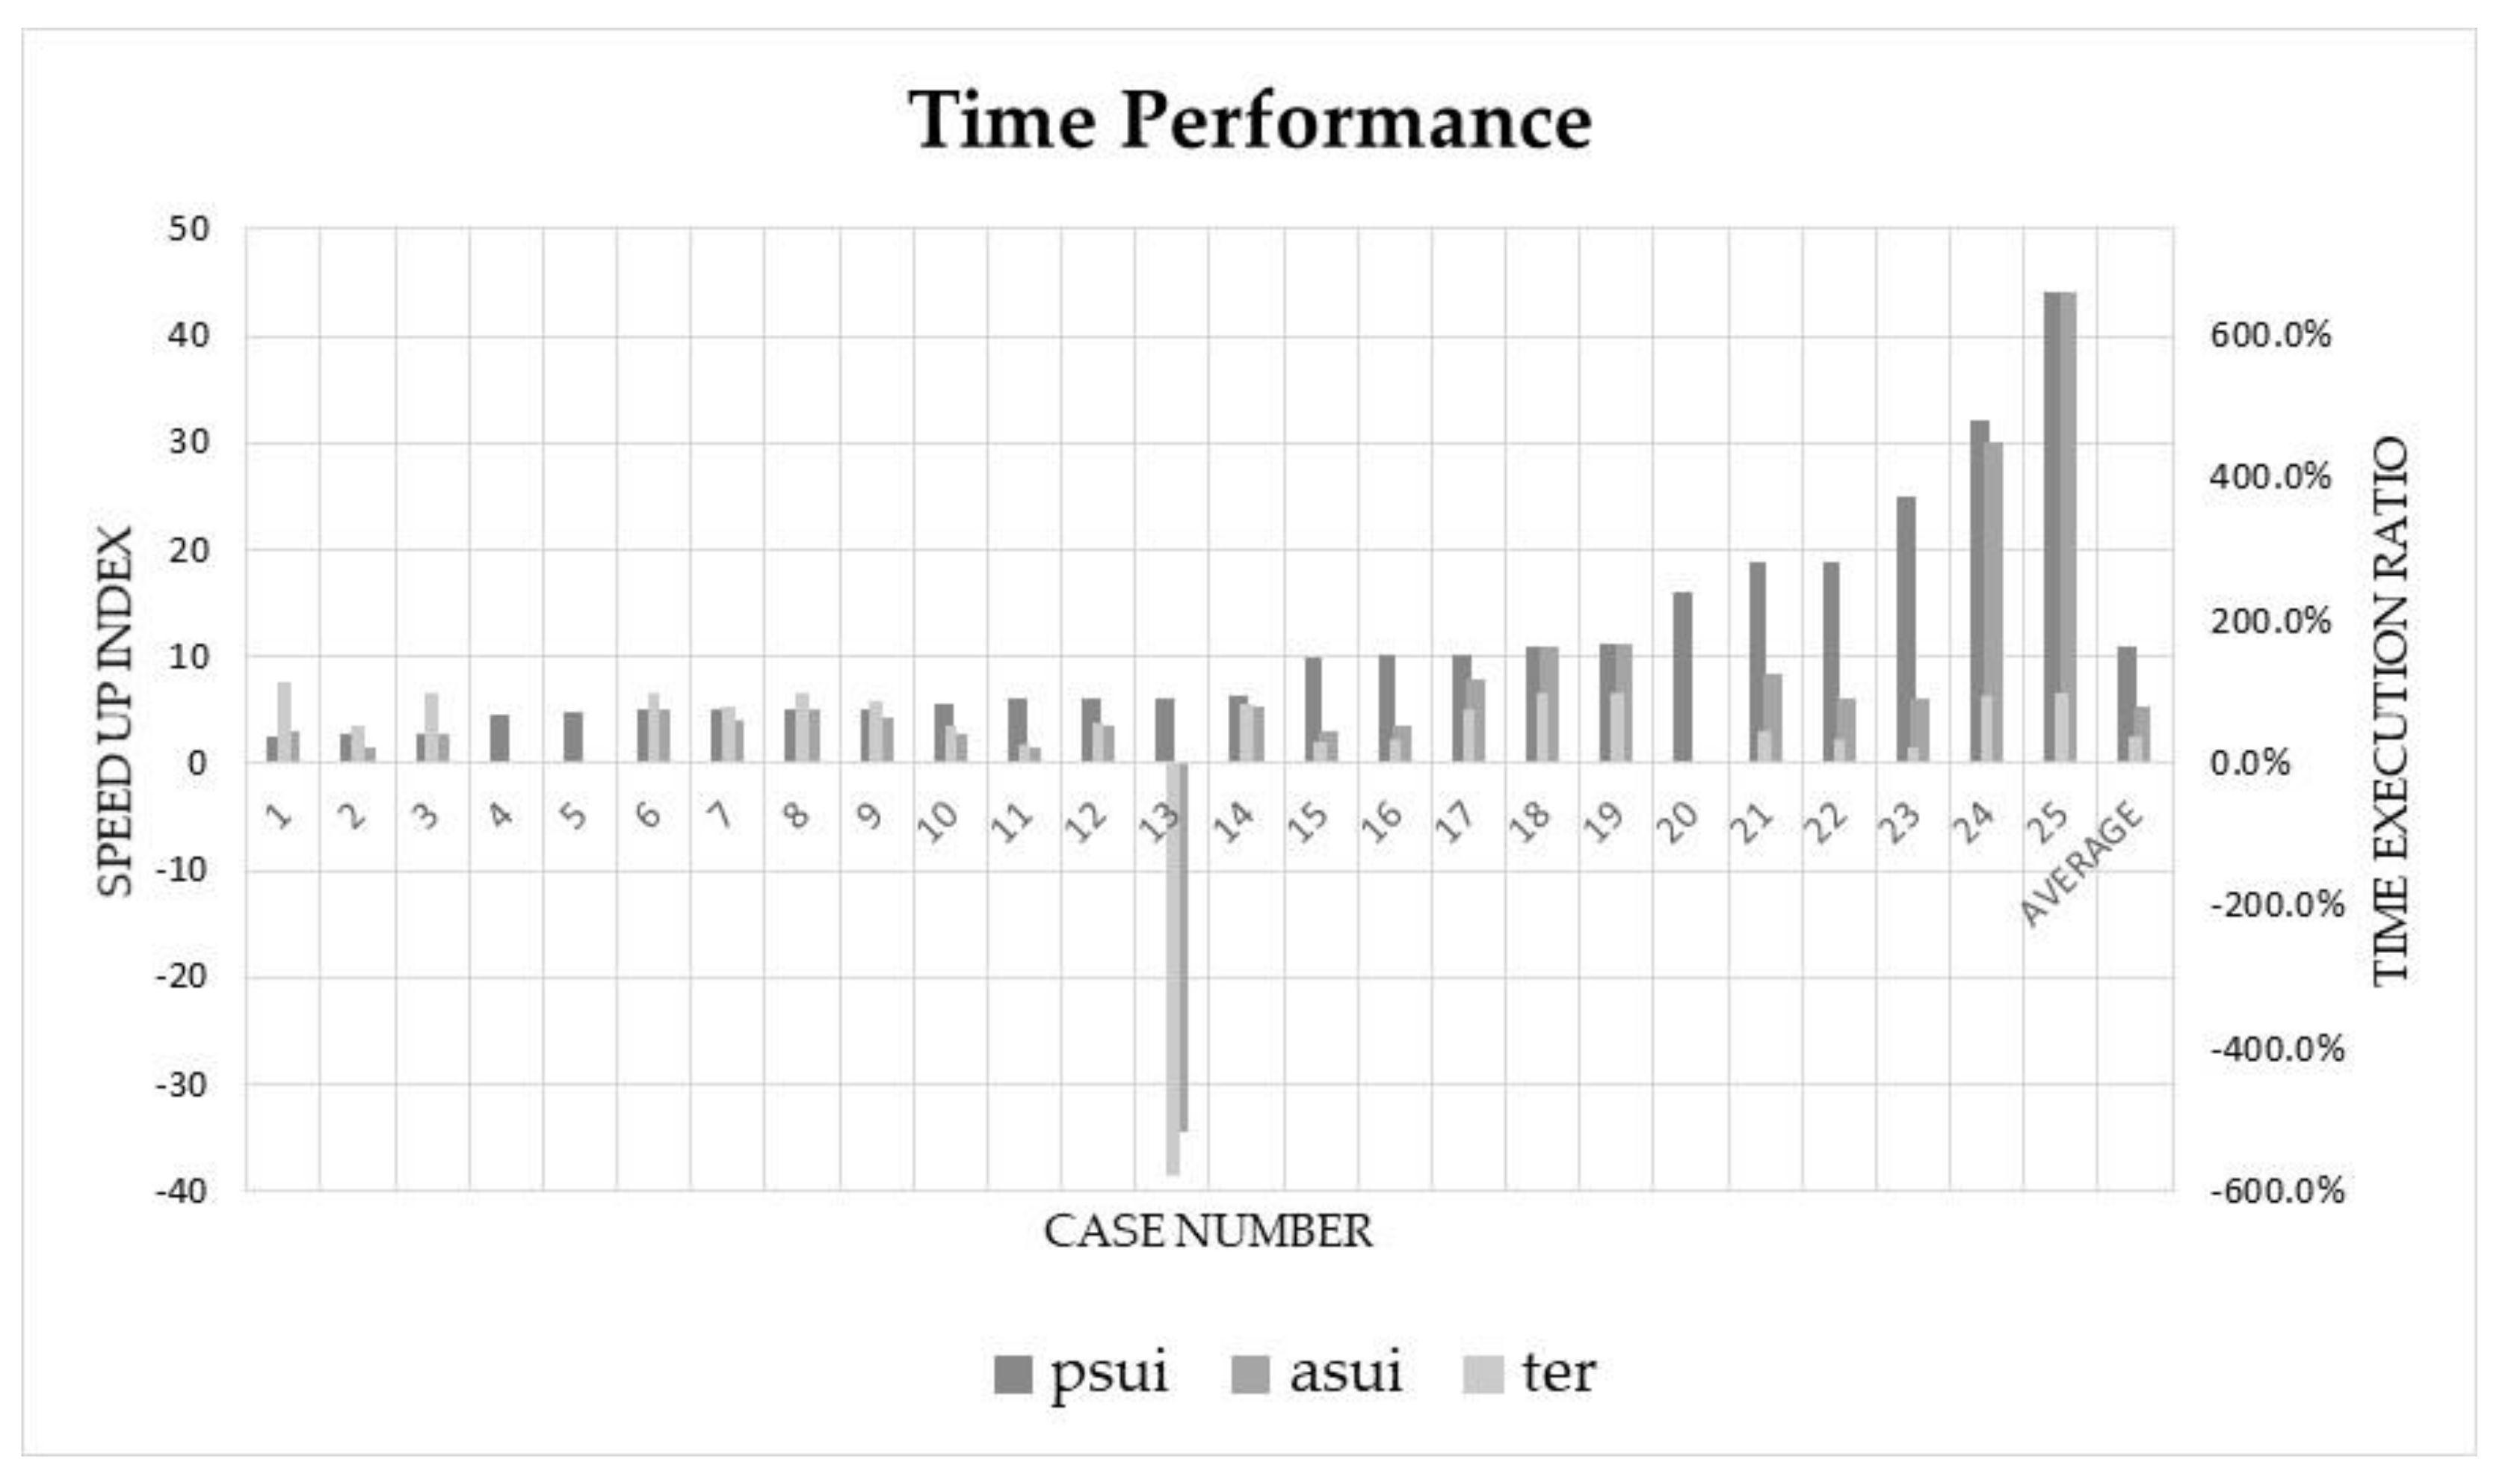
Figure 4.
Normal distribution of time (23 samples).

Table 1.
Main variables.
| Main Variables | |||
|---|---|---|---|
| 1 | Location | 6 | Expected(Testing) Economical Performance |
| 2 | Building Type | 7 | Actual Economical Performance |
| 3 | Problems | 8 | Expected(Testing) Time Performance |
| 4 | Technology Used | 9 | Actual time Performance |
| 5 | Technology Purpose | 10 | Experience of User |
Table 2.
Unified environment factor criteria.
| Unified Environment Factors Criteria | |||
|---|---|---|---|
| NO | Standard | Content | Location |
| 1 | ISO 16739 | Industry Foundation Classes (IFC) for data sharing in the construction and facility management industries | International |
| 2 | ISO 29481 | Building information models—Information delivery manual | International |
| 3 | ISO 12006 | Building construction—Organization of information about construction works | International |
| 4 | ISO 19650 | Organisation of information about construction works—Information management using building information modelling | International |
| 5 | PAS 1192-5:2015 | Specification for security-minded building information modelling, digital built environments and smart asset management. | International |
| 6 | PAS 1192-3:2014 | Specification for information management for the operational phase of assets using building information modelling (BIM) | UK |
| 7 | AEC (UK) BIM Protocol | Implementing UK BIM Standards for the Architectural, Engineering and Construction industry | UK |
| 8 | BS 1192-4:2014 | Collaborative production of information. Fulfilling employer’s information exchange requirements using COBie. | UK |
| 9 | BS 8536-1:2015 | Briefing for design and construction. Code of practice for facilities management (Buildings infrastructure) | UK |
| 10 | GB/T51212-2016 | Unified standard for building information modeling | P.R.China |
| 11 | DB34/T 3838-2021 | Standard for classification and coding of highway engineering building information model | P.R.China |
| 12 | GB/T51301-2018 | Deliver Standard of Building Design-Information Modeling | P.R.China |
| 13 | GB/T51362-2019 | Application standard for manufacturing industry design information model | P.R.China |
| 14 | GB/T51235-2017 | Standard for building information modeling in construction | P.R.China |
Table 3.
On-site investigation schedule.
| On-Site Investigation | |||
|---|---|---|---|
| NO | Location | Building Type | Assigned Time |
| 1 | SHENZHEN, CHINA | Commercial | 13 April 2019 |
| 2 | NANJING, CHINA | Residential | 14 March 2019 |
| 3 | ZHOUSHAN, CHINA | Specialty | 20 March 2019 |
| 4 | CHONGQING, CHINA | Civil Engineering Structure | 13 May 2019 |
Table 4.
Personnel attributes.
| Personal Attributes | ||
|---|---|---|
| Position | Number of Respondents | Percentage (%) |
| Project manager | 16 | 0.258065 |
| General engineer | 8 | 0.129032 |
| Designer | 13 | 0.209677 |
| Key Engineer | 19 | 0.306452 |
| Cost engineer | 6 | 0.096774 |
| Total | 62 | 1 |
Table 5.
Location information of cases.
| Location Information of Cases | |||
|---|---|---|---|
| Region | Frequency of Case | Province | City |
| East China | 10 cases | Shanghai | Shanghai |
| Shanghai | Shanghai | ||
| Shanghai | Shanghai | ||
| Anhui | Chuzhou | ||
| Anhui | Jingdezhen | ||
| Shandong | Qingdao | ||
| Jiangsu | Nanjing | ||
| Jiangsu | Yancheng | ||
| Jiangxi | Nanchang | ||
| Zhejiang | Zhoushan | ||
| Central China | 2 cases | Hunan | Ningxiang |
| Hunan | Changsha | ||
| North China | 6 cases | Beijing | Beijing |
| Beijing | Beijing | ||
| Beijing | Beijing | ||
| Jilin | Changchun | ||
| Tianjin | Tianjin | ||
| Heilongjiang | Harbin | ||
| South China | 8 cases | Guangdong | Shenzhen |
| Guangdong | Shenzhen | ||
| Guangdong | Shenzhen | ||
| Guangdong | Guangzhou | ||
| Guangdong | Shenzhen | ||
| Guangxi | Nanning | ||
| Guangxi | Nanning | ||
| Guangxi | Nanning | ||
| Southwest China | 6 cases | Chongqing | Chongqing |
| Sichuan | Chengdu | ||
| Sichuan | Luzhou | ||
| Sichuan | Chengdu | ||
| Chongqing | Chongqing | ||
| Chongqing | Chongqing | ||
| Oversea | 1 cases | The United States | Saipan |
Table 6.
Building type information of cases.
| Building Type Info of Cases | ||
|---|---|---|
| Case Number | Building Type (Main) | Building Type (Specification) |
| 1 | Commercial | Hotel |
| 2 | Commercial | Retail |
| 3 | Specialty | Civic |
| 4 | Commercial | Office |
| 5 | Commercial | Office |
| 6 | Specialty | Gym |
| 7 | Commercial | Office + Retail |
| 8 | Specialty | Healthcare |
| 9 | HOPSCA | Office + Retail + Apartment |
| 10 | Residential | Apartment |
| 11 | Commercial | Office + Retail |
| 12 | Specialty | Civic |
| 13 | Specialty | Transport + Civic |
| 14 | Commercial | Office + Retail + Special Purpose |
| 15 | Commercial | Hotels |
| 16 | Infrastructure | Sewage plant |
| 17 | Residential | Apartment |
| 18 | Commercial | Retail + Theme park |
| 19 | Specialty | Government |
| 20 | Specialty | Civic + Transport |
| 21 | Commercial | Retail |
| 22 | Commercial | Office |
| 23 | Specialty | Transport |
| 24 | Specialty | Religion |
| 25 | Commercial | Retail |
| 26 | HOPSCA | Office + Retail + Apartment + Hotels |
| 27 | Civil Engineering structure | Tunnel + Bridge |
| 28 | Specialty | Museum |
| 29 | Commercial | Retail |
| 30 | Specialty | Gym |
| 31 | HOPSCA | Office + Retail + Apartment + Hotels |
| 32 | Residential | Apartment |
| 33 | Specialty | Healthcare |
Table 7.
Purposes of technology utilization.
| Purposes of Tech Utilization | |||
|---|---|---|---|
| No | Purpose of Digital Tech | Frequency | Frequency over all Data Case |
| 1 | Construction Schedule Management | 29 | 88% |
| 2 | Construction Safety Management | 28 | 85% |
| 3 | Data Environment | 27 | 82% |
| 4 | Visualization | 24 | 73% |
| 5 | Prefabricated Component | 19 | 58% |
| 6 | Construction Quality Management | 18 | 55% |
| 7 | Special Structure Assembling | 17 | 52% |
| 8 | Collaboration | 17 | 52% |
| 9 | Asset Information Model | 16 | 48% |
| 10 | On-site construction management | 14 | 42% |
| 11 | Cost Estimation | 14 | 42% |
| 12 | Site Layout Planning | 13 | 39% |
| 13 | Special Structure Design | 13 | 39% |
| 14 | Multi-disciplinary Technical Design | 8 | 24% |
| 15 | Geological model | 6 | 18% |
| 16 | Blasting and Earthwork Engineering | 5 | 15% |
| 17 | Historical Building protection | 2 | 6% |
| 18 | Mechanics Analysis | 1 | 3% |
Table 8.
Digitalization improvement (technology utilization) for particular purpose(s).
| Digitalization Improvement (Technology Utilization) for Purpose(s) | |||||
|---|---|---|---|---|---|
| No | Purpose (Ranking#) | Tech & Describe | No | Purpose (Ranking#) | Tech & Describ |
| 1 | Site Layout Planning (3) | 1. 3D modeling 2. VR 3. 3D Laser scanning 4. Oblique photography 5. GIS 6. 4D SCHEDULING 7. 4D Assembling | 9 | Construction Quality Management (1) | 1. 3D modeling 2. VR 3. AR 4. Solid Model (include 3D printing) 5. 3D Laser scanning 6. Oblique photography 7. Lofting robot 8. IoT 9. Collaboration platform |
| 2 | Blasting and Earthwork Engineering (4) | 1. 3D Laser scanning 2. Oblique photography 3. GIS 4. 4D SCHEDULING 5. Lofting robot 6. 5D BIM | |||
| 10 | Special Structure Design (15) | 1. 3D modeling | |||
| 3 | Construction Schedule Management (7) | 1. 3D Laser scanning 2. Oblique photography 3. 4D SCHEDULING 4. 4D Assembling 5. Lofting robot | 11 | Historical Building protection (4) | 1. 3D modeling 2. VR 3. 3D Laser scanning 4. 4D Assembling 5. Lofting robot 6. IoT |
| 4 | Visualization (4) | 1. 3D modeling 2. VR 3. AR 4. Solid Model (include 3D printing) 5. 3D Laser scanning 6. Oblique photography | 12 | Special Structure Assembling (7) | 1. VR 2. AR 3. Solid Model (include 3D printing) 4. 4D SCHEDULING 5. 4D Assembling |
| 5 | Prefabricated Component (12) | 1. 3D modeling 2. Solid Model (include 3D printing) | 13 | Geological model (9) | 1. 3D modeling 2. 3D Laser scanning 3. GIS 4. IoT |
| 6 | Data Environment (12) | 1. CDE 2. Collaboration platform | 14 | Multi-disciplinary Technical Design (15) | 1. 3D modeling |
| 7 | Construction Safety Management (1) | 1. 3D modeling 2. VR 3. 3D Laser scanning 4. Oblique photography 5. GIS 6. 4D Assembling 7. Lofting robot 8. IoT 9. Collaboration platform 10. AI | 15 | On-site construction management (10) | 1. IoT 2. 5D BIM 3. AI |
| 16 | Collaboration (12) | 1. CDE 2. Collaboration platform | |||
| 17 | Mechanics Analysis (15) | 1. 5D BIM | |||
| 8 | Asset Information Model (10) | 1. IoT 2. CDE 3. 3D modeling | 18 | Cost Estimation (15) | 1. 5D BIM |
Table 9.
Cost performance.
| Cost Performance | |||||
|---|---|---|---|---|---|
| Case No | PCS (yuan/m2) | ACS (yuan/m2) | Case No | PCS (yuan/m2) | ACS (yuan/m2) |
| 1 | 3.0 | 2.5 | 15 | 56.0 | 7.0 |
| 2 | 3.4 | 1.7 | 16 | 71.8 | 35.9 |
| 3 | 4.2 | 28.9 | 17 | 79.6 | 74.3 |
| 4 | 7.4 | 6.3 | 18 | 95.5 | 0.0 |
| 5 | 9.4 | 5.7 | 19 | 95.7 | 46.4 |
| 6 | 11.6 | 8.4 | 20 | 147.5 | 2.7 |
| 7 | 13.2 | 2.8 | 21 | 190.5 | 95.2 |
| 8 | 16.4 | 0.0 | 22 | 192.1 | 0.0 |
| 9 | 18.3 | 12.5 | 23 | 195.4 | 56.2 |
| 10 | 18.5 | 2.6 | 24 | 382.5 | 127.5 |
| 11 | 23.9 | 0.0 | 25 | 522.7 | 418.2 |
| 12 | 28.5 | 19.9 | 26 | 939.3 | 155.6 |
| 13 | 34.0 | 33.8 | 27 | 3500.0 | 1610.0 |
| 14 | 42.4 | 32.6 | |||
Table 10.
Time performance.
| Time Performance | |||||
|---|---|---|---|---|---|
| Case No | PTS (days/m2) | ATS (days/m2) | Case No | PTS (days/m2) | ATS (days/m2) |
| 1 | 2.6% | 3.0% | 14 | 6.4% | 5.4% |
| 2 | 2.7% | 1.4% | 15 | 10.0% | 3.0% |
| 3 | 2.7% | 2.7% | 16 | 10.1% | 3.5% |
| 4 | 4.6% | 0.0% | 17 | 10.3% | 8.0% |
| 5 | 4.8% | 0.0% | 18 | 11.0% | 11.0% |
| 6 | 5.0% | 5.0% | 19 | 11.2% | 11.1% |
| 7 | 5.0% | 4.0% | 20 | 16.0% | 0.0% |
| 8 | 5.0% | 5.0% | 21 | 18.9% | 8.4% |
| 9 | 5.0% | 4.4% | 22 | 18.9% | 6.1% |
| 10 | 5.6% | 2.9% | 23 | 25.0% | 6.0% |
| 11 | 6.0% | 1.5% | 24 | 32.0% | 30.0% |
| 12 | 6.0% | 3.4% | 25 | 44.0% | 44.0% |
| 13 | 6.0% | −34.6% | |||
Table 11.
Technology utilization.
| Technology Utilization | |
|---|---|
| Technology Name | Frequency |
| 3D modeling | 9 |
| 3D Laser scanning | 8 |
| VR | 6 |
| Oblique photography | 6 |
| IoT | 6 |
| 4D Assembling | 5 |
| Lofting robot | 5 |
| Solid Model(include 3D printing) | 4 |
| GIS | 4 |
| 4D SCHEDULING | 4 |
| 5D BIM | 4 |
| Collaboration platform | 4 |
| AR | 3 |
| CDE | 3 |
| AI | 2 |
Publisher’s Note: MDPI stays neutral with regard to jurisdictional claims in published maps and institutional affiliations. |
© 2021 by the authors. Licensee MDPI, Basel, Switzerland. This article is an open access article distributed under the terms and conditions of the Creative Commons Attribution (CC BY) license (https://creativecommons.org/licenses/by/4.0/).
Share and Cite
MDPI and ACS Style
Zheng, Y.; Tang, L.C.M.; Chau, K.W. Analysis of Improvement of BIM-Based Digitalization in Engineering, Procurement, and Construction (EPC) Projects in China. Appl. Sci. 2021, 11, 11895. https://doi.org/10.3390/app112411895
AMA Style
Zheng Y, Tang LCM, Chau KW. Analysis of Improvement of BIM-Based Digitalization in Engineering, Procurement, and Construction (EPC) Projects in China. Applied Sciences. 2021; 11(24):11895. https://doi.org/10.3390/app112411895
Chicago/Turabian StyleZheng, Yu, Llewellyn C. M. Tang, and K. W. Chau. 2021. "Analysis of Improvement of BIM-Based Digitalization in Engineering, Procurement, and Construction (EPC) Projects in China" Applied Sciences 11, no. 24: 11895. https://doi.org/10.3390/app112411895
Note that from the first issue of 2016, this journal uses article numbers instead of page numbers. See further details here.