Article

Thymoquinone Inhibits Growth of Acute Myeloid Leukemia Cells through Reversal SHP-1 and SOCS-3 Hypermethylation: In Vitro and In Silico Evaluation

by
Futoon Abedrabbu Al-Rawashde
1,
Muhammad Farid Johan
2,
Wan Rohani Wan Taib
1,
Imilia Ismail
1,
Syed Ahmad Tajudin Tuan Johari
3,
Belal Almajali
1,
Abdullah Saleh Al-wajeeh
4,
Mansoureh Nazari Vishkaei
5 and
Hamid Ali Nagi Al-Jamal
1,*
1
School of Biomedicine, Faculty of Health Sciences, Universiti Sultan Zainal Abidin (UniSZA), Kuala Nerus 21300, Terengganu, Malaysia
2
Department of Haematology, School of Medical Sciences, Universiti Sains Malaysia, Kubang Kerian 16150, Kelantan, Malaysia
3
Centre for Research in Infectious Diseases and Biotechnology (CeRIDB), Faculty of Medicine, Universiti Sultan Zainal Abidin, Kuala Terengganu 20400, Terengganu, Malaysia
4
Anti-Doping Lab Qatar, Doha P.O. Box 27775, Qatar
5
School of Pharmacy, University of 17 August 1945, Jakarta 14350, Indonesia
*
Author to whom correspondence should be addressed.
Pharmaceuticals 2021, 14(12), 1287; https://doi.org/10.3390/ph14121287
Submission received: 8 November 2021 / Revised: 4 December 2021 / Accepted: 7 December 2021 / Published: 9 December 2021
(This article belongs to the Section Pharmacology)

Abstract

:
Epigenetic silencing of tumor suppressor genes (TSGs) plays an essential role in cancer pathogenesis, including acute myeloid leukemia (AML). All of SHP-1, SOCS-1, and SOCS-3 are TSGs that negatively regulate JAK/STAT signaling. Enhanced re-expression of TSGs through de-methylation represents a therapeutic target in several cancers. Thymoquinone (TQ) is a major component of Nigella sativa seeds with anticancer effects against several cancers. However, the effects of TQ on DNA methylation are not entirely understood. This study aimed to evaluate the ability of TQ to re-express SHP-1, SOCS-1, and SOCS-3 in MV4-11 AML cells through de-methylation. Cytotoxicity, apoptosis, and cell cycle assays were performed using WSTs-8 kit, Annexin V-FITC/PI apoptosis detection kit, and fluorometric-red cell cycle assay kit, respectively. The methylation of SHP-1, SOCS-1, and SOCS-3 was evaluated by pyrosequencing analysis. The expression of SHP-1, SOCS-1, SOCS-3, JAK2, STAT3, STAT5A, STAT5B, FLT3-ITD, DNMT1, DNMT3A, DNMT3B, TET2, and WT1 was assessed by RT-qPCR. The molecular docking of TQ to JAK2, STAT3, and STAT5 was evaluated. The results revealed that TQ significantly inhibited the growth of MV4-11 cells and induced apoptosis in a dose- and time-dependent manner. Interestingly, the results showed that TQ binds the active pocket of JAK2, STAT3, and STAT5 to inhibit their enzymatic activity and significantly enhances the re-expression of SHP-1 and SOCS-3 through de-methylation. In conclusion, TQ curbs MV4-11 cells by inhibiting the enzymatic activity of JAK/STAT signaling through hypomethylation and re-expression of JAK/STAT negative regulators and could be a promising therapeutic candidate for AML patients.

1. Introduction

Acute myeloid leukemia (AML) is a hematopoietic stem cell malignancy characterized by distinct genetic and epigenetic abnormalities. FMS-like tyrosine kinase 3 (FLT3) with internal tandem duplication (FLT3-ITD) and Janus Kinase 2 (JAK2) mutations are frequent genetic events in AML [1]. Aberrant DNA methylation is one of the most typical causes of AML initiation and progression [1,2]. AML is associated with a high frequency of mutations in genes involved in DNA methylation, including DNA methyltransferases (DNMTs); DNMT1, DNMT3A, and DNMT3B [3], and DNA demethylases; ten-eleven translocation 2 (TET2) [4] and Wilms Tumor 1 (WT1) [5,6].
Epigenetic silencing of tumor suppressor genes (TSGs) by DNA hypermethylation has a critical role in the development of leukaemia, including AML [7,8]. Unlike genetic dysregulation, the epigenetic alterations are reversible, making them attractive targets for anticancer therapy.
Hyperactivation of the Janus tyrosine kinase-signal transducer and activator of transcription (JAK/STAT) signaling plays an essential role in the pathogenesis of AML [9]. Src homology 1 domain-containing protein tyrosine phosphatase (SHP-1), suppressor of cytokine signaling-1 (SOCS-1), and suppressor of cytokine signaling-3 (SOCS-3) are TSGs that negatively regulate the growth-promoting signaling, such as JAK/STAT signaling [9,10,11]. Epigenetic silencing of SHP-1 and SOCS-3 by promotor hypermethylation has been identified in hematological malignancies, including AML [10,12,13]. Epigenetic silencing of SOCS-1 has also been reported in myelodysplastic syndrome [14] and multiple myeloma [15]. However, the different methylation status of CpG islands of SOCS-1 has been identified in AML [16,17,18]. The restoration of SHP-1, SOCS-1, and SOCS-3 expression by epigenetic modulating agents such as 5-azacytidine (5-Aza) was associated with significant inhibition of JAK2/STAT3 and STAT5 signaling in AML leukemia cells [8,12]. However, the response rate of the conventional DNA hypomethylating agents is low [19,20]. Therefore, new treatments that efficiently modify aberrant epigenetic mechanisms are vitally needed.
Overexpression of FLT3 due to ITD mutation plays an essential role in the survival and proliferation of AML cells [21]. Targeting FLT3-ITD represents an attractive therapeutic target for AML patients with this mutation [22]. FLT3 tyrosine kinase inhibitors (TKIs) have been used in clinical trials. However, the response rates to these TKIs were temporary [23,24]. Natural phytochemical compounds have induced anti-cancer effects in FLT3-ITD overexpressing cells [25], suggesting that phytochemical compounds can inhibit the expression of the ITD-mutated FLT3 gene.
Natural phytochemical compounds are excellent and safe alternatives for cancer therapy. These compounds may target and modulate the genetic expression by interacting with the genetic and epigenetic mechanisms [26]. Thymoquinone (TQ) (2-methyl-5-isopropyl-1,4-benzoquinone) is a phytochemical compound extracted from Nigella sativa seeds that can modulate cancer cells epigenetic mechanisms, including histone acetylation or deacetylation and DNA methylation or de-methylation [27,28]. However, the anti-leukemic activities of TQ and its effect on DNA methylation are still not thoroughly investigated.
The current study hypothesized that SHP-1, SOCS-1, and SOCS-3 lose their tumor suppression function in AML due to epigenetic silencing, and TQ could re-express these TSGs through de-methylation. For this purpose, the effect of TQ on the methylation status and the expression of SHP-1, SOCS-1 and, SOCS-3 were studied in FLT3-ITD positive MV4-11 AML cells. The effect of TQ on the expression of FLT3-ITD, JAK2, STAT3, STAT5A, STAT5B, DNMT1, DNMT3A, DNMT3B, TET2, and WT1 genes, cell proliferation, apoptosis, and cell cycle progression as well as the molecular docking of TQ to JAK2, STAT 3 and STAT5 was also evaluated.

2. Results

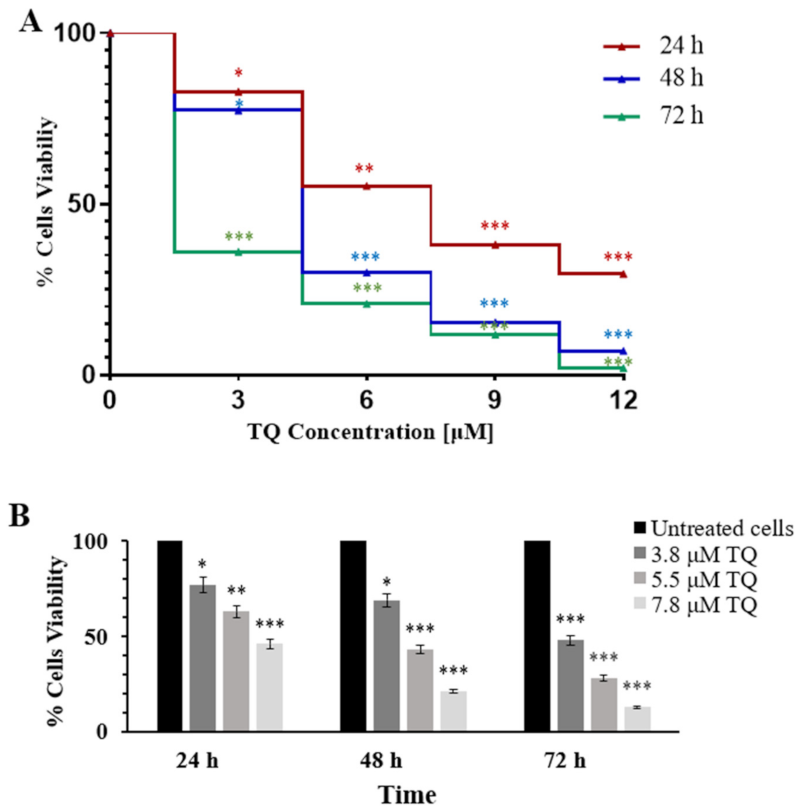
2.1. Thymoquinone Inhibits Cell Proliferation in MV4-11 Cells

The results showed that cell viability significantly decreased in a dose- and time-dependent phenomenon. At 24 h, 48 h, and 72 h, the IC50s were calculated from the dose-cell viability percentage curve; 7.8 ± 1.6 μM, 5.5 ± 1.3 μM, and 3.8 ± 0.96 μM, respectively (Figure 1A). The viability of MV4-11 cells after 24 h, 48 h, and 72 h of exposure to TQ were evaluated using the trypan blue exclusion method to confirm the growth inhibition effects at TQ IC50 values. The trypan blue exclusion assay results also showed that TQ inhibited the proliferation of MV4-11 cells in a dose- and time-dependent manner (Figure 1B).

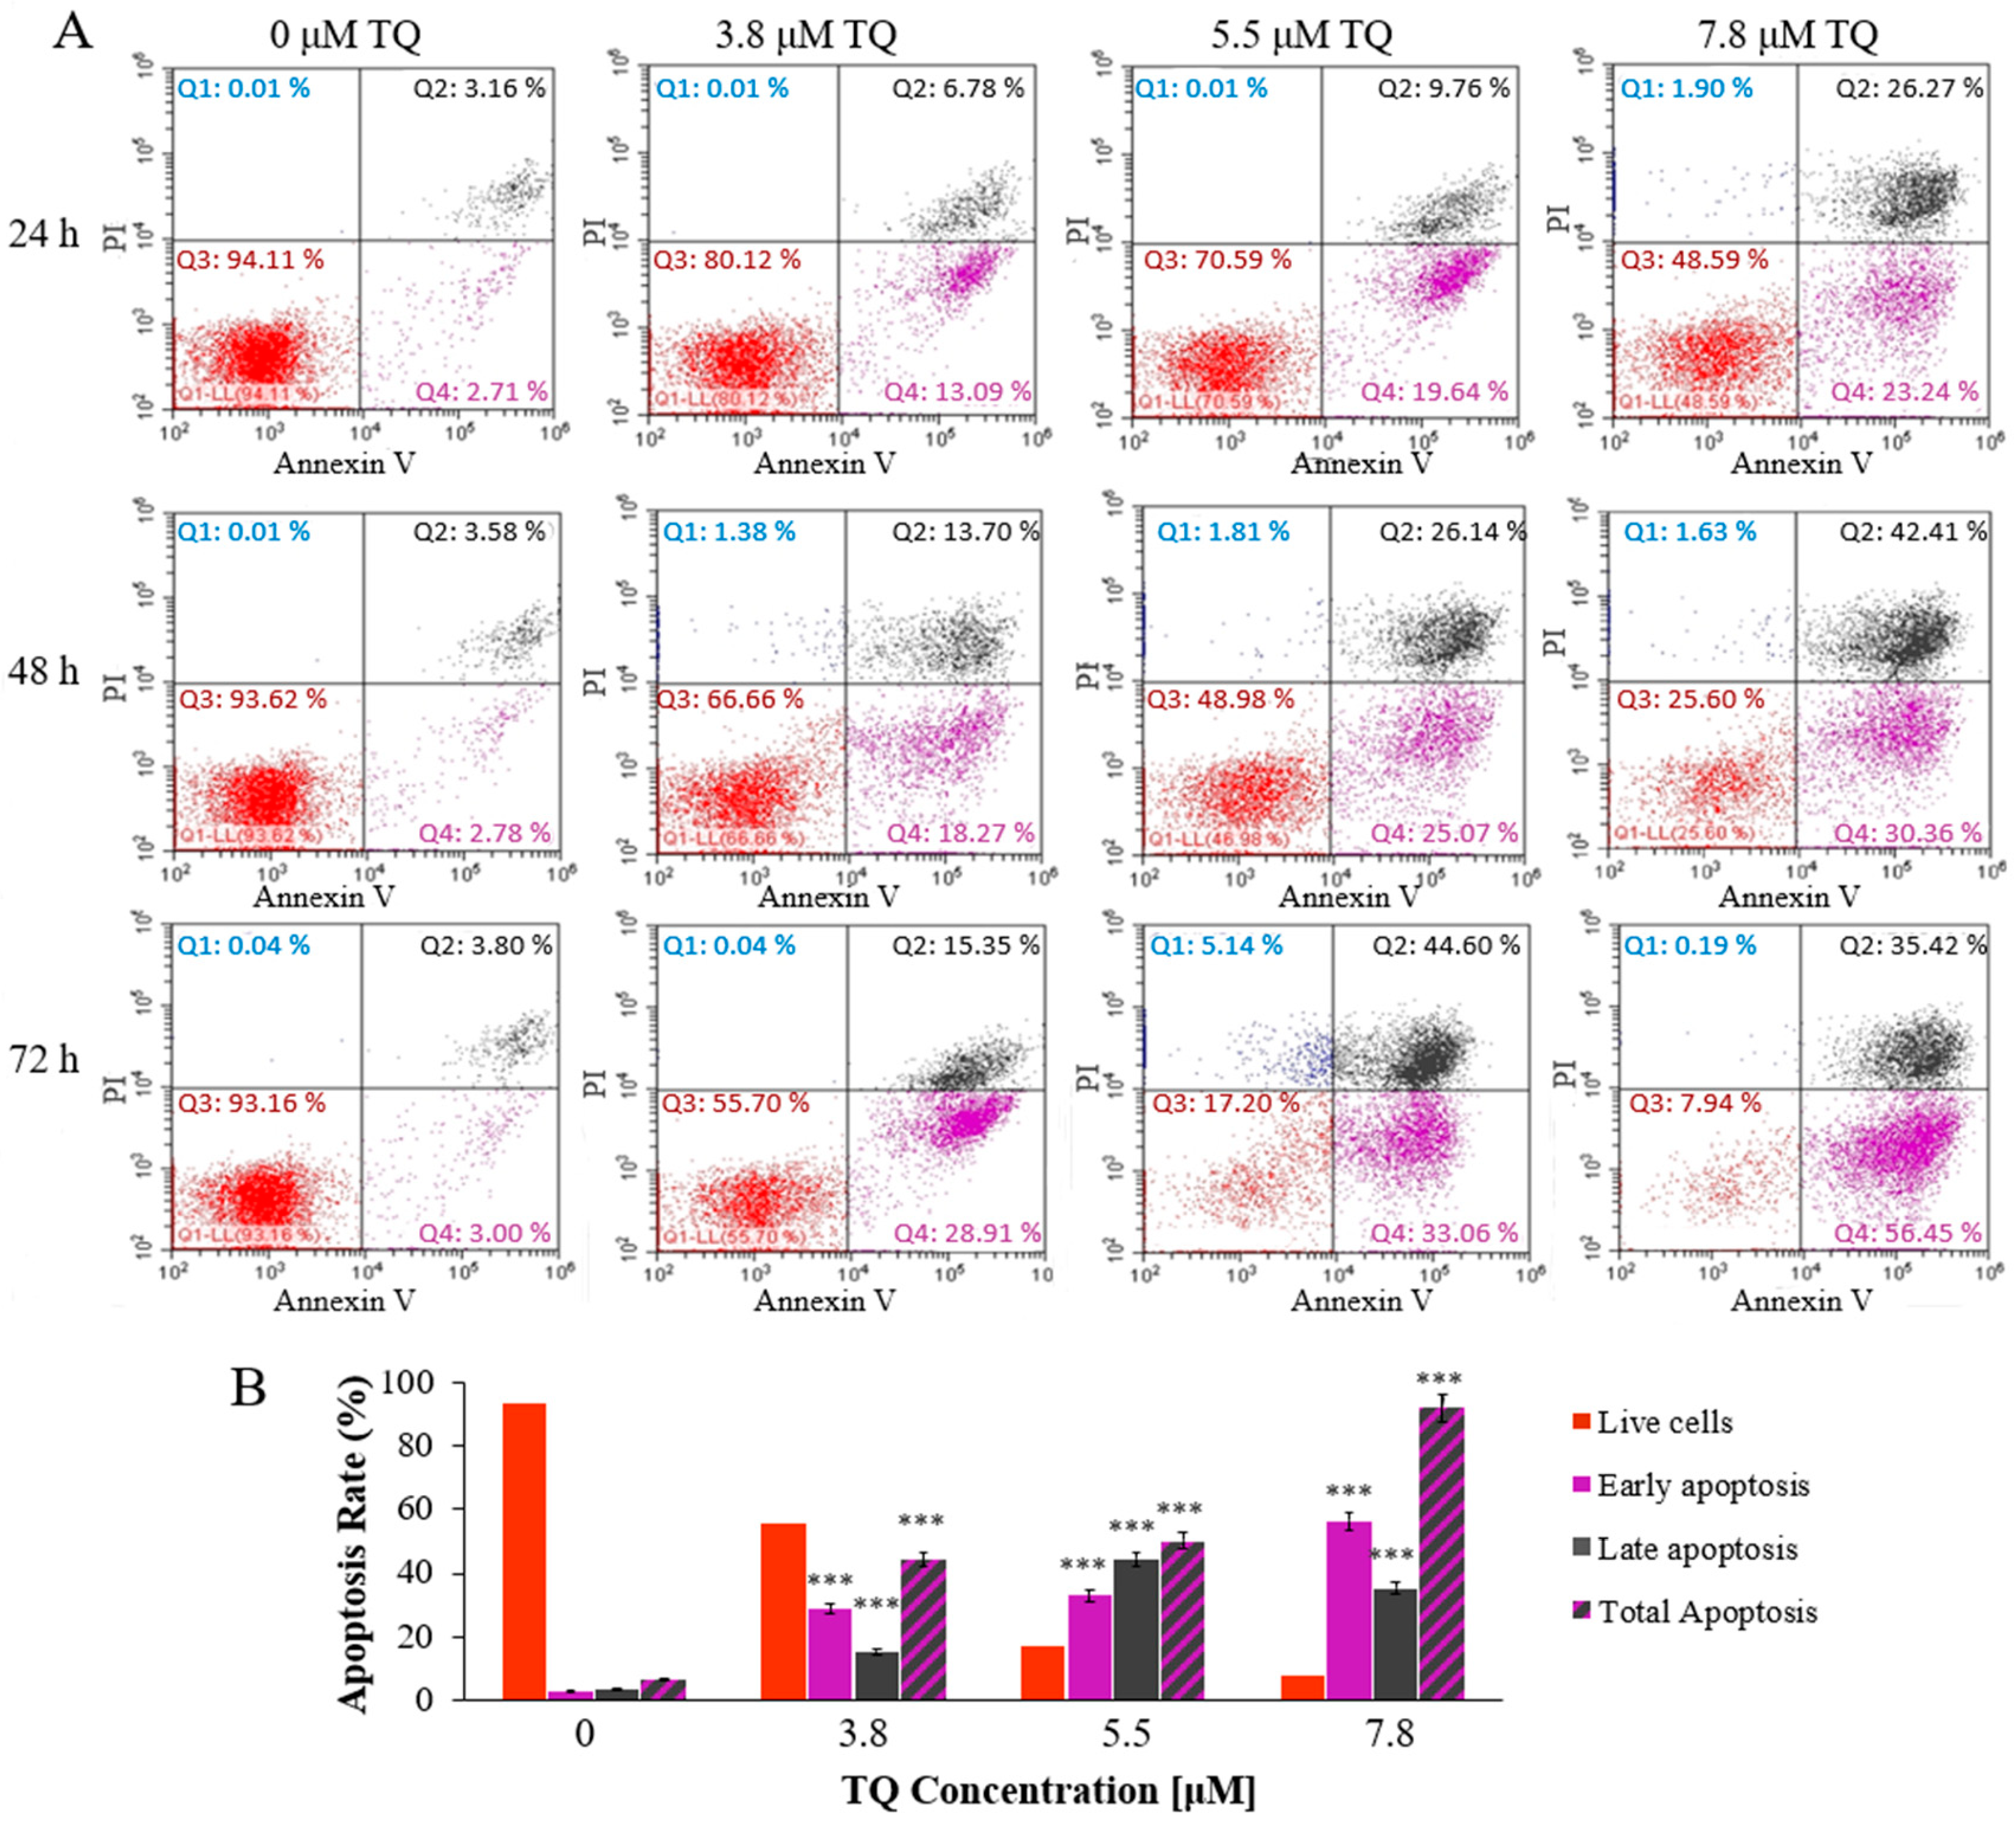
2.2. Thymoquinone Induces Dose and Time-Dependent Apoptosis in MV4-11 Cells

The MV4-11 cells treated with IC50 values of TQ revealed that TQ induced apoptosis in a dose- and time-dependent manner (Figure 2A,B). Total apoptosis was observed in 49.51% of MV4-11 cells after treatment with 7.8 μM TQ for 24 h, 51.21% of MV4-11 cells demonstrated total apoptosis after treatment with 5.5 μM for 48 h, and 44.26% of MV4-11 cells showed total apoptosis after treatment with 3.8 μM for 72 h. Additionally, 72 h of treatment with 7.8 μM TQ induced the most significant rise in the percentage of cells with total apoptosis (91.13%).

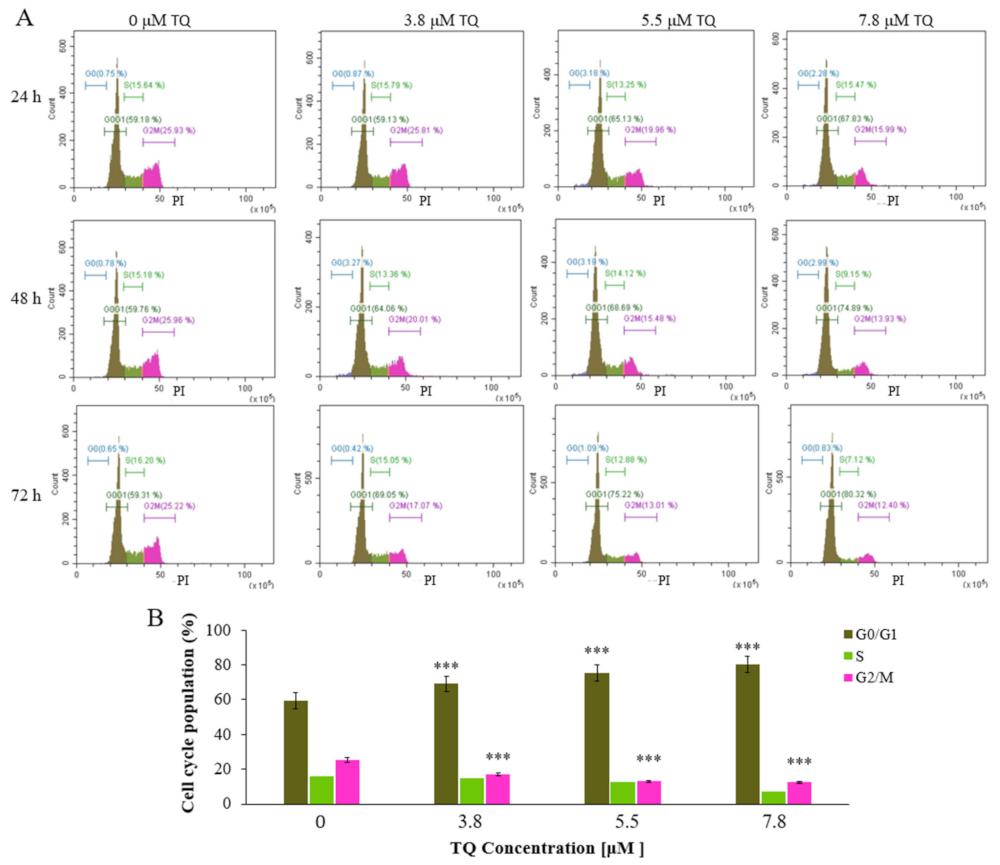
2.3. Thymoquinone Induces Cell Cycle Arrest at G0/G1 Phase in MV4-11 Cells

Treatment with TQ significantly increased the G0/G1 population, whereas the G2/M population was decreased in a dose- and time-dependent manner. The G0/G1 population showed the most pronounced increase after 72 h of 7.8 μM TQ treatment (80.57%) compared to untreated cells (59.23%). Meanwhile, both S and G0 populations were not affected (Figure 3A,B).

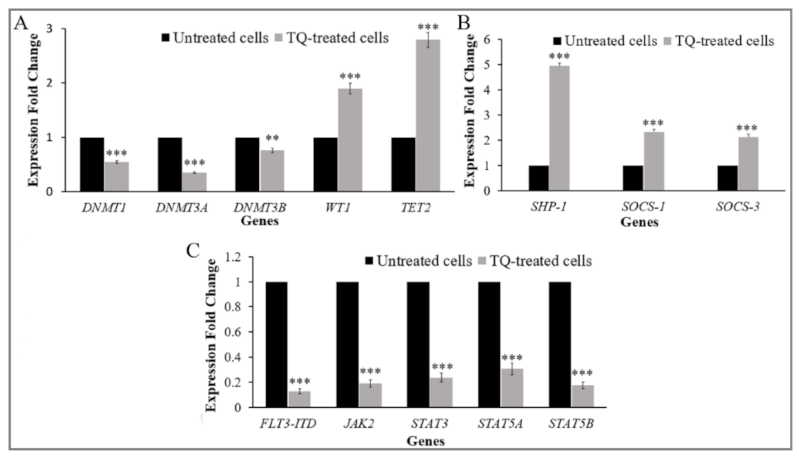
2.4. Thymoquinone Creates a Balance in the Expression of the Regulators of DNA Methylation Genes in MV4-11 Cells

The expression of the regulators of DNA methylation was investigated in MV4-11 cells before and after treatment with TQ. The results of RT-qPCR analysis showed that the expression of DNMT1, DNMT3A, and DNMT3B was significantly decreased by 1.8-fold (p < 0.001), 2.9-fold (p < 0.001), and 1.3-fold (p = 0.0003), respectively, compared to untreated cells. The expression of TET2 and WT1 was significantly increased by 1.9-fold (p < 0.001) and 2.8-fold (p < 0.001), respectively, compared to untreated cells (Figure 4A).

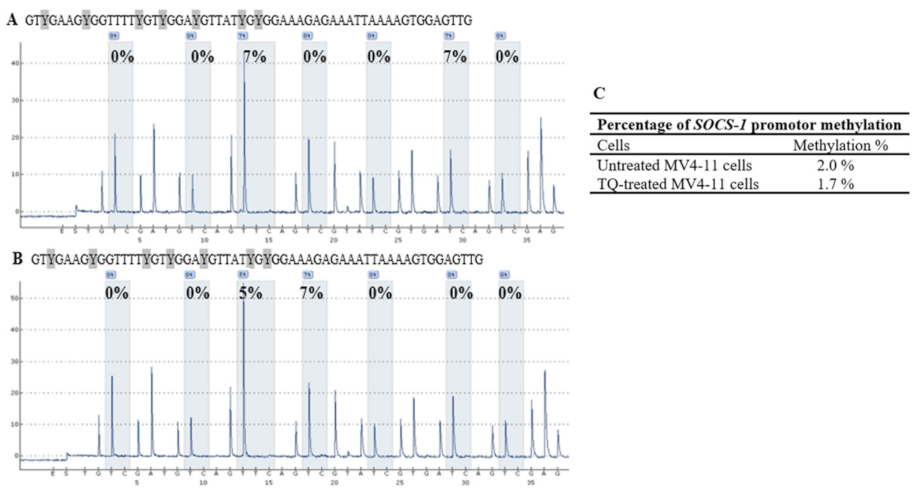
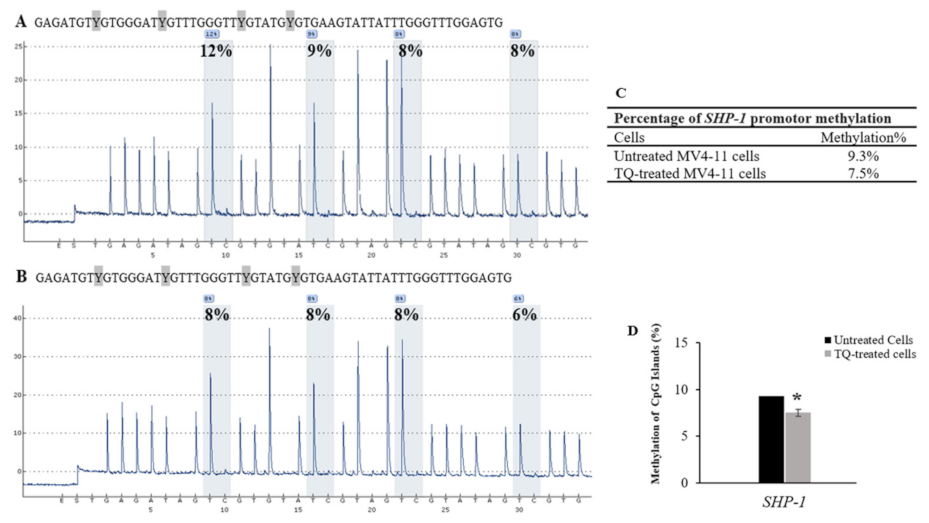
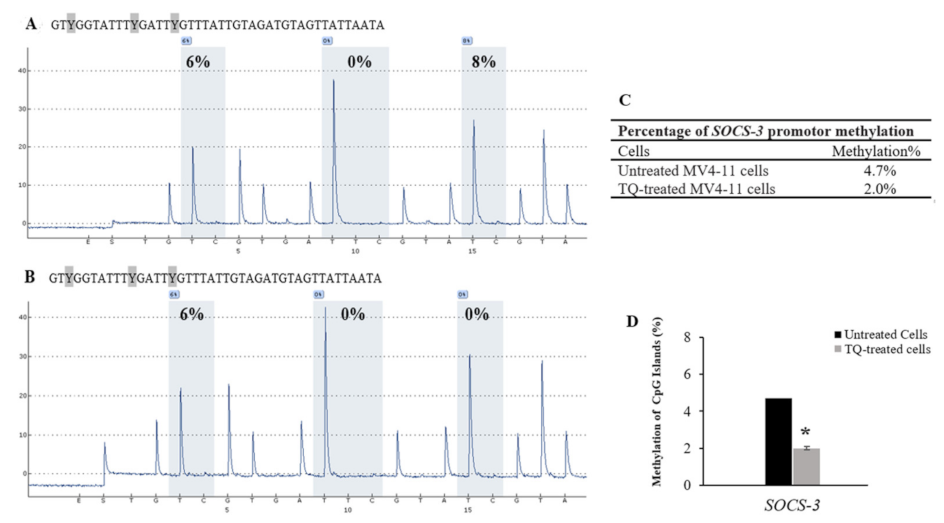
2.5. Thymoquinone Induces SHP-1 and SOCS-3 Promoter Hypomethylation in MV4-11 Cells

Quantitative pyrosequencing was performed to investigate DNA methylation levels in untreated MV4-11 cells, TQ-treated MV4-11 cells, 5-Aza-treated MV4-11 cells, methylated bisulfite-converted DNA control, unmethylated bisulfite-converted DNA control, and unmethylated bisulfite-unconverted DNA control. The results of DNA methylation levels of four CpG sites in the SHP-1 promoter 2 region, seven CpG sites in the SOCS-1 promoter region, and three CpG sites in the SOCS-3 promoter region were compared in MV4-11 cells before and after treatment with TQ. Pyrosequencing results showed a decrease in the methylation level of CpG islands in the promoter 2 region of SHP-1 gene in TQ-treated MV4-11 cells (7.5%) compared to (9.3%) untreated MV4-11 cells (p = 0.037) (Table 1, Figure 5). The results also showed a decrease in the methylation level of CpG islands in the promoter region of SOCS-3 gene in TQ-treated MV4-11 cells (2.0%) compared to (4.7%) in untreated MV4-11 cells (p = 0.041) (Table 2, Figure 6). On the other hand, the promoter region of SOCS-1 in both treated and untreated MV4-11 cells was not methylated (Table 3, Figure 7).

2.6. Thymoquinone Enhances Re-Expression of SHP-1, SOCS-1, and SOCS-3 in MV4-11 Cells

The expression of JAK/STAT-negative regulator genes in MV4-11cells was analyzed by RT-qPCR. After 48 h of 5.5 μM of TQ treatment, the mRNA levels of SHP-1, SOCS-1, and SOCS-3 were significantly increased (p < 0.001). The expression of SHP-1 increased 5-fold after TQ treatment relative to untreated cells. The expression of SOCS-1 and SOCS-3 also increased by 2.34 and 2.12-fold, respectively (Figure 4B).

2.7. Thymoquinone Downregulates FLT3-ITD and JAK/STAT Signaling

MV4-11 cells were analyzed for different mRNA expression patterns of FLT3-ITD, JAK2, STAT3, STAT5A, and STAT5B before and after treatment with TQ using RT-qPCR. The expression of FLT3-ITD and JAK2 was significantly decreased by 8-fold (p < 0.001) and 5.3-fold (p < 0.001), respectively, compared to untreated cells (Figure 4C). The expression of STAT3, STAT5A, and STAT5B was also significantly decreased after TQ treatment by 4.2-fold, 3.2-fold, and 5.6-fold, respectively, compared to that in untreated cells (p < 0.001) (Figure 4C).

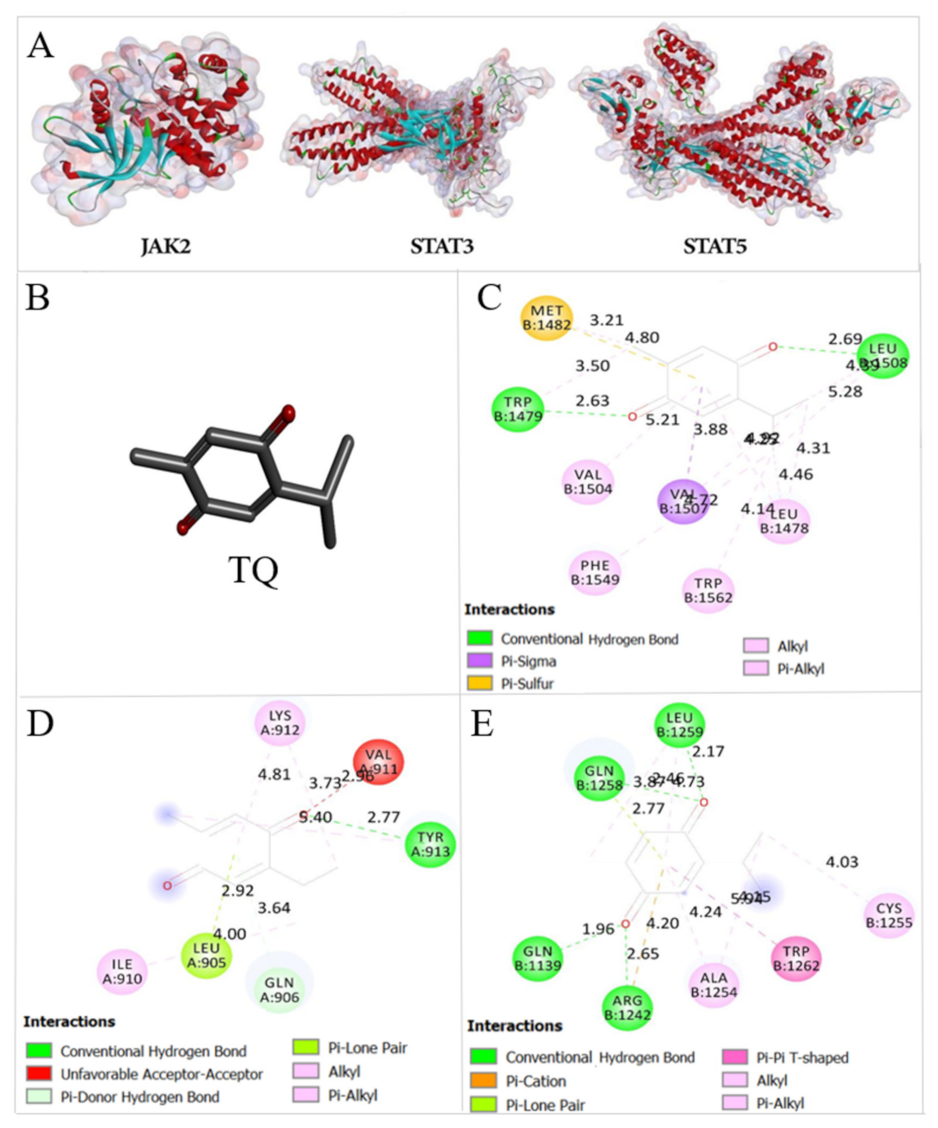
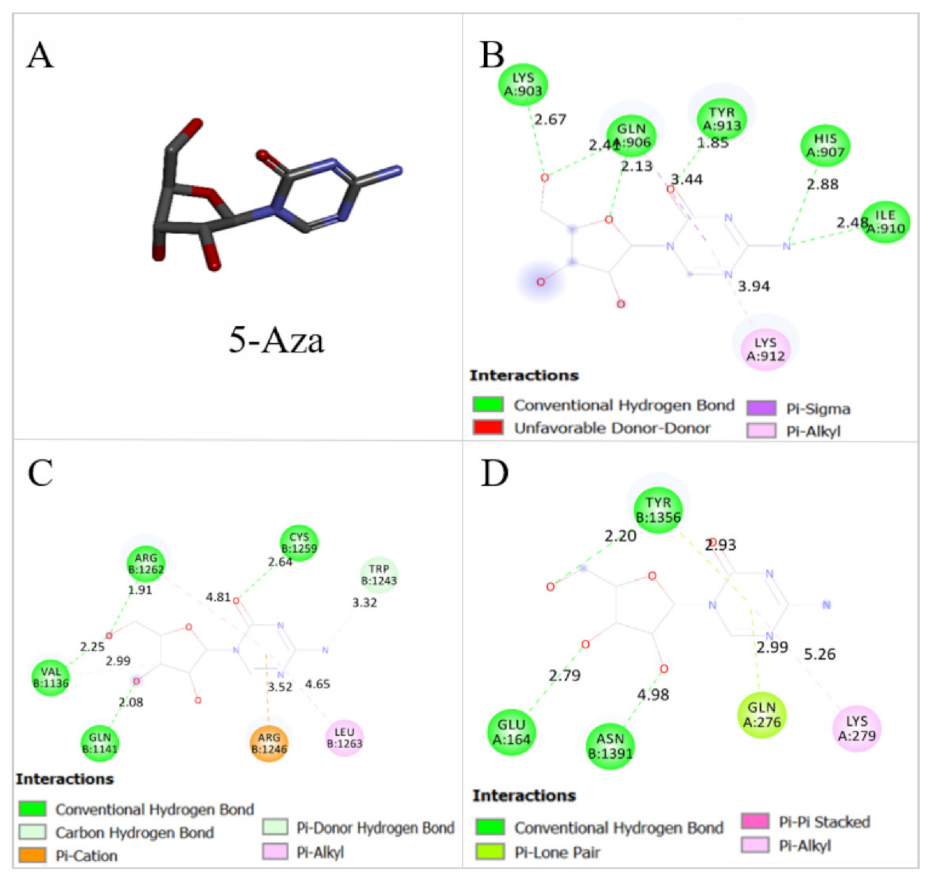
2.8. Thymoquinone Binds the Active Pocket of JAK2, STAT3, and STAT5

The actual docked conformation of JAK2, STAT3, and STAT5 with the active conformation of each ligand, TQ and 5-Aza, clearly showed that numerous potential interactions were present (Figure 8 and Figure 9). The comparison of free binding energy and Ki of both ligands after interaction with studied proteins is presented in Table 4.
The interactions between TQ and JAK2 showed hydrogen bond with TYR913, pi lone pair with LEU905, pi donor hydrogen bond with GLN906, and two alkyl bonds with LYS912 and ILE910 with a free binding energy of −5.99 Kcal/mol (Figure 8C). The interactions of the positive control, 5-Aza, with JAK2 showed six hydrogen bonds with LYS903, GLN906, TYR913, HIS907, and ILE910 and alkyl bond with LYS912 with a free binding energy of −6.37 Kcal/mol (Figure 9B). The interaction between TQ and JAK2 showed higher free binding energy and less affinity than 5-Aza.
The interaction between TQ and STAT3 demonstrated two hydrogen bonds with LEU508 and TRP1479, pi sulphur bond with MET1482, pi sigma bond with VAL1507, and four alkyl bonds with LEU1478, VAL1504, PHE1549, and TRP1562 with a free binding energy of −6.68 Kcal/mol (Figure 8D). The interactions of the positive control, 5-Aza, with STAT3 showed four hydrogen bonds with STAT3 in CYS1259, ARG1262, VAL1136, and GLN1141, pi cation bond with ARG1246, and alkyl bond with LEU1263 (Figure 9C). TQ showed less free binding energy with STAT3 than 5-Aza (−6.52 Kcal/mol) and more affinity toward STAT3; this can be due to more stability that happened in the active pocket of the protein after interaction with TQ.
The interaction of TQ with STAT5 demonstrated four hydrogen bonds with LEU1259, GLN1258, GLN1139, and ARG1242, two alkyl bonds with CYS1255 and ALA1254, and pi pi T shaped with TRP1262 with a free binding energy of −6.04 Kcal/mol (Figure 8E). The positive control, 5-Aza, demonstrated three hydrogen bonds with TYR1356, GLU164 and ASN1391 of STAT5, and an alkyl bond with LYS279 of STAT5 with a free binding energy of −6 Kcal/mol (Figure 9D). The free binding energy of TQ after interaction with STAT5 was slightly lower than 5-Aza, so it showed a slightly better affinity towards STAT5. This can be due to two hydrogen bonds interacting with ketonic oxygen at the para position of the cyclohexane in the chemical structure of TQ; this gives more stability in the active pocket of STAT5 compared with 5-Aza.

3. Discussion

Aberrant methylation of TSGs is involved in the pathogenesis of several cancers [7]. The expression of TSGs, such as the JAK/STAT-negative regulator genes, is silenced due to hypermethylation of the CpG islands in promoter regions, leading to the malignant transformation of normal hematopoietic cells and the development of leukemia [7,8]. Different levels of DNA methylation have been implicated in the development and prognosis of AML [8]. Re-expression of silenced TSGs by inhibiting DNA methylation is an important therapeutic target for AML treatment. However, the therapeutic efficiency of the conventional DNA hypomethylating agents is limited [19,20]. Therefore, novel agents that efficiently target aberrant epigenetic mechanisms are highly needed.
Phytochemical compounds, such as curcumin, were found to inhibit the DNA methylation process [29]. TQ is a phytochemical compound, and few researchers have investigated its potential as a modulator of the DNA methylation process [27]. To investigate TQ as a therapeutic agent for AML treatment, it is essential to identify genes and signal transduction pathways involved in TQ-induced AML cells’ inhibition. While previous studies have revealed various mechanisms behind the anti-leukemia effects of TQ [30,31], in this study, we identify hypomethylation of JAK/STAT-negative regulator genes as previously unstudied epigenetic alterations that mediate TQ’s anti-leukemic activities in AML.
The present study showed that TQ exhibited an antiproliferative effect in MV4-11 cells in a time- and dose-dependent manner. The increment of TQ concentration after 24 h of treatment showed significant inhibition of MV411 cells proliferation up to 71% (Figure 1A). Thymoquinone also showed a time-dependent growth inhibitory effect in MV4-11 cells. This was demonstrated by the significant increase of inhibitory impact by 3 μM from 18% at 24 h to 64% at 72 h (Figure 1A–C). The trypan blue exclusion assay revealed that TQ at 7.8 μM decreased cell proliferation to 50% after 24 h of treatment. The cell proliferation was significantly reduced to 21% and 13% after 48 and 72 h of incubation with TQ, respectively (Figure 1B). These findings suggested that TQ inhibited MV4-11 cell proliferation in a dose- and time-related manner. These results are consistent with the previous reports, in which TQ showed a dose-proportional inhibitory effect in MV4-11, Kasumi 1 AML cells [22], and HL60 AML cells [32].
DNMTs regulate the DNA methylation process and have a critical role in normal hematopoiesis [3]. Dysregulation and mutations of DNMT1, DNMT3A, DNMT3B, TET2 and WT1 genes are associated with the development of AML [3,4,6]. A proper balance in the expressions of DNMTs, TET2, and WT1 is essential to regulate the DNA methylation process [33]. In this study, we have evaluated the effect of TQ on the expression of DNMT1, DNMT3A, DNMT3B, TET2, and WT1 in MV4-11 AML cells. Our findings showed that TQ significantly decreased DNMT1, DNMT3A, and DNMT3B mRNA levels in MV4-11 cells (Figure 4A). On the other hand, the results revealed that TQ enhanced the expression of both WT1 and TET2 in MV4-11 cells (Figure 4A). The results of the present study indicate that the downregulation of DNMT1, DNMT3A, and DNMT3B was associated with the upregulation of WT1 and TET2, which potentially reduce DNA methylation in MV4-11 cells. In agreement with our results, TQ significantly decreased the expression of DNMT1 and DNMT3A in the primary blast cells from AML patients, ML-1, Kasumi-1, and MV4-11 AML cells [22]. TQ also has decreased the expression of DNMT1, DNMT3A, and DNMT3B in Jurkat T-cell acute lymphoblastic leukemia cells [34]. TQ also has shown upregulation of TET2 in HECV human vascular endothelial cells [35]. In addition, curcumin treatment downregulated DNMT1 expression in MV4-11 AML cells [36].
The pathogenesis of AML involves a constitutive activation of JAK/STAT signaling [10,12,13]. JAK/STAT signaling is inhibited by SOCS and SHP protein families [37]. Both SHP-1 and SOCS-3 have shown epigenetic silencing due to promoter hypermethylation in haematological malignancies, including AML [10,12,13]. However, the methylation status of the promoter region of SOCS-1 has not been well studied in AML. In our previous study, TQ increased the expression of SHP-1, SOCS-1, and SOCS-3 genes in HL60 AML cells [32], supporting the idea that TQ could target the epigenetic silenced JAK/STAT-negative regulator genes in AML cells. To better understand TQ’s DNA hypomethylating activity, we examined its effect on the methylation level of CpG islands in the promoter regions of SHP-1, SOCS-1, and SOCS-3 in MV4-11 cells.
Pyrosequencing analysis showed that TQ induced hypomethylation of SHP-1 promotor 2 region from 9.3% in untreated MV4-11 cells to 7.5% in TQ-treated cells (p = 0.037) (Table 1, Figure 5). Additionally, the results indicated that TQ induced hypomethylation of the promoter region of SOCS-3 from 4.7% in untreated MV4-11 cells to 2% in TQ-treated cells (p = 0.041) (Table 2, Figure 6). These results indicate that TQ-induced hypomethylation of SHP-1 and SOCS-3 is attributed to its effect in creating appropriate balance in the expression of the regulators of DNA methylation. TQ also induced hypomethylation of SHP-1 promotor 2 region and SOCS-3 promoter region in K562 leukemia cells (Data not shown). These findings are consistent with what has been reported in which TQ decreased DNA methylation in MV4-11 cells and the primary blast cells from AML patients, resulting in inhibition of cell proliferation [22]. Additionally, TQ has been reported to induce hypermethylation of the TWIST1 promoter region, which inhibits the growth of breast cancer cells and cervical cancer cells [28,38]. Furthermore, TQ has been found to alter the epigenetic status of Jurkart cells by downregulating many key epigenetic players and upregulating TSGs previously identified as epigenetically silenced in a variety of cancers, including leukaemia [34].
Previous studies have identified different methylation statuses of SOCS-1 in AML [16,17,18]. This study showed that the CpG sites in the SOCS-1 promoter are unmethylated in MV4-11 cells (Table 3, Figure 7), indicating that they are not involved in the epigenetic regulation of SOCS-1 transcription, thus is not suitable for methylation studies. Consistent with our findings, SOCS-1 promoter region was unmethylated in AML patients [16,17]. On the other hand, SOCS1 promoter was methylated in the relapsed group of AML patients [39], and only 25% of the M5 subtype of AML patients showed a methylation status of SOCS1 promoter region with a significant variation in SOCS-1 methylation among various cytogenetic subgroups [18].
In this study, we further evaluated the effect of TQ-induced hypomethylation on the expression of SHP-1 and SOCS-3 in MV4-11 cells. The results showed that TQ significantly increased SHP-1 and SOCS-3 mRNA levels in MV4-11 cells (Figure 4B). The effect of TQ on the expression of SOCS-1 was also investigated, and the results showed that TQ significantly increased SOCS-1 mRNA level. The unmethylated status of SOCS-1 leads us to hypothesize that the mechanism underlying TQ-induced re-expression of SOCS-1 is different from that behind the re-expression of SHP-1 and SOCS-3. These findings are consistent with previous studies in which SHP-1 and SOCS-3 were re-expressed in leukemia cells after 5-Azacytidine treatment [8] and support our previous findings in which TQ increased the expression of SHP-1, SOCS-1, and SOCS-3 in HL60 AML cells [32].
Constitutive activation of STAT3, STAT5A, and STAT5B is confirmed variably in AML cells [40,41,42]. Therefore, genes involved in JAK/STAT3 and STAT5 signaling are considered as an important molecular target for AML treatment. In this study, we found that TQ reduced the mRNA levels of JAK2, STAT3, STAT5A, and STAT5B in MV4-11 cells (Figure 4C). These results are consistent with previous findings in which scutellarin treatment has decreased the mRNA level of JAK2 in hepatocellular carcinoma cells [43], TQ treatment has downregulated STAT3 in gastric cancer cells [44], and dasatinib treatment has downregulated STAT5A and STAT5B in K562 CML cells [45]. JAK/STAT signaling pathway was also inhibited by curcumin treatment through downregulating JAK/STAT downstream target genes in retinoblastoma cells [46].
The findings of this study also demonstrated that TQ binds the active pocket of JAK2, STAT3, and STAT5 proteins with a negative free binding energy and proper affinity compared with the positive control (5-Aza) selected in this study (Figure 8 and Figure 9, and Table 4), which led to the inhibition of JAK2, STAT3 and STAT5 enzymatic activity in MV4-11 cells. In agreement with our results, TQ was found to bind the catalytic site of DNMT1 and inhibit its enzymatic activity in MV4-11 cells [22].
Hyperactivation of JAK/STAT signaling is associated with increased expression and altered signaling through growth factor receptors in AML stem cells, including FLT3 [21,47]. As a result of the FLT3-ITD mutation, MV4-11 AML cells have constitutive activation of FLT3 and its downstream targets, including STAT3 and STAT5, leading to uninhibited cell proliferation and impairment of differentiation and apoptosis [48]. Inhibition of FLT3 expression significantly inhibits JAK/STAT signaling in AML [49]. In this study, we examined the effect of TQ on the expression of FLT3-ITD in MV4-11 cells. We found that TQ treatment significantly impaired the expression of FLT3-ITD in MV4-11 cells (Figure 4C). Our results confirm previous findings indicating that the inhibition of FLT3 signaling represents one of several molecular mechanisms underlying TQ-induced cancer cell growth inhibition [22].
Transcriptional targets of the JAK-activated STAT family include genes involved in regulating cell survival, proliferation, and apoptosis [50,51]. In the present study, we evaluated the effect of TQ on the apoptosis of MV4-11 cells. The analysis revealed that TQ caused a concentration-dependent rise of early and late apoptosis in MV4-11 cells, with 91.13% total apoptosis after 72 h of incubation with 7.8 µM TQ, compared to 72.04% and 49.76% total apoptosis at 5.5 μM and 3.8 µM TQ, respectively. Moreover, TQ also induced a significant time-dependent effect in apoptosis, as illustrated in Figure 2A,B. These results agreed with other studies that showed that TQ enhanced apoptosis in C91, HuT-102, CEM, and Jurkat human T-cell leukaemia cells [30], and MV4-11 AML cells [22].
Thymoquinone has been shown to have anticancer properties against several types of leukaemia by inducing DNA damage and G0/G1 cell cycle arrest [30,52]. In line with the literature, this study found that TQ considerably blocked cell cycle transition in MV4-11 cells at the G0/G1 phase in a time- and dose-dependent manner (Figure 2A,B). At a concentration of 7.8 µM, TQ increased the percentage of arrested MV4-11 cells in the G0/G1 phase to 80.57%.
In conclusion, TQ mediated anti-leukemia effects on MV4-11 AML cells by creating a balance in the expression of the epigenetic regulator genes through downregulating DNMT1, DNMT3A, and DNMT3B and upregulating TET2 and WT1, resulting in a reduction in DNA methylation levels of SHP-1 and SOCS-3 and restoration of their expression. In addition, TQ inhibited the enzymatic activity of JAK2, STAT3, and STAT5 by binding to their active pockets with a negative free binding energy. Consequently, TQ induced proliferation inhibition, apoptosis induction, and cell cycle arrest.

4. Materials and Methods

4.1. Cell Culture

FLT3-ITD positive MV4-11 AML cells were obtained from Elabscience Biotechnology Co., Ltd., (Wuhan, China). The cells were maintained in Iscove’s Modified Dulbecco Medium (IMDM) supplemented with 10% (v/v) fetal bovine serum (FBS) and 1% (v/v) penicillin-streptomycin. The cell culture was maintained in a humidified incubator supplied with 5% carbon dioxide (CO2) at 37 °C and incubated until 70% confluency. IMDM, FBS, and penicillin-streptomycin solution were purchased from Elabscience Biotechnology Co., Ltd., (Wuhan, China).

4.2. TQ and 5-Aza Treatment

TQ (>98% pure) was obtained from Sigma Aldrich (Sigma Aldrich Corp., Louis, MO, USA). TQ was prepared with 2% dimethyl sulfoxide (DMSO) at a stock concentration of 30 mM and stored at −80 °C, then 5.5 µM working concentration was prepared with IMDM medium at the onset of treatment. 5-Aza was purchased from Solarbio life sciences (Beijing, China). The 5-Aza was prepared at a stock solution of 10 mM with 2% DMSO and stored at −80 °C, and the working concentration of 2.3 µM was prepared with IMDM medium.

4.3. Cytotoxicity Assay

Cell counting water-soluble tetrazolium salt-8 (WST-8) kit (Nacalai Tesque Inc., Kyoto, Japan) was used to determine the cytotoxicity of TQ at various concentrations for 24 h, 48 h, and 72 h. The MV4-11 cells were seeded in 96-well culture plates at a density of 5 × 10³ viable cells/100 μL/well and pre-incubated at 37 °C in a 5% CO2 incubator for 24 h. Subsequently, 10 μL of varied TQ working concentrations (3 μM, 6 μM, 9 μM, and 12 μM) were added on the designated wells, while the blank (culture media only) and control (untreated cells) wells received 10 μL of culture media. The plates were then incubated for 24 h, 48 h, and 72 h at 37 °C in a 5% CO2 incubator. Next, 10 μL of WST-8 solution was added to each well of the plate and placed in a similarly conditioned incubator for four hours. After that, the absorbance was measured at 450 nm (calibration wavelength: 600 nm) by a microplate reader (Infinite M200, Tecan, Männedorf, Switzerland). Four independent experiments were performed. The potency of TQ was expressed by half-maximal inhibitory concentration (IC50) values, which were calculated from the dose-cell viability percentage curve with blank absorbance value subtracted to remove background absorbance.

4.4. Cell Viability Assay

The viability of MV4-11 cells was measured using the trypan blue exclusion assay. The MV4-11 cells were seeded in triplicate in a 96-well plate (1 × 10⁴ cells/mL) and treated with 7.8 μM, 5.5 μM, and 3.8 μM of TQ for 24 h, 48 h, and 72 h, respectively. Then, 10 µL of cell suspension from each incubation was mixed with 10 µL of trypan blue solution (0.2% in PBS), and the viable (unstained) and dead (blue) cells were counted using a hemocytometer (Reichert, Buffalo, NY, USA). Four independent experiments were performed. The viability of TQ-treated cells was expressed as a percentage of viable cells relative to untreated ones (100%).

4.5. Apoptosis Assay

The cell apoptosis rate was measured using the annexin V-FITC/propidium iodide (PI) apoptosis detection kit (Nacalai Tesque Inc., Kyoto, Japan). The TQ-treated MV4-11 cells (7.8 μM, 5.5 μM, and 3.8 μM of TQ for 24 h, 48 h, and 72 h, respectively) were centrifuged, and the pellet was washed twice with PBS. The cells were then resuspended in an annexin V binding buffer with a final cell concentration of 1 × 10⁶ cells/mL. For flow cytometric preparation, 100 μL of the cell suspensions were incubated with 5 μL of annexin V-FITC conjugate and 5 μL of PI solution for 15 min at room temperature (RT) in the dark. Then, 400 μL of annexin V binding buffer was added to the solution and applied to the CytoFLEX flow cytometer (Beckman Coulter, Brea, CA, USA). For each sample, 10,000 events were acquired, and positive FITC and/or PI cells were quantified and analyzed by CytExpert for CytoFLEX Acquisition and Analysis Software (Beckman Coulter, USA). Three independent experiments were performed and the data were presented as histograms.

4.6. Cell Cycle Analysis Using Flow Cytometry

Cell cycle analysis was performed using the fluorometric–red cell cycle assay kit (Elabscience Biotechnology Co., Ltd., Wuhan, China). The MV4-11 cells treated with IC50 concentrations of TQ (7.8 μM, 5.5 μM, and 3.8 μM for 24 h, 48 h, and 72 h, respectively) were centrifuged and resuspended gently in PBS before counting. Next, cells of 5 × 10⁵ cells/tube concentration were prepared, centrifuged, and resuspended in 0.3 mL PBS. The cell suspension was then fixed with 1.2 mL iced absolute ethanol, oscillated followed by incubation at −20 °C overnight. Thereafter, the fixed cells were centrifuged, and the pellet was resuspended in 1 mL PBS and incubated at RT for 15 min. The solution was then centrifuged again, and the pellet was resuspended in 100 μL RNase A reagent and continued to be incubated for 30 min in a 37 °C water bath. Subsequently, 400 μL of PI staining solution was added, thoroughly mixed, and incubated for 30 min at 4 °C. Following that, a flow cytometer (Beckman Coulter, USA) was used to analyse the cells. Three independent experiments were performed. The percentage of cell cycle phase distribution was calculated by ModFit LT 4.1 software (Beckman Coulter, USA).

4.7. RNA Extraction

Total cellular RNA was extracted from both TQ-treated (5.5 µM for 48 h) and untreated MV4-11 cells using ReliaPrep™ RNA Cell Miniprep System RNA extraction kit (Promega, Madison, WI, USA) following the manufacturer’s protocol. The purity and concentration of the extracted RNA were measured by Nanodrop-Photometer (Implen, Weslake Village, CA, USA).

4.8. Quantitative Reverse Transcriptase PCR (RT-qPCR)

GoTaq® 2-Step RT-qPCR System kit (Promega, USA) was used to reverse transcribe 100 ng of RNA into cDNA. The expression of SHP-1, SOCS-1, SOCS-3, FLT3-ITD, JAK2, STAT3, STAT5A, STAT5B, DNMT1, DNMT3A, DNMT3B, TET2, and WT1 was analyzed using SYBR Green-based GoTaq 2-Step RT–qPCR System kit (Promega, USA). Each PCR reaction was performed in triplicates whereby each reaction contained 10 μL of GoTaq® qPCR Master Mix (2×), 0.2 μL of CXR reference dye, 1 μL of forward (20×) and reverse primers (20×), 6.8 μL nuclease-free water, and 2 μL of cDNA template [2 μL of nuclease-free water were added to the no template control (NTC)]. The cycling conditions for the RT-qPCR reactions were as follows: activation of GoTaq® DNA Polymerase, 2 min at 95 °C; denaturation step, 40 cycles at 95 °C for 15 s; Annealing and extension, 40 cycles at 60 °C for 1 min. RT-qPCR was analyzed using Applied Biosystem StepOnePlus™ thermocycler (Applied Biosystems, Foster City, CA, USA). The primers sequences used for PCR amplification are listed in Table 5. Data were analyzed by StepOne Software v2.3 (ABI step one plus, New York, NY, USA). The relative expression levels of the genes were determined using RT-qPCR and the 2−∆∆Cq method [53] after normalization to the endogenous reference β-actin, and the results were presented as fold changes.

4.9. DNA Extraction and Bisulfite Treatment

MV4-11 cells were treated with 5.5 µM TQ for 48 h. The demethylating agent, 5-Aza was used as positive control, and the cells were treated with 2.3 µM of 5-Aza for 48 h. Bisulfite-converted completely methylated, or unmethylated human genomic DNAs and bisulfite-unconverted completely unmethylated human genomic DNA were used as controls (EpiTect PCR Control DNA Set, Qiagen, Hilden, Germany). Total cellular DNA was extracted from both treated and untreated MV4-11 cells using Wizard® Genomic DNA Purification Kit (Promega, USA) according to the manufacturer’s protocol. The concentration and purity of the extracted DNA were assessed by Nanodrop-Photometer (Implen, Weslake Village, CA, USA). Tow micrograms of DNA were treated with bisulfite using the EpiTect Bisulfite Kit (Qiagen, Hilden, Germany) according to the manufacturer’s instructions.

4.10. Primer Design for Pyrosequencing Assay

Quantitative DNA methylation analysis of bisulfite-treated DNA was performed by pyrosequencing of the promotor 2 region of SHP-1 and the promotor regions of SOCS-1 and SOCS-3 genes. For each gene, we selected the CpG islands in the promoter area, flanking the transcription start site at 5′UTR. Three to seven CpG sites were studied for each particular CpG island. Primers for PCR amplification and pyrosequencing were designed using PyroMark Assay Design Software version 2.0 (Qiagen, Hilden, Germany) and synthesized by PyroMark Custom Assay (Qiagen, Hilden, Germany). The reverse primers were biotin labelled, allowing for the production of biotinylated PCR product necessary for the pyrosequencing reactions. The analyzed promotor regions and the corresponding primers sequences used for pyrosequencing analysis for each gene are presented in Table 6.

4.11. Docking of Thymoquinone

Python language was downloaded from www.python.com (accessed on 1 July 2021), Molecular graphics laboratory (MGL) tools was downloaded from http://mgltools.scripps.edu (accessed on 1 July 2021) and AutoDock4.2 was downloaded from http://autodock.scripps.edu (accessed on 1 July 2021), Bio Via draw was downloaded from http://accelrys.com (accessed on 1 July 2021), Discovery studio visualizer 2017 was downloaded from http://accelrys.com (accessed on 1 July 2021), and Chem3D was downloaded from https://acms.ucsd.edu (accessed on 1 July 2021) [63].
The three-dimensional crystal structure of anticancer targets JAK2 with PDB ID: 3KCK, STAT3 with PDB ID: 3CWG, and STAT5 with PDB ID: 1Y1U were selected and downloaded from Protein Data Bank (www.rvcsb.org/pdb ((accessed on 1 July 2021) (Figure 9A). The complexes bound to the receptor molecule, all the non-essential water molecules and heteroatoms were deleted and ultimately, hydrogen atoms were added to the target receptor molecule using Argus Lab [64].
The structures of TQ and 5-aza were available with the identified structure of crystallography. Pubchem was used to make sdf format and converted to PDB format using Pymol and further used for docking studies. The starting structures of the proteins were prepared using AutoDock tools [65]. Water molecules were deleted, and polar hydrogen and Kollman charges were added to the protein starting structure. Grid box was set with the size of 126 × 126 × 126Å with the grid spacing of 0.375 Å at the binding site. The starting structure of TQ was constructed using BioVia draw, and 5-Aza was selected as positive control. The structures of TQ and 5-Aza were provided from the Pubchem website, Gasteiger charges were assigned into optimized ligands using Autodock Tools. One hundred docking runs were conducted with a mutation rate of 0.02 and a crossover rate of 0.8 [62]. The population size was set to use 250 randomly placed individuals. Lamarckian Genetic algorithm was used as the searching algorithm with a translational step of 0.2 Å, a quaternion step of 5 Å, and a torsion step of 5 Å. The most populated and lowest free binding energy was selected as the final result [66].

4.12. Statistical Analysis

Data analyses were conducted using the Statistical Package for Social Sciences (SPSS) version 25 (SPSS Inc., Chicago, IL, USA). The data between TQ-treated and untreated MV4-11 cells were analyzed using Paired samples t-test and Wilcoxon signed-rank test. The data between groups were analyzed using repeated measures ANOVA with Bonferroni correction with the significant level set at p < 0.05, p < 0.01, and p < 0.001.

5. Conclusions

The anti-leukemic effect of TQ was investigated on MV4-11 AML cells. TQ potentially inhibited the cell proliferation, enhanced apoptosis, and arrested cell cycle of MV4-11 AML cells at G0/G1 phase. These effects could be attributed to TQ mediated hypomethylation of SHP-1 and SOCS-3 through downregulating DNMT1, DNMT3A, and DNMT3B genes resulting in re-expression of SHP-1 and SOCS-3 genes. Moreover, TQ inhibited the enzymatic activity of JAK2, STAT3, and STAT5 by binding to their active pockets. TQ also downregulated the expression of FLT3-ITD, JAK2, STAT3, and STAT5. These findings suggest that TQ could be a future therapeutic candidate for the treatment of AML patients through DNA hypomethylation of JAK/STAT negative regulators.

Author Contributions

Manuscript draft, Data collection, and Data analysis H.A.N.A.-J. and F.A.A.-R.; Result interpretation and statistical analysis, H.A.N.A.-J. and F.A.A.-R.; software, F.A.A.-R., H.A.N.A.-J., S.A.T.T.J., B.A. and M.N.V.; validation, H.A.N.A.-J. and W.R.W.T.; investigation, F.A.A.-R. and H.A.N.A.-J.; resources, H.A.N.A.-J.; data curation, F.A.A.-R.; writing manuscript, H.A.N.A.-J. and F.A.A.-R.; review manuscript and editing, H.A.N.A.-J., Taib, W.R.W.T., M.F.J., I.I. and A.S.A.-w.; supervision, H.A.N.A.-J.; funding acquisition, H.A.N.A.-J. All authors have read and agreed to the published version of the manuscript.

Funding

This research was funded by the Fundamental Research Grant Scheme of the Ministry of Education, Malaysia [FRGS/1/2019/SKK08/UNISZA/02/3 (RR330)].

Institutional Review Board Statement

Not applicable.

Informed Consent Statement

Not applicable.

Data Availability Statement

Data sharing contain in this article.

Acknowledgments

Many thanks to all staff at Cell Culture Laboratory and Molecular Laboratory of Medical School and Centralized Laboratory Management Center, Universiti Sultan Zainal Abidin (UniSZA), who supported the laboratory work.

Conflicts of Interest

The authors declare no conflict of interest.

References

  1. Yang, X.; Wong, M.P.M.; Ng, R.K. Aberrant DNA methylation in acute myeloid leukemia and its clinical implications. Int. J. Mol. Sci. 2019, 20, 4576. [Google Scholar] [CrossRef] [PubMed] [Green Version]
  2. Li, S.; Garrett-Bakelman, F.E.; Chung, S.S.; Sanders, M.A.; Hricik, T.; Rapaport, F.; Patel, J.; Dillon, R.; Vijay, P.; Brown, A.L. Distinct evolution and dynamics of epigenetic and genetic heterogeneity in acute myeloid leukemia. Nat. Med. 2016, 22, 792–799. [Google Scholar] [CrossRef] [Green Version]
  3. Hoang, N.M.; Rui, L. DNA methyltransferases in hematological malignancies. J. Genet. Genom. 2020, 47, 361–372. [Google Scholar] [CrossRef]
  4. Morinishi, L.; Kochanowski, K.; Levine, R.L.; Wu, L.F.; Altschuler, S.J. Loss of TET2 affects proliferation and drug sensitivity through altered dynamics of cell-state transitions. Cell Syst. 2020, 11, 86–94.e85. [Google Scholar] [CrossRef] [PubMed]
  5. Sinha, S.; Thomas, D.; Yu, L.; Gentles, A.J.; Jung, N.; Corces-Zimmerman, M.R.; Chan, S.M.; Reinisch, A.; Feinberg, A.P.; Dill, D.L. Mutant WT1 is associated with DNA hypermethylation of PRC2 targets in AML and responds to EZH2 inhibition. Blood 2015, 125, 316–326. [Google Scholar] [CrossRef] [PubMed]
  6. Wang, Y.; Weng, W.-J.; Zhou, D.-H.; Fang, J.-P.; Mishra, S.; Chai, L.; Xu, L.-H. Wilms tumor 1 mutations are independent poor prognostic factors in pediatric acute myeloid leukemia. Front. Oncol. 2021, 11, 632094. [Google Scholar] [CrossRef]
  7. Memari, F.; Joneidi, Z.; Taheri, B.; Aval, S.F.; Roointan, A.; Zarghami, N. Epigenetics and Epi-miRNAs: Potential markers/therapeutics in leukemia. Biomed. Pharmacother. 2018, 106, 1668–1677. [Google Scholar] [CrossRef]
  8. Asmaa, M.J.S.; Al-Jamal, H.A.; Hussein, A.R.; Yahaya, B.H.; Hassan, R.; Hussain, F.A.; Shamsuddin, S.; Johan, M.F. Transcriptomic profiles of MV4-11 and Kasumi 1 acute myeloid leukemia cell lines modulated by epigenetic modifiers Trichostatin A and 5-Azacytidine. Int. J. Hematol. Oncol. Stem Cell Res. 2020, 14, 72. [Google Scholar] [CrossRef]
  9. Liu, K.; Wu, Z.; Chu, J.; Yang, L.; Wang, N. Promoter methylation and expression of SOCS3 affect the clinical outcome of pediatric acute lymphoblastic leukemia by JAK/STAT pathway. Biomed. Pharmacother. 2019, 115, 108913. [Google Scholar] [CrossRef]
  10. Middeldorf, I.; Galm, O.; Osieka, R.; Jost, E.; Herman, J.G.; Wilop, S. Sequence of administration and methylation of SOCS3 may govern response to gemtuzumab ozogamicin in combination with conventional chemotherapy in patients with refractory or relapsed acute myelogenous leukemia (AML). Am. J. Hematol. 2010, 85, 477–481. [Google Scholar] [CrossRef] [Green Version]
  11. Li, Y.; Liu, X.; Guo, X.; Liu, X.; Luo, J. DNA methyltransferase 1 mediated aberrant methylation and silencing of SHP-1 gene in chronic myelogenous leukemia cells. Leuk. Res. 2017, 58, 9–13. [Google Scholar] [CrossRef] [PubMed]
  12. Al-Jamal, H.A.N.; Jusoh, S.A.M.; Hassan, R.; Johan, M.F. Enhancing SHP-1 expression with 5-azacytidine may inhibit STAT3 activation and confer sensitivity in lestaurtinib (CEP-701)-resistant FLT3-ITD positive acute myeloid leukemia. BMC Cancer 2015, 15, 869. [Google Scholar] [CrossRef] [PubMed] [Green Version]
  13. Yang, J.-J.; Chen, H.; Zheng, X.-Q.; Li, H.-Y.; Wu, J.-B.; Tang, L.-Y.; Gao, S.-M. Methylated alteration of SHP1 complements mutation of JAK2 tyrosine kinase in patients with myeloproliferative neoplasm. Asian Pac. J. Cancer Prev. 2015, 16, 2219–2225. [Google Scholar] [CrossRef] [PubMed] [Green Version]
  14. Brakensiek, K.; Länger, F.; Schlegelberger, B.; Kreipe, H.; Lehmann, U. Hypermethylation of the suppressor of cytokine signalling-1 (SOCS-1) in myelodysplastic syndrome. Br. J. Haematol. 2005, 130, 209–217. [Google Scholar] [CrossRef]
  15. Chim, C.-S.; Fung, T.-K.; Cheung, W.-C.; Liang, R.; Kwong, Y.-L. SOCS1 and SHP1 hypermethylation in multiple myeloma: Implications for epigenetic activation of the Jak/STAT pathway. Blood 2004, 103, 4630–4635. [Google Scholar] [CrossRef]
  16. Chim, C.; Wong, A.; Kwong, Y. Epigenetic dysregulation of the Jak/STAT pathway by frequent aberrant methylation of SHP1 but not SOCS1 in acute leukaemias. Ann. Hematol. 2004, 83, 527–532. [Google Scholar] [CrossRef]
  17. Johan, M.; Bowen, D.; Frew, M.; Goodeve, A.; Reilly, J. Aberrant methylation of the negative regulators RASSFIA, SHP-1 and SOCS-1 in myelodysplastic syndromes and acute myeloid leukaemia. Br. J. Haematol. 2005, 129, 60–65. [Google Scholar] [CrossRef]
  18. Chen, C.Y.; Tsay, W.; Tang, J.L.; Shen, H.L.; Lin, S.W.; Huang, S.Y.; Yao, M.; Chen, Y.C.; Shen, M.C.; Wang, C.H. SOCS1 methylation in patients with newly diagnosed acute myeloid leukemia. Genes Chromosomes Cancer 2003, 37, 300–305. [Google Scholar] [CrossRef]
  19. Agrawal, K.; Das, V.; Vyas, P.; Hajdúch, M. Nucleosidic DNA demethylating epigenetic drugs–a comprehensive review from discovery to clinic. Pharmacol. Ther. 2018, 188, 45–79. [Google Scholar] [CrossRef]
  20. Yan, F.; Shen, N.; Pang, J.; Molina, J.R.; Yang, P.; Liu, S. The DNA methyltransferase DNMT1 and tyrosine-protein kinase KIT cooperatively promote resistance to 5-Aza-2′-deoxycytidine (decitabine) and midostaurin (PKC412) in lung cancer cells. J. Biol. Chem. 2015, 290, 18480–18494. [Google Scholar] [CrossRef] [PubMed] [Green Version]
  21. Vela-Ojeda, J.; Cardenas, P.V.; Esparza, M.A.G.-R.; Cervantes, L.A.M.; Chavez, J.G.; Caballero, A.H.; Majluf-Cruz, A.; Vega-López, A.; Reyes-Maldonado, E. FLT3-ITD and CD135 over-expression are frequent findings of poor survival in adult patients with acute leukemias. Arch. Med. Res. 2021, 52, 217–223. [Google Scholar] [CrossRef]
  22. Pang, J.; Shen, N.; Yan, F.; Zhao, N.; Dou, L.; Wu, L.-C.; Seiler, C.L.; Yu, L.; Yang, K.; Bachanova, V. Thymoquinone exerts potent growth-suppressive activity on leukemia through DNA hypermethylation reversal in leukemia cells. Oncotarget 2017, 8, 34453. [Google Scholar] [CrossRef] [PubMed] [Green Version]
  23. Perl, A.E.; Altman, J.K.; Cortes, J.; Smith, C.; Litzow, M.; Baer, M.R.; Claxton, D.; Erba, H.P.; Gill, S.; Goldberg, S. Selective inhibition of FLT3 by gilteritinib in relapsed or refractory acute myeloid leukaemia: A multicentre, first-in-human, open-label, phase 1–2 study. Lancet Oncol. 2017, 18, 1061–1075. [Google Scholar] [CrossRef]
  24. Knapper, S.; Burnett, A.K.; Littlewood, T.; Kell, W.J.; Agrawal, S.; Chopra, R.; Clark, R.; Levis, M.J.; Small, D. A phase 2 trial of the FLT3 inhibitor lestaurtinib (CEP701) as first-line treatment for older patients with acute myeloid leukemia not considered fit for intensive chemotherapy. Blood 2006, 108, 3262–3270. [Google Scholar] [CrossRef]
  25. Tima, S.; Okonogi, S.; Ampasavate, C.; Berkland, C.; Anuchapreeda, S. FLT3-specific curcumin micelles enhance activity of curcumin on FLT3-ITD overexpressing MV4-11 leukemic cells. Drug Dev. Ind. Pharm. 2019, 45, 498–505. [Google Scholar] [CrossRef]
  26. Singh, S.; Vaishnav, N.; Saha, D.; Ahsan, Z.; Mathur, R.; Jha, A.K. Demethylation of tumor suppressor genes in leukemia by using natural compounds. Int. J. Bio. Sci. Bio. Technol. 2020, 12, 2233–7849. [Google Scholar]
  27. Khan, M.A.; Tania, M.; Fu, J. Epigenetic role of thymoquinone: Impact on cellular mechanism and cancer therapeutics. Drug Discov. Today 2019, 24, 2315–2322. [Google Scholar] [CrossRef]
  28. Li, J.; Khan, M.; Wei, C.; Cheng, J.; Chen, H.; Yang, L.; Ijaz, I.; Fu, J. Thymoquinone inhibits the migration and invasive characteristics of cervical cancer cells SiHa and CaSki in vitro by targeting epithelial to mesenchymal transition associated transcription factors Twist1 and Zeb1. Molecules 2017, 22, 2105. [Google Scholar] [CrossRef] [PubMed] [Green Version]
  29. Hassan, F.-U.; Rehman, M.S.-U.; Khan, M.S.; Ali, M.A.; Javed, A.; Nawaz, A.; Yang, C. Curcumin as an alternative epigenetic modulator: Mechanism of action and potential effects. Front. Genet. 2019, 10, 514. [Google Scholar] [CrossRef] [PubMed] [Green Version]
  30. Houssein, M.; Fatfat, M.; Habli, Z.; Ghazal, N.; Moodad, S.; Khalife, H.; Khalil, M.; Gali-Muhtasib, H. Thymoquinone synergizes with arsenic and interferon alpha to target human T-cell leukemia/lymphoma. Life Sci. 2020, 251, 117639. [Google Scholar] [CrossRef]
  31. Pal, R.R.; Rajpal, V.; Singh, P.; Saraf, S.A. Recent findings on thymoquinone and its applications as a nanocarrier for the treatment of cancer and rheumatoid arthritis. Pharmaceutics 2021, 13, 775. [Google Scholar] [CrossRef]
  32. Almajali, B.; Al-Jamal, H.A.N.; Wan Taib, W.R.; Ismail, I.; Johan, M.F.; Doolaanea, A.A.; Ibrahim, W.N.; Tajudin, S.A. Thymoquinone suppresses cell proliferation and enhances apoptosis of HL60 leukemia cells through re-expression of JAK/STAT negative regulators. Asian Pac. J. Cancer Prev. 2021, 22, 879–885. [Google Scholar] [CrossRef] [PubMed]
  33. Cheng, Y.; He, C.; Wang, M.; Ma, X.; Mo, F.; Yang, S.; Han, J.; Wei, X. Targeting epigenetic regulators for cancer therapy: Mechanisms and advances in clinical trials. Signal Transduct. Target. Ther. 2019, 4, 62. [Google Scholar] [CrossRef] [Green Version]
  34. Qadi, S.A.; Hassan, M.A.; Sheikh, R.A.; Baothman, O.A.; Zamzami, M.A.; Choudhry, H.; Al-Malki, A.L.; Albukhari, A.; Alhosin, M. Thymoquinone-induced reactivation of tumor suppressor genes in cancer cells involves epigenetic mechanisms. Epigenetics Insights 2019, 12, 2516865719839011. [Google Scholar] [CrossRef]
  35. Amartey, J.; Gapper, S.; Hussein, N.; Morris, K.; Withycombe, C.E. Nigella sativa extract and thymoquinone regulate inflammatory cytokine and TET-2 expression in endothelial cells. Artery Res. 2019, 25, 157–163. [Google Scholar] [CrossRef] [Green Version]
  36. Yu, J.; Peng, Y.; Wu, L.-C.; Xie, Z.; Deng, Y.; Hughes, T.; He, S.; Mo, X.; Chiu, M.; Wang, Q.-E. Curcumin down-regulates DNA methyltransferase 1 and plays an anti-leukemic role in acute myeloid leukemia. PLoS ONE 2013, 8, e55934. [Google Scholar] [CrossRef] [PubMed]
  37. Jiang, M.; Zhang, W.-W.; Liu, P.; Yu, W.; Liu, T.; Yu, J. Dysregulation of SOCS-mediated negative feedback of cytokine signaling in carcinogenesis and its significance in cancer treatment. Front. Immunol. 2017, 8, 70. [Google Scholar] [CrossRef] [Green Version]
  38. Khan, M.A.; Tania, M.; Wei, C.; Mei, Z.; Fu, S.; Cheng, J.; Xu, J.; Fu, J. Thymoquinone inhibits cancer metastasis by downregulating TWIST1 expression to reduce epithelial to mesenchymal transition. Oncotarget 2015, 6, 19580. [Google Scholar] [CrossRef] [Green Version]
  39. Zhang, X.H.; Yang, L.; Liu, X.J.; Zhan, Y.; Pan, Y.X.; Wang, X.Z.; Luo, J.M. Association between methylation of tumor suppressor gene SOCS1 and acute myeloid leukemia. Oncol. Rep. 2018, 40, 1008–1016. [Google Scholar] [CrossRef] [PubMed]
  40. Chougule, R.A.; Kazi, J.U.; Rönnstrand, L. FYN expression potentiates FLT3-ITD induced STAT5 signaling in acute myeloid leukemia. Oncotarget 2016, 7, 9964. [Google Scholar] [CrossRef] [PubMed] [Green Version]
  41. Larrue, C.; Heydt, Q.; Saland, E.; Boutzen, H.; Kaoma, T.; Sarry, J.-E.; Joffre, C.; Récher, C. Oncogenic KIT mutations induce STAT3-dependent autophagy to support cell proliferation in acute myeloid leukemia. Oncogenesis 2019, 8, 39. [Google Scholar] [CrossRef]
  42. Venugopal, S.; Bar-Natan, M.; Mascarenhas, J.O. JAKs to STATs: A tantalizing therapeutic target in acute myeloid leukemia. Blood Rev. 2020, 40, 100634. [Google Scholar] [CrossRef]
  43. Liu, K.; Tian, T.; Zheng, Y.; Zhou, L.; Dai, C.; Wang, M.; Lin, S.; Deng, Y.; Hao, Q.; Zhai, Z. Scutellarin inhibits proliferation and invasion of hepatocellular carcinoma cells via down-regulation of JAK2/STAT3 pathway. J. Cell. Mol. Med. 2019, 23, 3040–3044. [Google Scholar] [CrossRef] [Green Version]
  44. Zhu, W.-Q.; Wang, J.; Guo, X.-F.; Liu, Z.; Dong, W.-G. Thymoquinone inhibits proliferation in gastric cancer via the STAT3 pathway in vivo and in vitro. World J. Gastroenterol. 2016, 22, 4149. [Google Scholar] [CrossRef] [PubMed]
  45. Dalgıç, C.T.; Kaymaz, B.T.; Özkan, M.C.; Dalmızrak, A.; Şahin, F.; Saydam, G. Investigating the role of JAK/STAT pathway on dasatinib-induced apoptosis for CML cell model K562. Clin. Lymphoma Myeloma Leuk. 2015, 15, S161–S166. [Google Scholar] [CrossRef]
  46. Li, Y.; Sun, W.; Han, N.; Zou, Y.; Yin, D. Curcumin inhibits proliferation, migration, invasion and promotes apoptosis of retinoblastoma cell lines through modulation of miR-99a and JAK/STAT pathway. BMC Cancer 2018, 18, 1230. [Google Scholar] [CrossRef] [Green Version]
  47. Rummelt, C.; Gorantla, S.P.; Meggendorfer, M.; Charlet, A.; Endres, C.; Döhner, K.; Heidel, F.H.; Fischer, T.; Haferlach, T.; Duyster, J. Activating JAK-mutations confer resistance to FLT3 kinase inhibitors in FLT3-ITD positive AML in vitro and in vivo. Leukemia 2020, 35, 2017–2029. [Google Scholar] [CrossRef]
  48. Dumas, P.-Y.; Naudin, C.; Martin-Lannerée, S.; Izac, B.; Casetti, L.; Mansier, O.; Rousseau, B.; Artus, A.; Dufossée, M.; Giese, A. Hematopoietic niche drives FLT3-ITD acute myeloid leukemia resistance to quizartinib via STAT5-and hypoxia-dependent upregulation of AXL. Haematologica 2019, 104, 2017. [Google Scholar] [CrossRef] [PubMed] [Green Version]
  49. Cook, A.M.; Li, L.; Ho, Y.; Lin, A.; Li, L.; Stein, A.; Forman, S.; Perrotti, D.; Jove, R.; Bhatia, R. Role of altered growth factor receptor-mediated JAK2 signaling in growth and maintenance of human acute myeloid leukemia stem cells. Blood 2014, 123, 2826–2837. [Google Scholar] [CrossRef] [PubMed] [Green Version]
  50. Kang, J.-H.; Jang, Y.-S.; Lee, H.J.; Lee, C.-Y.; Shin, D.Y.; Oh, S.H. Inhibition of STAT3 signaling induces apoptosis and suppresses growth of lung cancer: Good and bad. Lab. Anim. Res. 2019, 35, 30. [Google Scholar] [CrossRef] [PubMed] [Green Version]
  51. Al-Jamal, H.A.N.; Johan, M.F.; Jusoh, S.A.M.; Ismail, I.; Taib, W.R.W. Re-expression of bone marrow proteoglycan-2 by 5-azacytidine is associated with STAT3 inactivation and sensitivity response to imatinib in resistant CML cells. Asian Pac. J. Cancer Prev. 2018, 19, 1585. [Google Scholar]
  52. Almajali, B.; Al-Jamal, H.A.N.; Taib, W.R.W.; Ismail, I.; Johan, M.F.; Doolaanea, A.A.; Ibrahim, W.N. Thymoquinone, as a Novel Therapeutic Candidate of Cancers. Pharmaceuticals 2021, 14, 369. [Google Scholar] [CrossRef]
  53. Livak, K.J.; Schmittgen, T.D. Analysis of relative gene expression data using real-time quantitative PCR and the 2− ΔΔCT method. Methods 2001, 25, 402–408. [Google Scholar] [CrossRef]
  54. Hodroj, M.H.; Jardaly, A.; Abi Raad, S.; Zouein, A.; Rizk, S. Andrographolide potentiates the antitumor effect of topotecan in acute myeloid leukemia cells through an intrinsic apoptotic pathway. Cancer Manag. Res. 2018, 10, 1079. [Google Scholar] [CrossRef] [Green Version]
  55. Musalli, M.G.; Hassan, M.A.; Sheikh, R.A.; Kalantan, A.A.; Halwani, M.A.; Zeyadi, M.; Hosawi, S.; Alhosin, M. Thymoquinone induces cell proliferation inhibition and apoptosis in acute myeloid leukemia cells: Role of apoptosis-related WT1 and BCL2 genes. Eur. J. Cell Sci. 2019, 1, 2–9. [Google Scholar] [CrossRef]
  56. Quentmeier, H.; Reinhardt, J.; Zaborski, M.; Drexler, H. FLT3 mutations in acute myeloid leukemia cell lines. Leukemia 2003, 17, 120–124. [Google Scholar] [CrossRef] [Green Version]
  57. Gupta, M.; Han, J.J.; Stenson, M.; Maurer, M.; Wellik, L.; Hu, G.; Ziesmer, S.; Dogan, A.; Witzig, T.E. Elevated serum IL-10 levels in diffuse large B-cell lymphoma: A mechanism of aberrant JAK2 activation. Blood 2012, 119, 2844–2853. [Google Scholar] [CrossRef]
  58. Bellon, M.; Moles, R.; Chaib-Mezrag, H.; Pancewicz, J.; Nicot, C. JAG1 overexpression contributes to Notch1 signaling and the migration of HTLV-1-transformed ATL cells. J. Hematol. Oncol. 2018, 11, 119. [Google Scholar] [CrossRef]
  59. Ai, L.; Mu, S.; Sun, C.; Fan, F.; Yan, H.; Qin, Y.; Cui, G.; Wang, Y.; Guo, T.; Mei, H. Myeloid-derived suppressor cells endow stem-like qualities to multiple myeloma cells by inducing piRNA-823 expression and DNMT3B activation. Mol. Cancer 2019, 18, 88. [Google Scholar] [CrossRef]
  60. Zhang, T.J.; Zhou, J.D.; Yang, D.Q.; Wang, Y.X.; Wen, X.M.; Guo, H.; Yang, L.; Lian, X.Y.; Lin, J.; Qian, J. TET2 expression is a potential prognostic and predictive biomarker in cytogenetically normal acute myeloid leukemia. J. Cell. Physiol. 2018, 233, 5838–5846. [Google Scholar] [CrossRef]
  61. Ayatollahi, H.; Sadeghian, M.H.; Naderi, M.; Jafarian, A.H.; Shams, S.F.; Motamedirad, N.; Sheikhi, M.; Bahrami, A.; Shakeri, S. Quantitative assessment of Wilms tumor 1 expression by real-time quantitative polymerase chain reaction in patients with acute myeloblastic leukemia. J. Res. Med. Sci. 2017, 22, 54. [Google Scholar] [PubMed]
  62. Relles, D.; Chipitsyna, G.I.; Gong, Q.; Yeo, C.J.; Arafat, H.A. Thymoquinone promotes pancreatic cancer cell death and reduction of tumor size through combined inhibition of histone deacetylation and induction of histone acetylation. Adv. Prev. Med. 2016, 2016, 1407840. [Google Scholar] [CrossRef] [PubMed] [Green Version]
  63. Kamal, A.; Nazari, M.; Yaseen, M.; Iqbal, M.A.; Ahamed, M.B.K.; Majid, A.S.A.; Bhatti, H.N. Green synthesis of selenium-N-heterocyclic carbene compounds: Evaluation of antimicrobial and anticancer potential. Bioorg. Chem. 2019, 90, 103042. [Google Scholar] [CrossRef]
  64. Habib, A.; Nazari, M.; Iqbal, M.A.; Bhatti, H.N.; Ahmed, M.K.; Majid, A.A. Unsymmetrically substituted benzimidazolium based Silver (I)-N-heterocyclic carbene complexes: Synthesis, characterization and in vitro anticancer study against human breast cancer and colon cancer. J. Saudi Chem. Soc. 2019, 23, 795–808. [Google Scholar] [CrossRef]
  65. Badroon, N.; Abdul Majid, N.; Al-Suede, F.S.R.; Nazari, V.M.; Giribabu, N.; Abdul Majid, A.M.S.; Eid, E.E.; Alshawsh, M.A. Cardamonin exerts antitumor effect on human hepatocellular carcinoma xenografts in athymic nude mice through inhibiting NF-κβ pathway. Biomedicines 2020, 8, 586. [Google Scholar] [CrossRef]
  66. Nazari, M.; Mahmood, S.; Raman, S. Comparative docking studies of rosmarinic acid and sinesitin to inhibit HSP70. Int. J. Eng. Technol. Sci. 2019, 6, 115–119. [Google Scholar] [CrossRef]
Figure 1. Dose- and time-dependent growth inhibitory effect of TQ in MV4-11 cells. (A) Cytotoxicity of TQ in MV4-11cells was determined by cell counting WST-8 assay after 24 h, 48 h, and 72 h. The IC50 values were 7.8 μM, 5.5 μM, and 3.8 μM, respectively. (B) The viability of MV4-11 cells was confirmed by trypan blue exclusion assay after exposure to IC50 concentrations of TQ for 24 h, 48 h, and 72 h. Data were presented as a percentage relative to the untreated cells. The Paired samples t-test was applied, and the results are stated as mean ± SD (n = 4), where * p < 0.05, ** p < 0.01, *** p < 0.001 are significant versus untreated control cells.
Pharmaceuticals 14 01287 g001
Figure 2. Dose- and time-course effects of TQ on apoptosis in MV4-11 cells. (A) Cells were treated with 7.8 μM, 5.5 μM, and 3.8 μM of TQ at 24 h, 48 h, and 72 h. The annexin V-FITC and PI-stained MV4-11 cells were assessed for apoptosis by flow cytometry. (B) The graph indicates the apoptosis rate in MV4-11 cells after 72 h of exposure to IC50 values. The number of total apoptotic cells is presented as a percentage relative to the total cell numbers. The mean apoptosis before and after treatment and between the four groups showed significant difference when tested with repeated measures ANOVA. Data are representative of three independent experiments and expressed as means ± SD. Where *** p < 0.001 is significant versus untreated control cells.
Pharmaceuticals 14 01287 g002
Figure 3. Flow cytometry histograms for cell cycle analysis of MV4-11cells. (A) Cells were treated with TQ (7.8 μM, 5.5 μM, and 3.8 μM for 24 h, 48 h, and 72 h). Thymoquinone significantly increased the G0/G1 population in MV4-11 cells in a time- and dose-dependent manner. (B) The graph indicates the cell cycle distribution in MV4-11 cells after 72 h of exposure to IC50 values. Data are representative of three independent experiments and expressed as mean ± SD. Where *** p < 0.001 is significant versus untreated control cells. The mean of the G0/G1 population at all treatment groups showed significant differences when tested with repeated measures ANOVA (p < 0.001).
Pharmaceuticals 14 01287 g003
Figure 4. Effects of TQ on gene expression in MV4-11cells. Cells were treated with 5.5 μM of TQ for 48 h. (A) The graph illustrates the downregulation of DNMT1, DNMT3A, and DNMT3B and the up-regulation of TET2 and WT1. (B) The graph shows the up-regulation of SHP-1, SOCS-1, and SOCS-3. (C) The graph shows the downregulation of FLT3-ITD, JAK2, STAT3, STAT5A, and STAT5B. Values are stated as median (interquartile range) (n = 3); where ** p < 0.01, *** p < 0.001 are significant versus untreated control cells.
Pharmaceuticals 14 01287 g004
Figure 5. Effect of TQ on the methylation of SHP-1 promoter 2 region in MV4-11 cells. (A) Pyrosequencing pyrograms for the SHP-1 promoter 2 region methylation status in untreated MV4-11 cells and (B) TQ-treated MV4-11 cells. The percentages shown above each “C” base are the methylation level of the CpG site. (C) Percentages of SHP-1 methylation in MV4-11 cells. (D) The bar graph shows hypomethylation of SHP-1 in MV4-11 cells after TQ treatment. Repeated measures ANOVA was applied and the values are stated as mean ± SD; where * p < 0.05 is significant versus untreated control cells.
Pharmaceuticals 14 01287 g005
Figure 6. Effect of TQ on the methylation of SOCS-3 promoter region in MV4-11 cells. (A) Pyrosequencing pyrograms for the methylation status of SOCS-3 promoter region in untreated MV4-11 cells and (B) TQ-treated MV4-11 cells. The percentages shown above each “C” base are the methylation level of the CpG site. (C) Percentages of SHP-1 methylation in MV4-11 cells. (D) The bar graph shows hypomethylation of SOCS-3 in MV4-11 cells after TQ treatment. Repeated measure ANOVA was applied, and the values are stated as mean ± SD; where * p < 0.05 is significant versus untreated control cells.
Pharmaceuticals 14 01287 g006
Figure 7. Pyrosequencing pyrograms for the methylation status of SOCS-1 promoter in (A) untreated MV4-11 cells; (B) TQ-treated MV4-11 cells. The percentages shown above each “C” base are the methylation level of the CpG site. The percentages shown above each “C” base are the methylation level of the CpG site. (C) Percentages of SOCS-1 methylation in MV4-11 cells.
Pharmaceuticals 14 01287 g007
Figure 8. (A) JAK2 with PDB ID: 3KCK, STAT3 with PDB ID: 3CWG, and STAT5 with PDB ID: 1Y1U from the protein data bank. (B) Crystallography structure of TQ. The interactions between TQ and the studied proteins (C) JAK2, (D) STAT3, and (E) STAT5.
Pharmaceuticals 14 01287 g008
Figure 9. (A) Crystallography structure of the positive control, 5-Aza. The interactions between the 5-Aza and the studied proteins (B) JAK2, (C) STAT3, and (D) STAT5.
Pharmaceuticals 14 01287 g009
Table 1. Percentage of methylation of CpG sites in the promoter region of SHP-1 gene.
CellsCpG-1CpG-2CpG-3CpG-4Mean ± SD
Untreated MV4-11 cells129889.3 ± 1.8
TQ-treated MV4-11 cells88867.5 ± 1.0
5-Aza-treated MV4-11 cells138005.2 ± 2.1
Unmethylated DNA control60001.5 ± 0.4
Methylated DNA control95881008491.8 ± 15.7
Unmethylated Bisulfite-unconverted DNA control00000
Table 2. Percentage of methylation of CpG islands in the promoter region of SOCS-3 gene.
CellsCpG-1CpG-2CpG-3Mean ± SD
Untreated MV4-11 cells6084.7 ± 1.1
TQ-treated MV4-11 cells6002.0 ± 0.7
5-Aza-treated MV4-11 cells0000
Unmethylated DNA control0000
Methylated DNA control899610095.0 ± 15.5
Unmethylated Bisulfite-
unconverted DNA control
0000
Table 3. Percentages of methylation of CpG islands in the promoter region of SOCS-1 gene.
SOCS-1CpG-1CpG-2CpG-3CpG-4CpG-5CpG-6CpG-7Mean ± SD
Untreated MV4-11 cells00700702.0 ± 0.4
TQ-treated MV4-11 cells00570001.7 ± 0.9
5-Aza-treated MV4-11 cells00000000
Unmethylated DNA control50860603.6 ± 1.3
Methylated DNA control828610089931007989.9 ± 22.3
Unmethylated Bisulfite-unconverted DNA control00000000
Table 4. Free binding energy (FBE) of TQ and 5-Aza after interaction with studied proteins.
FBE (Kcal/mol)Ki
TQ5-AzaTQ5-Aza
JAK2−5.99−6.3740.79 μM21.51 μM
STAT3−6.68−6.5212.76 μM16.68 μM
STAT5−6.04−6.037.64 μM40.21 μM
Table 5. Primer sequences for RT-qPCR assay.
GenesAccession NumbersPrimer Sequence (5′-3′)Reference
SHP-1NC_000012.12Forward: GCCTGGACTGTGACATTGAC
Reverse: ATGTTCCCGTACTCCGACTC
[43]
SOCS-1NC_000016.10Forward: GACGCCTGCGGATTCTAC
Reverse: AGCGGCCGGCCTGAAAG
[54]
SOCS-3NC_000017.11Forward: GACCAGCGCCACTTCTTCAC
Reverse: CTGGATGCGCAGGTTCTTG
[55]
FLT3-ITDNC_000013.11Forward: ACGCTTGGAAGCAGGAGAT
Reverse: CACAAGGCTGCCCTCTAGTT
[56]
JAK2NC_000009.12Forward: TGTCTTACCTCTTTGCTCAGTGGCG
Reverse: CAATGACATTTTCTCGCTCGACAGC
[57]
STAT3NC_000017.11Forward: GATTGACCAGCAGTATAGCCGCTTC
Reverse: CTGCAGTCTGTAGAAGGCGTG
[58]
STAT5ANC_000017.11Forward: GAAGCTGAACGTGCACATGAATC
Reverse: GTAGGGACAGAGTCTTCACCTGG
[45]
STAT5BNC_000017.13Forward: AGTTTGATTCTCAGGAAAGAATGT
Reverse: TCCATCAACAGCTTTAGCAGT
[45]
DNMT1NC_000019.10Forward: TAT CCG AGG AGG GCT ACC
Reverse: TAA GCA TGA GCA CCG TTCT
[59]
DNMT3ANC_000002.12Forward: GGA GGA CCGAAA GGA CGG A
Reverse: CCC CATTGG GTA ATA GCTCTG AG
[59]
DNMT3BNC_000020.11Forward: GAG ATC AGA GGC CGA AGA T
Reverse: CTG TCA AGT CCT GTG TGTAG
[59]
TET2NC_000004.12Forward: ACGCTTGGAAGCAGGAGAT
Reverse: CACAAGGCTGCCCTCTAGTT
[60]
WT1NC_000011.10Forward: CAGGCTGCAAAAGAGATATTTTAAGCT
Reverse: GAAGTCACACTGGTATGGTTTCTCA
[61]
β-actinNC_000071.7Forward: CTGGCACCCAGGACAATG
Reverse: GCCGATCCACACGGAGTA
[62]
Table 6. Bisulfite-converted sequences, PCR and pyrosequencing primer sequences for pyrosequencing assays. CpG sites are highlighted in grey.
Assay NameAnalyzed Bisufite SequenceType of PrimerPrimer Sequence (5′-3′)Amplicon Length
SHP-1GAGATGTYGTGGGATYGTTTGGGTTYGTATGYGTGAAGTATTATTTGGGTTTGGAGTGPCR-ForwardGGAGGGTTGAGTAAAAGTAGTTGG94 bp
PCR-ReverseBiotin_ACACTCCAAACCCAAATAATACTT
SequencingTTGGTGGAGGAGGGA
SOCS-1GTYGAAGYGGTTTTYGTYGGAYGTTATYGYGGAAAGAGAAATTAAAAGTG GAGTTGPCR-ForwardAGGGTTTAGAAGAGAGGGAAATA85 bp
PCR-ReverseBiotin_CCCCCAACTCCACTTTTAATT
SequencingGAAGAGAGGGAAATAGG
SOCS-3GTYGGTATTTYGATTYGTTATTGTAGATGTAGTTATTAA TAPCR-ForwardGGAGGTTTTGGGTTTGGTATTTAGTAA207 bp
PCR-ReverseBiotin_AAACCCTTCCCCAAATCTCATAAAT
SequencingATTTAGTAAAGTTGTGGTTTGAG
Publisher’s Note: MDPI stays neutral with regard to jurisdictional claims in published maps and institutional affiliations.

