1. Introduction
Climate change (CC) is the variation of climate due to anthropogenic activities and natural climatic variations that either directly or indirectly modify the structure of the global atmosphere, observed over a similar time frame [
1]. There is a growing number of researchers of CC globally [
2,
3,
4,
5,
6] due to its impacts on the core aspects of life such as agriculture, water resources, the environment, and socio-economic development [
7,
8]. Although wind speed, humidity, hours of sunshine, temperature, and precipitation can be used to assess climate change and variability, the last two parameters are the most commonly used globally [
9,
10,
11].
Most climate change studies and models at global and regional levels show that temperature is increasing while precipitation is not only reducing, but also increasingly unreliable and unpredictable. There are also high frequencies of extreme events such as droughts and floods [
12,
13,
14,
15,
16,
17]. Global projections show an increase in the frequency and intensity of precipitation and temperature extremes, with the increases related to an increase in greenhouse gas concentrations, according to a special report on managing the risk of extreme events and disasters to advance CC adaptation (SREX) [
18]. The national oceanic and atmospheric administration (NOAA) of the United States of America declared that July 2021 was the hottest month in recorded history [
19]. This increase only shows that climate change and impacts thereof could become worse if no action is taken to reduce greenhouse gas emissions. In Africa, recent CC projections for short-term (2030–2059) and long-term (2070–2099) scenarios, using the sixth phase of the Coupled Model Intercomparison Project (CMIP6), show significant temperature increases. However, the rainfall exhibits seasonal variability, with decreasing trends expected in the north and south parts and an increasing trend in the central region [
20]. However, there are discrepancies in the causes of observed global climate change. Some studies consider natural causes such as volcanic activities and sunspots as the responsible factors [
21,
22,
23]. The Intergovernmental Panel on Climate Change (IPCC) points at anthropogenic activities that are releasing greenhouse gases, predominantly methane (CH4) and carbon dioxide (CO2), into the atmosphere at an unprecedented level as the leading causes of the observed climate change, although natural causes are recognized [
24,
25].
Some studies on climate variability and CC have been conducted in Uganda at the national and regional levels [
26,
27,
28,
29]. These studies have confirmed observable changes in the temperature and rainfall over the country, impacting many sectors [
30,
31,
32]. In particular, five sectors of agriculture and livestock, water, energy, human settlements, and transport are identified by the Ministry of Water and Environment (MWE) as the most vulnerable [
28] to the effects of climate change. The achievement of Uganda’s 2040 Vision, which envisages a transformed society from a peasant to a modern and prosperous one in 2040 [
33], and sustainable development goals (SGDs) is also threatened by climate change. The way to achieve the vision is through five-year National Development Plans (NDPs), which recognize agriculture, services, industry, and water as critical requirements for achieving the vision [
34]. Nevertheless, agricultural production and water resources availability are more susceptible to climate change risks because of their dependence on rainfall and temperature [
35,
36,
37,
38,
39].
Although many regions are vulnerable, the Lake Kyoga basin, especially the Mount Elgon area, has been identified as one of the most vulnerable to climate change influences in terms of extreme weather events such as floods in the lowlands, landslides in the steep slopes, and droughts, which affect livelihoods [
28,
40,
41,
42,
43]. Some of the studies have focused on only rainfall changes in the Lake Kyoga basin and have shown changes in rainfall over time [
44]. Others have focused on carbon sequestration and carbon dioxide and methane emissions by wetlands [
45]. Although these national-level studies are very informative, they do not show climate changes at local levels, which is vital for the design of mitigation measures for affected communities [
46,
47,
48]. Such activities include agriculture, which is the mainstay in the study area and in most parts of Uganda [
27,
28,
49] and supports over 70% of the local economy [
50]. Therefore, there is a need to study climate changes at local levels to identify tailored mitigation and adaptation measures that suit particular local communities or regions.
Climate (temperature and rainfall) variability in Uganda is controlled by many drivers, which include, among others, the Inter-Tropical Convergence Zone (ITCZ), given that Uganda is located across the equator, monsoonal winds, subtropical anticyclones, large water bodies, moist westerly winds from the Congo basin, topography, and anthropogenic activities [
30,
51,
52,
53]. These drivers make the country experience wide-ranging rainfall, with some areas experiencing heavy rainfall while others receive less rainfall [
27]. The average annual rainfall is estimated to be 1200 mm [
54]. Climate change has affected the routine influence of these factors and has altered their regular occurrences. Lake Kyoga Basin receives mean annual rainfall ranging from about 800 mm in the northern cattle corridor to 2050 mm in Mount Elgon, and mean annual temperatures range from 23.3 °C to 24.2 °C [
27]. The area receives a bimodal weather cycle, with the first long major rains falling from March–May (MAM) and the second short rains from September–November (SON). The primary dry season starts from December–February (DJF), and the second minor dry season starts from June–August (JJA) [
28,
42]. However, due to climate change, these seasons are changing as the rains have become erratic with unpredictable onsets, shortened seasons, and increasing dry spells. The droughts have become more frequent and the air temperature is increasing, all resulting in difficulties of predicting the planting seasons by local farmers.
Lake Kyoga Basin is an important strategic area where agriculture and fisheries are the main activities. The lake also acts as a reservoir for water discharged from Lake Victoria and its catchment, and it plays a significant role in controlling flooding, the destruction of infrastructure, and loss of life downstream. It is an essential component of the transboundary water resources. The regional governments in East Africa and the Nile basin countries should be interested in the status of this lake. The shallow nature (average of 3 m) [
55,
56] of the lake makes it more vulnerable to impacts of climate change (floods and droughts). Its invasion by water weeds such as Kariba, locally called Nankabirwa (
Salvinia molesta), and water hyacinth (
Eichhornia crassipes) could be enhanced by climate change through an increase in temperature and nutrient loading from the catchments [
56,
57,
58,
59]. Therefore, it is vital to determine climate change in the basin to develop appropriate response strategies.
Many indexes are being applied to detect climate change indicators such as wetness and drought changes. These include the Palmer drought severity index (PSDI) [
60], China-Z index [
61], standard precipitation index (SPI) [
62], standard precipitation and evapotranspiration index (SPEI) [
63], actual precipitation index (API) [
64], and soil and wetness deficit index (SWDI) [
65]. SPI and SPEI are easily accessible and have been applied in many countries in the ecological environment and agriculture [
11,
66,
67,
68,
69,
70]. Temperature anomaly is usually computed using a standardized anomaly index (SAI) and used with SPI to determine climate change [
11,
69].
This study, therefore, focused on using short- and long-term data to determine the occurrence of climate change in the Lake Kyoga basin. Standardized precipitation and anomaly indexes were used to achieve this purpose. This study found that climate change is happening in the Lake Kyoga basin, and temperature and rainfall are increasing. The findings of this study should be helpful to decision and policy-makers and should guide the planning of mitigation and adaptation measures to impacts of climate change in this area.
2. Materials and Methods
2.1. Study Area
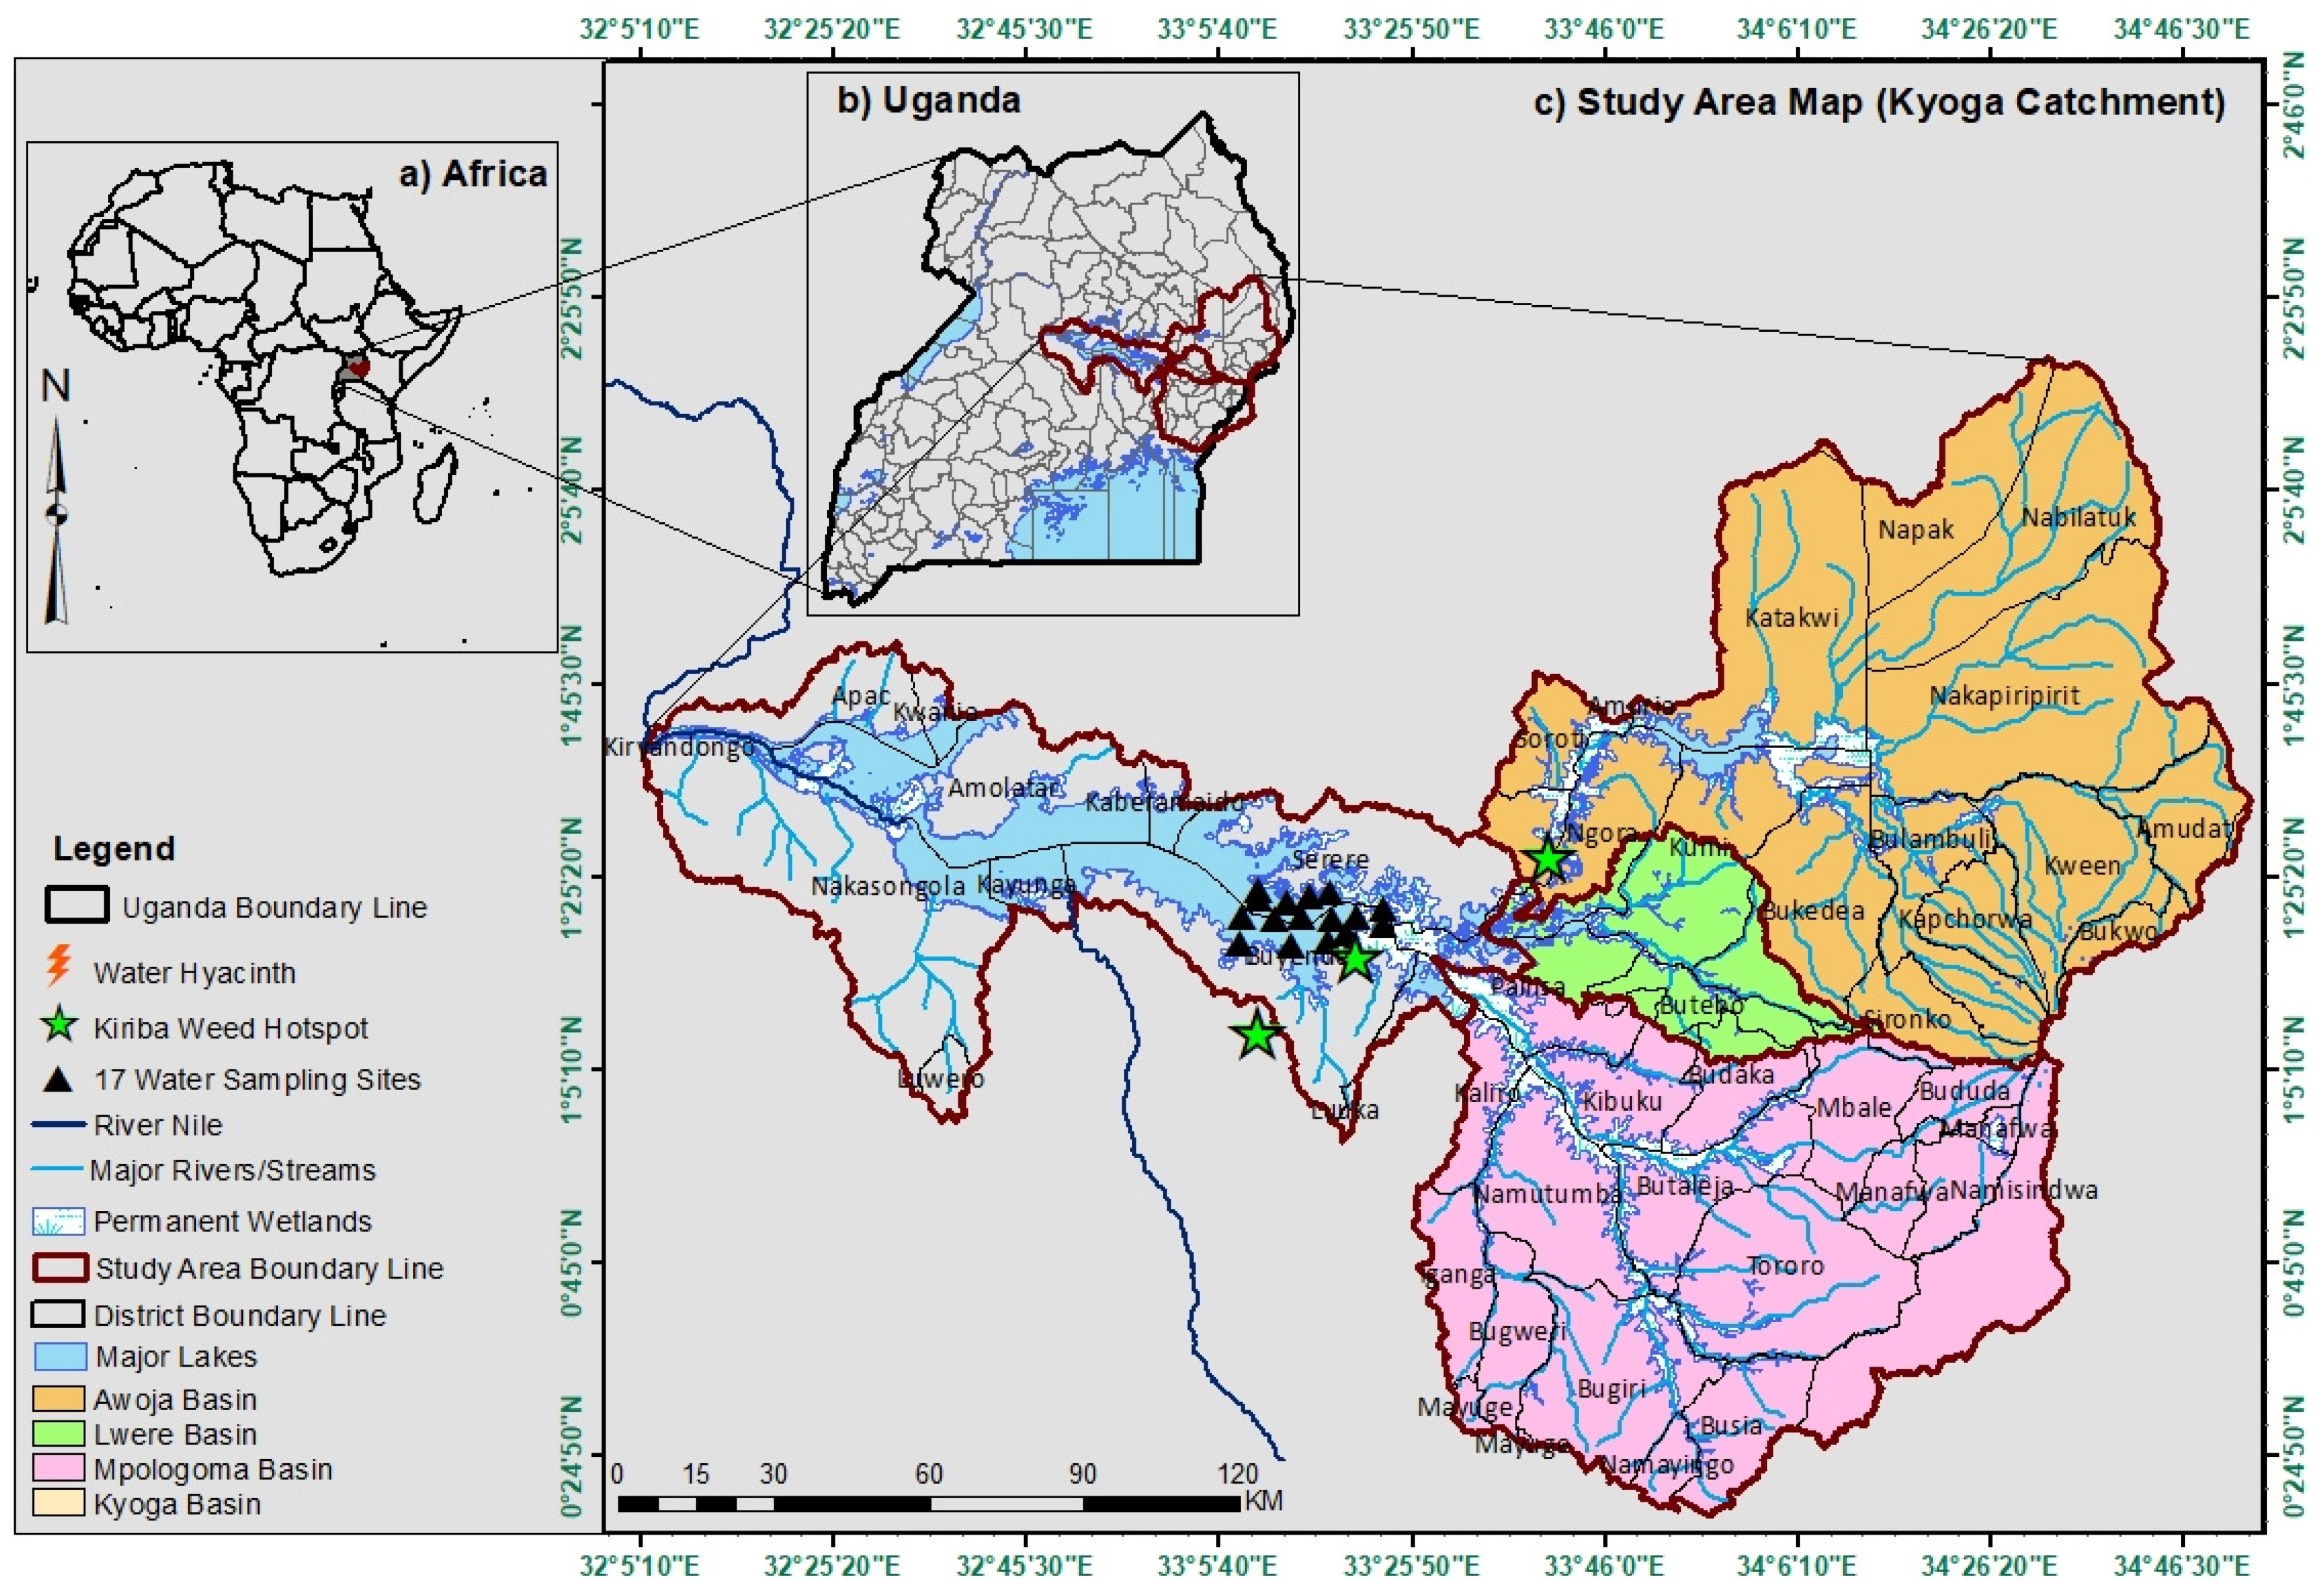
The study area is located in the eastern region of Uganda and covers four catchments, which include Lake Kyoga, Awoja, Mpologoma, and Lwere. It is located north of Lake Victoria with coordinates 0°24.50′ N–2°25.50′ N; 32°5′10′ E–34°46′30′ E, (see
Figure 1). The study area covers 34 districts out of the 58 Lake Kyoga basin districts under the Kyoga Water Management Zone (KWMZ), one of Uganda’s four hydrological water management zones. It has an estimated population of about 9.4 million people [
71], 22% of the total Ugandan population. Lake Kyoga as a catchment is located at the center of Uganda, north of Lake Victoria, with coordinates 1°15′–1°45′ N; 31°31′–33°31′ E. The two lakes are connected by the Victoria Nile, which is part of the River Nile that flows up to Egypt [
55]. Its location is part of the central African plateau at 1100 m above sea level (m.a.s.l) [
56]. It is part of the Kyoga aquatic ecosystem, which consists of many satellite lakes and a network of dense wetlands. The lake area (2000 km
2) makes it the largest among the Kyoga aquatic ecosystems with many arms, including Kwania, Bugondo, and Iyingo.
The Lake Kyoga wetlands mainly comprise extensive mats of Cyperus papyrus L., which is dominant on most of the lake’s shores and its 16 satellite lakes and rivers, although they are now being degraded. The lake is a shallow reservoir; its hydrology is influenced by rivers in the catchment and direct rainfall, with the Victoria Nile being the most significant contributor (82%) and other contributors being other catchment rivers (9%) and direct rainfall (9%) of the water in the lake [
55]. It has many inlet rivers, mainly from the east, such as Awoja, Sezibwa, and Mpologoma, yet it has only one main outlet river, the Albert Nile, which exits in the west and discharges to Lake Albert, after which it continues to Egypt as the White Nile.
The other three catchments, Awoja, Lwere, and Mpologoma, are located east of Lake Kyoga. Awoja is the most extensive catchment with an area of 11,000 km
2 and 14 sub-catchments [
72]. Mpologoma is the second largest with about 9000 km
2 and 13 sub-catchments [
73], while Lwere is the smallest catchment with 1500 km
2. These catchments were chosen because they were drained by two major rivers, Awoja and Mpologoma, which discharge to the eastern arm of Lake Kyoga [
55]. Economic activities in the study area include agriculture, livestock rearing, fishing, urbanization, settlements, navigation, and industry [
56].
2.2. Data Collection Approaches
One of the major challenges to climate change research in Uganda and globally is the lack of reliable and consistent hydro-climatic data [
27,
74]. This study overcame this challenge by utilizing a mixture of both in situ ground observed climate data and satellite/model reanalysis datasets. Observed data were collected from eight (four synoptic, three agricultural, and one hydromet) key meteorological stations in and around the study area (see the location of the meteorological stations in
Figure 1). The data consisted of monthly precipitation totals and monthly mean, minimum, and maximum temperatures collected from the Uganda National Meteorological Authority (UNMA). Monthly data were used as they were readily available, and the indexes used required monthly data. Other data were blended satellite reanalysis data, with ground observations from Climate Hazards Center Infrared Precipitation with Station data (CHIRPS). Daily rainfall totals were obtained from the Climate Hazards Center, University of California, Santa Barbara, accessed through
https://www.chc.ucsb.edu/data, (accessed on 11 May 2021), and model reanalysis of three hourly minimum and maximum temperature datasets was obtained from Japanese 55-year reanalysis (JRA-55) from the Japan Meteorological Agency, accessed through
https://rda.ucar.edu/datasets/ds628.0 (accessed on 11 May 2021).
The observed monthly rainfall data were acquired from six weather stations within and adjacent to the Lake Kyoga basin area. These included four major synoptic weather stations of Soroti, Lira, Tororo, and Jinja with data of 59 years (1961–2020) and two Agro-Met stations of Serere with data of 59 years (1961–2020) and Buginyanya station with 39 years of rainfall data (1981–2020). Namalu, being a critical meteorological station, had limited recorded data due to insurgency in the area during the 1980s to 1990s. Kiige meteorological station also had insufficient data due to poor maintenance and equipment breakdown. CHIRPS data for a 39-year period were obtained and used for these two stations. Rainfall analyses were performed for both 39-year and 59-year periods to compare changes in rainfall, hence climate change over short-term and long-term periods, respectively. The monthly temperature (maximum, minimum, and mean) in situ ground observation data for the eight meteorological stations were scanty, and they were blended with online JRA data for 39 years (1981–2020). All the in situ station rainfall and temperature data were obtained in CSV (Comma Delimited) format.
The reanalysis data of rainfall and temperature were obtained in GRIB (GRIdded Binary) format stored in NetCDF (Network Common Data Form). CHIRPS daily rainfall data covered 39 years (1981–2020). These data were created by incorporating 0.05° by 0.05° (approximate 5.5 km) resolution satellite imagery with in situ ground station data to create a gridded rainfall dataset. The JRA-55, a three-hourly maximum and minimum temperature at two meters above ground data, was also obtained. It covered 60 years (1971–2020) at a resolution of 0.56251° by 0.56251° (approximately 60 km) satellite imagery. All the reanalysis data were obtained covering the Uganda Domain longitude 28.5 E, 35.5 E, and latitude 2.3 S, 4.5 N.
2.3. Precipitation and Temperature Data Processing Methods and Tools
The in situ ground station data (rainfall and temperature) from each station were approximately 98% complete for the length of the data acquired. The 2% missing data were filled using the existing parallel dataset, built through blending/merging ground observations with satellite reanalyses. The parallel blended dataset underwent vigorous data processing methods, including quality control (outlier checks) and homogeneity tests on ground observation, re-gridding, bias coefficient computation, bias correction/adjustment, and merging ground observation with satellite estimates through a suitable method interpolation technique. Simple bias adjustment for temperature was performed, and we used the Barnes scheme for merging rainfall.
The reanalysis of CHIRPS rainfall and JRA-55 temperature data were processed and extracted using the Climate Data Tool (CDT). All utility functions were accessed from GitHub repository
https://github.com/rijaf-iri/CDT (accessed on 14 May 2021), developed by the International Research Institute for Climate and Society (IRI). It is useful in the quality control of meteorological data, such as merging station data with satellite, homogenization, reanalysis, analysis, and visualization of station and gridded datasets. The data were accessed using R package.
The JRA-55 temperature data were subjected to the following data statistical processes: (a) Aggregation from 3-hourly to daily; (b) Re-gridding of the dataset from its initial coarse resolution of 0.56251° to the CHIRPS grid fine resolution of 0.05°; (c) Inputting elevation for computing the downscaling coefficient on ground observations; (d) Inverse distance weighted technique applied for interpolation; (e) A biased adjustment/correction carried out on the data to simulate ground observations using “Multiplicative Bias Time Step Variable” as the bias method. These processes helped in the acquisition of improved quality temperature data.
The final output of adjusted/biased corrected temperature data and CHIRPS rainfall data was then extracted in CSV format for eight meteorological stations within and adjacent to the study area using their station coordinates. The other extracted dataset was spatially averaged area data for the whole catchment/study area polygon of Kyoga on a daily, monthly, seasonal, and annual temporal scale.
2.4. Spatial and Temporal Data Analysis Tools and Techniques
2.4.1. Spatial Analysis
Climate Data Tool (CDT) was used to compute long-term mean/average (climatological average) for the base/reference period of 1981–2010 recommended by the World Meteorological Organization (WMO) [
75]. Gridded CHIRPS rainfall and JRA-55 reanalysis temperature data were used to produce different products such as the annual climatological average and for the computation of decadal relative anomaly for rainfall and absolute anomaly on temperature data.
The long-term mean/average (Climatological/Population Mean) was computed using Equation (1) as described in [
75]:
where
N is the population size (30 years),
X is the annual rainfall total or annual average temperature (min, max, mean), and
μ is the computed climatological annual average rainfall or temperature (max, min, and mean).
The calculation of the annual mean rainfall/temperature (max, min, and mean) was performed using Equation (2) [
75]:
where
n is the sample size (10 years),
X is the annual mean rainfall total/annual mean temperature (min, max, mean), and
is the computed decadal moving sample annual average rainfall/temperature (max, min, and mean).
The relative anomaly index for decadal rainfall in the analysis of climate change/variability events was computed using Equation (3) [
75]:
where
is the decadal moving sample annual mean rainfall,
μ is the climatological/population annual average rainfall, and
Z1 is the computed relative anomaly index.
The absolute anomaly index for decadal temperature climate in the analysis of change/variability events was computed using Equation (4) [
75]:
where
= the decadal moving sample annual mean temperature (max, min, and mean),
μ is the climatological/population annual average temperature (max, min, and mean), and
Z2 is the computed absolute anomaly index.
The package, ESRI ArcGIS 10.5—Geographical Information System tool, was used for spatial analysis and visualization/outputting spatial maps of annual climatological average rainfall and temperature. It was also used for the production of decadal analysis output of rainfall and temperature anomaly performance over Uganda and the study area.
2.4.2. Temporal Analysis
Climate Data Tool (CDT) was used to compute the standardized anomaly index (SAI) for temperature (minimum, maximum, and mean) and SPI-6 on rainfall data in the study area. SPI-6 months was chosen because it better represented agricultural drought [
76]. Agriculture is the main activity in the study area, and in most cases, there are two farming seasons: one during the first rainy season and the other during the second rainy season. It is also the most susceptible to climate change due to its reliance on rainfall and temperature [
37,
77].
2.5. Standardized Anomaly Index (SAI) Estimation Model
For each of the eight stations (observed and gridded), temperature data for annual mean temperature, mean annual maximum, and mean annual minimum temperature series were analyzed. This determined temperature fluctuations using the standardized anomaly index (SAI), a frequently used index for regional climate change assessments [
11,
78]. Station annual temperature (min, max, and mean) was stated as a standardized departure
from the annual long-term mean (climatological/population mean) (
μ) of temperature (min, max, and mean), respectively, in the base/reference period 1981–2010. SAI was computed using Equation (5) [
75]:
where
χ = the mean (min, max, and mean) temperature of the year,
μ is the annual climatological mean,
σ is the standard deviation of the annual temperature (min, max, and mean) for the climatological mean, and
Z3 is the computed annual temperature (min, max, and mean) SAI. Results where SAI values were below the long-term average were considered cooling periods, while the periods when SAI values were above the long-term average were considered warming periods.
2.6. Standardized Precipitation Index (SPI) Estimation Model
The SPI approach was developed almost 30 years ago to define and monitor droughts [
62]. It mainly requires historical monthly rainfall data as its primary input data to compute different time-scale droughts depending on the study objective. Its ability to show the interval, scale, and spatial level of drought has made it a global tool [
66,
69,
79,
80]. The weakness of the technique is its non-incorporation of temperature, and soil water balance, which would make it suitable for climate change assessment [
62]. Vicente-Serrano et al. [
63] developed a multi-scalar standardized precipitation evapotranspiration index (SPEI) suited for climate change assessment. Nevertheless, in most cases, SPI has been used with the standardized anomaly index (SAI) to assess climate change [
11].
The calculation of SPI-6 months values was performed using the Climate Data Tool (CDT) with the station monthly rainfall data. The computed SPI values were further subjected to statistical analysis in R. Both positive and negative SPI values were generated; negative values were taken to indicate the occurrence of dry periods, while positive values stood for wet periods [
62].
The SPI values that indicated the magnitude of drought and wet seasons are presented in
Table 1. These values were used to determine wet or dry intensities over the study area.
The SPI values above 1.5 and below –1.5 were described as severe weather events, while those from 2 to –2 and above were described as extreme wet and dry weather conditions, respectively.
R-studio, an integrated development environment (IDE) for R, accessed through
https://www.rstudio.com/ (accessed on 20 May 2021), was used to output time-series visualization plots. It was also used to perform time-series trend analysis using the Mann–Kendall test on SPI-6 months rainfall values. The same was used for annual mean temperature (min, max, and mean) SAI values.
2.7. Time Series Trend Analysis
The Mann–Kendall test statistic (
S), a nonparametric method for trend analysis that has been widely applied for regional climate studies [
81,
82,
83], was used for trend analysis testing. It is a measure of the relationship of a variable with time, and as a result, it simply gives information on the course and a measure of the significance of observed trends of climatic parameters [
84]. Time-series trend analyses for SPI-6 and SAI were performed using this test.
The Mann–Kendall test statistic
S (Kendall score) was computed using Equation (6) following work by Siraj et al. [
84]:
where
was the data value at time
i,
n is the length of the dataset, and
is the sign function, which is computed as shown in Equation (7) [
84]:
for
n > 10, the test statistic
Z (Kendall tau) approximately follows a standard normal distribution as in Equation (8):
where Var(
S) is the variance of statistic
S.
A positive Z value indicates an increasing trend, and a negative value indicates a decreasing trend.
This study tested the hypothesis that there was no trend in the Lake Kyoga basin climate record, which was either accepted or rejected, depending on the computed
Z statistic value [
69,
85]. When the computed
Z statistic was less than the critical value of the
Z statistic obtained from the normal distribution table at
α = 5% significance level, the hypothesis was rejected. The hypothesis was accepted when the
Z statistic value was more than the critical
Z statistic.
Whenever the data had a trend, the magnitude of the trend was represented by trend slope
β, as shown in Equation (9):
where
xi and
xj were data values at time
ti and
tj (
i >
j), respectively.
3. Results
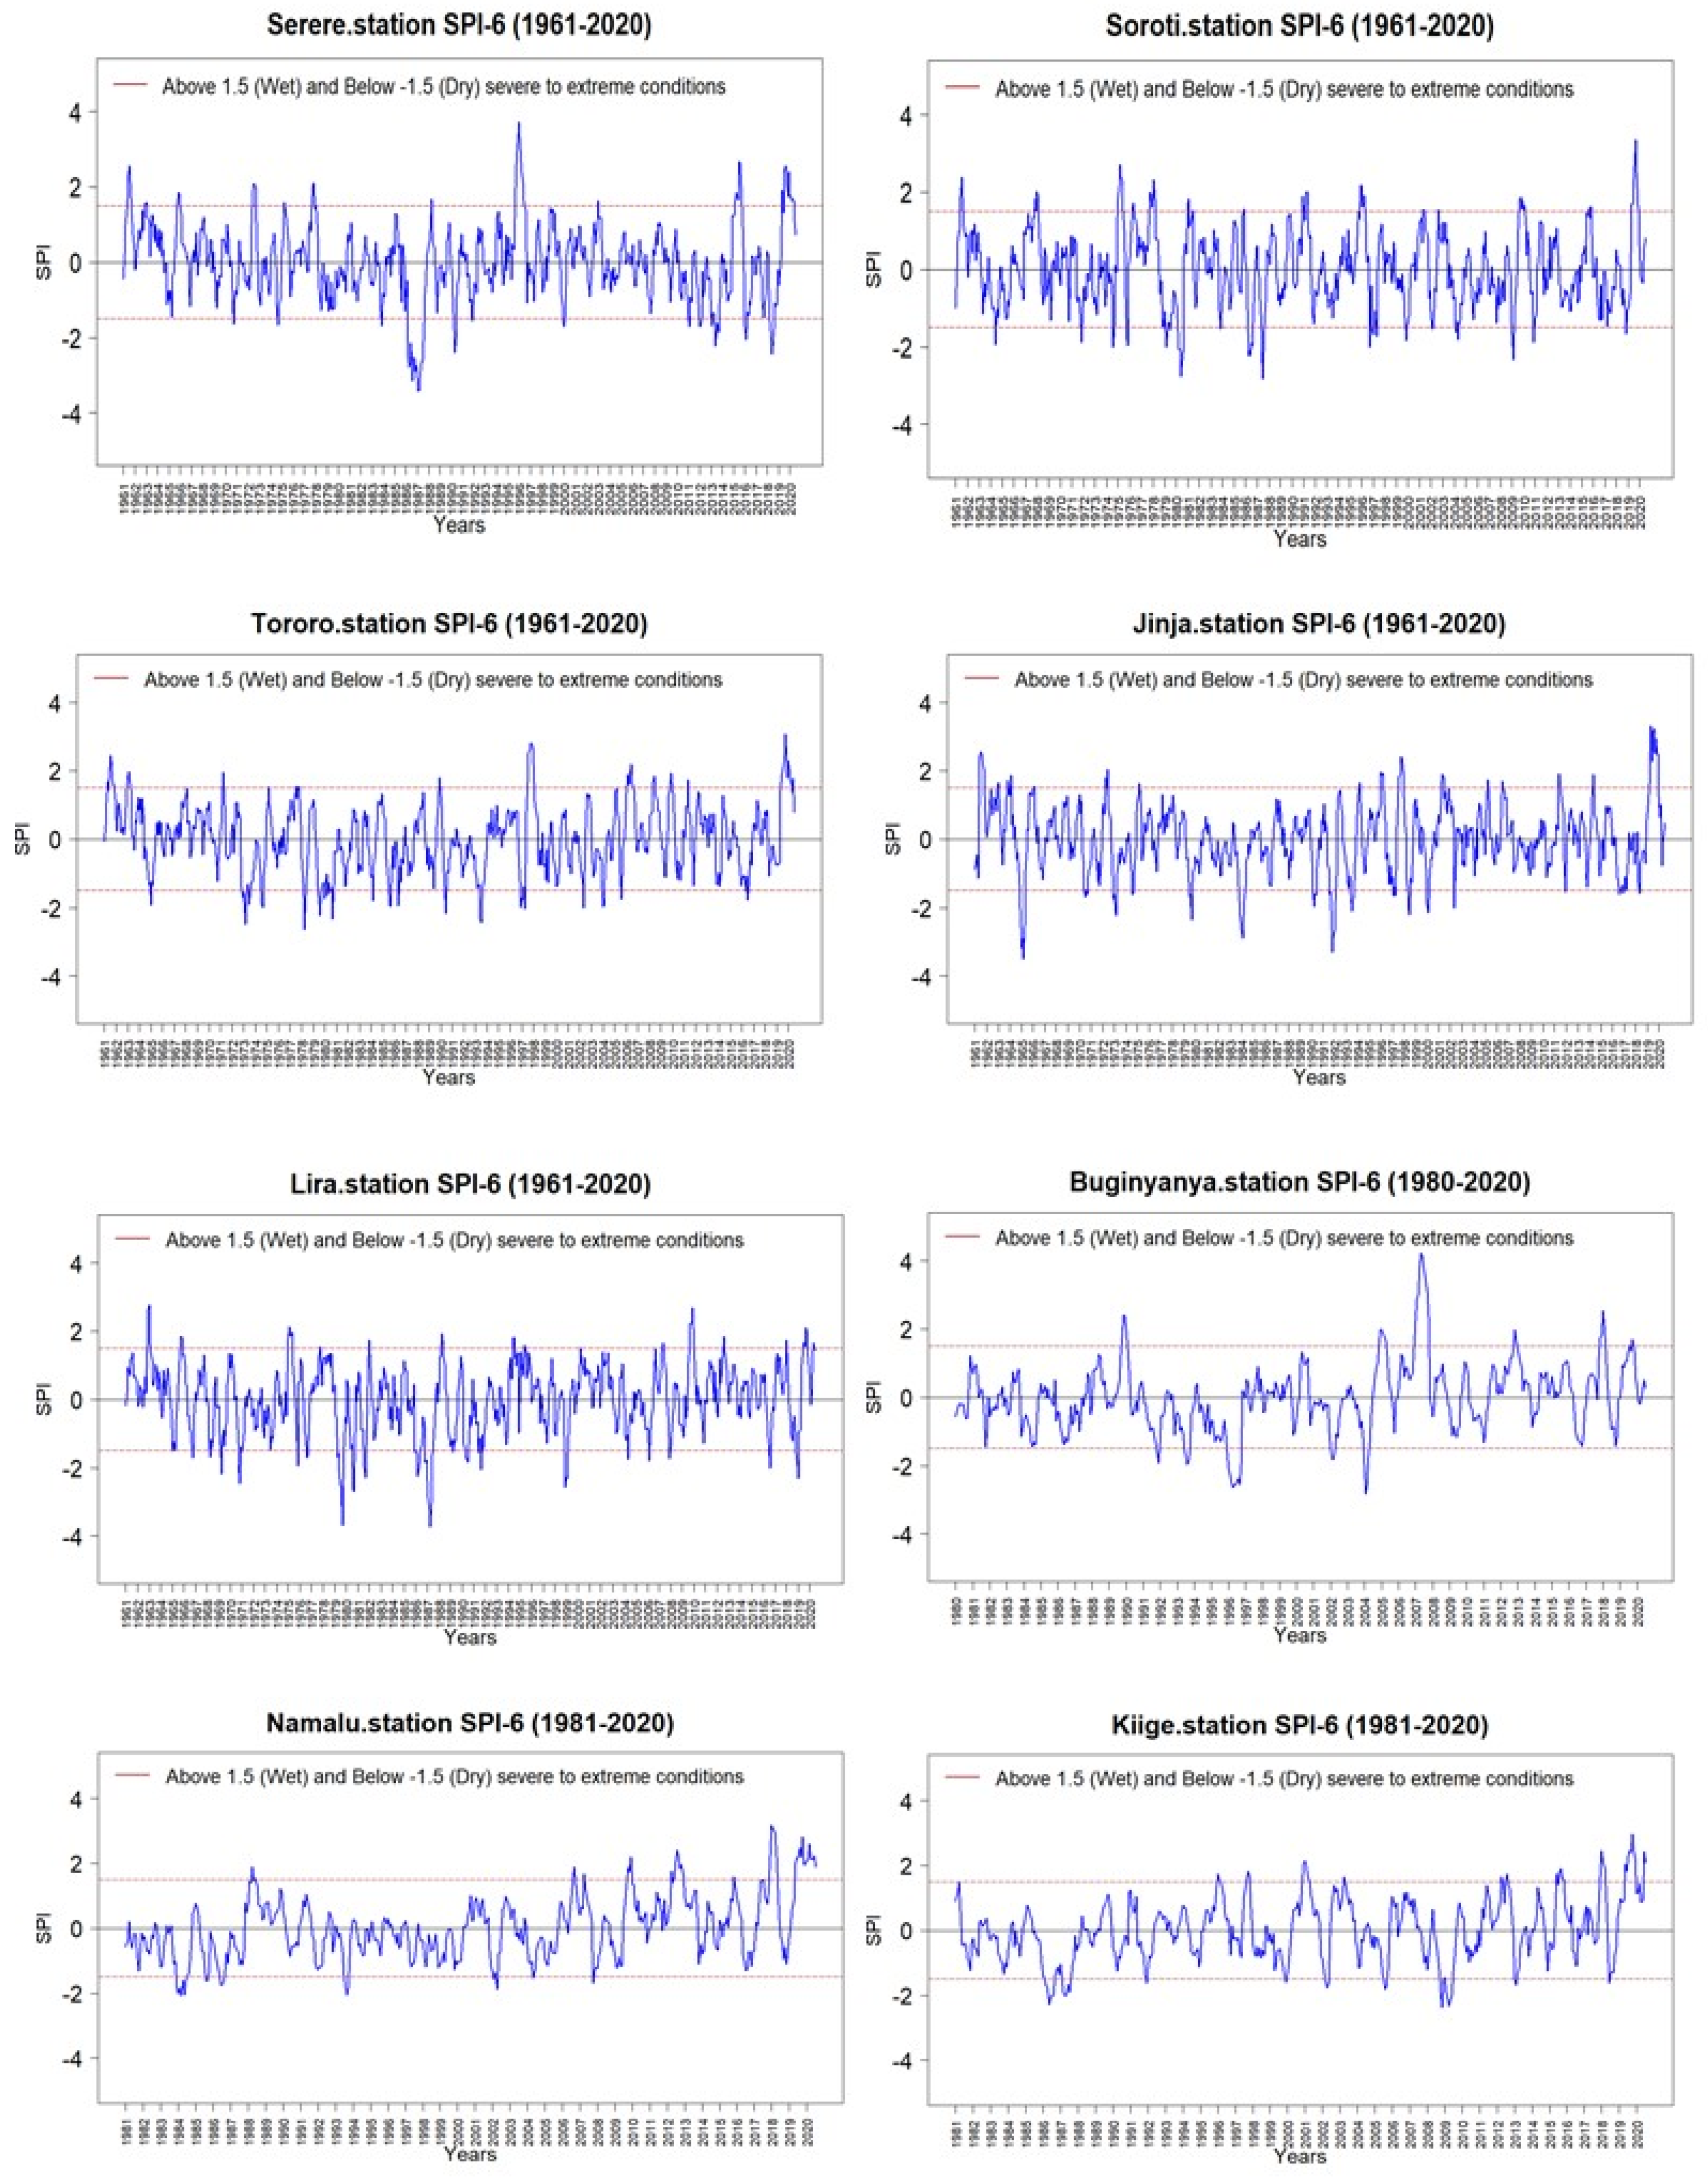
The SPI-6 for short-term (39 years) data showed different variations from one meteorological station to another, with the variation for all stations ranging from −2.234 to −3.672 for drought and 2.712 to 4.217 for wet conditions (
Figure 2). The overall range was from −2.234 to 4.217, with wet conditions registering a higher extreme value of 4.217 than the extreme value of −3.672 for dry weather in Buginyanya and Lira. Long-term data showed a wider range for dry and wet seasons than short-term data. Long-term data showed ranges from −2.633 to −3.724 for dry periods and 2.782 to 4.222 for wet periods (see
Figure 2). The overall range for this long-term observed data was −2.633 to 4.222 from Tororo and Serere, respectively (
Figure 2).
There was no major difference in moderate and extreme dry and wet conditions for short-term data in most stations. For example, Soroti, Serere, and Buginyanya showed similar frequencies at 50% each (see
Table 2). Four of the remaining five meteorological stations had more wet periods than dry periods, with only one (Kiige) having more dry periods (
Table 2). Tororo station showed a wide range of 60 dry and 71 wet seasons, representing 45.8% and 54.2%, respectively.
For long-term data, three (60%) of the five stations had more wet periods, and two (40%) had more dry periods (
Table 3). Both CHIRPS and observed data mostly showed wet climate conditions in 2010–2020, meaning there is a general increase in rainfall compared to droughts. Serere station, for example, experienced floods in 1997, 2014, and 2020 and extended extreme drought from 1985–1988, which resulted in severe famine. These floods also affected the flat Teso region, which is downstream of the catchment. Some of the floodwater that affected Teso was contributed from the upstream Namalu region. Jinja, Tororo, Soroti, and Serere meteorological stations showed the 2020 floods, which affected many areas in the country. Any flood management measures in these downstream areas should include reducing floods from upstream sources.
Occurrences of extreme events in each of the stations displayed variations. For short-term data, extreme wet events occurred 130 times, compared to 54 times for extreme dry weather across the stations. Seven of the eight meteorological stations showed more wet extreme weather events, and only one (Lira) showed more extreme dry weather events (see
Table 4).
In the long-term data, only two (Serere and Tororo) meteorological stations out of five had more frequent extreme wet periods, and three (Soroti, Jinja, and Lira) had more extreme dry weather (
Table 5). When the five meteorological stations, with both short-term and long-term data, were considered, four had extreme wet events in the short-term period, while only two had extreme wet events (
Table 5). This shows that the increase in wet weather conditions is a recent phenomenon, which can likely be attributed to climate change.
This study has also shown that to determine the changes in precipitation due to climate change, it is better to look at both the short- and long-term data.
3.1. Trend Analysis of Standardized Precipitation Index (SPI)
The short-term data showed increasing trends in precipitation, which were statistically significant in all the meteorological stations (see
Table 6).
The results for long-term data showed that three of the five meteorological stations had a negative change in their annual mean rainfall, while two had a positive change (
Table 7).
The Kendall score, which measures the direction (increasing or decreasing) of data values over time for long-term data, showed that Serere, Soroti, and Jinja stations were decreasing, while Tororo and Lira showed an increasing trend (see
Table 7). Statistically significant trends in precipitation were observed in two (Lira and Serere) of the five meteorological stations. Serere showed a statistically significant decreasing trend, while Lira showed a significant increasing trend (
Table 7). Therefore, the null hypothesis, which states that there is no significant difference, was rejected for these meteorological stations. The other three meteorological stations (Soroti, Jinja, and Tororo) showed trends that were statistically insignificant. Soroti and Jinja showed a decreasing insignificant trend while Tororo showed an increasing insignificant trend in precipitation. The null hypothesis was, therefore, accepted for the trends in these meteorological stations.
3.2. Prediction of Occurrence of the Dry and Wet Season
Over time, the climate in the study area has shown variations in the dry and wet season, with wet conditions dominating in the recent past. Long-term data revealed that dry conditions have generally been dominant in the area. According to both short- and long-term data, mild wet and dry conditions are the most common in the study area and occur once every 0.2 years. This indicated that the Lake Kyoga basin experiences mild rainfall and dry periods throughout the year (
Table 8 and
Table 9).
Moderate wet and dry conditions are also common in the study area, and on average, they occur once every year. Jinja meteorological station showed the lowest frequency of moderate wet seasons of 1.0 in 1.9 years within the 39-year study period, while Lira experienced the highest frequency of moderate occurrences of 1.0 in 0.8 years (
Table 8).
Severe wet weather conditions varied from one meteorological station to another, with Soroti and Tororo stations showing the highest frequency of 1.0 in 1.5 years. On the other side, Jinja experienced the most minor frequency of 1.0 in 3.3 years. Serere experienced more frequent occurrences of severe dry conditions of 1.0 in every 1.4 years. In contrast, Lira experienced the least frequent occurrences of severe dry weather of 1.0 in 3.3 years over the same short-term study period (
Table 8).
In the long-term period of study, there was less variation in the occurrence of severe dry weather, with four of the five meteorological stations experiencing it once in two years and only Serere experiencing it 1.0 in 2.4 years. However, the occurrence of wet seasons varied, with Soroti experiencing the highest frequency of 1.0 in 1.4 years and Lira experiencing the most minor frequency of 1.0 in 2.7 years (
Table 9).
There was an observed increase in the frequency of extreme wet conditions compared to extreme dry conditions, indicating an increase in rainfall and flood frequency. The Jinja meteorological station experienced the highest frequency of 1.0 in 1.3 years of extreme wet conditions. On the other hand, the Lira station experienced the lowest frequency of 1.0 in 3.9 years in short-term periods and 1.0 in 6.6 years in long-term periods. The same station experienced the highest frequency of extreme dry weather of 1.0 in 2.4 years and 1.0 in 2.5 years for short- and long-term periods. Soroti, Tororo, Buginyanya, Serere, and Jinja meteorological stations experienced fewer frequencies of extreme dry weather conditions (
Table 9). These findings show which stations are prone to extreme dry or wet weather conditions.
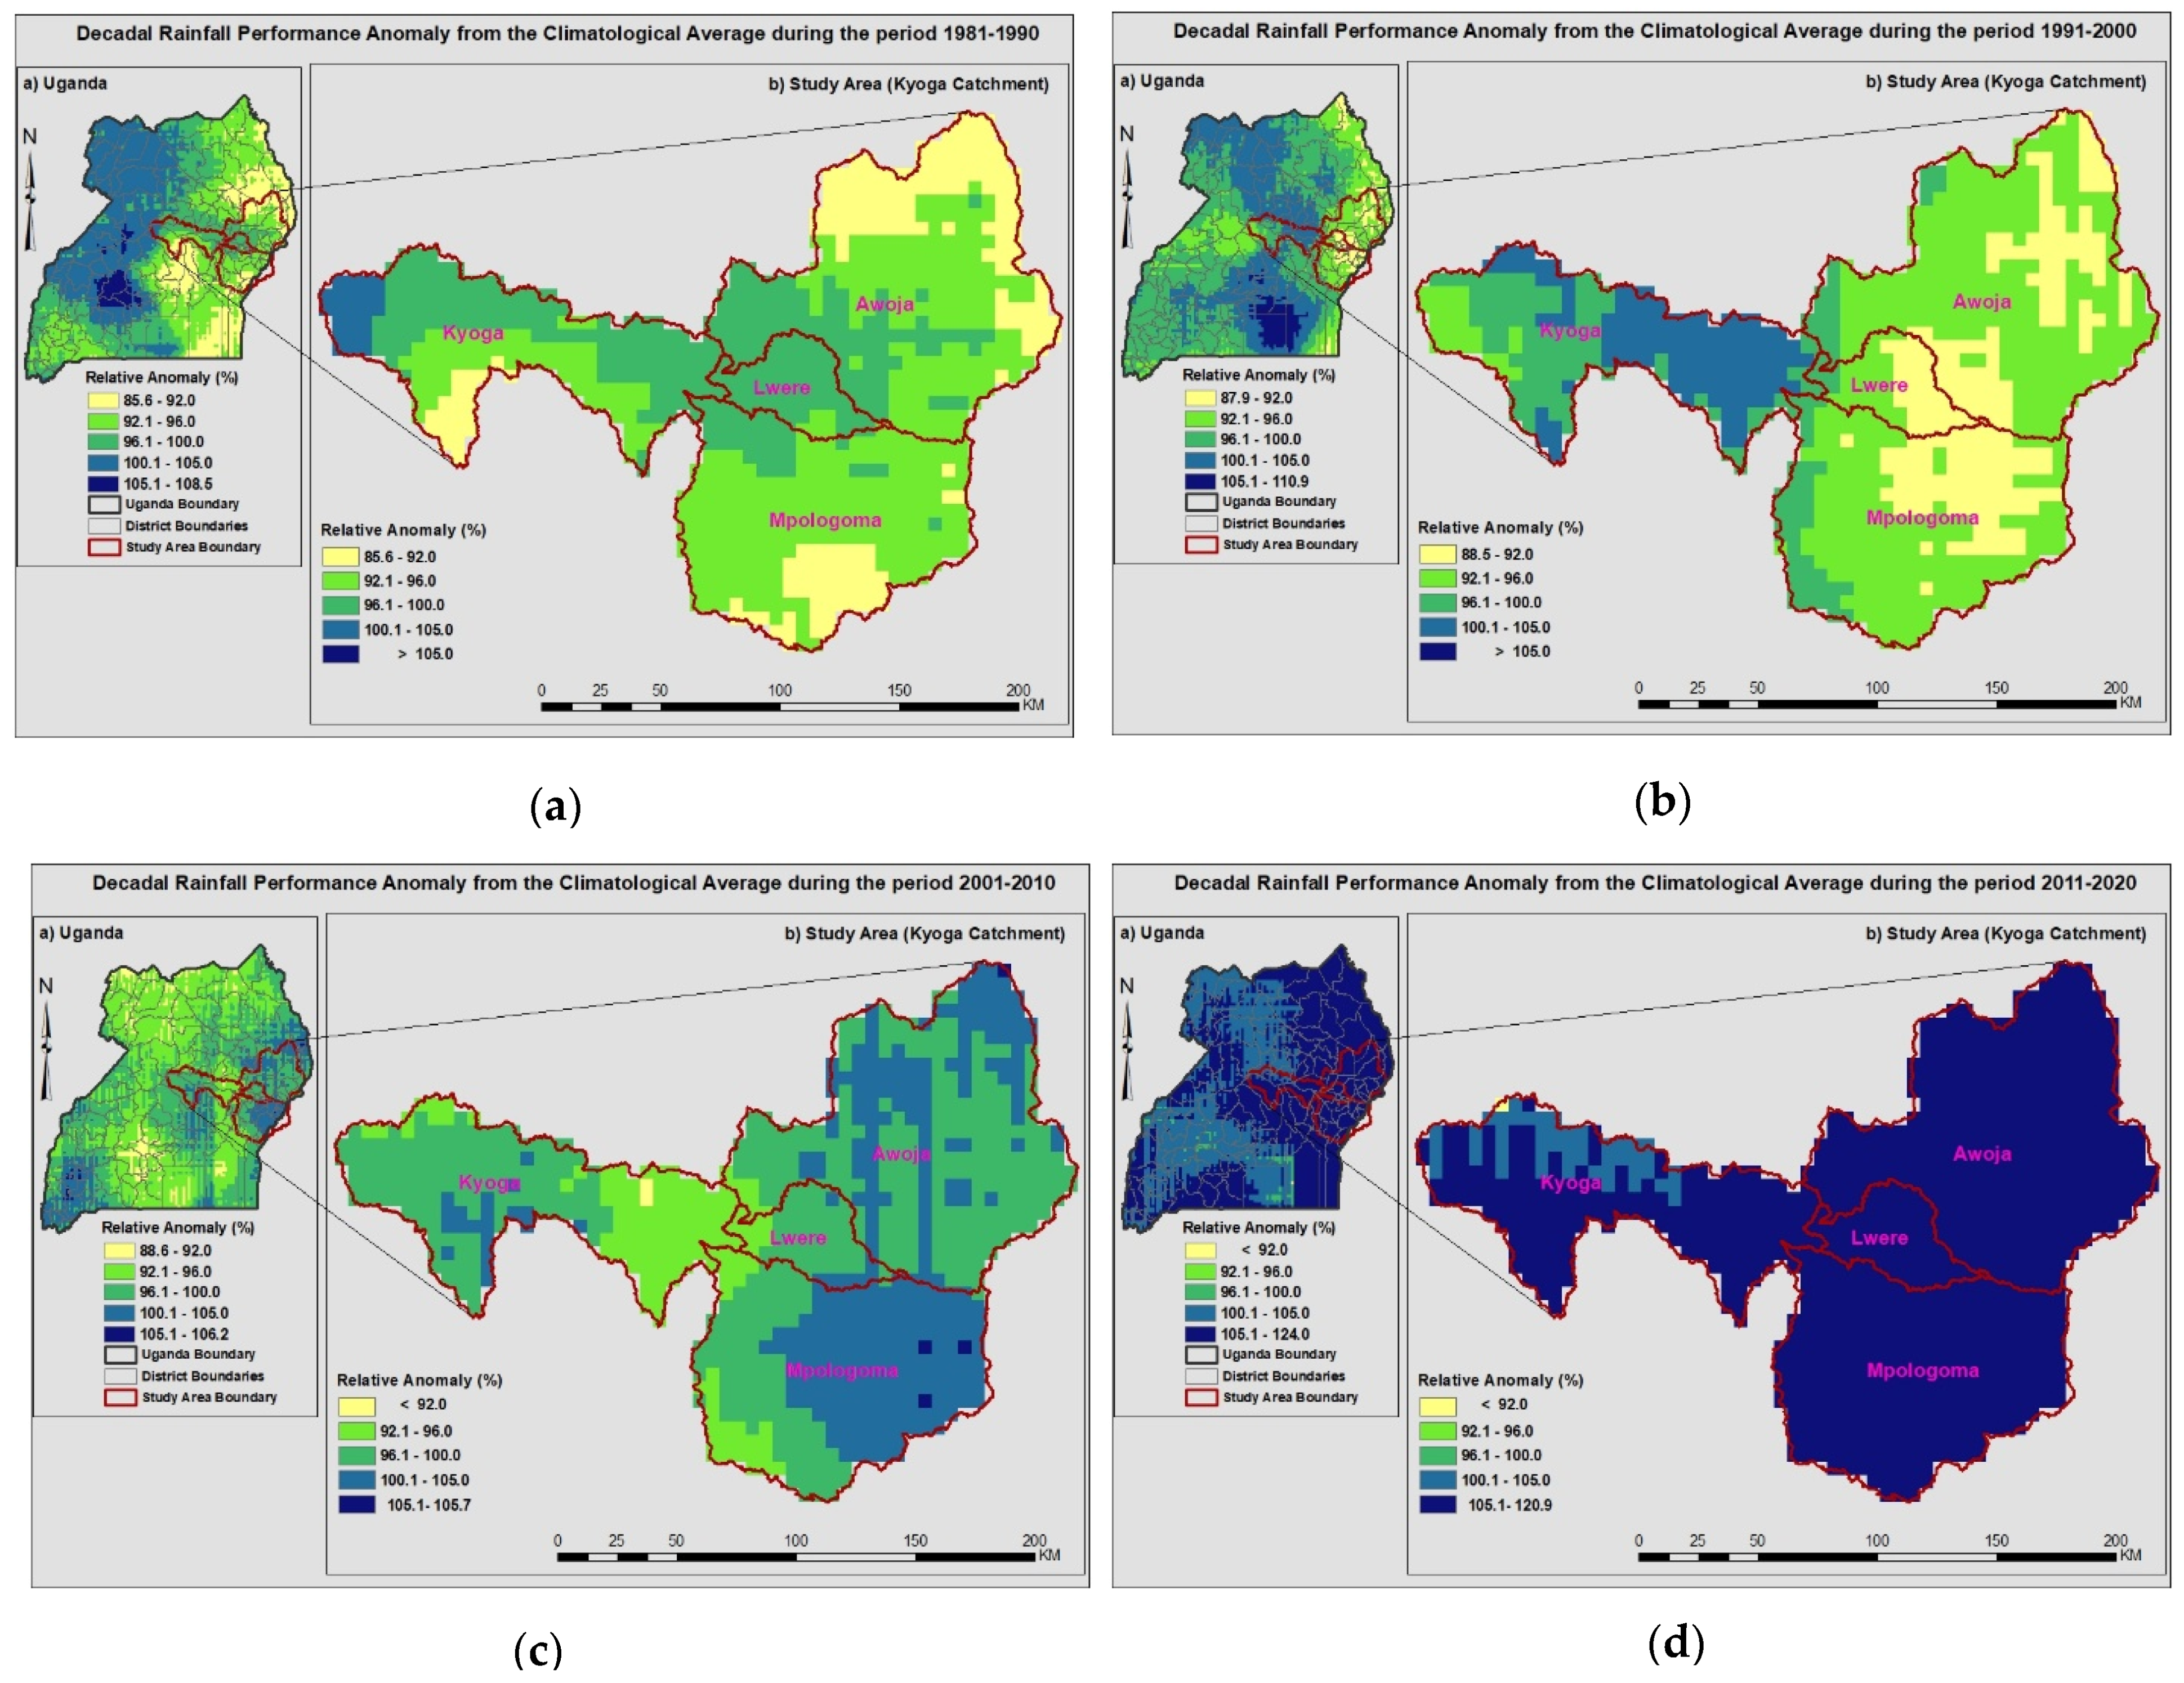
3.3. Decadal Analyses of Precipitation
Changes in precipitation over a four-decade period (1980–2020) were determined in the study area (
Figure 3). The relative anomaly was calculated in reference to the climatological base period of 1981–2010, set by the WMO. The results revealed that precipitation generally increased in this area over the four-decade period, which does not agree with global and regional studies and projections. However, it agrees with the recent findings by Onyutha et al. [
44], who observed that rainfall in the eastern side of the Lake Kyoga basin was increasing.
Over the decades, there have been shifts in rainfall amounts, with 1981–1990 experiencing heavy rains in western parts of the country while the upstream areas of Mpologoma and Awoja catchments received less rain. The 1991–2000 decade had more rain in the Lake Kyoga area, and the catchments had relatively less rainfall. The 2001–2010 decade experienced more rains in the Mount Elgon highlands, most parts of the Mpologoma catchment, and upstream of Awoja catchment. The 2011–2020 decade, compared to the climatological base period, received heavy rains, especially in the catchments of the study area (
Figure 3).
3.4. Standardized Anomaly Index SAI
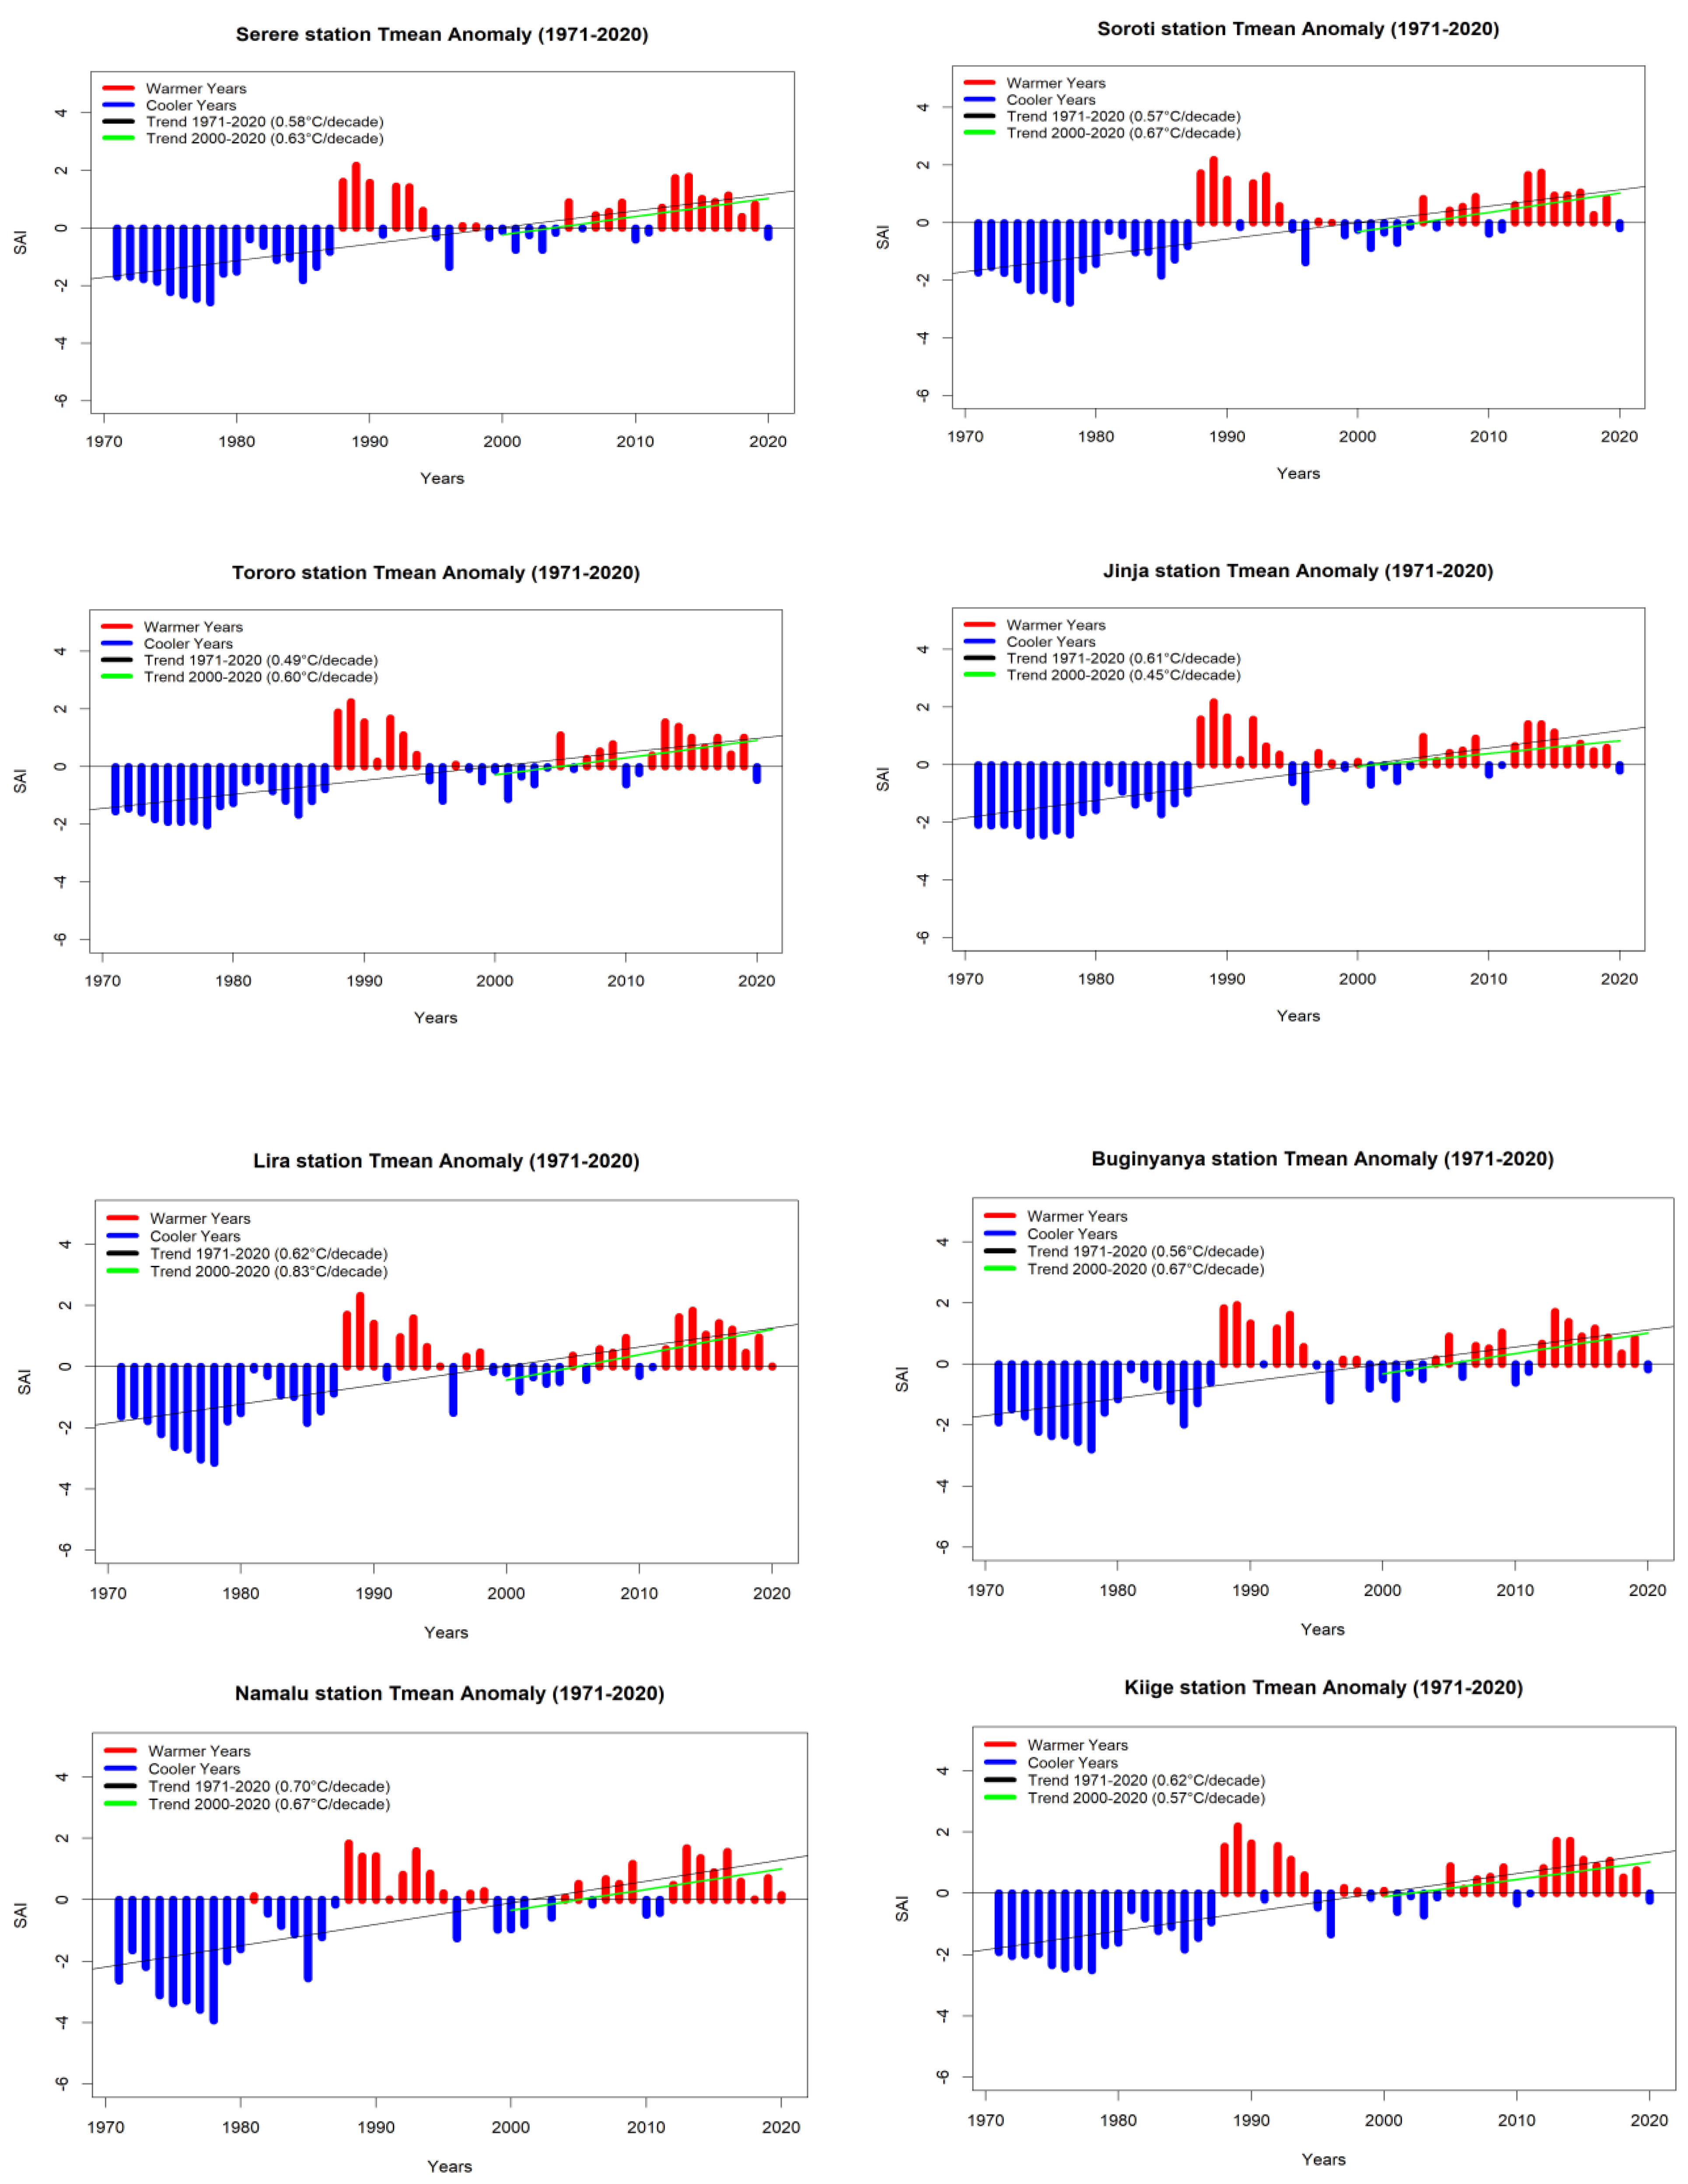
Temperature data from the eight meteorological stations were used to produce SAI for mean annual T-mean, T-max, and T-min for a long-term period of 49 years (1971–2020), and short-term period of 20 years (2000–2020) of data (in
Figure 4,
Figure 5 and
Figure 6). Mean temperature for all the eight stations compared to the base period showed a similar trend of cooler temperatures in the 1970s to 2000s with some warm periods in the 1990s (
Figure 3). However, during the 2000 to 2020 period, there was an increasing trend in mean temperature (
Figure 4). Overall, there has been a steady increase in mean temperature since the 1970s to the 2020s. The increase in mean temperature in the Lake Kyoga basin could be due to climate variability and change.
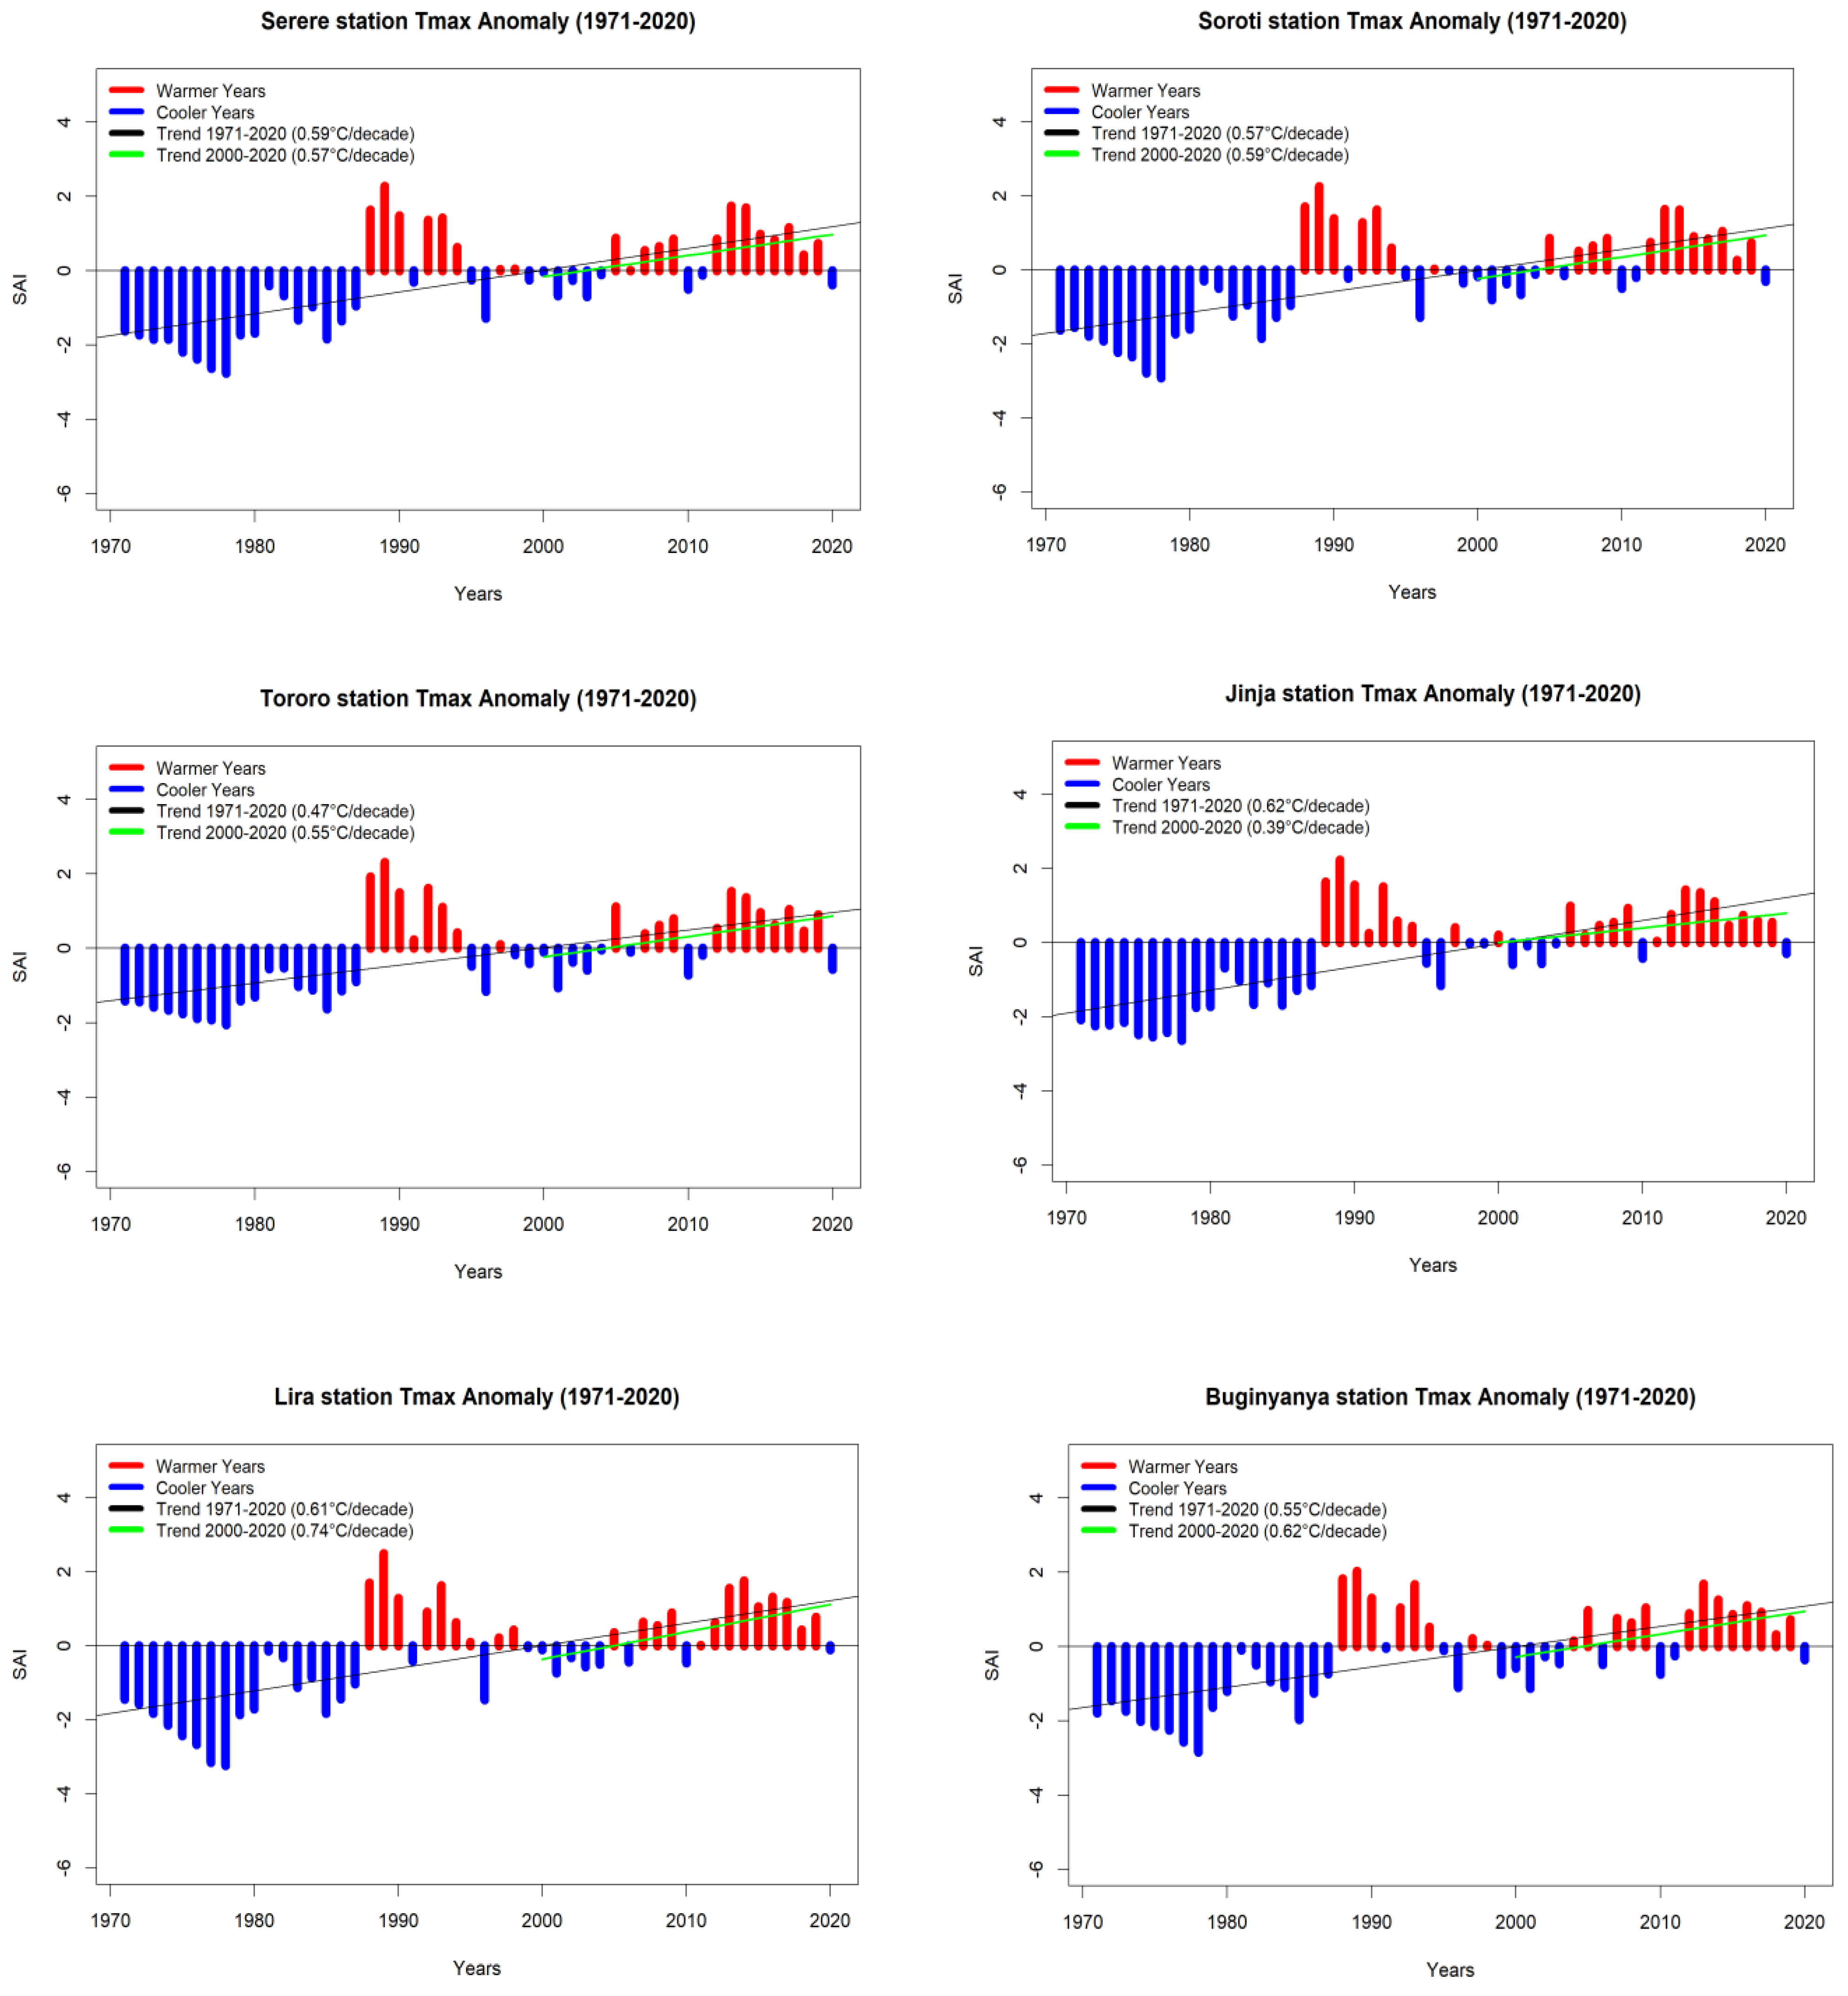
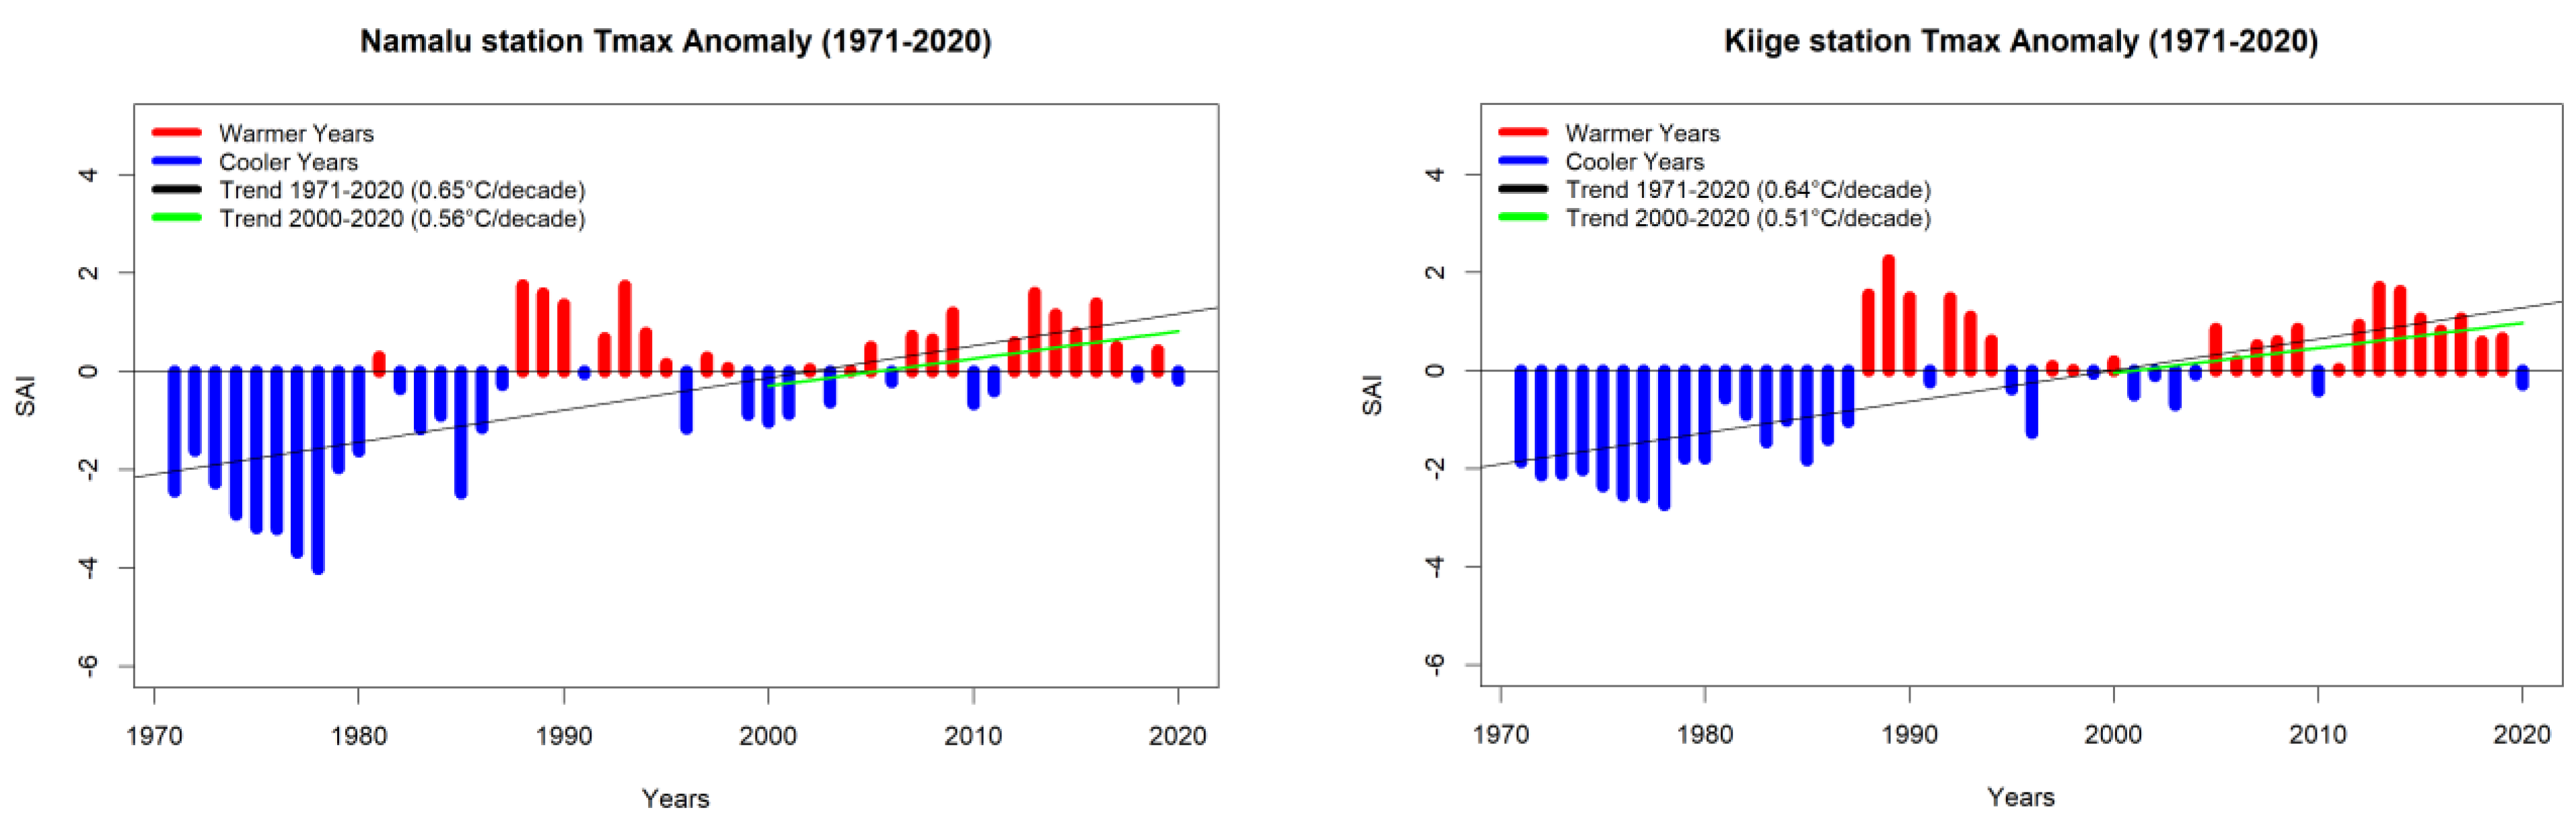
The change in mean annual maximum temperature (T-max) over the short-term and long-term periods follows the same trend of T-mean (in
Figure 5). There has been a general increase in T-max, especially from the 1990s. Namalu, Tororo, Lira, Soroti, and Buginyanya meteorological stations showed increased T-max in the short term compared to the long term. Lira had a long- and short-term T-max change of 0.61 °C and 0.74 °C per decade, respectively, in
Figure 5.
Serere, Jinja, and Kiige meteorological stations showed a decreased change in T-max for long- and short-term periods. Jinja, for example, had a T-max of 0.62 °C and 0.39 °C per decade for long- and short-term periods, respectively.
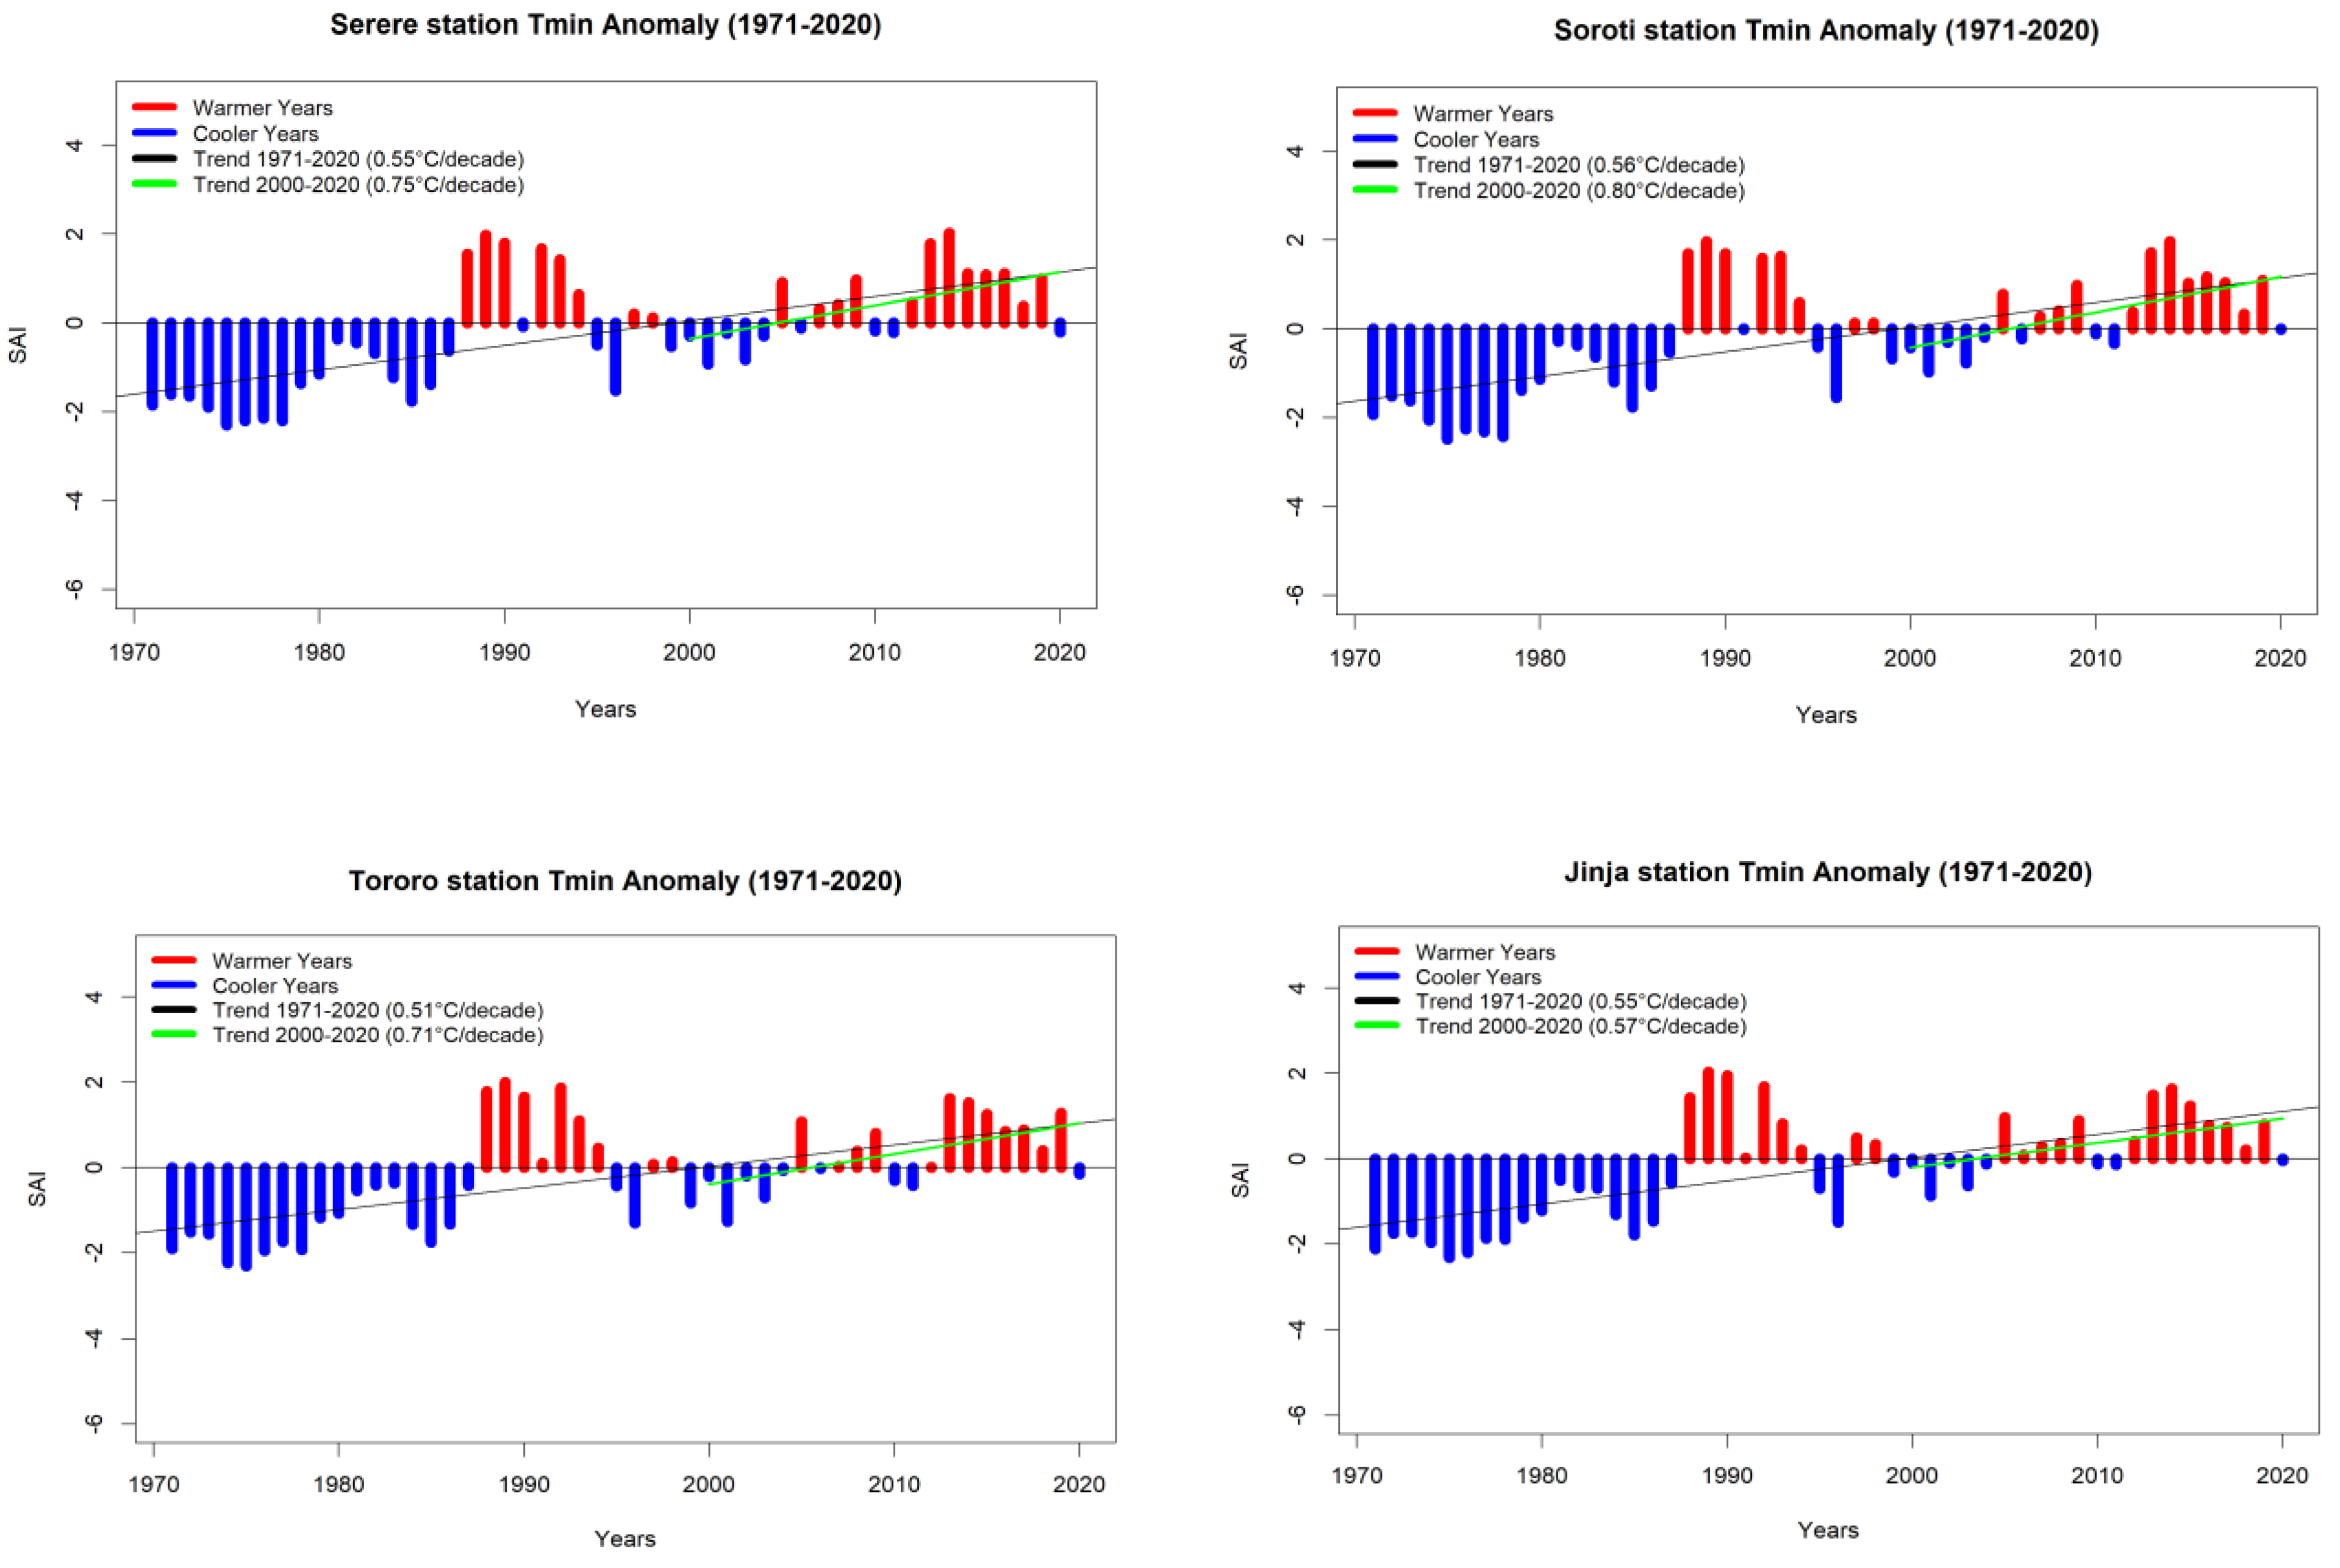
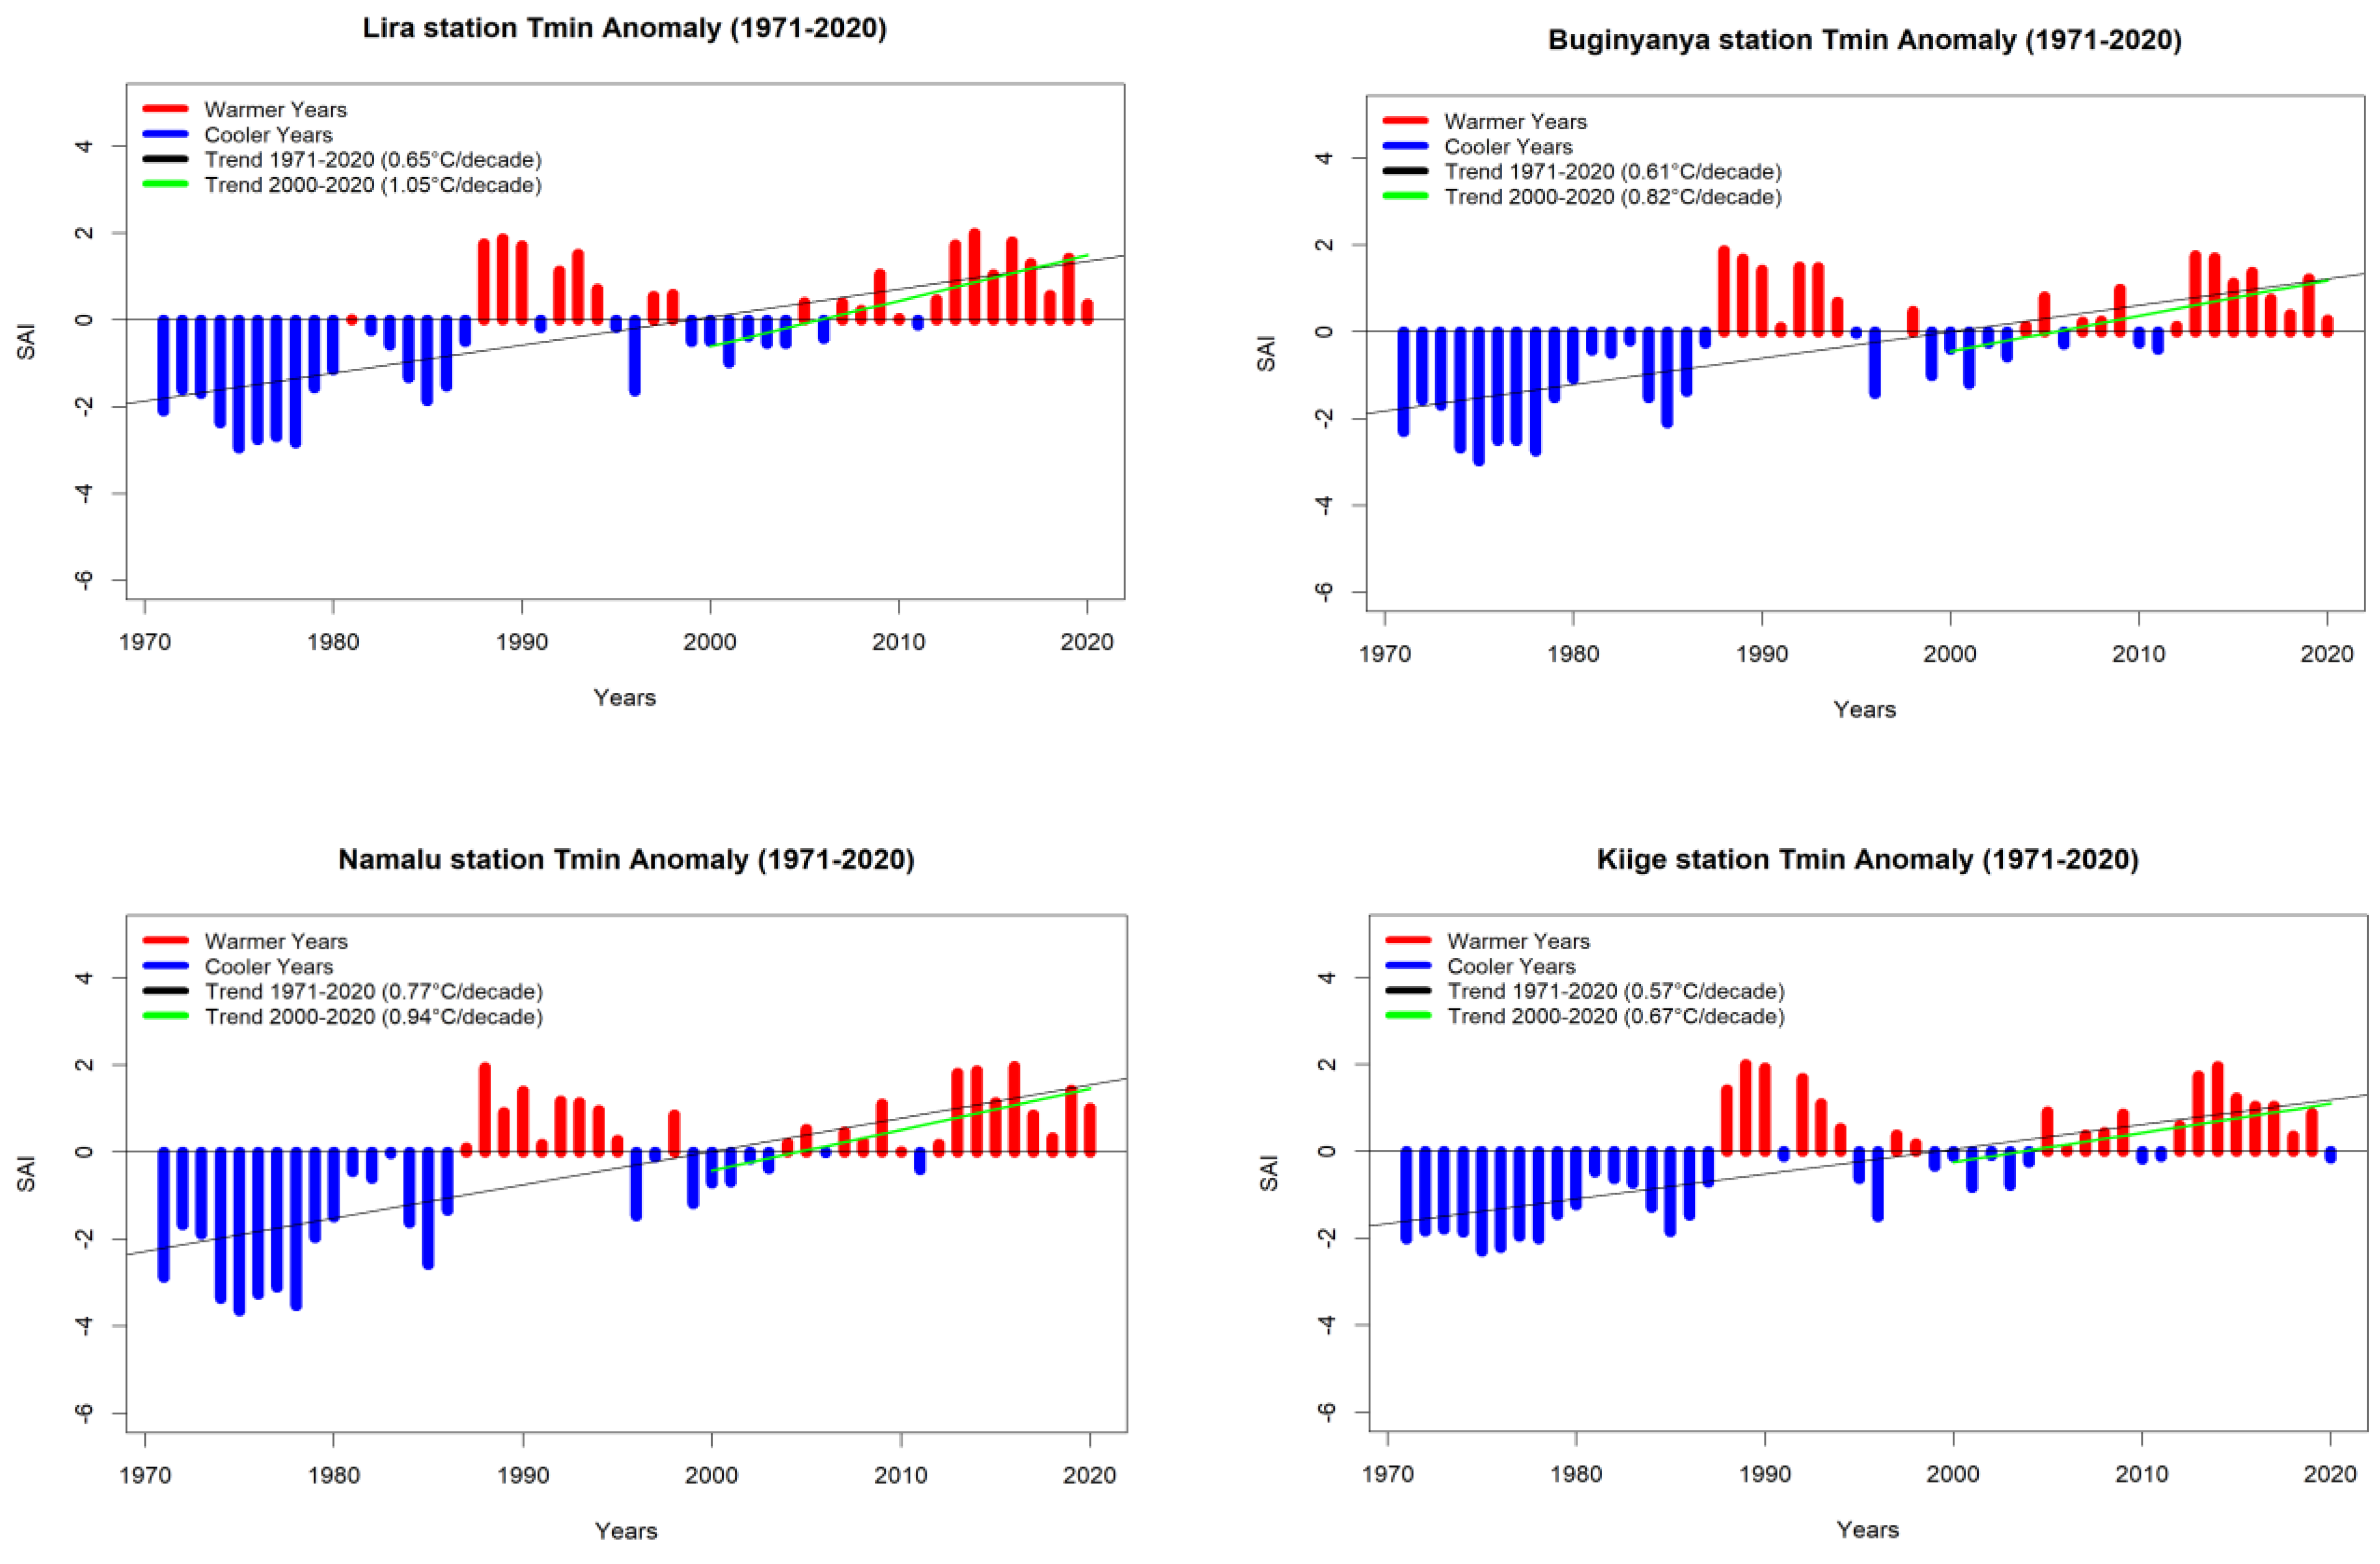
Mean annual minimum temperature (T-min) followed the same pattern as T-mean and T-max in the study area, with minor variations from one meteorological station to the other (
Figure 6). The general trend observed in SAI analyses was an increase in temperature over time, but there seems to be an accelerated increase in the recent past, as shown by the data.
T-min showed a notable increase in the short-term period in all stations compared to the long-term period, which was more than T-mean and T-max (
Figure 6). This showed that T-min is warming faster than the T-mean and T-maximum. The upper stations of Namalu and Lira showed the highest increase in T-min with 0.94 °C and 1.05 °C per decade, respectively. The result is warm nights and increasing temperatures in the study area. In general terms, SAI analyses indicated that the first 1.5 decades from 1971 to 1985 were cool times. The next decade from 1985 to 1995 showed some warming, followed by a brief cooling period in the 2000s. Warming started again from the mid-2000s up to 2020.
3.5. Trend Analysis of Standardized Anomaly Index
The results of the SAI analysis were subjected to the Mann–Kendall test to find out whether the trends observed were significant. The results for both short- and long-term periods showed a statistically significant increase in T-mean, T-max, and T-min in the study area, at a 0.01 confidence level (
Table 10). The significantly high level of temperature increase over the last five decades could be attributed to climate change experienced in different parts of the world.
3.6. Decadal Analyses of Temperature
3.6.1. Decadal Annual T-mean Anomaly
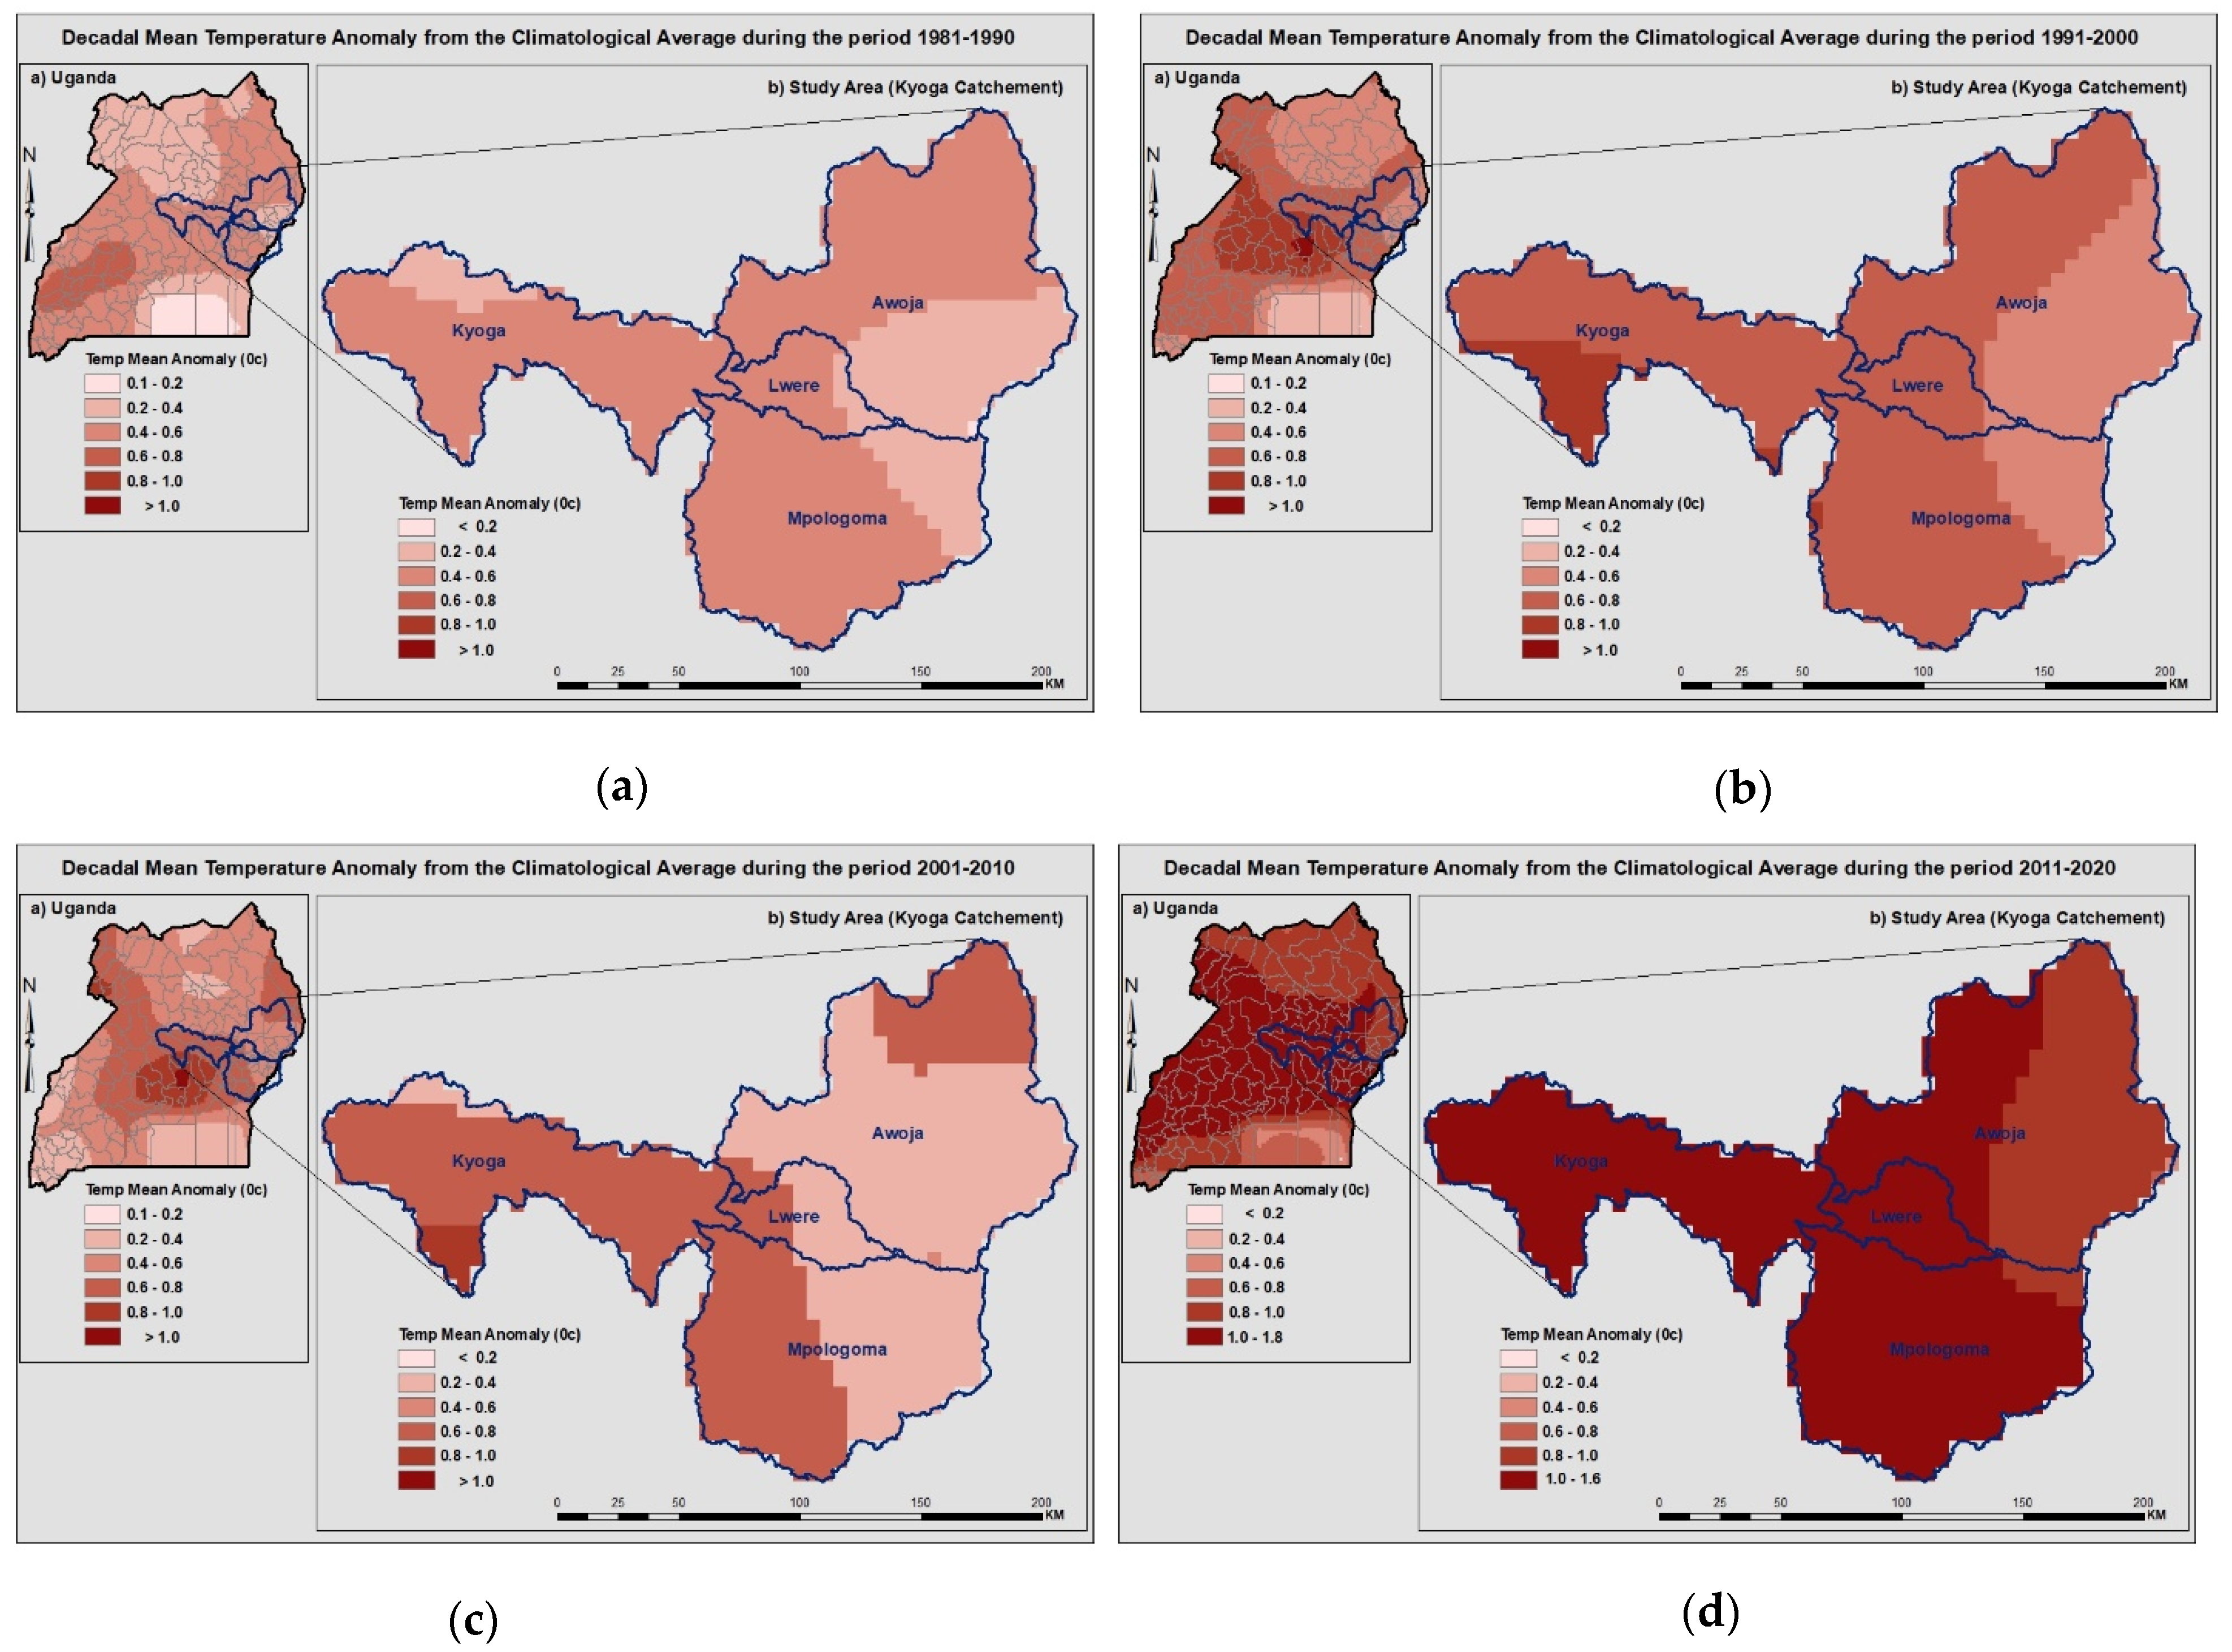
Decadal annual mean temperature anomaly changes for four decades (1981–2020) have been determined in relation to the climatological base period of 1981–2010 (
Figure 7).
In the 1981–1990 decade, the T-mean relative anomaly for the study area ranged from 0.2 °C–0.6 °C, with the Mount Elgon area being cooler (
Figure 7). The T-mean did not differ so much from the base period, with upstream regions of Mount Elgon experiencing a 0.2 °C–0.4 °C temperature change. Most of the Lake Kyoga basin experienced a 0.4 °C–0.6 °C increase in mean temperature. The anomaly shifted from 0.2 °C–0.6 °C in 1981–1990 to 0.8 °C–1.6 °C in 2011–2020, with 2001–2010 being a little cooler compared to 1991–2000. This study has shown that mean temperature has been steadily increasing in the study area over the past few decades, attributed to climate change.
3.6.2. Decadal Annual T-Max Anomaly
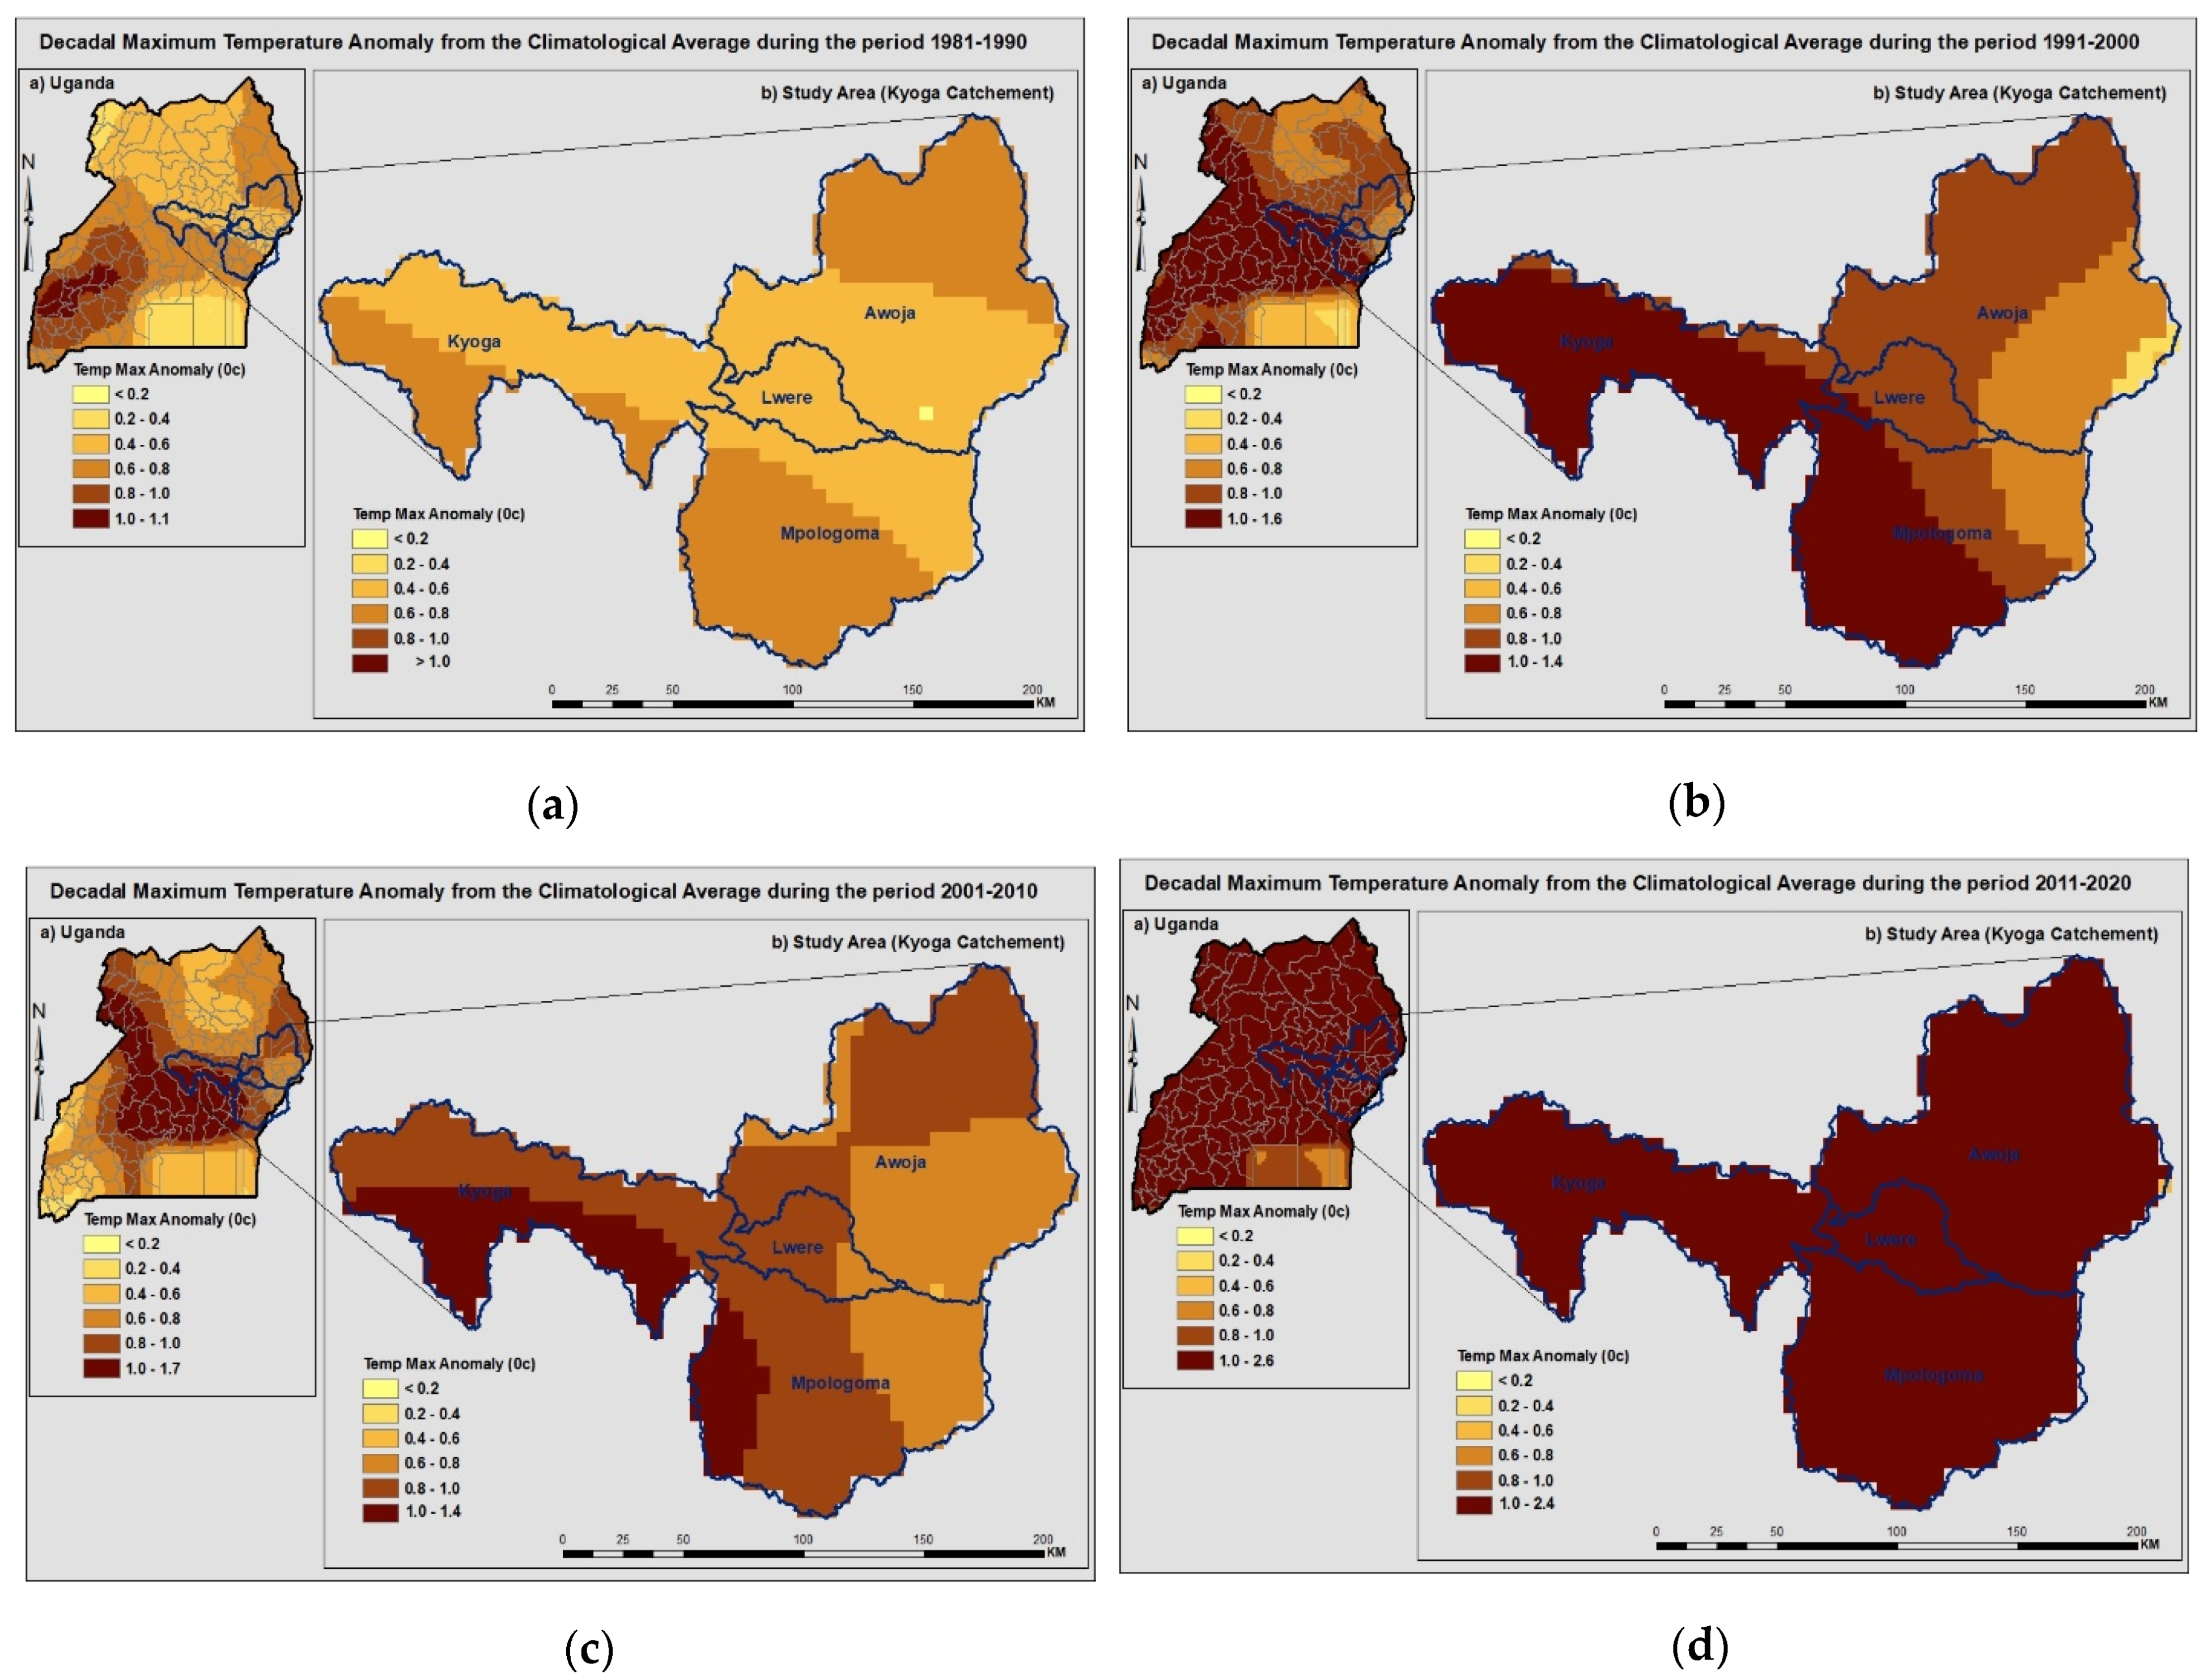
Like decadal annual T-mean, decadal T-max has generally been increasing from 1981–1990 to 2011–2020 (
Figure 8).
Annual T-max decadal relative anomaly showed that the 1981–1990 decade in the Lake Kyoga basin had a slight deviation from the reference base period. The highlands of Mount Elgon and significant parts of Lake Kyoga had a T-max of 0.2 °C–0.4 °C. The south and north parts of the study area experienced an increase of between 0.4 °C and 0.6 °C. The T-max in the 1991–2000 decade was hotter than for the previous decade and was also higher than for the 2001–2010 decade, especially in the south of the basin. The 2011–2020 decade showed an increase in T-max anomaly across the whole Lake Kyoga basin, with an increase of 1.0 °C–2.4 °C. This change in T-max decadal anomaly was observed all over the country, except in Lake Victoria (
Figure 8).
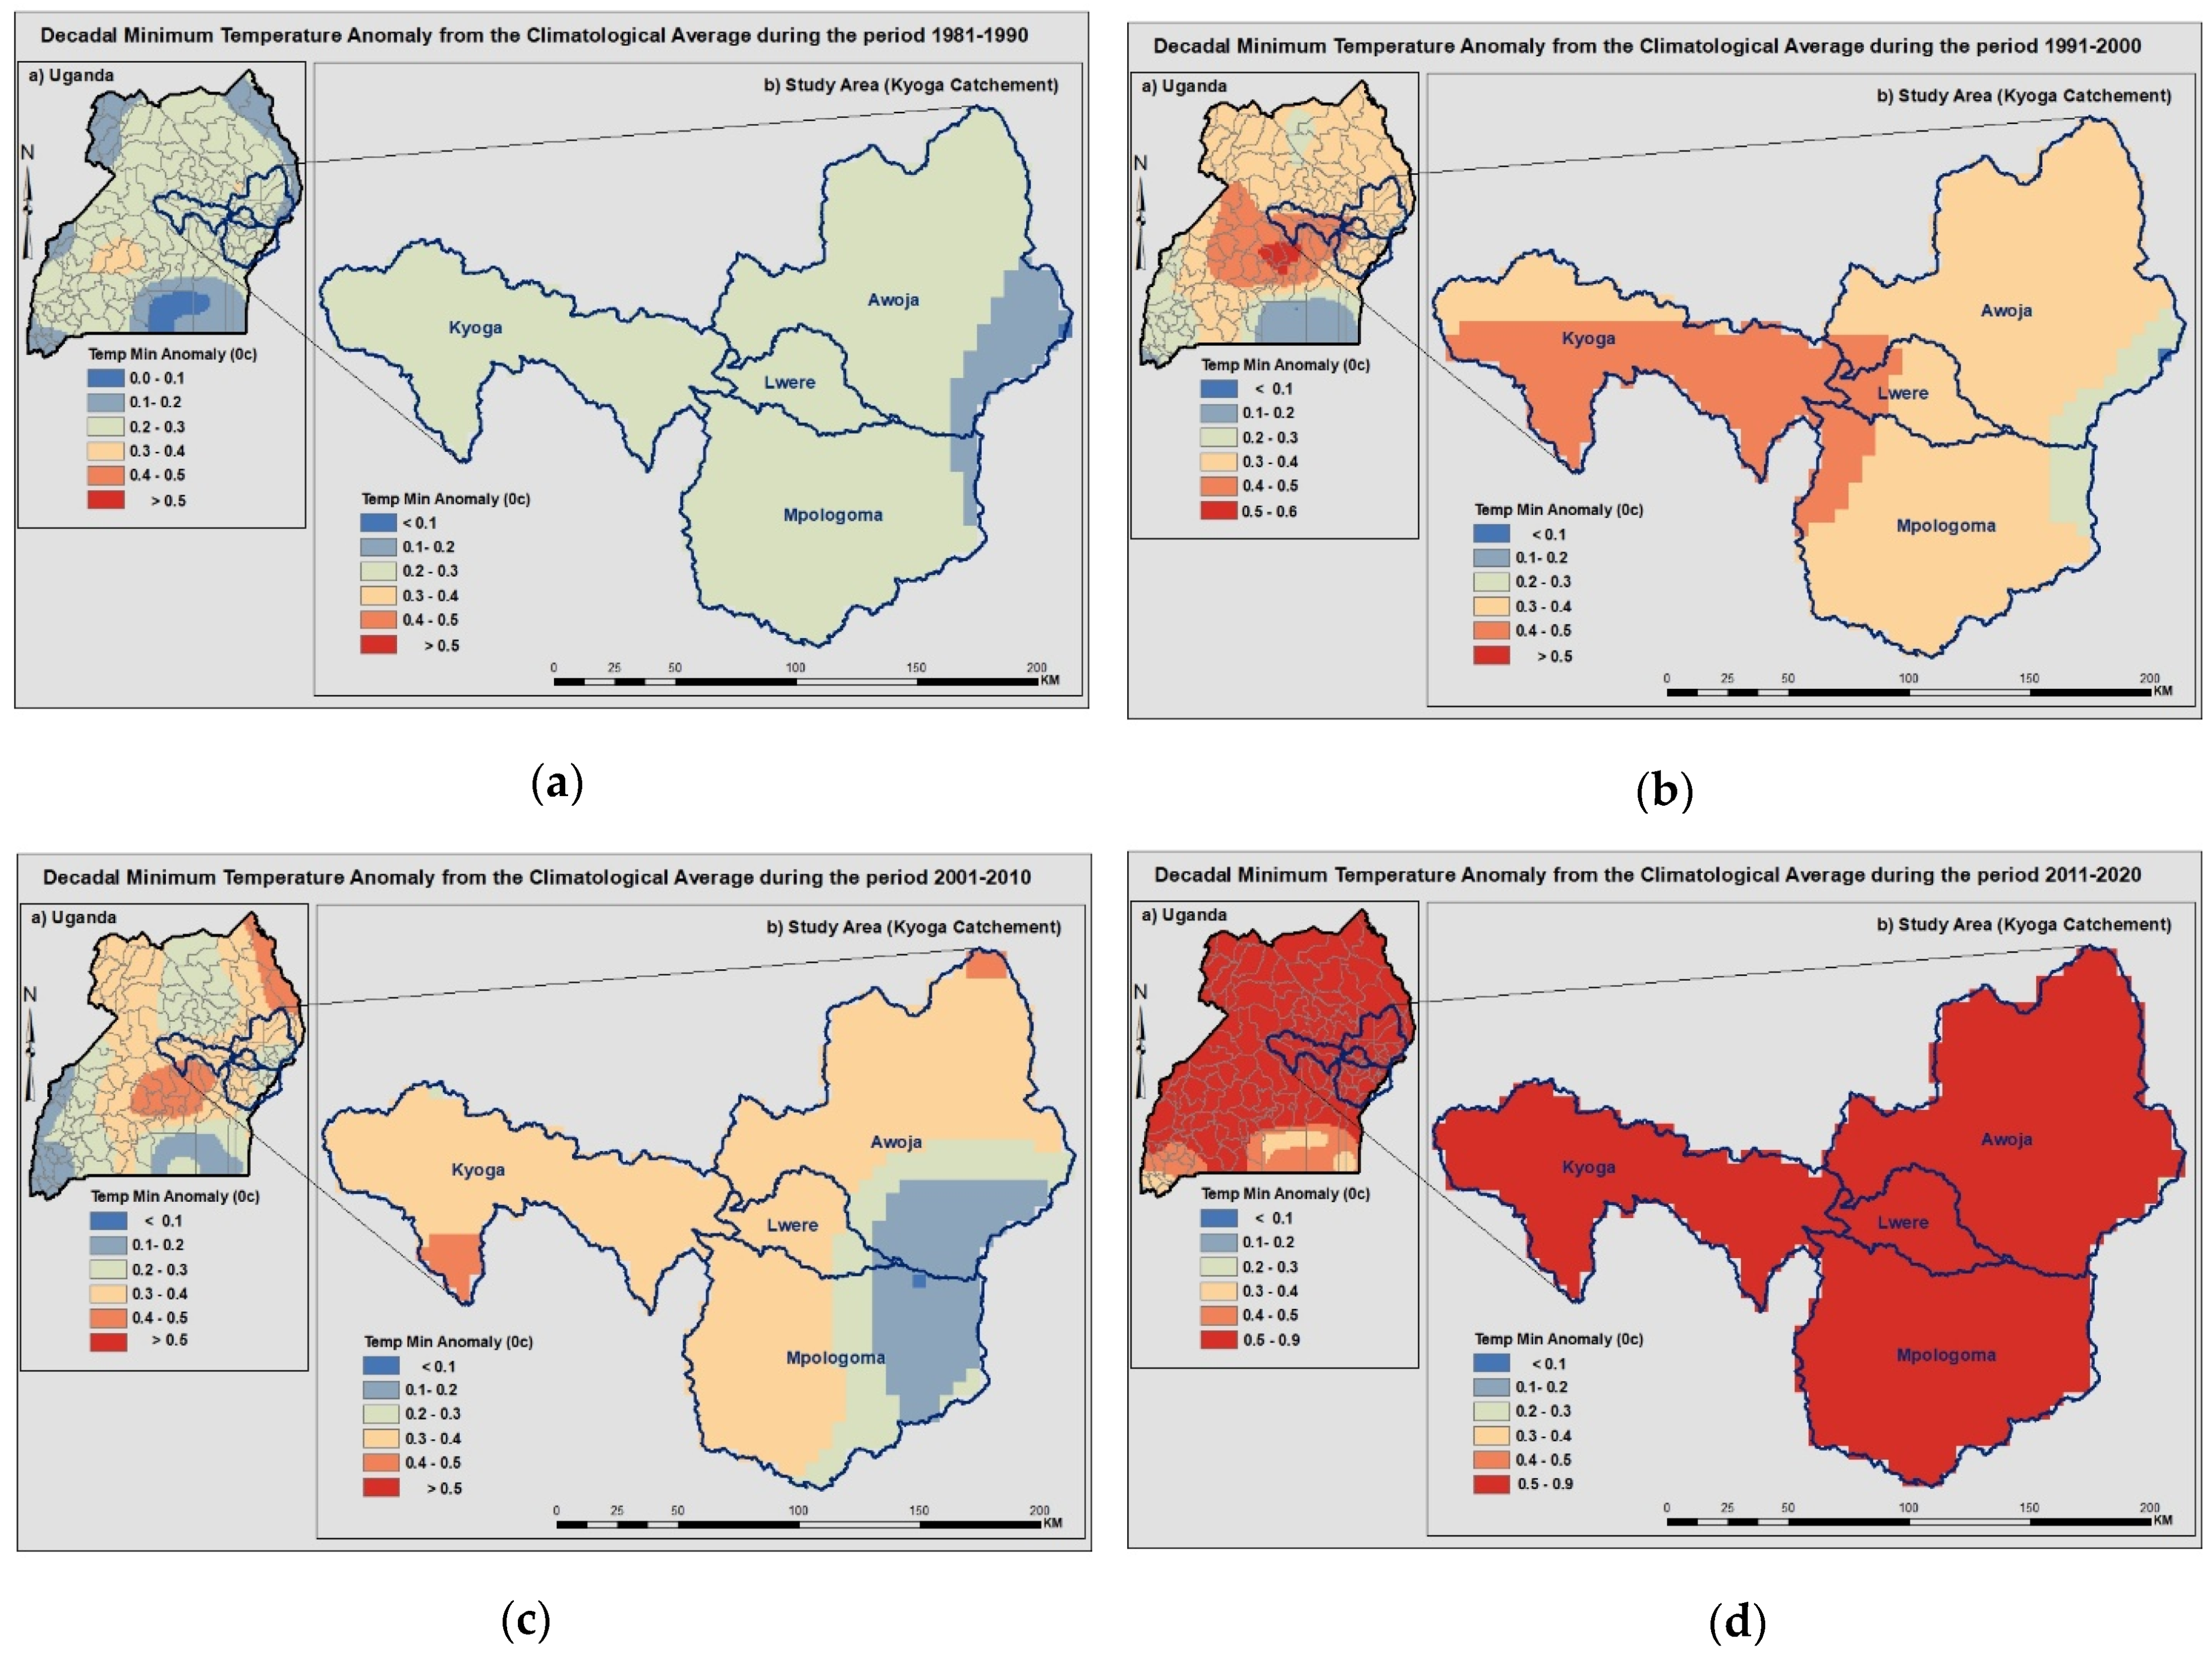
3.6.3. Decadal Annual T-Min Anomaly
Annual T-min four-decade anomaly was determined for the Lake Kyoga basin (see
Figure 9). The decadal increase in annual minimum temperature over the Lake Kyoga basin was lesser than the T-max increase. The overall change range was from 0.1 °C–0.9 °C for the four decades.
The increase in decadal mean annual minimum temperature follows what was observed for T-mean and T-max. The 1981–1990 decade had a T-min increase of 0.1 °C–0.3 °C, 1991–2000 had an increase from 0.2 °C–0.5 °C, while 2001–2010 had an increase from 0.1 °C–0.5 °C. The last decade of 2011–2020 had an increase of 0.5 °C–0.9 °C.
Decadal changes in annual T-mean, T-max, and T-min relative anomalies showed a general increase during 1981 to 2020 (
Figure 7,
Figure 8 and
Figure 9). The 2001–2010 decade showed cooler changes than 1991–2000 in all the relative temperature anomalies. Annual T-max relative anomaly posted a higher increase of up to 2.4 °C, followed by annual T-mean anomaly with an increase of up to 1.6 °C. However, the annual T-min anomaly showed a slow increase over the four decades, increasing up to 0.9 °C. These changes, especially in the last decade, could be attributed to climate change.
4. Discussion
The use of short- and long-term data to determine the manifestation of climate change in the Lake Kyoga basin with standardized precipitation and anomaly indexes has revealed a detailed understanding of climate change occurrence over the study area. Long-term data generally showed decreasing precipitation trends in the study area, while short-term data showed increasing precipitation trends in
Table 5 and
Table 6. The findings of two emission scenarios, A1b and A2 from General Circulation Models (GCM), for example, projected an increase in temperature and rainfall [
86], which agrees with short-term trends for this study. Long-term data observation agrees with what was found by Adisu et al. [
87] in the Lake Tana sub-basin, Ethiopia, and other studies [
14,
15,
16,
17]. Comparative trend analysis based on short-term and long-term data indicated that the Lake Kyoga basin is experiencing changes in rainfall and temperature patterns due to climate variability and climate change. The results also showed that climate change and variability in the study area are a recent phenomenon and continue to impact the study area. The long-term data, which showed a decreasing trend in rainfall in the area, agree with what has been observed by other studies and projections. The long-term data approach, therefore, is helpful in showing the general trend over time, while the short-term approach is helpful in showing the current trend. Therefore, both approaches are helpful depending on the objective and purpose of the study. These comparative analyses of climate change are essential as they give an accurate picture of how climate has changed over time. The increase in temperature over the study period was also observed in Nigeria and Togo [
11].
Decadal analyses for the past four decades have shown that there have been general steady increases in both temperature and precipitation (
Figure 3 and
Figure 7–9). The 1981–1990 decade had cool and normal precipitation, while the 2011–2020 decade experienced increased temperature and precipitation. The T-max showed a faster increase over the decades of 2.4 °C, while the T-min and T-mean showed a slower increase of 0.9 °C and 1.6 °C, respectively, as has been projected in East Africa and other parts of the world [
14]. The changes have resulted in warmer temperatures, including warmer nights in the study area than before (
Figure 7,
Figure 8 and
Figure 9). According to this trend, temperature increases and warmer nights could continue, and modeling in the Lake Kyoga basin to forecast the future trends is therefore recommended. The observed increase in precipitation in this study, which is contrary to results found in global projections, shows the importance of determining climate change at the local level to design local solutions to climate change impacts, as also pointed out by other researchers [
29,
46,
47,
48,
88]. Climate change is not always similar to the global, regional, or even national projections at the local level. These findings are therefore helpful in planning for community-specific interventions.
The results also showed variations in climate change from one place to another; for example, Serere and Lira meteorological stations showed statistically significant changes in precipitation with long-term data (
Table 6), with Serere showing a decreasing trend and Lira showing an increasing trend. Zambia also observed these variations when SPI was applied [
89]. Jinja, Buginyanya, and Tororo stations were prone to extreme wet climate conditions, probably due to the influence of mountainous topography (Mount Elgon) and lake influence. Stations such as Lira and Kiige, located in the cattle corridors and rain shadow belts, are prone to extreme dry weather conditions. The occurrence of these extreme weather conditions was also observed in other countries such as India and Togo [
11,
69]. These results are essential in that they have identified areas prone to droughts and areas prone to floods. Bududa district, for example, has experienced landslides and mudslides since it is located at the steep slopes of Mount Elgon. Butaleja district and Teso region, located downstream, experienced floods from extreme wet climates. Many people and properties have been lost due to these floods, especially in the 2019 and 2020 floods [
73,
90,
91,
92]. The low lands of Teso and Busoga also experienced floods, with 2020 bearing the worst flood effects in this decade. Lake Kyoga experienced high water levels, which set a new record due to these floods. These floods and droughts affect the functioning of the ecosystem, including nutrients, macrophytes, fisheries, and sediments [
55,
58,
93]. Lake Kyoga is especially vulnerable to these impacts due to its shallow status. Nutrients deposited in the sediments are easily resuspended by slight wind action and waves.
The ITCZ influences variations in precipitation in the study area, along with moist westerly winds, monsoon winds, and local topography, lakes, and mountains, as pointed out by Schreck et al. [
52], Nsubuga et al. [
53], and Mubiru et al. [
30]. However, the observed recent changes in this research could be associated with climate change, as has been observed in South Togo [
11]. These changes affect the routine planning and scheduling of livelihood economic activities, especially agriculture, the main livelihood activity in the Lake Kyoga basin [
49,
94]. Butaleja district in the Mpologoma catchment, which produces rice from the Doho irrigation scheme, is also prone to floods due to the flat nature of the area downstream of Mount Elgon. The floods regularly cause the destruction of crops and houses, loss of life, displacement, and the destruction of infrastructure [
90,
95]. Climate change has made it more difficult for farmers to predict weather patterns accurately. Some areas such as Serere are predicted to experience more dry weather than wet weather; therefore, dry weather-resistant crops should be planned for such areas because droughts are a severe challenge to agriculture production [
40]. Therefore, this research is essential for policy and decision-makers in relevant ministries for planning purposes. The increased frequencies of severe and extreme wet conditions lead to floods in the catchment and in Lake Kyoga. Other areas are predicted to experience severe and extreme dry conditions. Therefore, drought and flood mitigation measures should be the focus of decision-makers and policy developers, including the government and other stakeholders.
5. Conclusions
Through the use of standardized anomaly and standardized precipitation indexes, this study showed increased temperature warming and wet weather taking place in the Lake Kyoga basin in the last 59 years. These changes show that the climate experienced here in terms of temperature and rainfall is not stationary. The determination of climate change in the basin is the first step that should lead to planning for mitigation and adaptation measures. The increase in the T-min anomaly from 0.1 °C–0.9 °C in the four decades has resulted in warmer nights than before, with Lira and Namalu being the most affected areas. The impacts include discomfort during sleeping time and mosquito bites, hence diseases such as malaria since mosquitoes like warm nights. The increase in T-max anomaly from 0.2 °C–0.4 °C in 1981–1990 to 1.0 °C–2.4 °C in 2011 to 2020 reflects the overall increase in temperature. The use of long-term data (59 years 1961–2020) and short-term data (39 years 1981–2020) to determine climate change has helped this study show that climate change in the study area has worsened, especially in the last decade. Settlements and other infrastructure have also been affected, especially in the steep slopes of Mount Elgon, which is 4321 m above sea level (masl), and the flat Teso and Busoga areas.
Mitigation and adaptation actions to reduce the impacts of CC in Lake Kyoga Basin should be a priority of water managers, decision-makers, and other relevant stakeholders, including the Ministry of Health. Otherwise, impacts of CC will have negative consequences in the Lake Kyoga ecosystem. Increased temperature favours invasion by invasive water weeds and nutrient loading from the catchments favours eutrophication, meanwhile floods lead to the displacement of the lake’s riparian community. Flood management, by the construction of valley tanks and the restoration of degraded wetlands and riverbanks, should be prioritized. A study to identify impacts of climate change in local communities and identify mitigation approaches should be conducted, with the involvement of the communities.
Government policy and decision-makers and other stakeholders have set up the institutional and legal framework to support the adaptation and resilience of affected communities to manage the impacts of climate change and variability. However, the positive results from these interventions are yet to be realized by all affected communities. Adaption, resilience, and mitigation approaches have been performed based on national and international case studies and projections. Therefore, the results of this research study should help policy and decision-makers refocus their mitigation efforts to the most affected communities. The government, through the MWE, Ministry of Agriculture, Animal Industry and Fisheries (MAAIF), and Office of the Prime Minister (OPM) (Disaster Preparedness), and other stakeholders such as non-governmental organizations (NGOs) should focus on capacity building to deal primarily with floods, landslides and mudslides, and drought impacts. Local communities should be sensitized to the phenomenon of climate change and be equipped to deal with it. Fast-maturing crops, drought-resistant crops, and indigenous animals should be provided to local communities. Tree planting, especially local varieties, should be encouraged as part of local adaptation measures. There is a need for more prioritization of climate change mitigation measures in Uganda, East Africa, Africa, and globally. This kind of research should be replicated in other areas to guide the adaption and mitigation of climate change.


 ,
, 


