1. Introduction
Continuous and real-time measurement and monitoring are required to determine the concentrations and emission status of environmental pollutants as well as the operation status of prevention facilities. Otherwise, effective environmental management will not be possible, and real-time response to abnormal facility operation will become difficult.
Previously, measuring environmental pollutants and the operation status of prevention facilities and diagnostics based on the derived results was time-consuming. However, with the development of analysis and diagnosis equipment, it is now possible to measure and monitor pollutants faster than in the past. This phenomenon has been expressed using real-time [
1,
2,
3,
4], on-line [
5], and smart [
6,
7,
8] expressions.
In addition, analysis and monitoring technologies for pollutants are now based on the Internet of Things (IoT) and artificial intelligence (AI) because they are combined with information technologies under the rapid development of informatization. IoT technologies have been applied to smart cities [
9,
10] in which they operate in innovative ways to improve the convenience of citizens using digital information and communication technologies. They have also been applied to various fields, such as livestock [
11,
12,
13], agriculture [
8,
14,
15,
16], energy [
17,
18,
19], and industries [
20].
Meanwhile, the application of IoT-based monitoring technologies to the environmental field has also been increasing. In the field of water quality, IoT technologies have been applied to water quality monitoring [
2,
21,
22] and sewage and wastewater treatment facilities [
22,
23,
24]. In addition, IoT technologies have been applied to the fields of atmosphere [
25], waste [
25,
26], and noise [
27]. However, in the environmental field, most of the IoT-based monitoring methods focus on the direct measurement of pollutants. In other words, they have been mostly used to monitor the concentrations of pollutants generated from various environmental media.
Some authors [
28,
29,
30] have already devised concepts in, and shown the results of, monitoring management using IOT sensors related to industrial facilities. However, it is difficult to find cases of environmental management that investigate the operating factors throughout the emission and prevention facilities of a workplace and that monitor the indirect management factors in real time by installing IOT instruments.
The environmental management policy framework, however, is shifting from the management of each medium to integrated media management. In many regions, including the EU, Russia, India, and Korea, the integrated environmental management system has been implemented as a major policy tool to manage pollutant emissions from industries. The OECD (Organization for Economic Cooperation and Development) has also recommended the introduction of integrated environmental management since 2006.
When environmental pollution facilities are subjected to integrated management, it is necessary to continuously monitor the concentrations and emissions of pollutants and to manage the key operating factors of various facilities. In other words, productivity efficiency, energy efficiency, pollutant reduction, and abnormalities in facilities must be examined through the management of all facilities in workplaces as well as prevention facilities that directly treat pollutants. For these operating factors, substantial amounts of data can be accumulated through real-time monitoring, unlike in the past.
Therefore, if IoT facilities are applied to the integrated management of environmental pollution facilities, real-time monitoring of pollutants and linkage with AI to process big data will be possible. IoT-based monitoring techniques can be applied for the direct or indirect measurement and monitoring of pollutants. They can also be applied for various purposes throughout all the processes of a workplace, such as production, utility, pollutant emission, and prevention facilities that treat pollutants. In other words, they can examine whether facilities are operating normally. In addition, they can be used to identify conditions for efficiently using energy or water. IoT-based monitoring techniques can be used to maintain the operating factors of various facilities at an appropriate level, such as by maintaining the optimal condition of prevention facilities that treat environmental pollutants, identifying the replacement cycles of consumables, and maintaining the appropriate pH, or to determine any operational abnormalities.
This study aimed to examine the applicability of the IoT as a direct or indirect tool to manage of pollutant emissions in pollutant emission facilities, monitor the operating status of prevention facilities, identify the abnormalities in various facility operating factors, and examine of the optimal conditions.
2. Materials and Methods
2.1. TSP Emission Levels of Power Generation Facilities
For the total suspended particulate (TSP) emission levels of power generation facilities, the Tele Monitoring System (TMS) data, measured every 30 min from 2017 to 2018 in 76 domestic steam power plants, were analyzed, in which the same solid fuel was used and the same dry electrostatic precipitator was installed. Power plants that exhibited similar statistical values through statistical processing were classified into the same group.
2.2. Operating Factors of Major Air Pollutant Prevention Facilities
Standards on the best available techniques (BATs) for 20 industries, including waste treatment facilities, were prepared to implement the integrated environmental management system since 2016. In these standards, all the pollutant prevention facilities in each industry are introduced. The standards include the data of all the facilities applied in Korea as well as those presented in the BAT Reference (BREF) of the EU.
The prevention facilities applied for the removal of gaseous and particulate air pollutants presented in the standards on the BAT were classified and their operating factors were investigated.
As for gaseous material control, catalytic reaction, absorption, adsorption, direct combustion, and combustion control facilities were investigated.
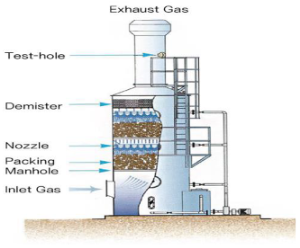
In the case of particulate matter, operating factors were investigated for electrostatic precipitation facilities, filter dust collection facilities, centrifugal dust collection facilities, and wet scrubber facilities.
2.3. Differential Pressure
Regarding the differential pressure reduction due to a filter burst and the normal differential pressure range in various industries, the results of a survey conducted by the Korea Environment Corporation (K-eco) were cited [
31].
The differential pressure of the filter was investigated from 1 January 2019 to 29 February 2020, while the workplace facilities continuously operated without interruption. The pressure change section was investigated at a point where the pressure began to decrease due to damage to the filter after increasing due to dust removal by the filter.
Regarding the normal differential pressure range according to the operation of emission and prevention facilities, three workplaces (the collection and sale of recycled paper industry, lumber industry, and fireproof ceramic products manufacturing industry) were presented. For each filtration facility, the maximum and minimum values of the differential pressure under normal operation were presented.
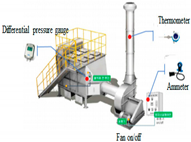
2.4. Determination of Non-Operation of Prevention Facilities through Current Measurement
To determine the non-operation of the prevention facilities through current measurement, the data of a survey conducted by K-eco on the 24 h operating status of pollutant emission and prevention facilities measured every five minutes for workplace “A” were cited.
When emission facilities operate, pollutant prevention facilities operate accordingly. When these facilities operate normally, an electrical current within a certain level (range) occurs. The current of the facilities was monitored, and the facilities were considered as non-operating or having operational problems if the current significantly exceeds the normal current.
2.5. Sensor
The instrument specification was selected as a general-purpose instrument that can be easily purchased in the market in consideration of site conditions such as site surveys and facility characteristics [
31].
The ammeter adopts a CT (Current Transformer) sensor considering the ease of handling and the difficulty of installation. The measurement range was selected to be equal to or within twice the maximum capacity of the distribution switchgear that supplies power to the facility or the maximum capacity of the load [
31]. The current sensor (model: TFC30P300A-CL420, DIWEL ELECTRONICS, Gunpo, Korea) has the specifications of 0–300 A, operating temperature −40–70 °C, output 4–20 mA [
31].
The differential pressure gauge is a measuring instrument to measure the operating status of the filter media (filter, etc.) of the “filtration and dust collection facility” and the adsorbent (activated carbon, etc.) of the “adsorption facility” among the prevention facilities [
31]. It was selected in consideration of the range of analog differential pressure gauges generally attached to the prevention facilities of the workplace and the capacity of the prevention facilities [
31]. The differential pressure sensor (model: DPLH0750D, SENSOR SYSTEM TECHNOLOGY CO., LTD, Ansan, Korea) has a measurement range of 0–500 mmH
2O, and the operating temperature is −20–60 °C, and the output is 4–20 mA [
31].
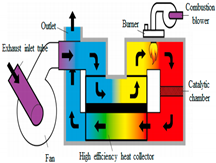
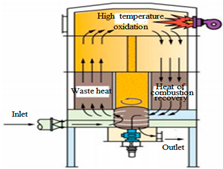
The thermometer is a “status information” measuring instrument for measuring the operating status of the “direct combustion facility (RTO)”, “facility using catalytic reaction (RCO, SCR)”, and “oxidation reduction facility (SNCR)” among the prevention facilities [
31]. It was selected considering that the temperature of the combustion reactor, etc. is usually 300–1200 °C and discharged through the heat recovery facility. The thermometer sensor (model: TSGC50/400C, DAEGIN, Seoul, Korea) has a measurement range of −50–400 °C and has a specification of output 4–20 mA [
31].
The pH meter was selected considering durability and ease of installation as a “state information” measuring instrument to measure the adequacy of the acid and alkalinity of the absorption (cleaning) liquid used in the “absorption (cleaning) facility” among the prevention facilities [
31]. The pH sensor (model: ENVA-3015, Pites, Hochiminh, Vietnam) has a measurement range of 0 to 14 pH, and the operating temperature is −5 to 45 °C and the output is 4 to 20 mA [
31].
2.6. Monitoring and Data Collection
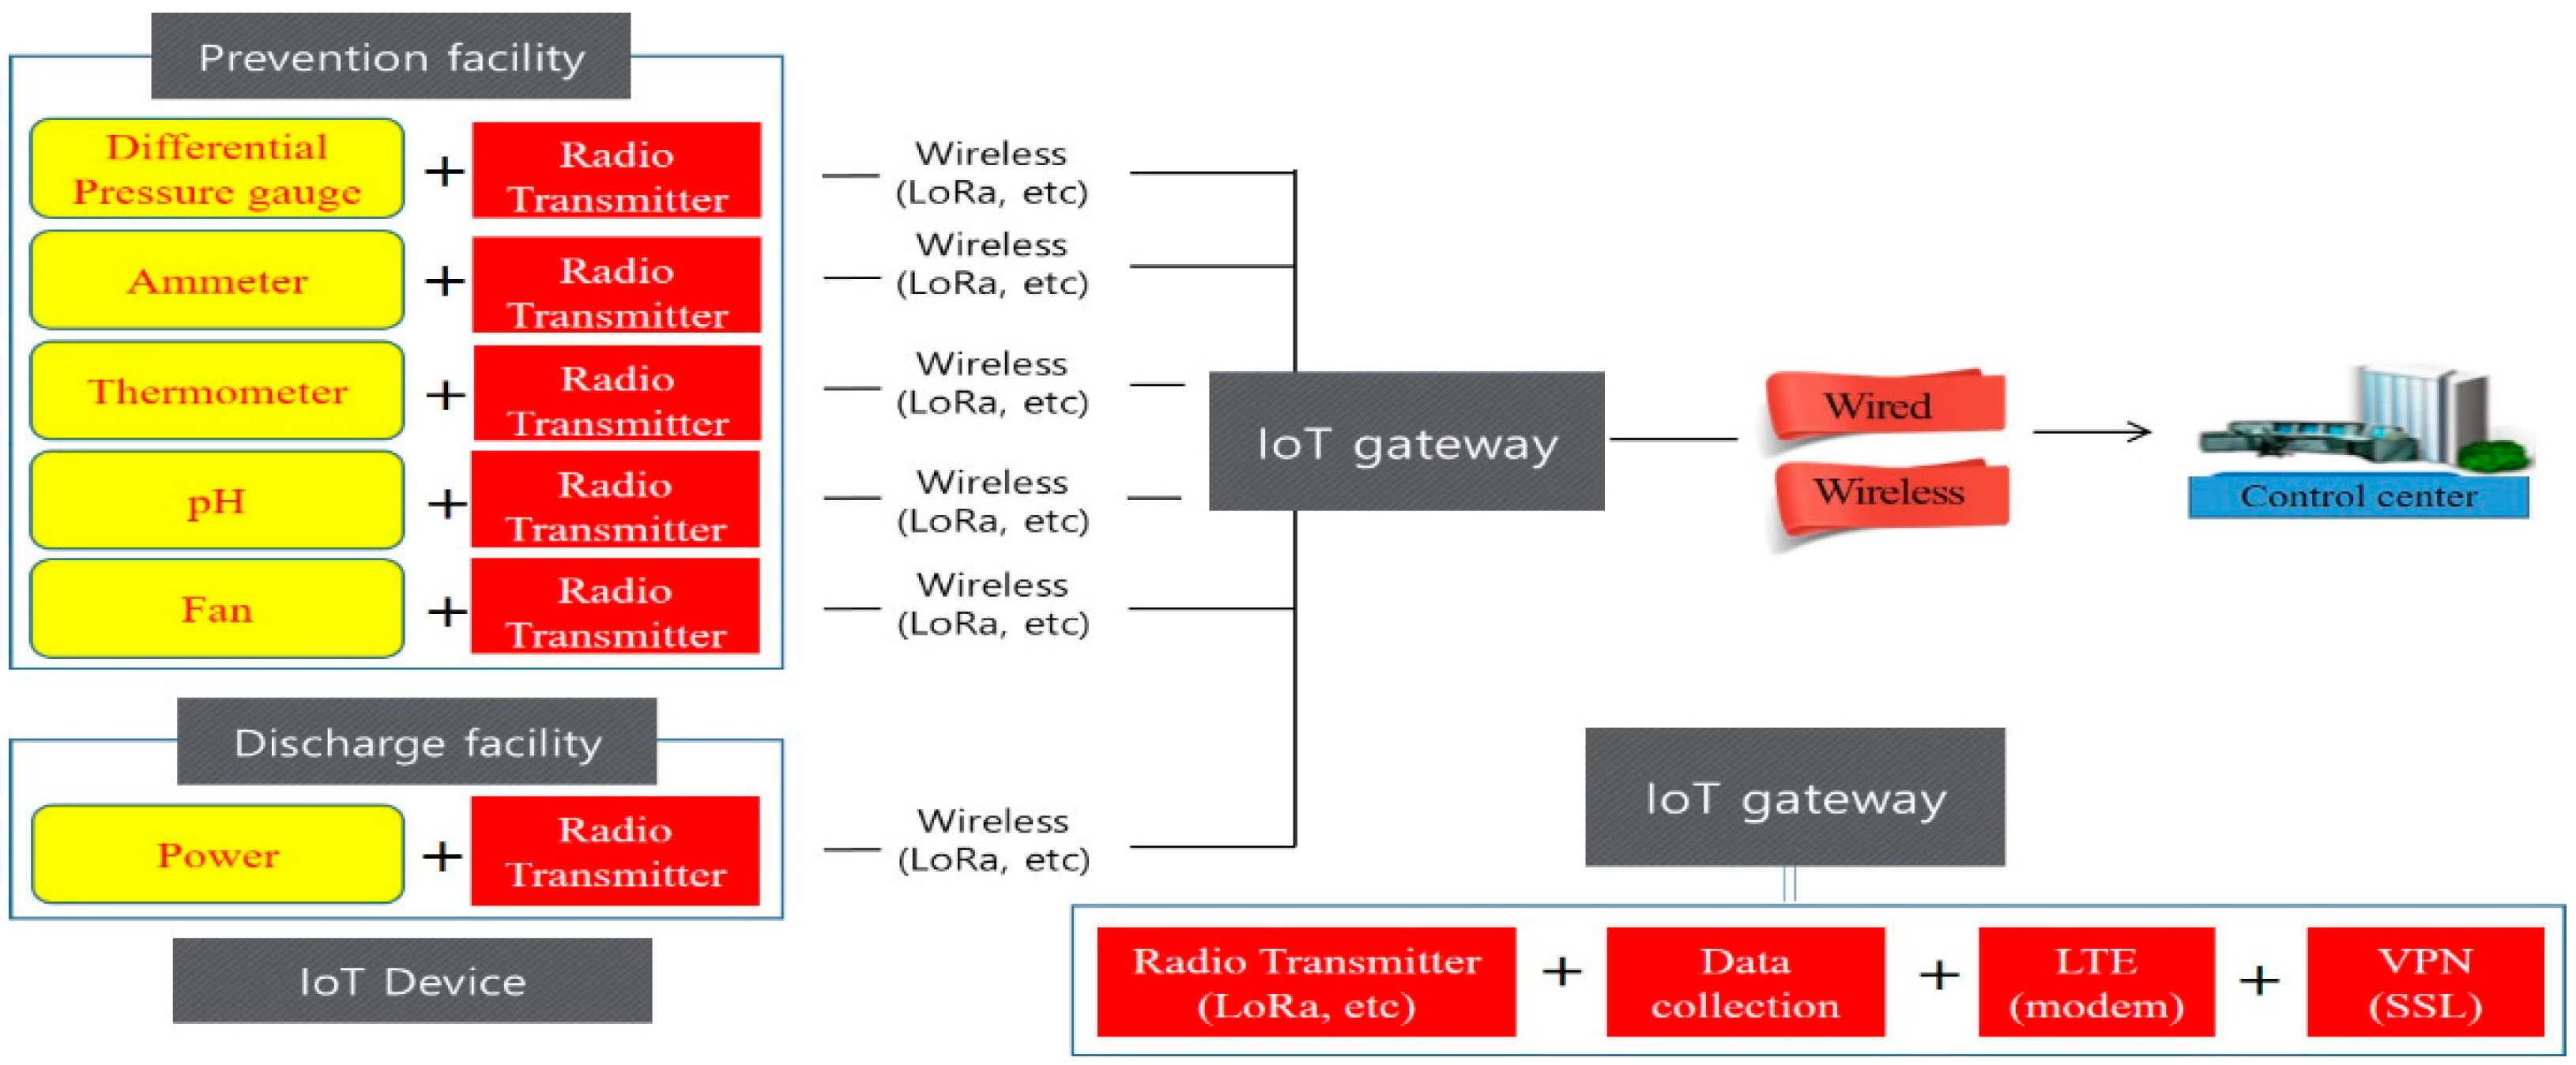
The IoT remote management system was applied to collect the measured data from various instruments installed in the discharge facilities and prevention facilities on the IoT Gateway (data collection device) and transmit them to the IoT management system through VPN (security device) using the Internet.
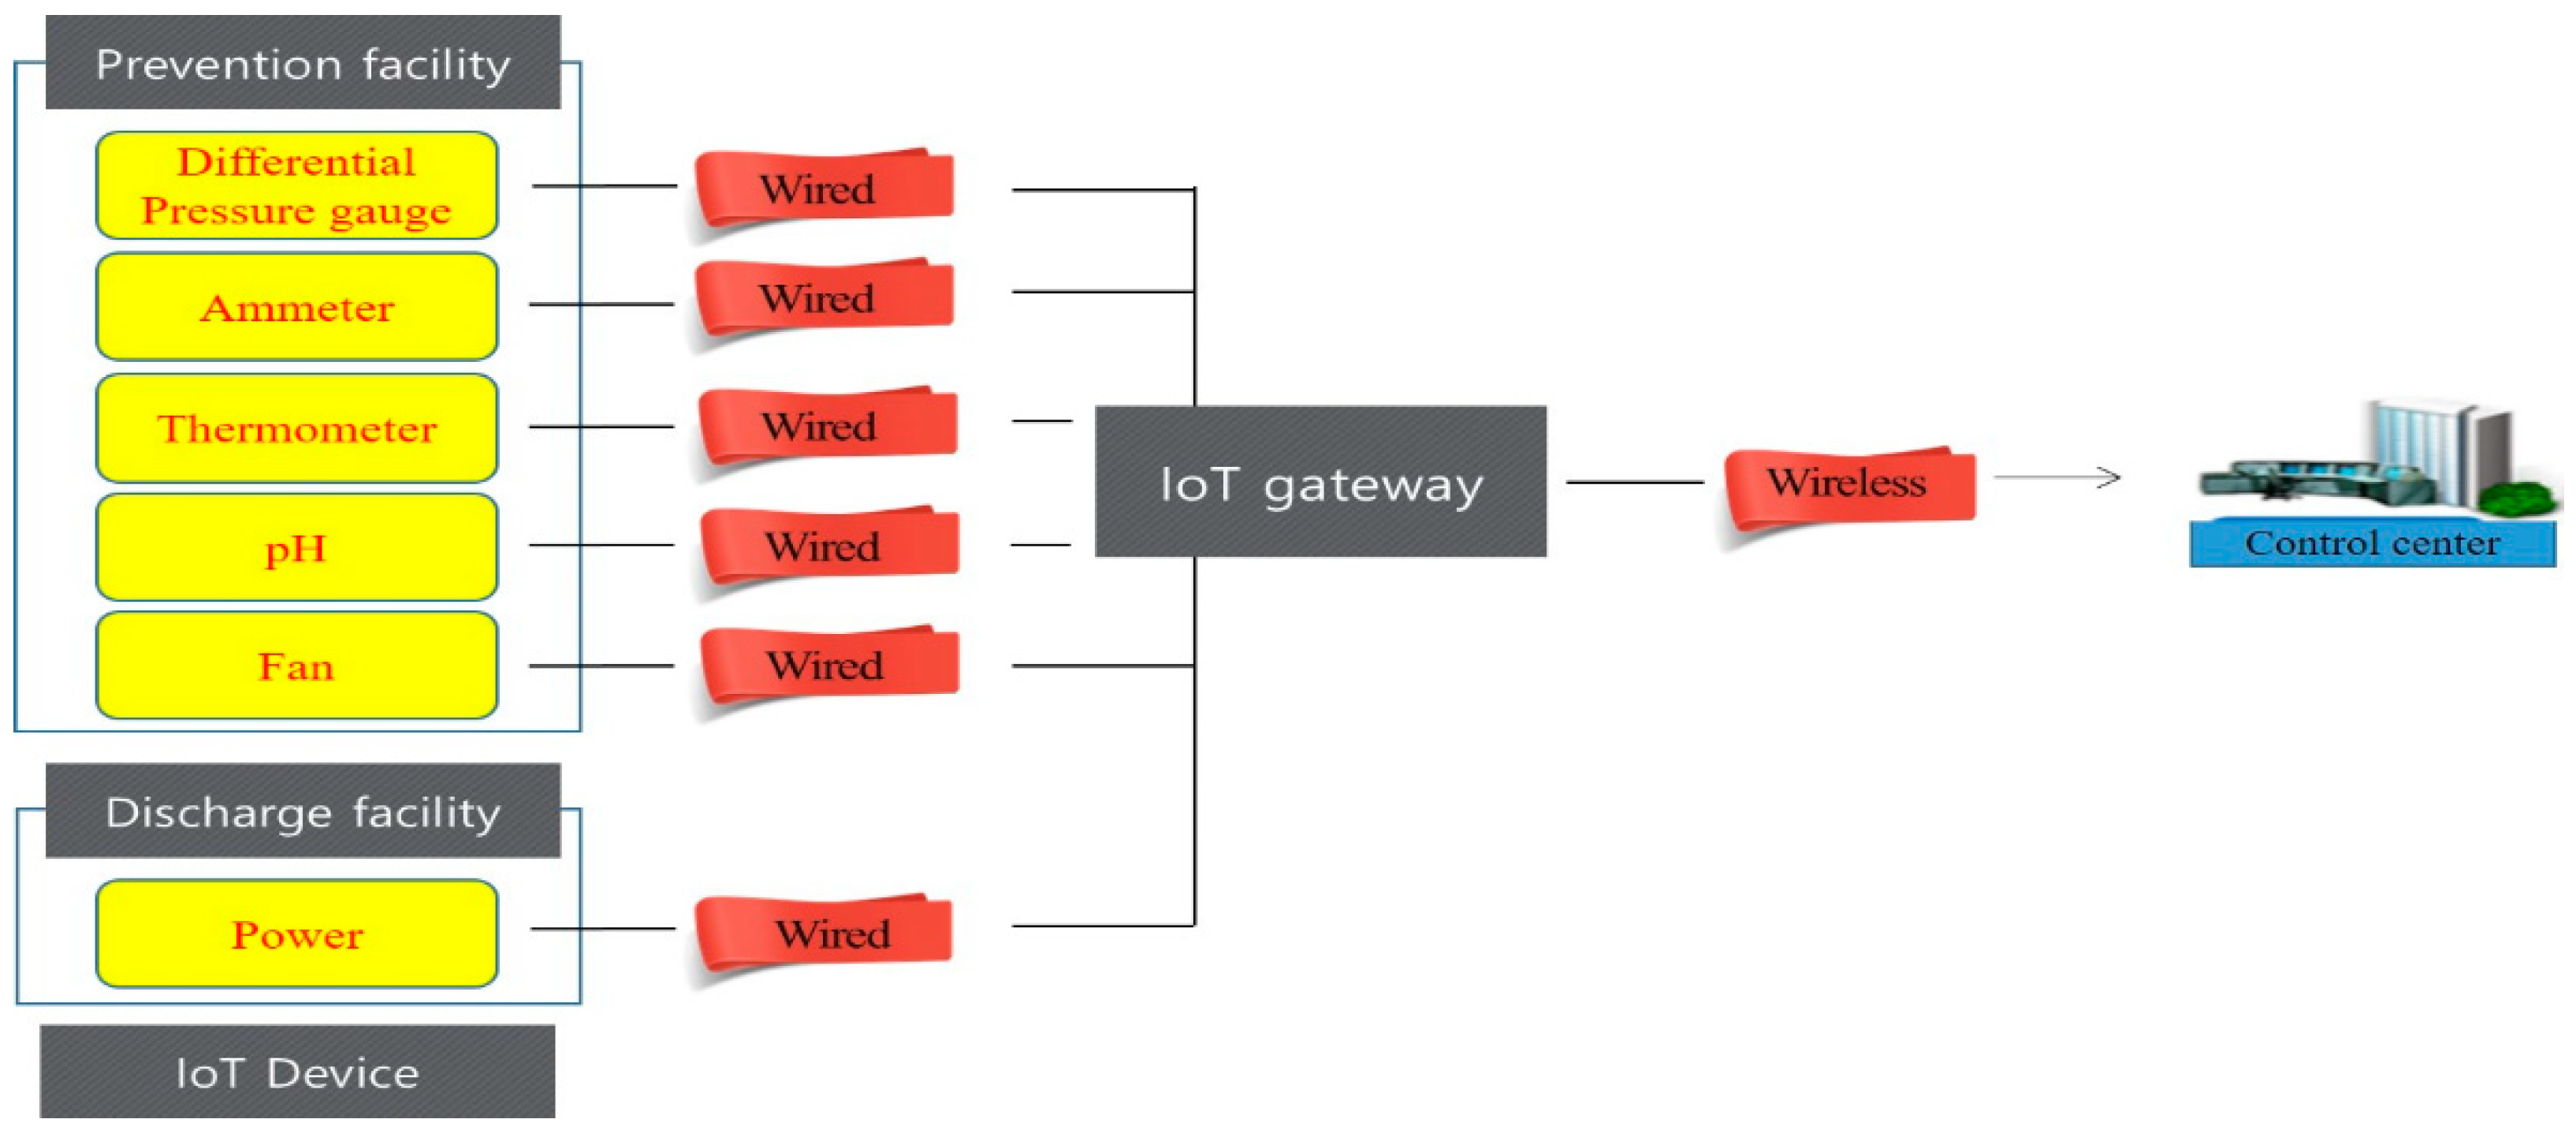
The IOT instrumentation and the IoT Gateway are connected by wire (
Figure 1) [
31]. If it is difficult to connect by wire, a wireless communication method (
Figure 2) is used to add a communication modem to the instrumentation to enable wireless communication between the instrumentation and the Gateway [
31]. The wireless communication connection is possible due to the instrumentation.
The sensor signals, including temperature, pressure, current, pH, etc., were collected once or several times and transmitted to the Gateway with the wireless telecommunication (LoRa) mode. For stable and efficient communication between the IoT Gateway and IoT management system, a communication protocol was applied. In addition, the communication protocol was applied to efficiently manage the measured values measured at the workplace.
The IoT management system was constructed to store and analyze the collected data. Through the IoT management system, measurement data monitoring, storage data inquiry, operation statistics, trend analysis graph, excel download, and mobile inquiry are possible.
3. Results and Discussions
3.1. Monitoring Status of Workplaces Subjected to the Integrated Permit
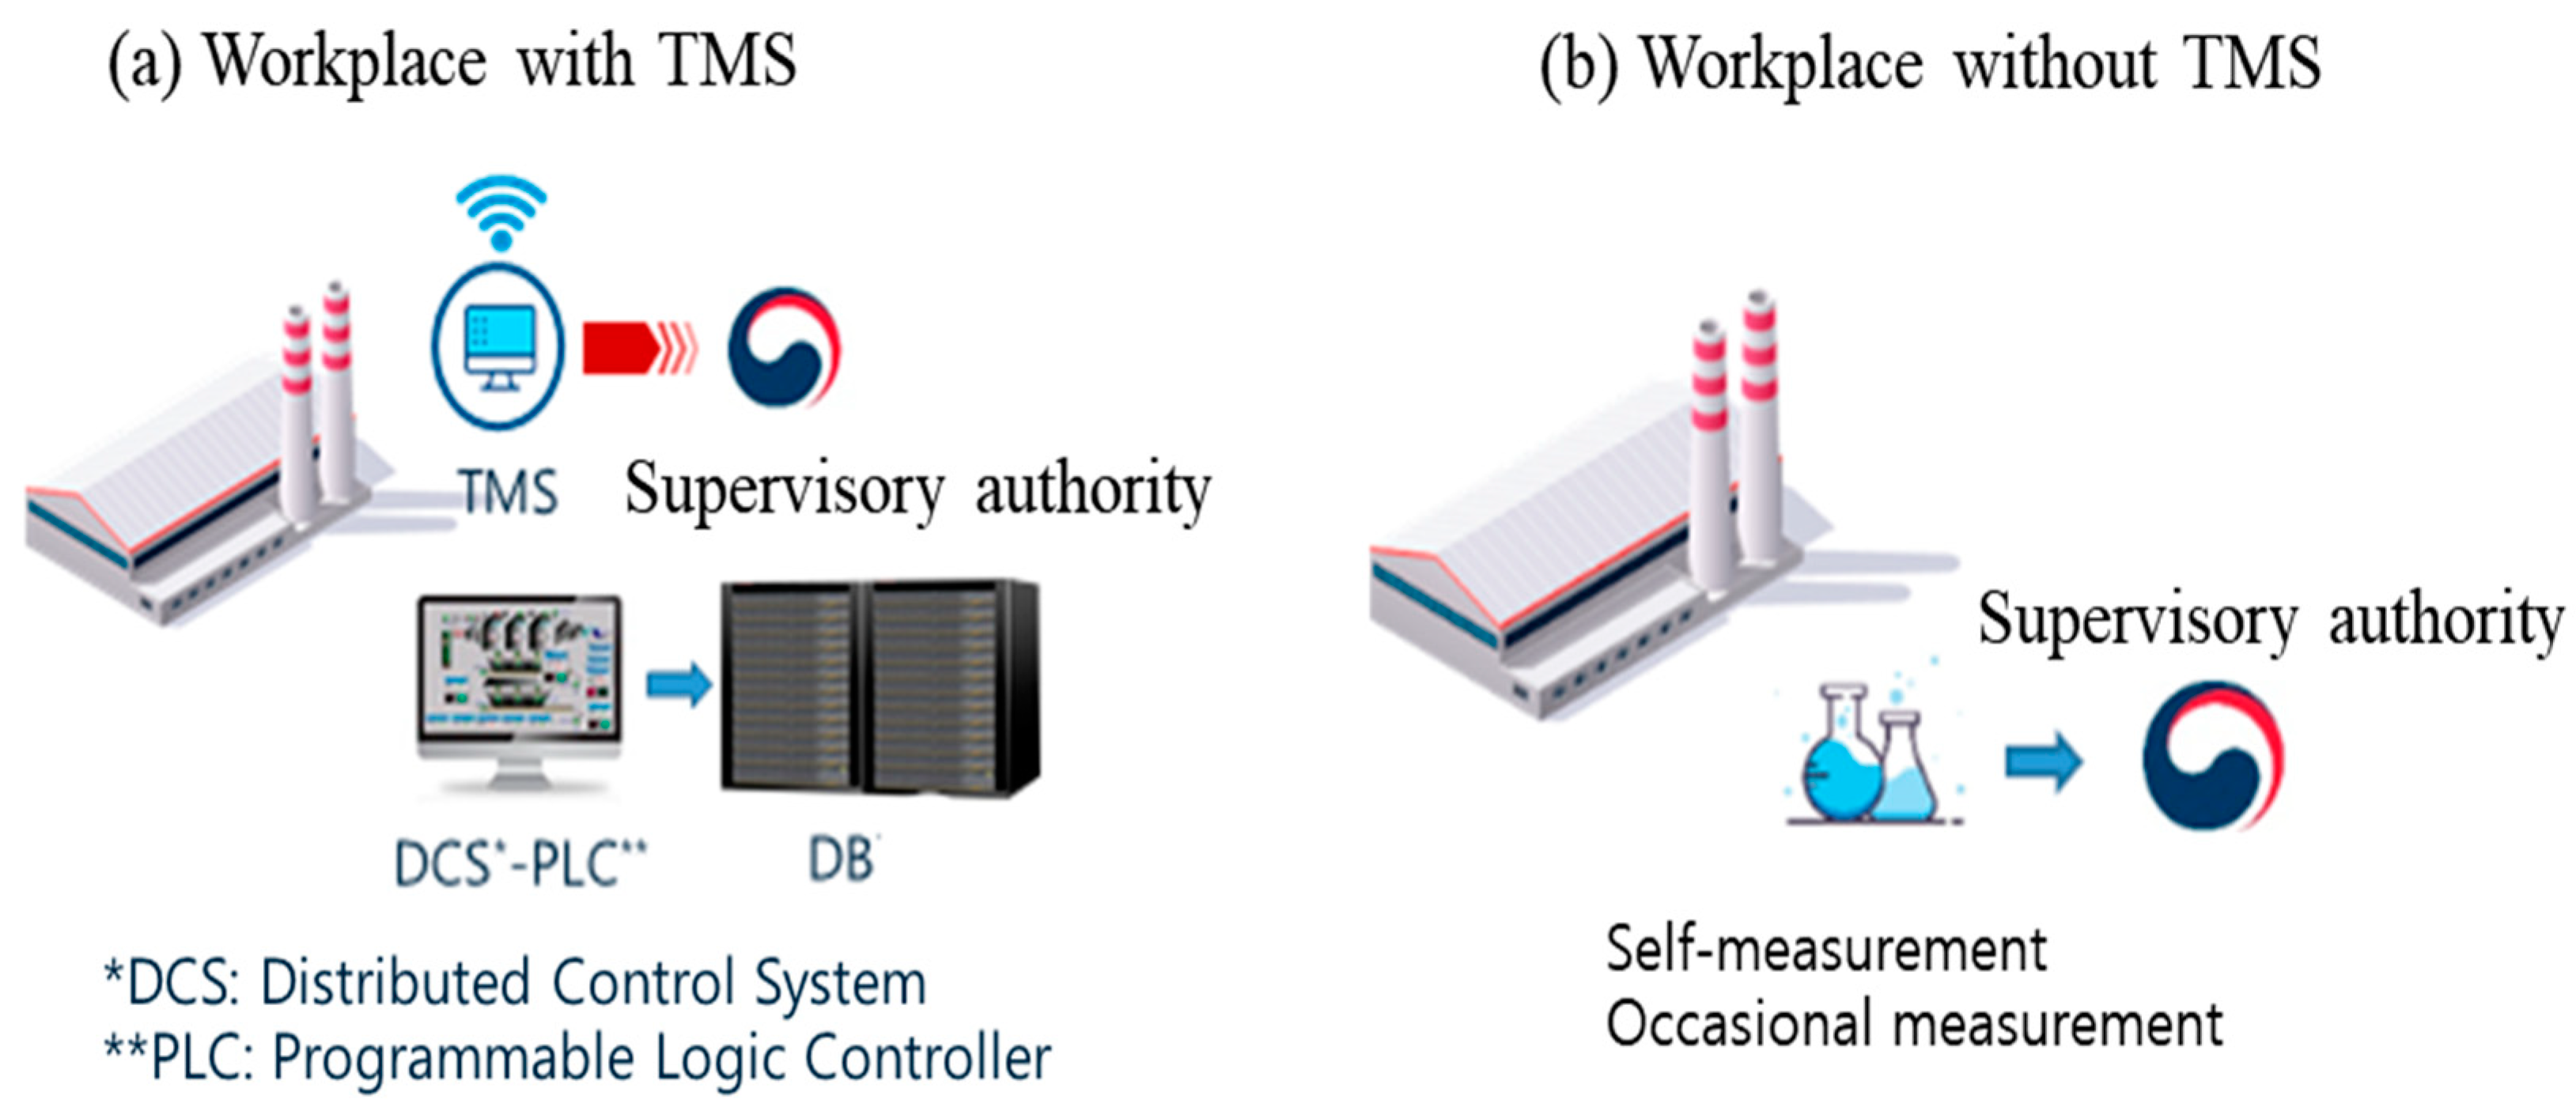
In Korea, pollutant emission facilities in workplaces are monitored differently for workplaces with and without TMS (
Figure 3). For workplaces with TMS (
Figure 3a), pollutants are monitored in real time (usually every 5 min with a slight difference depending on the pollutant type), making it easy to manage the operating status of the emission and prevention facilities. Therefore, data on pollutant emissions, electrical energy, flow rate, and pressure are managed in a database.
However, in the case of workplaces without TMS (
Figure 3b), the operating status of the emission and prevention facilities is inspected and operational data, such as pollutant emissions, are identified through the self-measurement (pollutants are directly measured by the workplace or an analysis agency usually once a month) data of the workplace. Since the measurement frequency is only 12 times a year, it is difficult to conduct significant statistical analyses of the data.
In addition, self-measured analysis data are recorded manually. Since the prepared data are not computerized, the systematic management of the measurement data is also insufficient. Consequently, the real-time monitoring and management of pollutant emission workplaces are relatively more difficult compared to workplaces with TMS. To supplement this, workplaces must be managed through the regular inspection of the supervisory authority; however, there are limitations because a representative in the supervisory authority has too many workplaces to inspect.
Table 1 shows the TMS installation status for the management of air pollutants in workplaces subjected to integrated environmental management [
32]. A total of 1682 workplaces in 21 industries are the target of the integrated permit; there are 30,643 pollutant outlets (stacks). Among them, only 1410 stacks (5%) have TMS; thus, it is necessary to prepare effective management plans for workplaces without TMS. In particular, the TMS non-installation rate is almost 100% for the chemical, automobile parts, plastic product, and alcoholic beverage manufacturing industries, where the emission of various pollutants is expected. Therefore, suitable management alternatives are required for real-time pollutant emission management. In the case of the waste treatment industry, which has the highest TMS installation rate among workplaces subjected to the integrated permit, the TMS non-installation rate is as high as 68%.
The low TMS installation rate may be because TMS incurs a considerable cost. Therefore, low-cost measures that can effectively monitor the facility operation and environmental management status of the workplaces subjected to integrated environmental management are required.
3.2. TSP Emission Characteristics of Workplaces Operating under the Same Conditions and Facilities
Workplaces operating under similar conditions and prevention facilities may exhibit different pollutant emission levels at the final outlet.
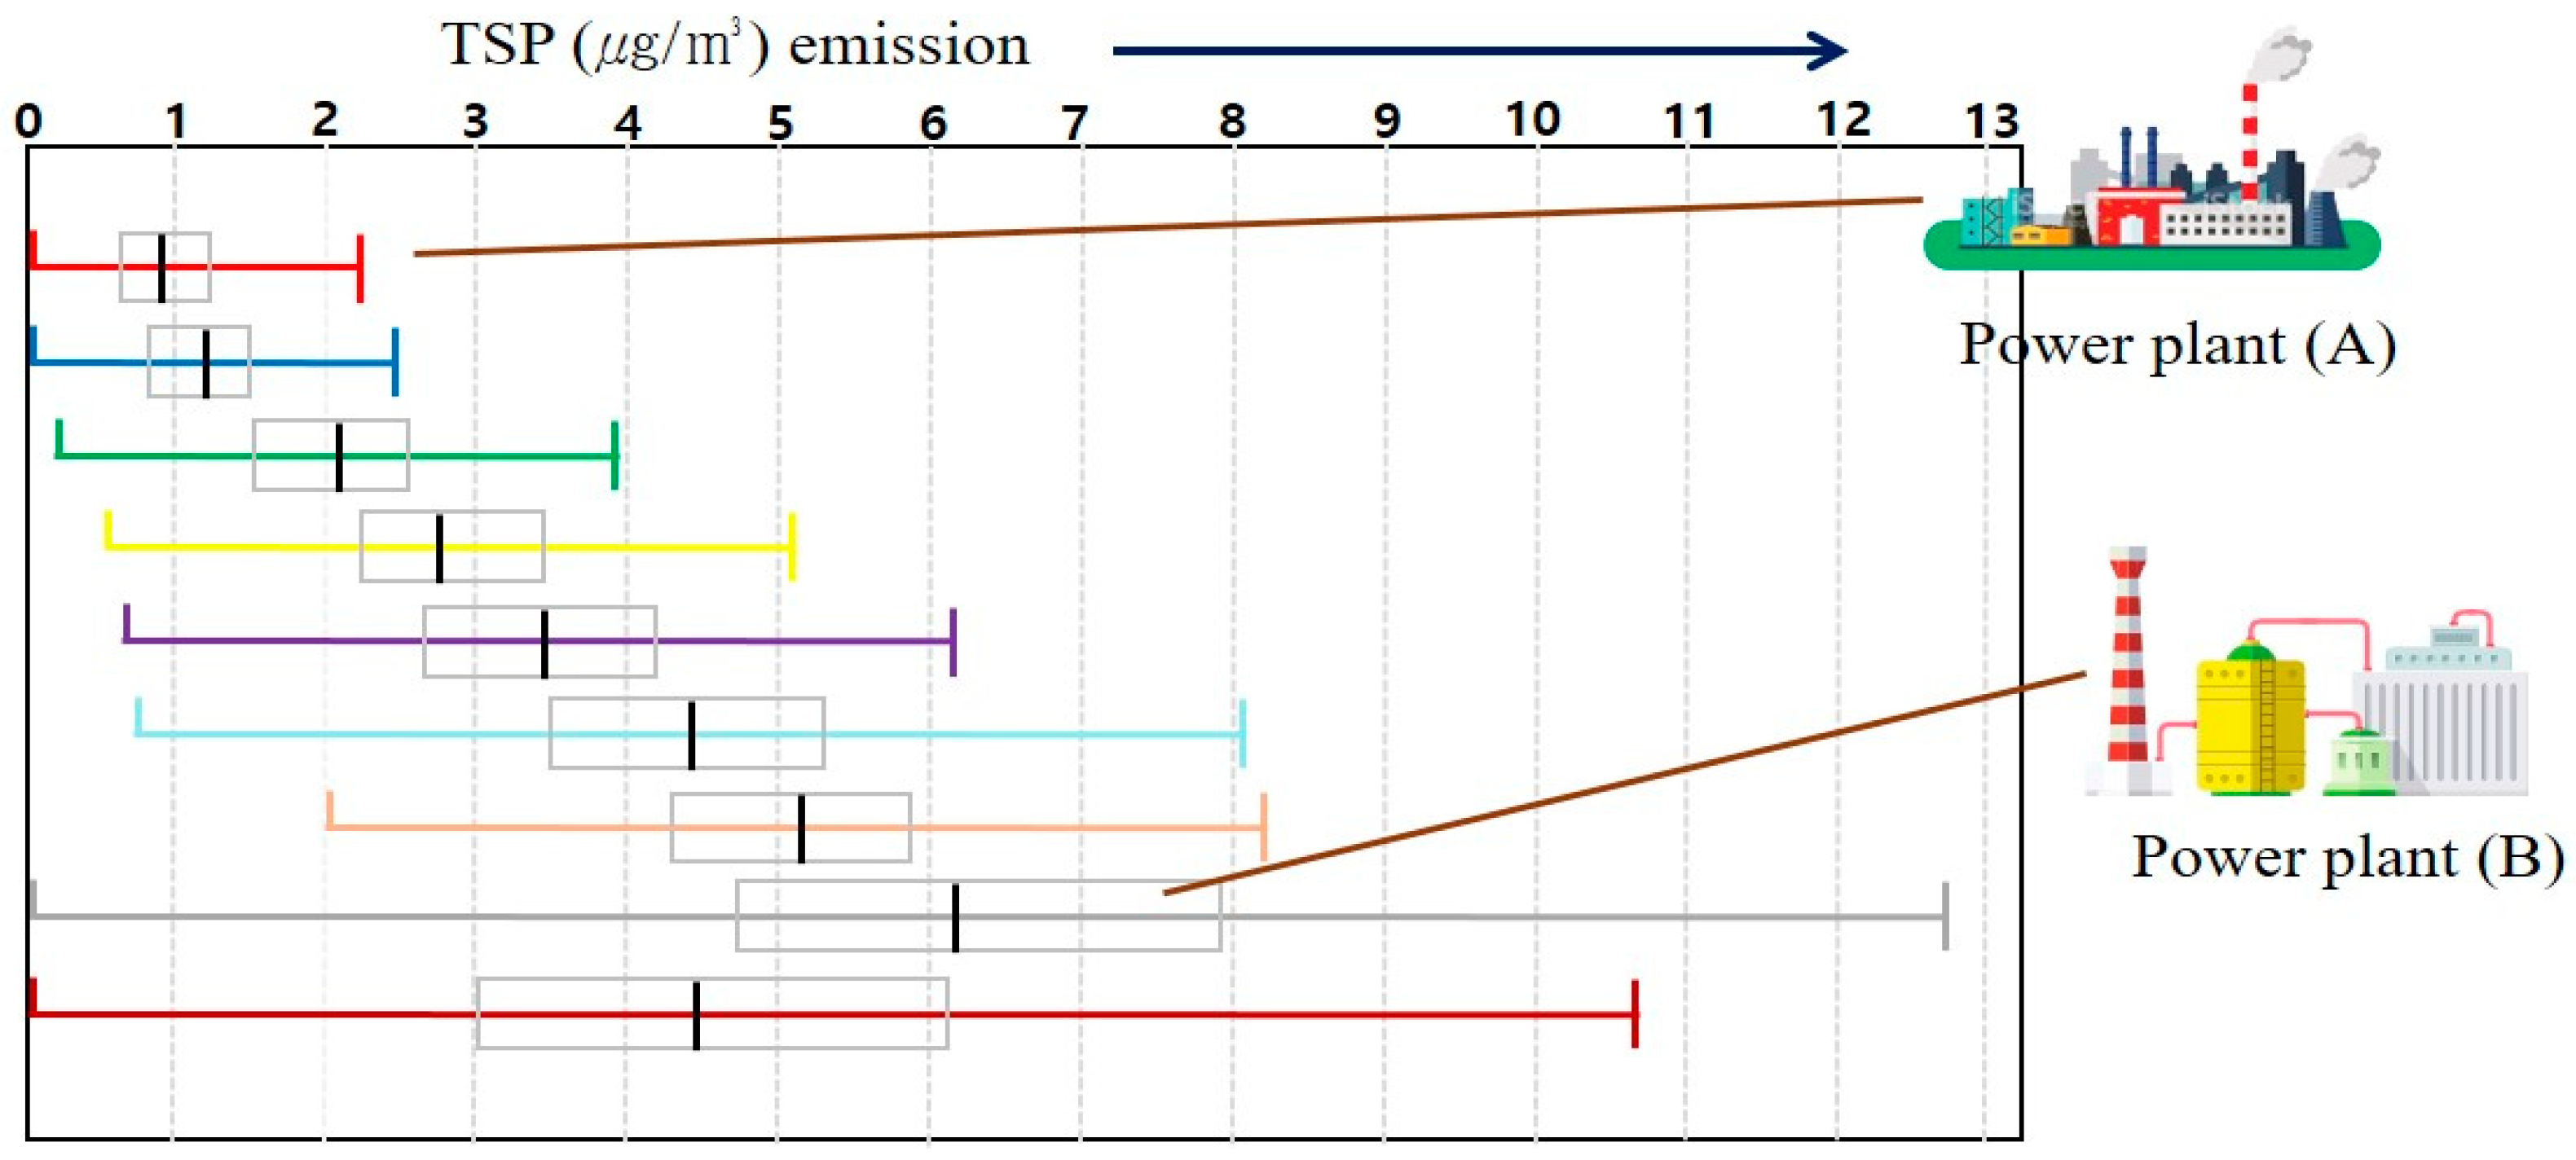
Figure 2 shows the TSP emission levels of 76 steam power plants where the same solid fuel was used and the same dry electrostatic precipitator was installed [
33].
For power plant A, the TSP emission concentration was stable at a very low level (1 mg/m3). However, in power plant B, the average TSP emission concentration was high, with a wide range.
For workplace A, the operating factors of facilities were within an appropriate range, and the prevention facilities were also operating stably. In the case of workplace B, facility operation was relatively incomplete and highly variable. Further, TSP can be emitted in relatively high concentrations at any time, depending on cases during the operation of prevention facilities.
Therefore, if workplace B is unable to monitor pollutant concentrations in real time, identifying when high concentrations of TSP are emitted can be impossible.
A real-time monitoring system for the operation management of workplace B is important to lower its pollution emission level, like that of workplace A, through effective facility operation, and the range of fluctuation can be maintained, as can be seen from
Figure 4.
Therefore, for workplaces where the pollutant emission level is significantly higher than those of other workplaces or the range of fluctuation is wide, the cause must be diagnosed. Causes include the low workmanship of environmental managers, improper operation of pollutant prevention facilities, and failure to perform key operating factors within the normal range.
Therefore, it is first necessary to identify why the pollutant emission level is higher than other workplaces to stably reduce emission. To this end, workplaces where the stability of the pollutant emission level is relatively low must be equipped with a real-time monitoring system for the operation management of prevention facilities. Therefore, a system capable of real-time monitoring by identifying the key operating factors is required.
3.3. Transition to IoT Remote Management System
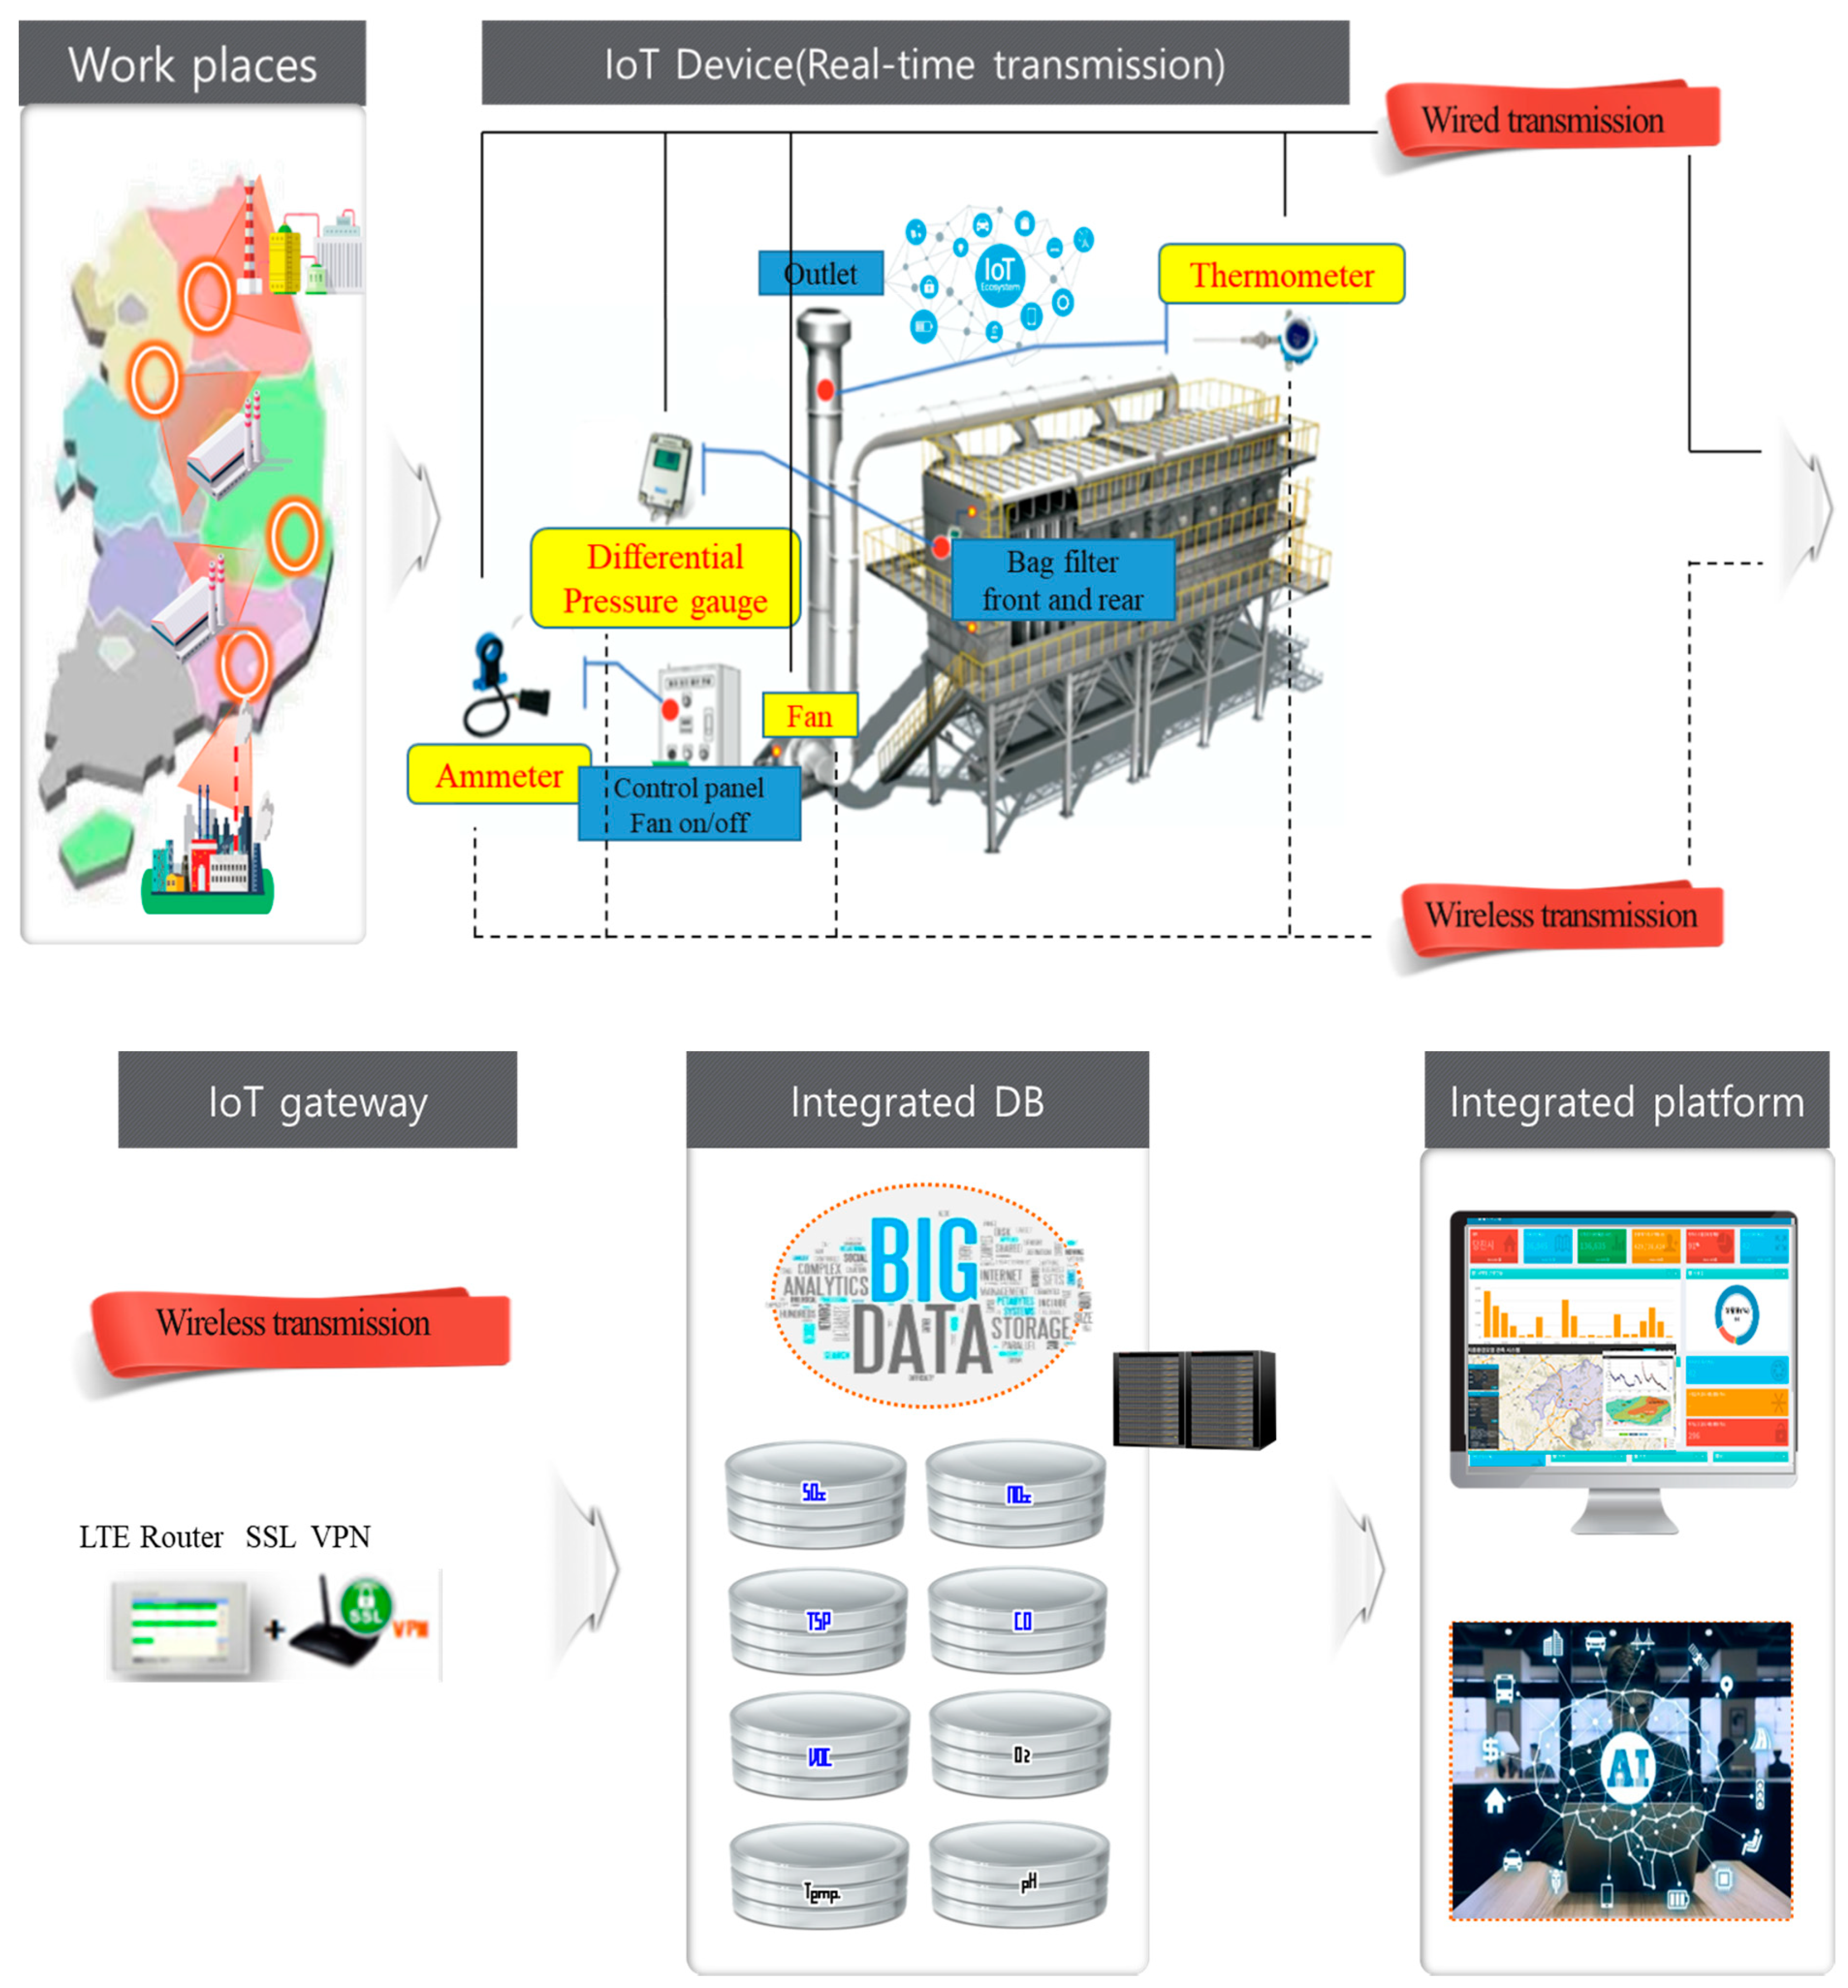
Figure 5 shows a conceptual diagram of a real-time pollutant monitoring system for IoT-based integrated environmental management workplaces [
34]. For the construction of the IoT remote management system, the operating factors of the emission and prevention facilities that affect the emission concentrations of the pollutants were first identified. Once the operating factors for each unit facility were identified, IoT sensors that can measure each operating factor were installed in emission and prevention facilities. The values measured in real time by the measuring instruments (several minutes to several hours depending on the operating factor) were collected and stored through a gateway.
The method of transmitting the sensor signals to the IoT gateway differs depending on the conditions of the workplace. When the number of lines is less or their installation is simple, the wired method for transmitting the sensor signals to the gateway through direct connection can be selected. When substantial time and costs are required because the installation of lines is restricted, due to, e.g., distance and location, the wireless transmission method can be adopted. In the wireless transmission method, several sensor signals are connected to a device and the device is wirelessly connected to the gateway.
This method has the benefit of a simple configuration because several sensor signals are transmitted via one device.
The data collected in the gateway is transmitted to the IoT management system through security devices because they may include the sensitive data of the workplace.
If the emission and prevention facilities do not operate properly or have problems, environmental managers are notified of such situations through the alarm function and they control problematic facilities to prevent pollutants from being emitted at an abnormal level.
It is possible to monitor whether a workplace is being properly operated and managed through the operation management data collected by the control center. The workplace data management service makes it possible to analyze the data required for efficient operation management, energy saving, and the reduction in pollutant emissions, and to establish proper plans.
In addition, it is possible to identify the non-operation status of the emission and prevention facilities through the collected big data. The pollutant emission level can also be managed by controlling the appropriate operating factors.
With the additional combination of AI elements, the BAT-associated emission level (BAT-AEL) and optimal operating conditions of the workplace can be automatically set using big data.
Until now, the pollutant management system tried to lower the emission concentration of pollutants by analyzing the correlation between the operation factors of the prevention facilities and the pollutant emission level without considering the effects of the emission facilities. In this case, there are not many major operating factors of the prevention facilities, so it is relatively easy to identify the management factors. However, there is a limit to accurately understanding the correlation between the operation management factors and pollutants in the workplace. This is because the operation results of the emission facilities directly affect the operation of the prevention facilities.
On the other hand, the IOT-based pollutant management system presented in this study complexly analyzes various operating factors of emission facilities and prevention facilities and their interrelationships. Therefore, compared to the existing pollutant management system, the IOT-based pollutant management system has a more complex diagnostic function for pollutant emission levels. It is expected that this complexity can be resolved if various statistical tools or AI techniques, such as deep learning and machine learning, are used. Since the IOT-based pollutant management system diagnoses the overall emission and prevention facilities, it will be possible to improve productivity, reduce energy use, and minimize the emission of pollutants.
3.4. Utilization of Key Operating Factors of Major Air Pollutant Prevention Facilities for Transition to the IoT Remote Management System
For transition to the IoT remote management system, it is important to identify the operating factors for each facility that may affect the pollutant emission level.
Table 2 and
Table 3 show the key operating factors of the prevention facilities that are generally used to control gaseous and particulate air pollutants.
Catalytic reaction, absorption, adsorption, direct combustion, and combustion control facilities are generally used as prevention facilities to control gaseous materials. Key operating factors for the catalytic reaction facilities are the flow rate, temperature, and fan on/off state. Those for the absorption facilities are the flow rate, pH, pump on/off, and fan on/off state. In the case of adsorption facilities, the differential pressure, temperature, and fan on/off are key operating factors. For direct combustion facilities and combustion control facilities, the optimal conditions are controlled through temperature and fan on/off.
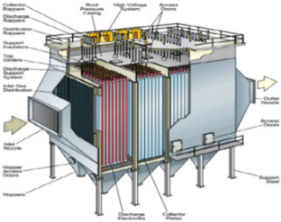
As for the prevention facilities, to control particulate matter, electrostatic precipitation facilities, filter dust collection facilities, centrifugal dust collection facilities, and wet scrubber facilities are generally used.
Key operating factors are the current, temperature, and fan on/off state for electrostatic precipitation facilities; the differential pressure, temperature, and fan on/off state for filter dust collection facilities; the flow velocity, temperature, and fan on/off state for centrifugal dust collection facilities; and the temperature, pH, fan on/off, and pump on/off state for wet scrubber facilities.
Therefore, the key operating factors of typical prevention facilities can be summarized as the current, flow velocity, temperature, differential pressure, pH, fan on/off, and pump on/off state.
3.5. Facility Management Using Key Operating Factors
3.5.1. Identification of the Non-Operation of Prevention Facilities through Current Measurement
The normal operation of pollutant emission and prevention facilities in a workplace can be determined using an ammeter as an indirect surrogate parameter.
For a normally operating production workplace, the current consumption of pollutant emission facilities occurs at a corresponding level. The current consumption will fluctuate depending on the number of products produced.
When pollutants are emitted due to the operation of pollutant emission facilities, pollutant prevention facilities are also operated. According to the operating state of the pollutant prevention facilities, the current consumption is increased or decreased.
When pollutant prevention facilities malfunction or are not operated intentionally, the current consumption deviates from the normal range or becomes zero. Therefore, the abnormal operation of pollutant prevention facilities can be detected by monitoring the current consumption. In addition, some small workplaces do not operate pollutant prevention facilities intentionally. By monitoring the current in real time using an ammeter, a system that can monitor such behavior in real time can be prepared.
It establishes the CT (Current Transformer) sensor without having an influence on the facility operation and the ammeter sensor interlinks the current signal line to the Gateway. The capacity of CT shall be equal to or less than +5% of the maximum capacity of the electronic contactor (or electronic switchboard) or the maximum capacity of the load. The installation direction shall be installed in the load direction from the power side. The measured current values should be distinguished according to the operation and stop of the facility. It establishes between the voltage line and neutral line on one in case the load power source is single-phase. It establishes between the voltage lines in case of being three-phase in the phase (over 2 possibilities) of one. It should not be installed in ground lines, neutral lines (limited to a three-phase four-wire system).
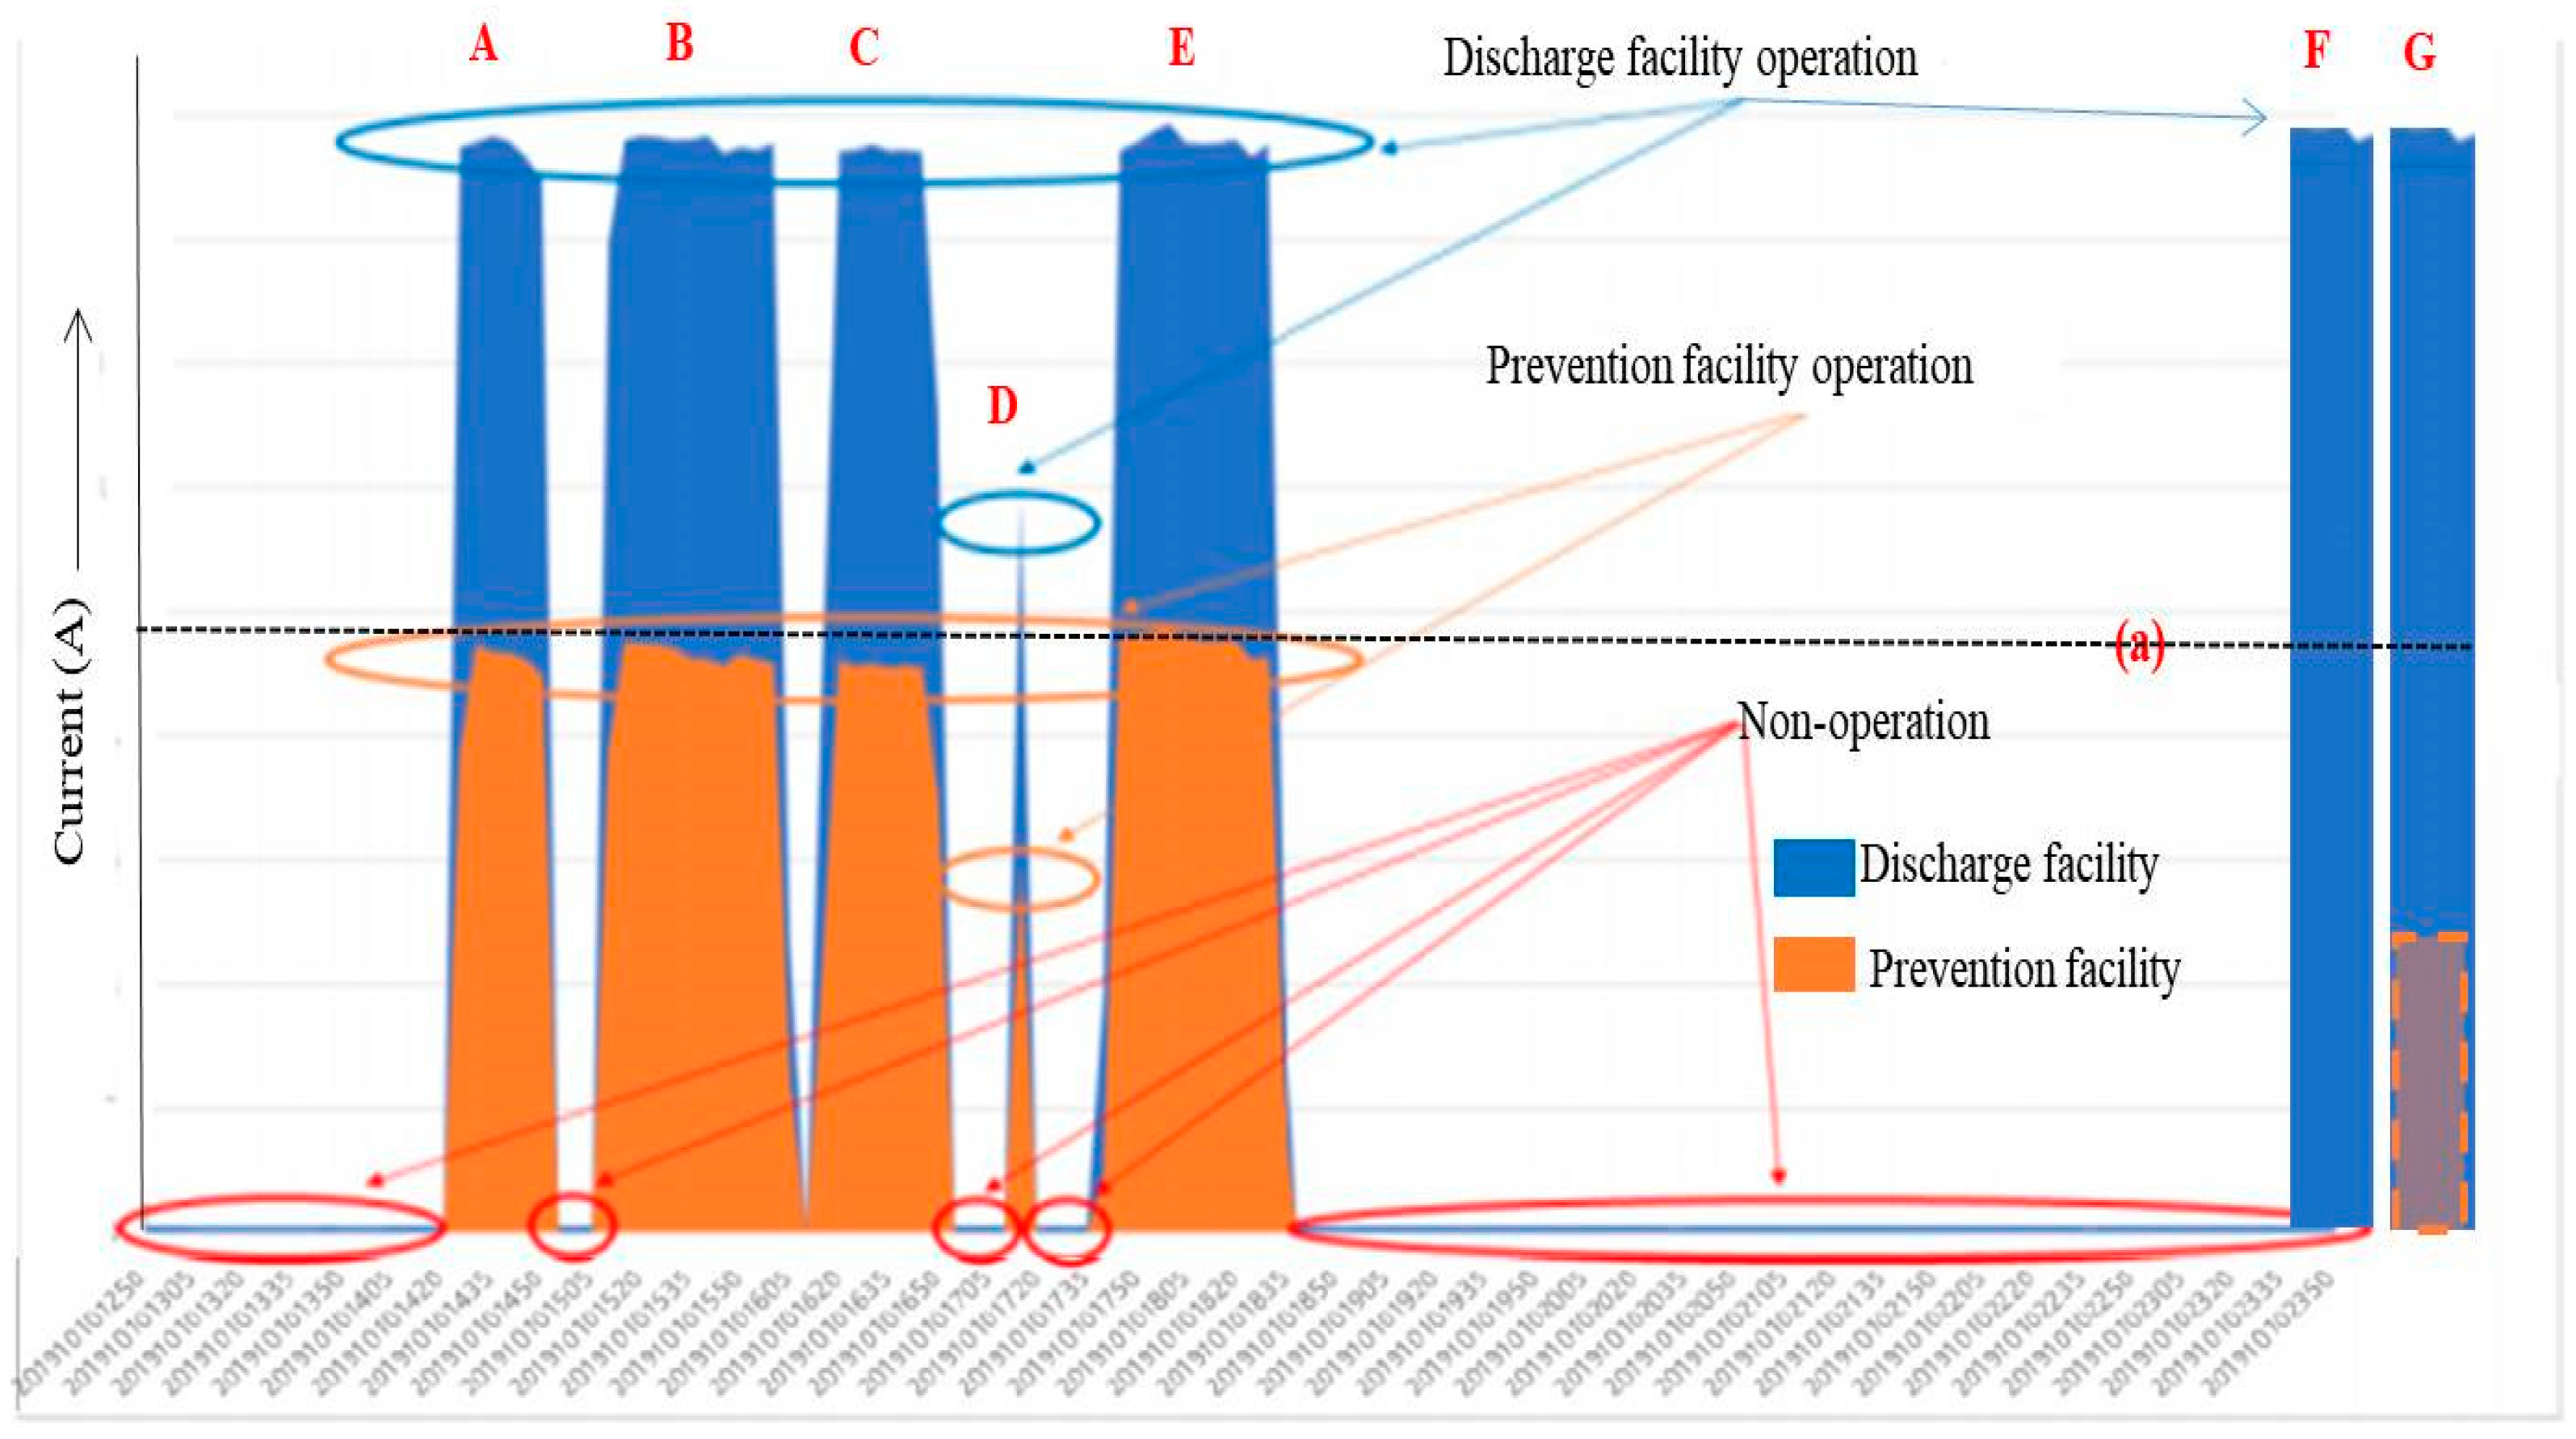
Figure 6 shows a case of monitoring the operation of the pollutant emission and prevention facilities for 24 h through current measurement [
36]. Graphs A, B, C, and E exhibit similar current consumptions because the pollutant emission facility had similar operating levels. Therefore, the pollutant prevention facility also exhibited similar (Line (a)) current consumptions. If the operating level of the pollutant emission facility decreases due to a reduction in production, the current consumption of the pollutant emission facility drops below Line (a) and that of the pollutant prevention facility also decreases, as shown in Graph D.
The current consumption of the pollutant emission facility in Graph F is the same as those of A, B, C, and E; however, that of the pollutant prevention facility is zero because the facility did not operate at all. Further, the current consumption of the pollutant prevention facility in Graph G is lower than Line (a), even though it should be similar to the line, indicating that the facility was not operating normally.
The measured data will be generated by 5-min data and 30-min data through calculations such as the average, etc. These data are transmitted to the IoT management system through the IoT Gateway. Therefore, the manager of the workplace can determine whether the facility malfunctions by monitoring the trend of the measurement data transmitted to the IoT management system. Moreover, when the value is measured over a certain ratio compared to the steady state, the manager can easily sense the abnormal state by providing the manager with a notification.
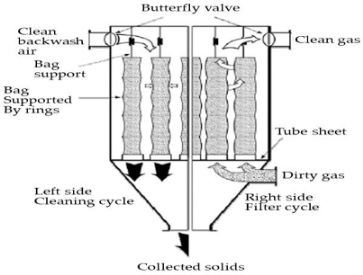
3.5.2. Identification of a Filter Burst through Differential Pressure Measurement
Filters are used in prevention facilities to remove dust. When a prevention facility is operated, the differential pressure continuously increases. Thus, whether the prevention facility is normally operating can be indirectly determined through the differential pressure, among the other operating factors.
If the filter is damaged during the operation of the prevention facility, dust removal becomes impossible and the differential pressure also decreases, thereby making the pressure change before and after the filter zero.
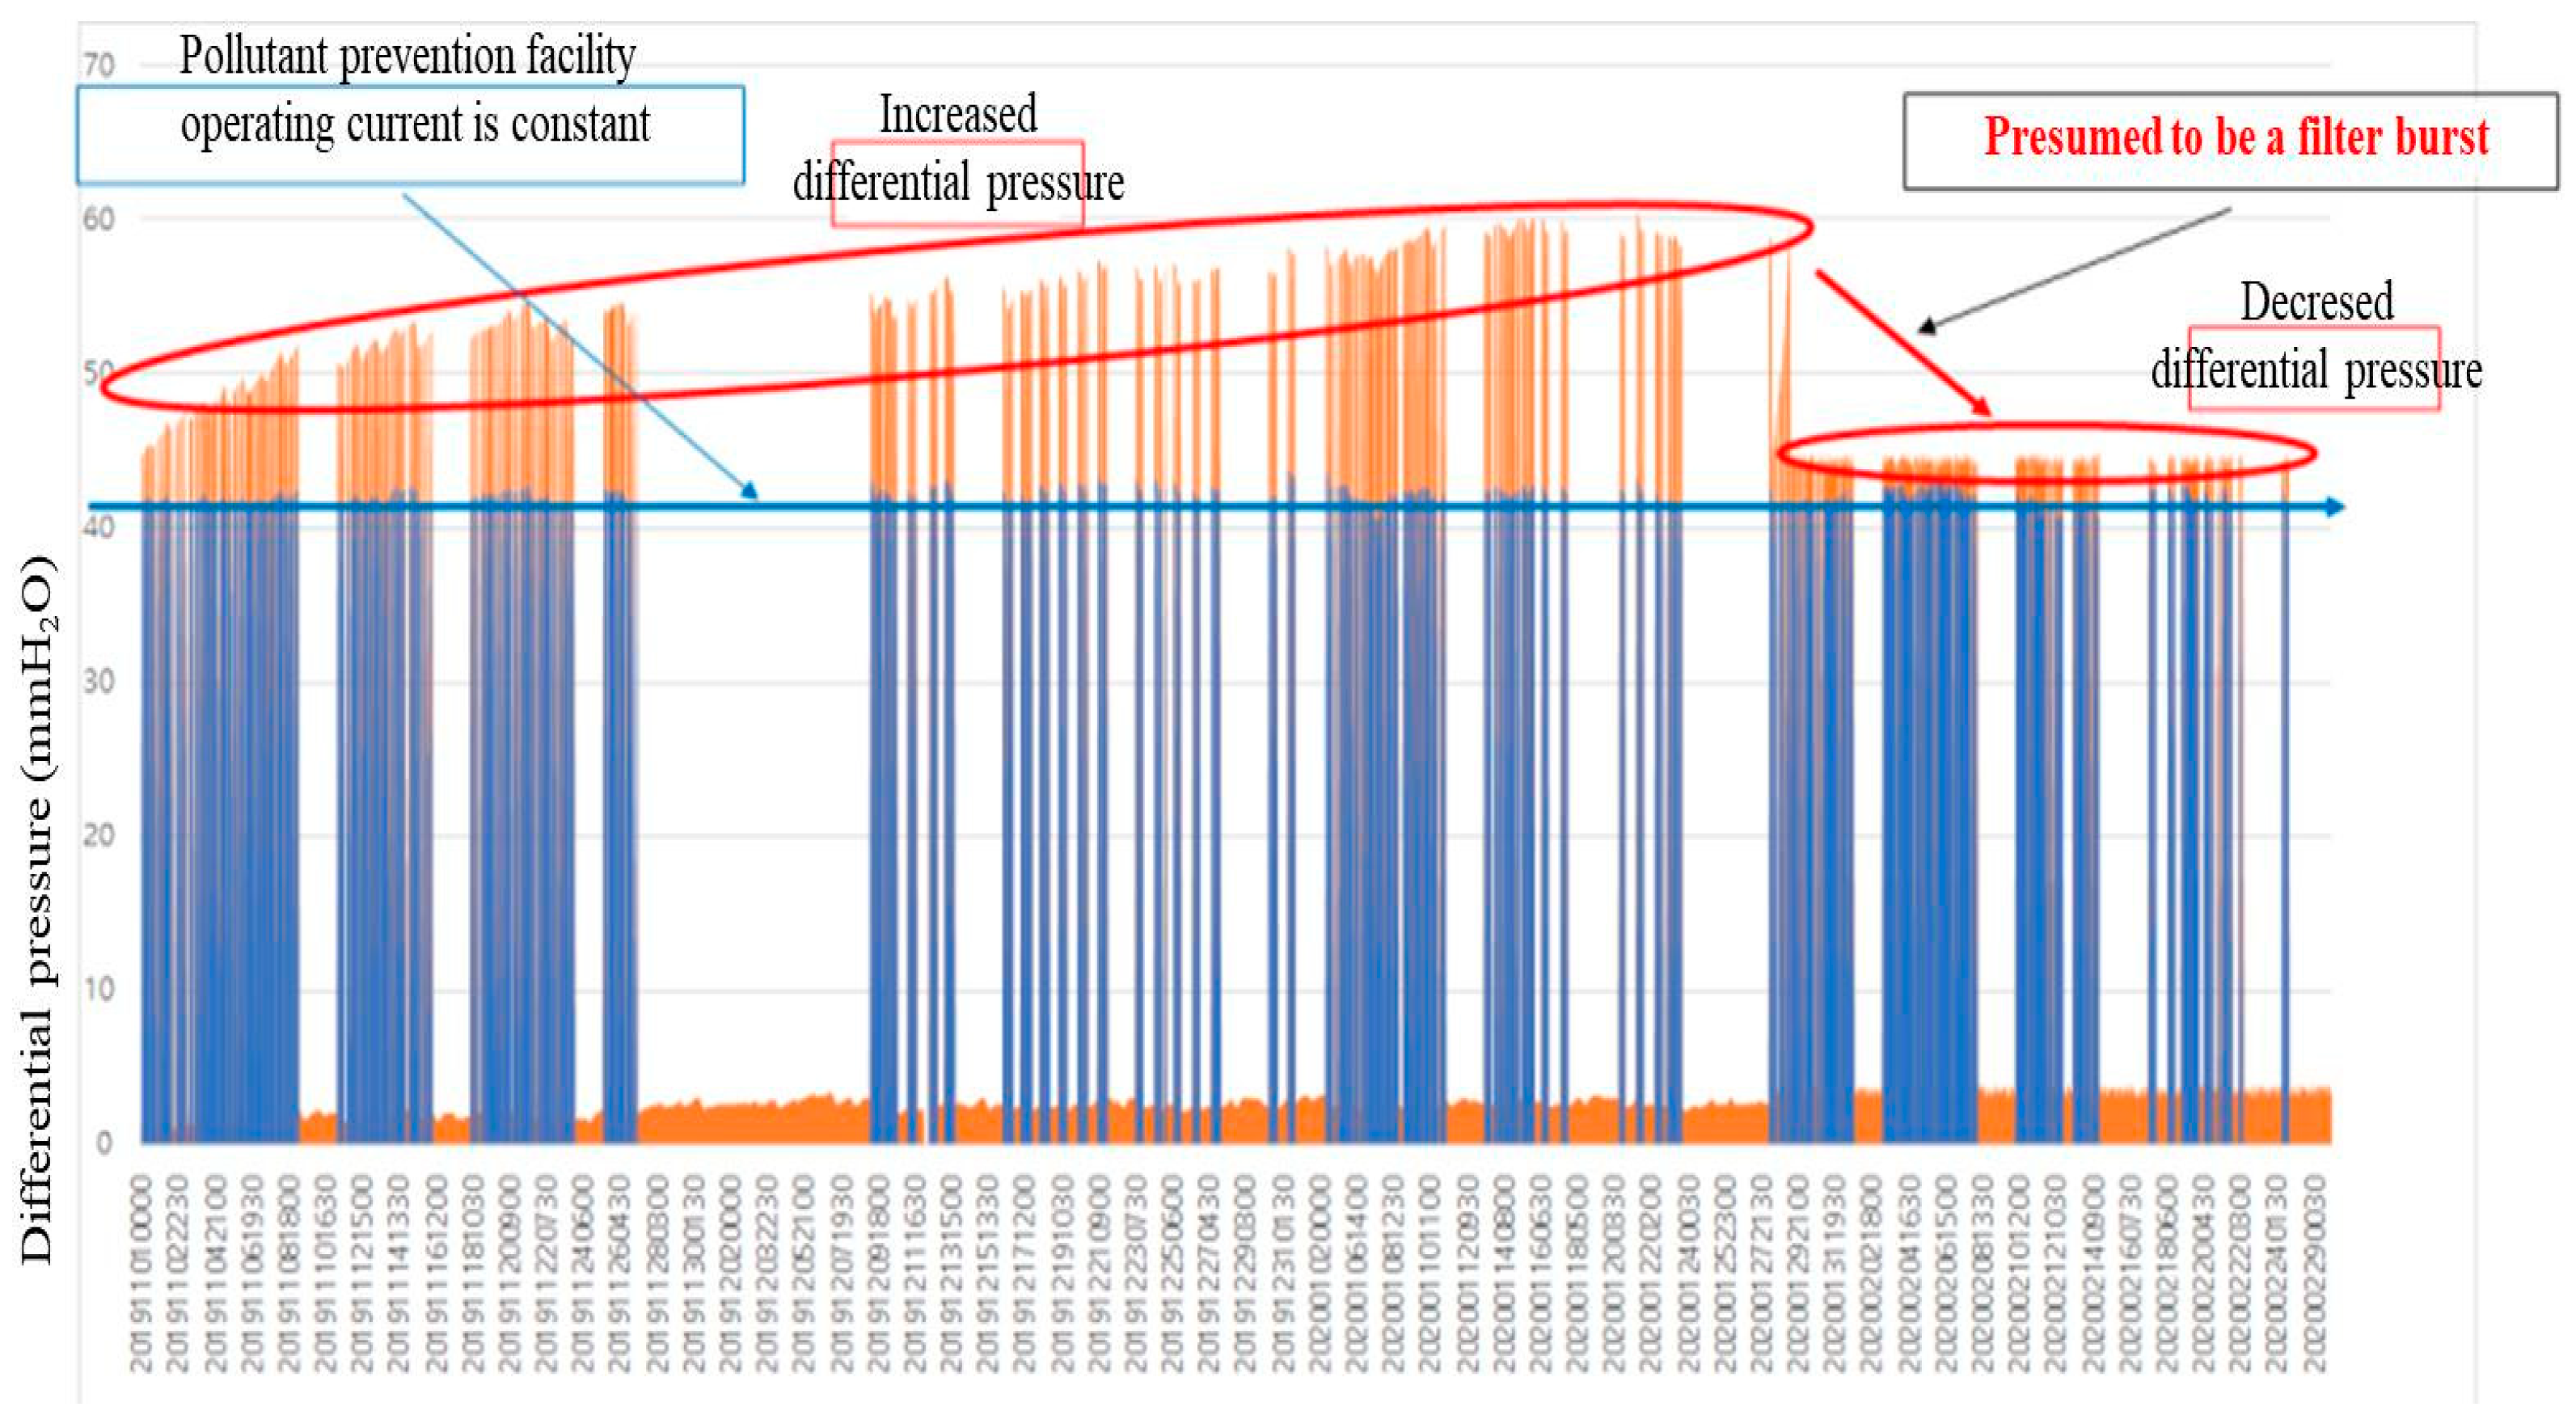
Figure 7 shows a case surveyed by K-eco [
31]. Since 1 November 2019, when the prevention facility started operating, the differential pressure continuously increased with the filtration of pollutants in progress; however, it sharply decreased on approximately 28 January 2020. This means that the filter was not operating normally. Since the facility continuously operated without interruption as its operating current remained constant, this sharp reduction in differential pressure indicates a problem with the filter rather than problems with other parts, which is determined by the operation manager of the prevention facility.
In this case, a burst due to the damaged filter can be predicted, and measures for the prevention facility can be implemented immediately.
The differential pressure sensor was attached to the exterior wall of the prevention facility and attached to the location where the operator can easily check the measurement value. If a differential pressure sensor is installed in a position where there are many workers or equipment moving around the prevention facility, the differential pressure pipe can be damaged, so a differential pressure meter should not be installed in such a position. The differential pressure meter was installed to measure the pressure difference between the front end (inflow part) and the rear end (outflow part) of the prevention facility. When installing a pressure tube, the holed part of the facility was finished to maintain airtightness.
3.5.3. Examination of the Normal Operation of Emission and Prevention Facilities through Differential Pressure Measurement
Table 4 shows the K-eco data that surveyed the differential pressure range during the normal operation of emission and prevention facilities in the collection and sale of recycled paper, lumber, and fireproof ceramic products manufacturing industries [
31].
In the collection and sale of recycled paper industry, the filtration facility linked to crusher #1 maintained a differential pressure between 13 and 50 mmH2O under normal operation; however, the differential pressure rapidly dropped to 0 to 8 mmH2O when the facility did not operate or had problems.
In the case of the lumber industry, the filtration facilities linked to sawing and polishing emissions also maintained a differential pressure between 40 and 70 mmH2O under normal operation; however, the differential pressure was approximately 0 mmH2O when the facilities did not operate or had problems.
In the case of the fireproof ceramic products manufacturing industry, the filtration facility linked to the mixing facility also maintained a differential pressure between 30 and 40 mmH2O under normal operation; however, the differential pressure sharply decreased to 0 to 3 mmH2O when the facility did not operate or had problems.
In other words, as can be seen from
Table 4, normal and abnormal differential pressure ranges are clearly distinguished for each prevention facility. Therefore, the normal operation of the prevention facilities can be determined through continuous monitoring of the differential pressure.
In the event of an abnormality in differential pressure, the addition of an alarm function will help the environmental manager identify the abnormality in the prevention facility more rapidly and promptly implement measures for normal operation.
However, the same normal and abnormal differential pressure ranges will not be applied even for the same industry. Since normal and abnormal differential pressure ranges may vary depending on the type of the emission facility linked to the prevention facility for each industry, it is necessary to individually investigate the ranges in advance at each workplace.
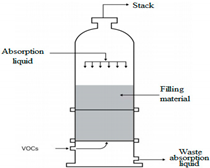
3.5.4. Identification of the Status Change and Replacement Cycle of Absorption Liquid in Absorption Facilities through pH Monitoring
pH can be used as a surrogate parameter to determine the state change of the absorption liquid in absorption facilities among pollutant prevention facilities.
The absorption liquid used in absorption facilities contains chemicals to neutralize pollutants. During the operation of prevention facilities, the pH of the absorption liquid increases or decreases. If there is no change in pH, it may indicate that the prevention facility does not operate or has problems. Therefore, the normal operation of pollutant prevention facilities can be determined through the pH of the absorption liquid.
Since the pH of the absorption liquid increases or decreases during the normal operation of pollutant prevention facilities, the pH of the discharged water must be maintained within the legal range. Therefore, it is possible to determine whether the discharged water is within an appropriate pH range by monitoring the pH of the absorption liquid in real time.
In addition, it is possible to identify the time at which the appropriate pH range is exceeded. Thus, the replacement cycle, which is the important management factor of the absorption liquid, can be determined. In Korea, the pH of the absorption liquid must be managed within the 5.8–8.6 range, reflecting the Water Environment Conservation Act, which specifies that the pH of the wastewater flowing into public wastewater treatment facilities should be within this range [
31].
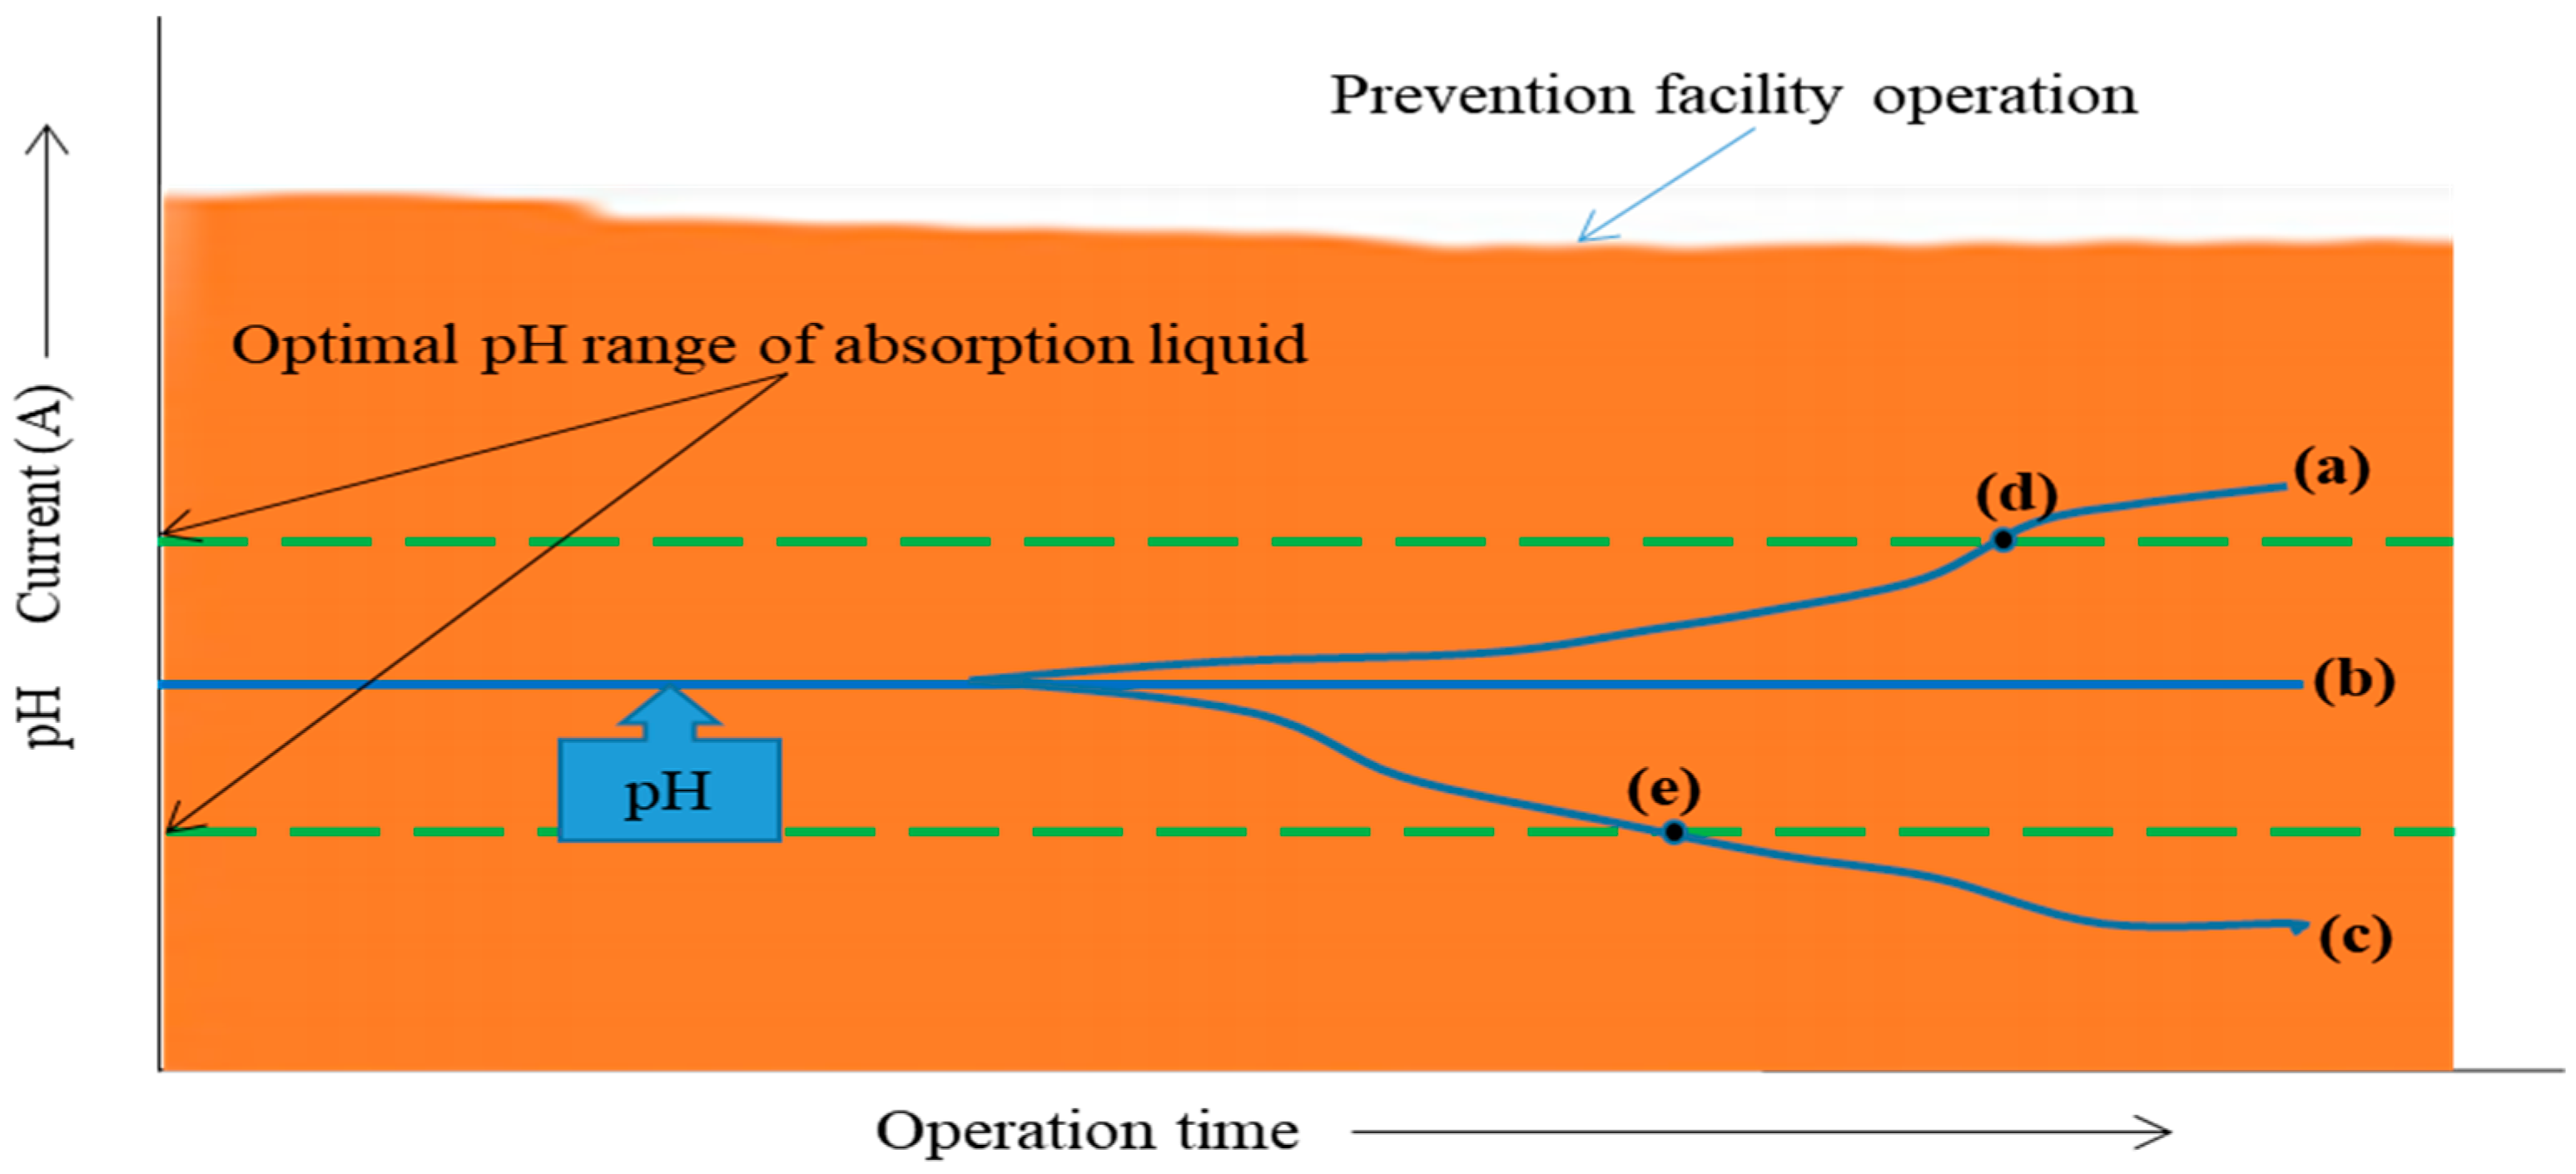
Figure 8 describes the concept of determining whether a pollutant prevention facility is operating normally and when the absorption liquid needs to be replaced by installing pH-based IoT sensors and monitoring the pH change of the absorption liquid in real time. If there is no pH change in the absorption liquid despite the operation of the pollutant prevention facility, as shown in Line (b), the abnormality of the facility must be examined. If the pH of the absorption liquid increases or decreases, as shown in Lines (a) and (c), the absorption liquid needs to be replaced when Point (d) or (e) is reached.
The pH sensor was installed in the water tank of the absorbent solution, and the pH sensor was installed with a separation distance of 5 cm–10 cm from the bottom of the water tank, considering the low water level of the absorbent solution. The sensor was installed in a structure that can be attached and detached for maintenance such as cleaning, etc. The sensor was installed as far away from the chemical inlet to minimize the effect of pH by chemical input.
3.5.5. Suitable Operation, Consumable Material Replacement Cycle, and Pollutant Emission Concentration of a Facility through Temperature Monitoring
Temperature can be used as a surrogate parameter to determine whether the optimal operating temperature range of filter media and adsorbents are maintained in filter dust collection and adsorption facilities in pollutant prevention facilities.
The optimal treatment gas temperature must be maintained according to the filter medium fiber type and absorbent type. Otherwise, the inflow of high-temperature gas may damage the filter media and absorbents in pollutant prevention facilities. Thus, the continuous monitoring of temperature through IoT measuring instruments is required for the protection of pollutant prevention facilities [
31].
Table 5 shows the treatment temperature by filter medium. The treatment temperature is relatively low for cotton, polypropylene, wool, and nylon; however, the maximum operating temperature is relatively high for Teflon and glass fibers [
39].
The adsorption tower is a pollutant prevention facility that removes gaseous pollutants through adsorption with adsorbents. The absorbents used in the adsorption tower include activated carbon, zeolite, silica gel, and alumina. Among them, activated carbon has been most commonly used [
31].
The treatment gas temperature of activated carbon must be maintained at ≤40 °C, which is its optimal adsorption temperature, using heat exchangers because the desorption of the pollutants adsorbed on activated carbon occurs if the temperature is too high [
31].
In addition, the temperature determines the replacement cycle of activated carbon. The replacement cycle of activated carbon is calculated using Equation (1) [
40], and the boiling point temperature of the pollutant acts as a variable.
where
T is the replacement cycle of activated carbon (min),
Wc is the weight of the carbon (kg),
a and
b are the experimental coefficients according to various material grades,
C is the concentration of the pollutant,
M is the molecular weight of the adsorbed material,
Q is the exhaust gas volume (m
3/min), and
is the boiling point of the pollutant (°C).
The continuous monitoring of temperature through IoT measuring instruments during the combustion process is also important for managing the emission concentration of nitrogen oxides (NOx).
NOx that is generated during combustion can be classified into fuel NOx, thermal NOx, and prompt NOx, and the generation of most NOx is caused by thermal NOx [
41].
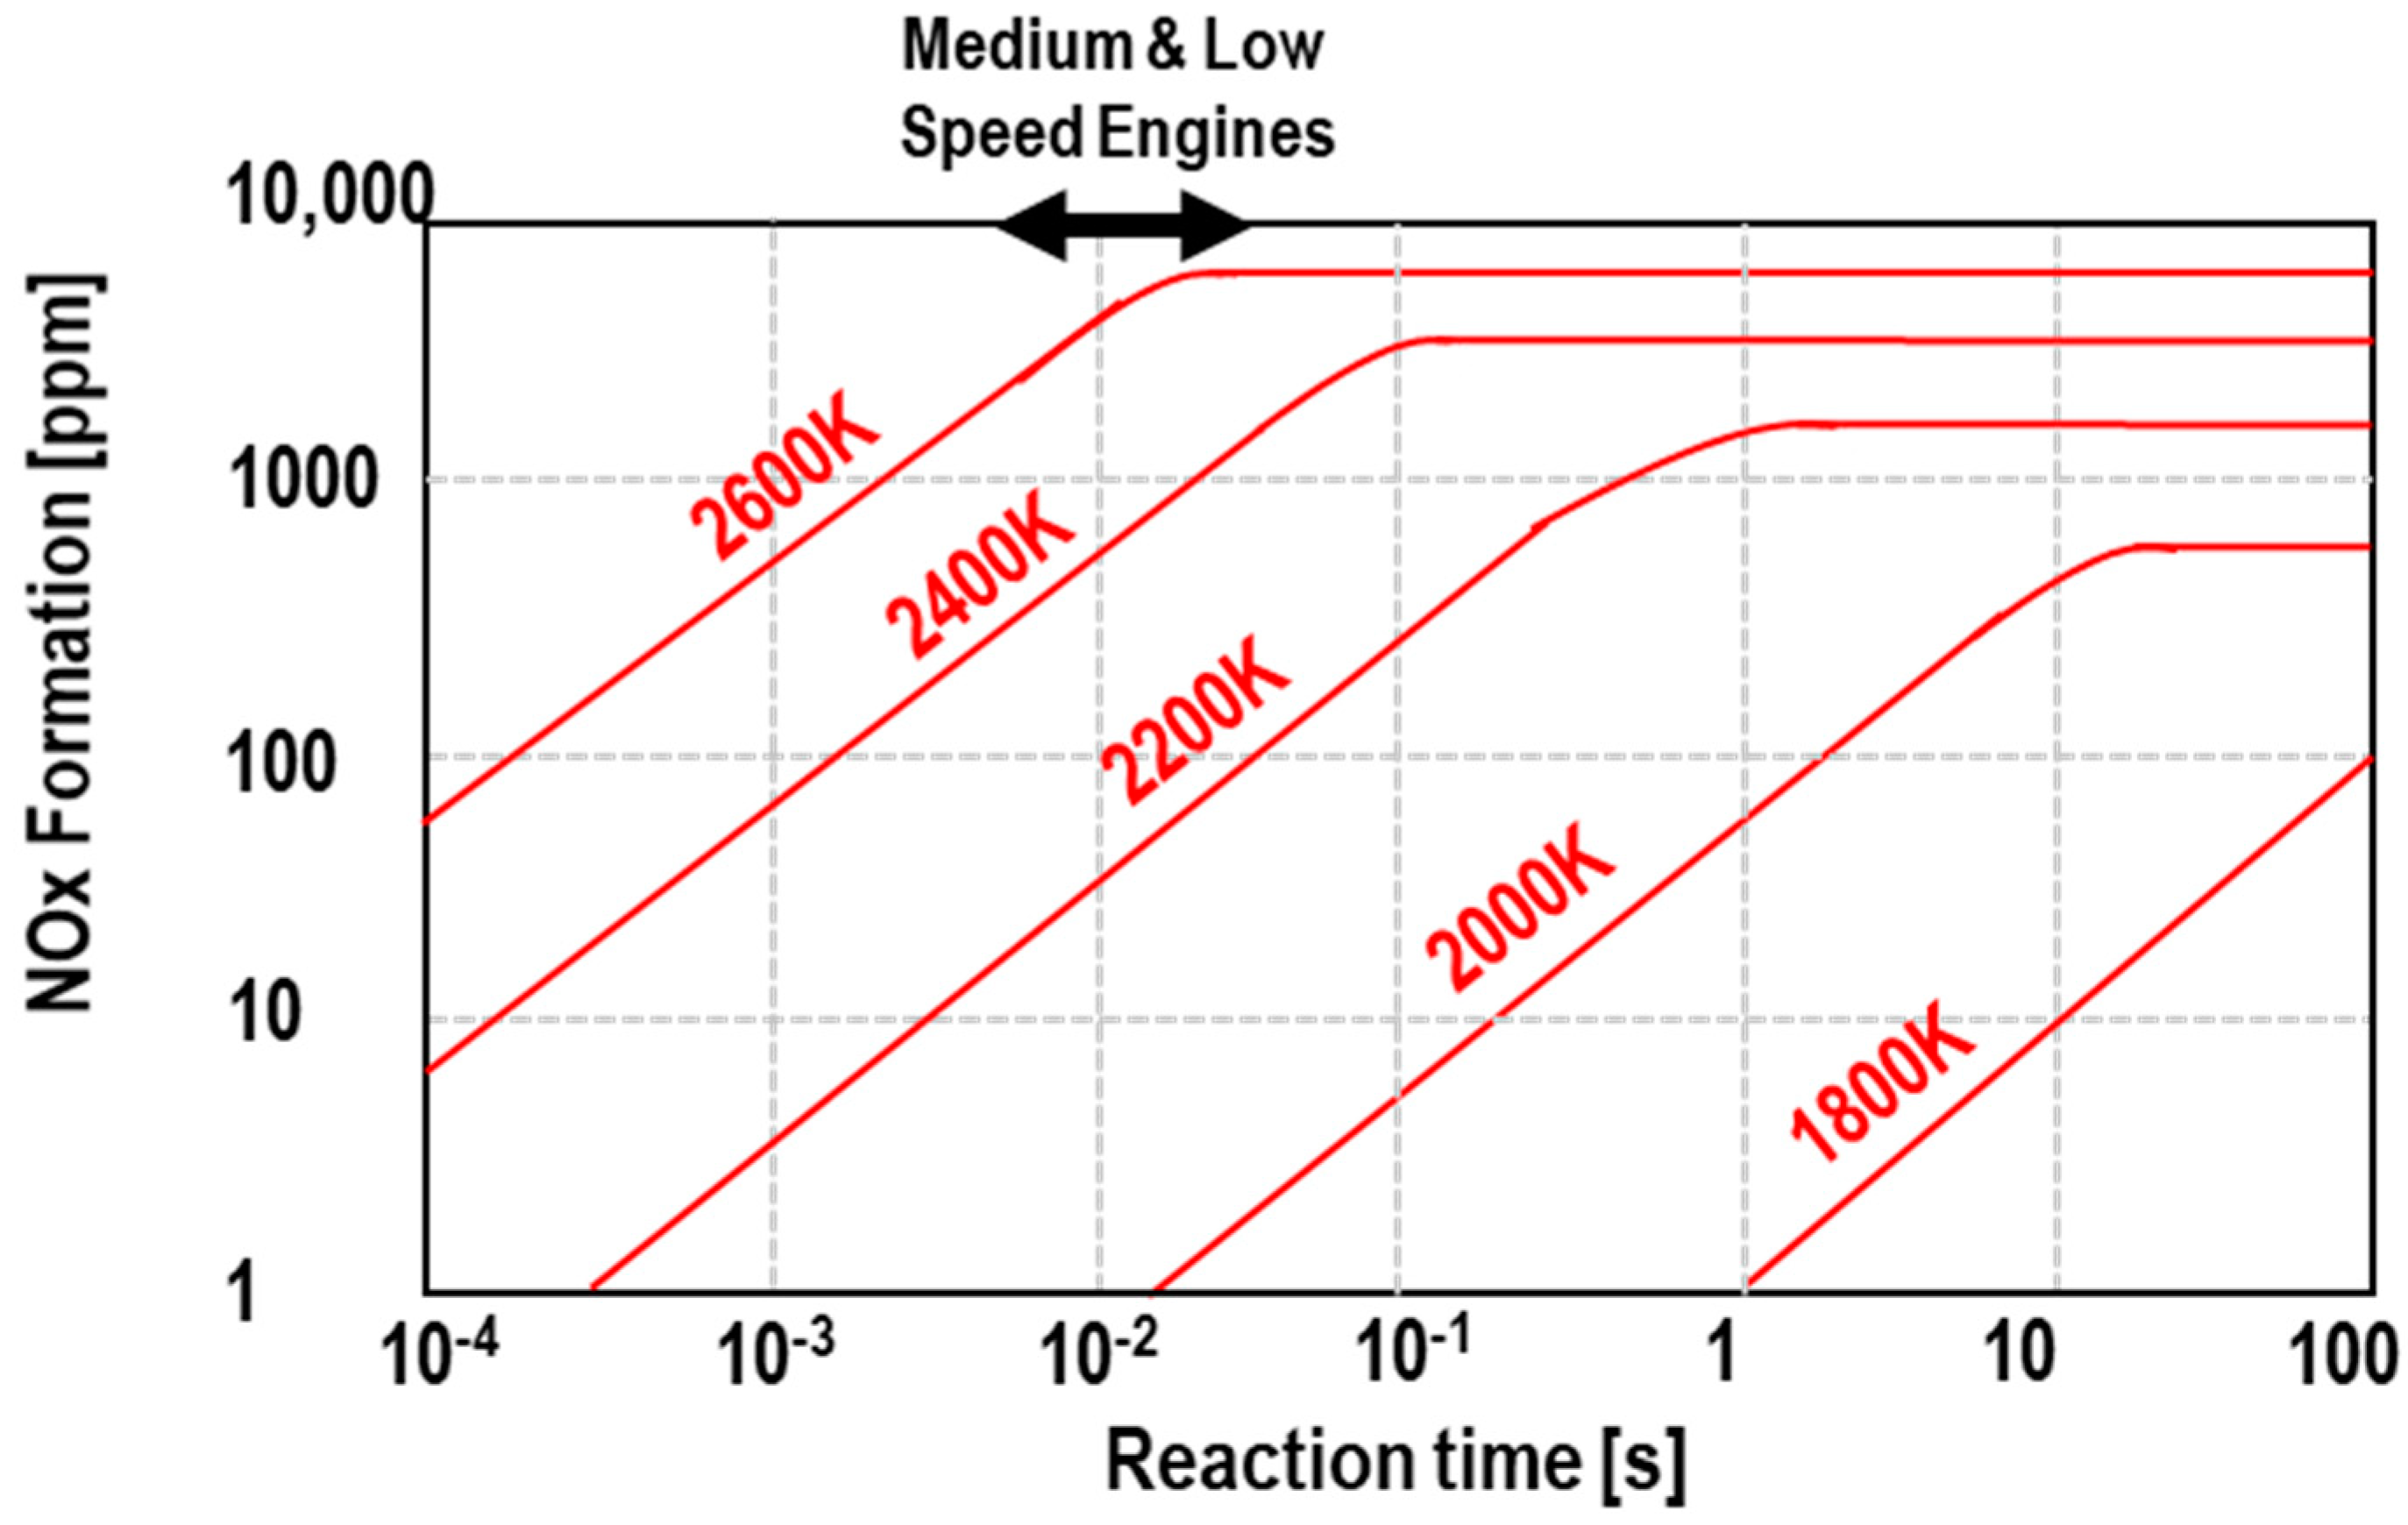
The generation of thermal NOx is closely affected by the reaction temperature. In other words, it is significantly affected by the combustion chamber temperature, and thermal NOx is generated in large quantities when the temperature is high and the residence time of the combustion gas in the high temperature region is long. According to the Zeldovich theory, the generation of thermal NOx is highly sensitive at a reaction temperature between 3000 and 6000 °F (1650–1980 °C), and more thermal NOx is generated as the high-temperature region ≥1300 °C increases. Takasaki et al. also reported that the emission concentration of NOx increased as the combustion temperature increased, and it was also affected by the reaction time, as shown in
Figure 9 [
42].
Therefore, it is necessary to maintain the optimal reaction temperature of the combustion process to maintain the emission concentration of NOx below the legal regulations and to reduce the emission amount. To this end, real-time management of temperature is required.
3.6. Major Surrogate Parameters for Indirect Management of Pollutants in Prevention Facilities
The optimal design and operation of pollutant reduction facilities are determined by various design and management factors. These factors are primarily used to examine whether the reduction facility is properly designed and operated. However, key factors can be used to evaluate the level of the pollutants emitted through the reduction facilities.
In general, monitoring is performed for each pollutant at the final outlet to directly determine whether the pollutants are emitted within the permitted standards, and it can be used as a basis for determining whether the prevention facility is operating properly.
However, for facilities without TMS, considerable cost is required for the regular analysis of pollutants, and deriving the measurement results takes a long time.
Therefore, a system capable of monitoring key factors in real time is required, and it is necessary to use IoT equipment as an alternative. While the concentrations and emission amounts of pollutants as well as the proper operation of facilities can be directly monitored through IoT equipment, it is necessary to effectively manage workplace environment using surrogate parameters while minimizing the installation of monitoring equipment and reducing the required cost [
43].
Table 6 shows the major surrogate parameters capable of controlling pollutants for each prevention facility in the atmospheric field and the IoT equipment applicable for monitoring the surrogate parameters. As shown in
Figure 10, we can derive surrogate parameters that can affect the emission of pollutants from the data produced from various facilities of the factory using a proper analysis tool.
The workplace operates each emission facility and prevention facility under the appropriate operating conditions. The appropriate operating conditions are represented by operating factors 1 to 8 in
Figure 10 [
44]. However, these operating factors are appropriate operating conditions in the independent aspects of each facility. Independent aspects of each facility mean minimizing the use of raw materials or auxiliary materials, reducing energy and water consumption, and increasing efficiency. However, the surrogate parameters mentioned in
Figure 10 refer to management factors that are comprehensively considered to maintain the emission concentration of environmental pollutants within or below the emission limit, as well as the appropriate operation in the independent aspect of each facility. Surrogate parameters are also management factors that can be easily monitored by installing IOT instruments.
3.7. AI-Based Operation Management and System Design for Workplaces Subjected to Integrated Environmental Management Using Big Data
After the integrated permission of workplaces, the recorded data for preservation, such as regular and occasional inspections, self-measurement of pollutants by workplaces, items on the operation of emission and prevention facilities, and items on the implementation of permit conditions, are accumulated as big data.
In addition, the data on the operating values of surrogate parameters measured using IoT sensors can also be used to determine the proper operation of emission and prevention facilities and to control the pollutant emission level.
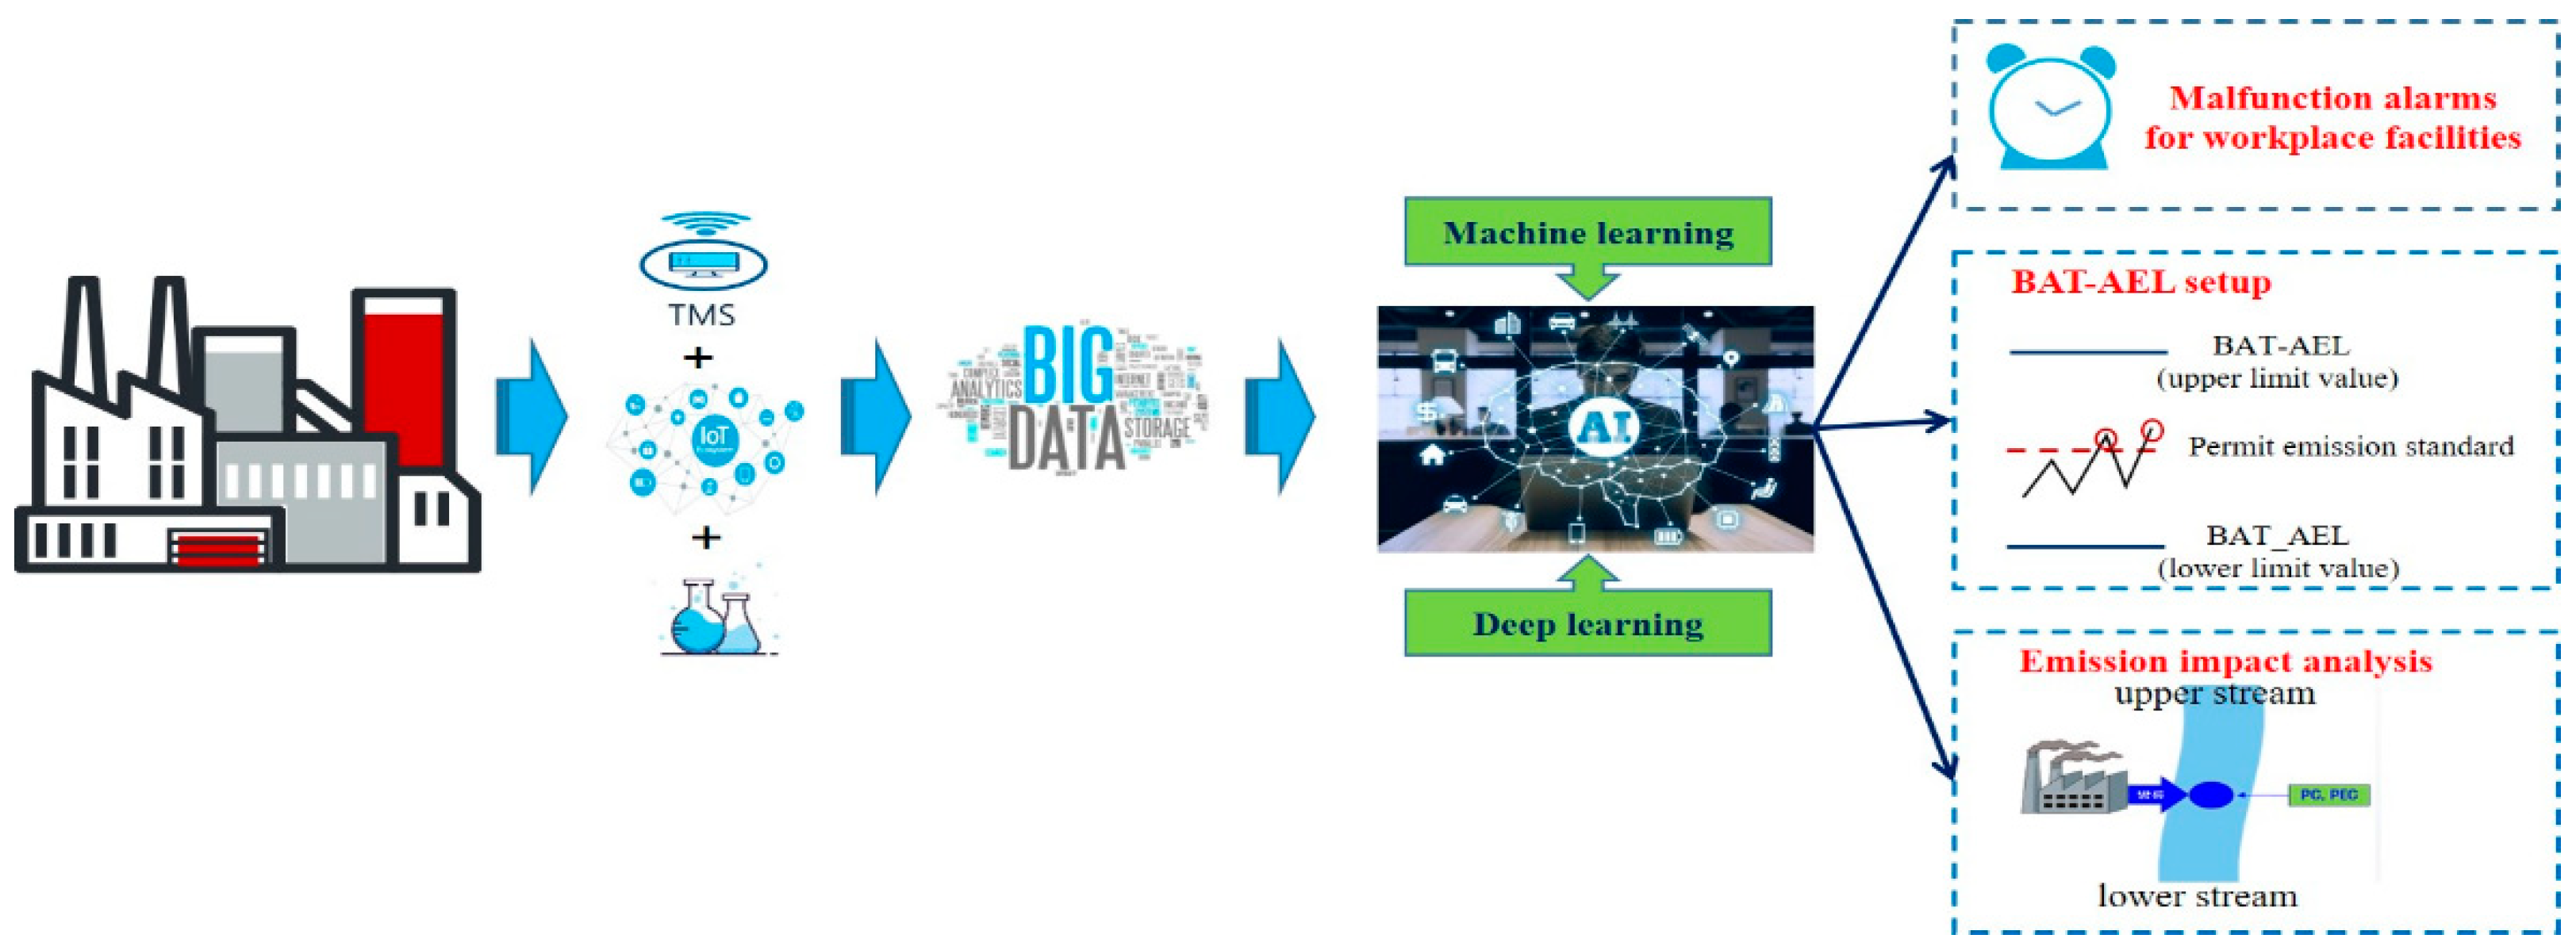
Therefore, based on these data, the utilization of AI, such as machine learning and deep learning, makes it possible to maintain the optimal conditions of facilities in workplaces subjected to integrated environmental management or to construct an AI-based prompt accident response system for abnormalities in facilities (
Figure 11).
Consequently, the emission of pollutants can be minimized through AI-based operation of workplaces subjected to integrated environmental management. In addition, the introduction of AI to workplaces is expected to be included in BAT in the future as a promising technology.
Based on the utilization of the collected big data by AI technologies, it will be possible to present BAT-AEL automatically through computers or by preparing the appropriate permitted emission levels (draft) for each industry. Currently, BAT-AEL is set by preparing a facility classification system using an artificial method based on various measurement data.
Meanwhile, if AI is also applied to the emission impact analysis that predicts the influence of the installation of a workplace on the surrounding environment, it is expected that the results can be predicted more easily.
Therefore, the utilization of AI is expected to be required and possible in various fields for workplaces subjected to integrated environmental management, such as facility operation and system design.
There are various categories, such as machine learning and in-depth learning, in relation to AI technology, and specific cases of which categories are suitable for workplaces will be confirmed through pilot studies planned for 2022.
4. Conclusions
The implementation of an integrated environmental management system has made permission for workplaces faster and more efficient compared to in the past. Based on this, the monitoring of facility operation and environmental management in workplaces subjected to integrated environmental management have become more important.
It is desirable to perform environmental management for all sections in a workplace through financial investment, such as through the operation of TMS. However, for the integrated environmental management system, acceptable economic efficiency is important in the application of the BAT.
Therefore, measuring and utilizing pollutant surrogate parameters through the Internet of Things (IoT) can be an alternative for effective real-time monitoring of facility operation and environmental management in workplaces subjected to integrated environmental management. The following effects are expected when surrogate parameters are utilized.
Normal facility operation can be monitored in real time using sensors, such as ammeters. This is important when facilities stop operating due to a failure, and owners intentionally do not operate pollutant prevention facilities to avoid electricity costs.
Through the installation of differential pressure sensors, it is possible to monitor the normal operation of pollutant prevention facilities, detect abnormalities in real time, and prevent environmental pollution accidents in advance.
Optimal conditions in facilities can be maintained by identifying the operating status and appropriate replacement cycles of consumable materials (e.g., absorption liquid, filter media, and absorbents) in pollutant prevention facilities through the real-time monitoring of pH and temperature using IoT sensors.
If a real-time monitoring system is constructed by identifying various surrogate parameters and using IoT sensors, it is expected that facility operation and environmental management in workplaces subjected to integrated environmental management will become more effective and advanced.
Moreover, if artificial intelligence (AI) technologies are combined for the analysis of big data collected through IoT sensors, they are expected to be utilized in various fields of the integrated environmental management system, such as the real-time management of facility malfunctions, setting of the BAT-AEL and permitted emission standards, and prediction of the influence of pollutant emissions on the surrounding environment.
In this study, an IoT-based methodology was proposed to facilitate the management of the environmental pollutants emitted from workplaces, and its validity was verified using specific cases. However, IoT facilities were applied only to some industries in this study; therefore, it is necessary to obtain data regarding the application of IoT facilities to other industries in the future. Furthermore, if the proposed methodology is proven to be applicable in a field, the installation of IoT facilities can be institutionalized and used for policies. Therefore, it is concluded that this study provided a sufficient basis for conducting related follow-up studies.
The novelty of this paper is that when judging the pollutant emission characteristics, unlike the past, it examines all the management factors of the prevention facilities from the discharge facilities. In addition, it suggests the examples and concepts of environmental management techniques that monitor surrogate parameter that correlate with these operating factors and pollutant emission characteristics in real time by installing IOT measuring instruments. Research papers related to these methodologies are hardly found. However, as pilot studies are underway for real workplaces, specific matters, such as the surrogate parameters for each workplace facility, correlation analysis methods with the pollutant emission level, and IOT installation and operation guidelines will be presented through future papers.


