Article

Performance-Based Navigation Flight Path Analysis Using Fast-Time Simulation

by
Daniel A. Pamplona
1,
Alexandre G. de Barros
2,* and
Claudio J. P. Alves
1
1
Department of Air Transportation, Aeronautics Institute of Technology, São José dos Campos 12228-612, Brazil
2
Department of Civil Engineering, University of Calgary, Calgary, AB T2N 1N4, Canada
*
Author to whom correspondence should be addressed.
Energies 2021, 14(22), 7800; https://doi.org/10.3390/en14227800
Submission received: 8 September 2021 / Revised: 28 October 2021 / Accepted: 10 November 2021 / Published: 22 November 2021
(This article belongs to the Special Issue Air Transport Systems Optimization)

Abstract

:
The growing demand for air transportation has led to an increase in worldwide air traffic inefficiency due to capacity constraints. The impacts associated with this situation can be reduced through operational changes. To better handle the problem, the Single European Sky ATM Research (SESAR) and the Next Generation Air Transportation System (NextGen) program suggest Performance-Based Navigation (PBN) as a solution. The Area Navigation (RNAV) and Required Navigation Performance (RNP) approaches belong to the group of PBN procedures. These procedures allow for a more efficient use of airspace by reducing route distances, fuel consumption and perceived aircraft noise. This article quantifies the benefits of PBN systems for two indicator parameters—fuel burn and flight time—and compares PBN systems to conventional instrument navigation procedures. The case studies use five airports in Brazil. The results of this analysis show that the benefits of the PBN approach vary with aircraft type and individual route characteristics.

1. Introduction

Flight congestion and delays are a significant issue at busy airports. They are a major contributor to air pollution and energy waste, costly for airlines, and a significant inconvenience for passengers. As a result, airlines have faced extra costs and been unable to effectively use available resources in the aviation sector [1]. To improve capacity and fuel efficiency without negatively impacting safety and the environment, it is essential to develop new strategies for air traffic management (ATM), which will take advantage of present and future technologies [2].
One of the most important recently developed solutions to these problems is the use of Performance-Based Navigation (PBN) procedures. The International Civil Aviation Organization (ICAO) developed the PBN concept for air navigation. The objective of PBN is to integrate the operational standards of the Required Navigation Performance (RNP) and the Area Navigation (RNAV) approaches. There is fundamentally very little difference between RNAV and RNP, except that RNP systems require alerting and on-board monitoring. PBN is a major component of the NextGen (USA), SESAR (Europe), and SIRIUS (Brazil) programs. These programs aim to implement efficient procedures and an effective use of airspace. In addition, they improve safety, access, capacity and operational efficiencies of the aviation system, thus reducing its impact on the environment.
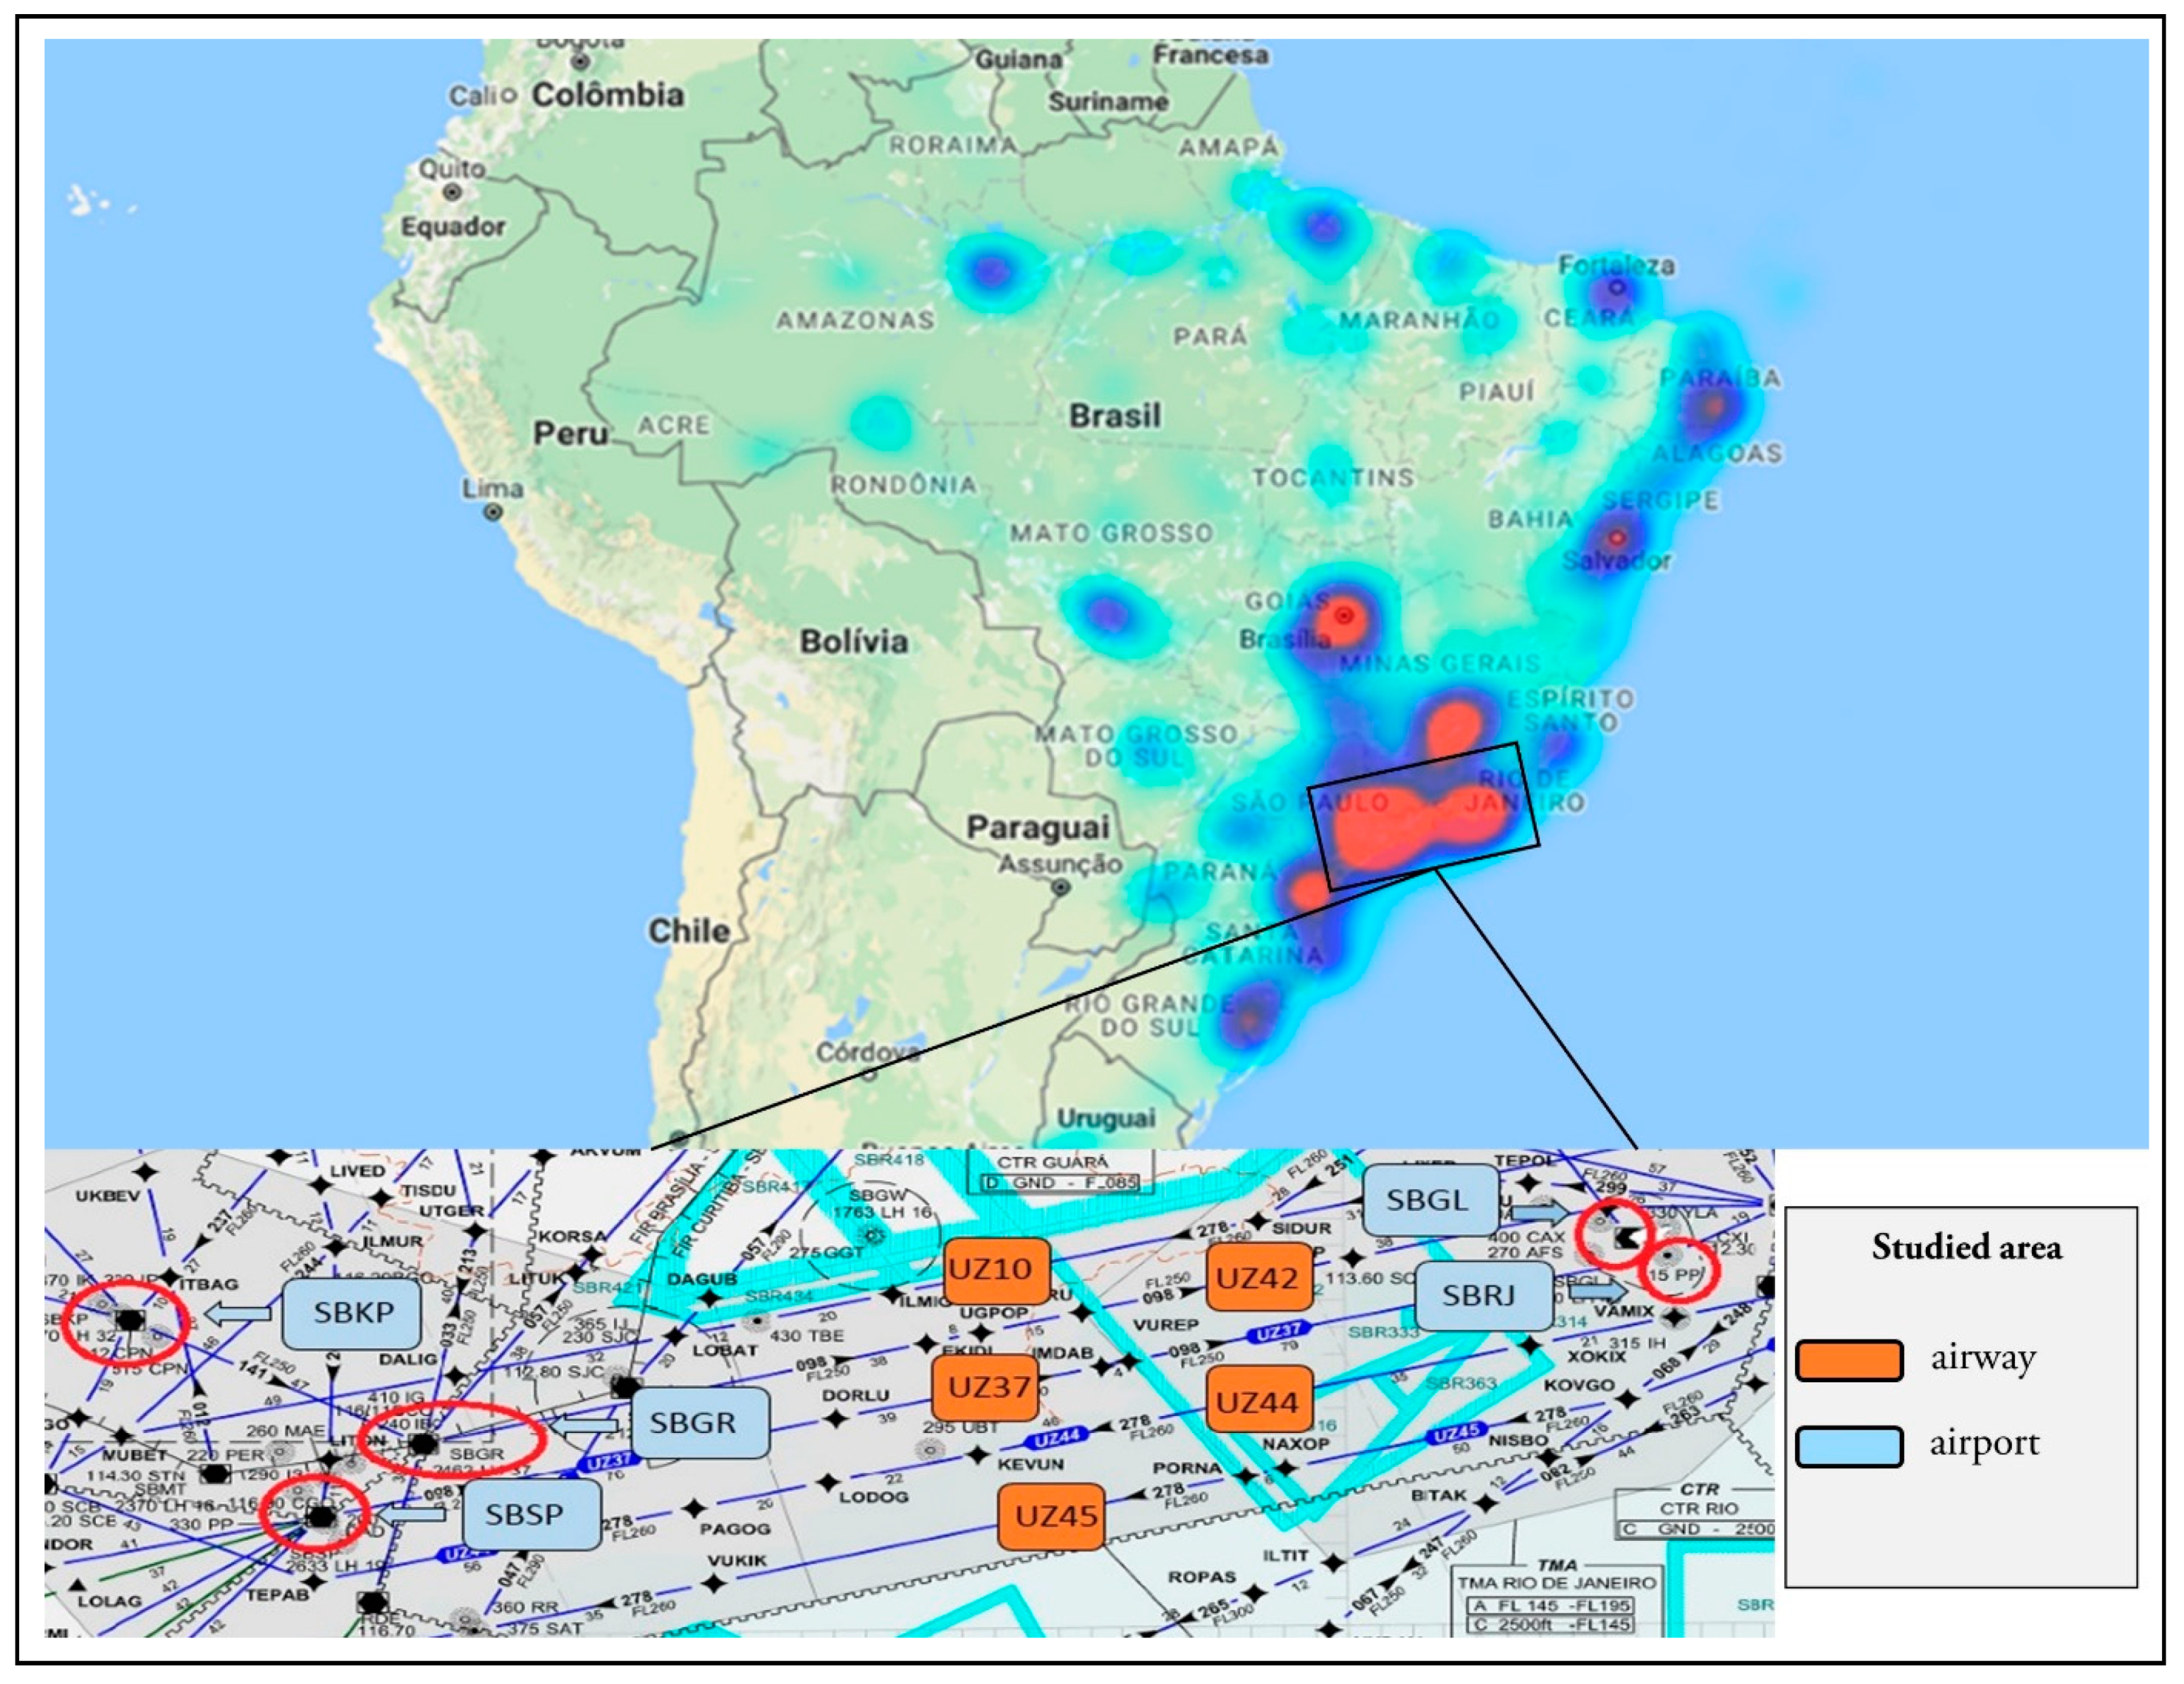
This study investigates the benefits of PBN procedures at the five major airports in the Brazilian cities of São Paulo and Rio de Janeiro. The benefits are evaluated in terms of fuel consumption and flight endurance. These five airports handle almost 50% of all Brazilian air traffic. A fast-time simulation method was used to compare all PBN operations. This research encompasses all flight routes, including both terminal area (TMA) and en-route airways, individually flying and interacting with other flights. The inclusion of the latter greatly increases the complexity of the analysis, as it includes flights with origins and final destinations other than the five airports in the analysis.
This article expands on the academic literature focused on quantifying the benefits of flying PBN procedures. ICAO claims that the improvements in PBN operation include direct, reduced flight trajectories, lower fuel consumption and reduced negative impact on the environment, and a higher arrival rate at the TMA, among others [3]. ICAO’s study does not quantify the benefits of PBN. There is a need for studies to fill this gap, using different techniques to estimate the benefits of the implementation of PBN procedures. Although RNAV has many advantages over conventional procedures, RNP can provide a supplementary benefit that cannot be matched by RNAV [4]. This research measures the benefits of RNP approach procedures comprising radius-to-fix legs, also referred to as RNP Authorization Required (AR) or Special Aircraft and Aircrew Authorization Required procedures. Navigation abilities unique to RNP AR procedures are not available with any other instrument approach procedures; however, these procedures are not widely used due to the high costs associated with their operation. In the U.S., the use of RNP procedures varies widely between airports, ranging from 0.3% at Seattle/Tacoma to 7.56% at New York/JFK [5]. As their implementation is very recent and not all airlines have the capacity to operate it [5], few studies have focused on quantifying the benefits of operating RNP procedures [4,6,7]. This research helps to fill this gap.

2. Background

2.1. The Airspace Concept and Performance-Based Navigation

The airspace concept specifies the flight operation that will be performed in a determined airspace. When choosing an airspace concept, the goals are to enhance air safety and air traffic capacity, provide more accurate flight routes, and reduce environmental impacts. Airspace structure and organization, minimum system separation requirements, route spacing, and a minimum obstacle distance are defined to achieve these objectives. Communication, navigation, surveillance, and air traffic management are foundational to this approach. PBN is a type of air navigation procedure that includes avionics, crew qualification and air traffic management system requirements regarding precision, integrity, availability, continuity, and functionality. PBN is an improvement to older technology and a set of operational specifications with which an aircraft must comply. It is based on the installed navigational equipment and not a unique navigational sensor. RNAV and RNP outline the procedures for PBN, and RNP requires the inclusion of warning and monitoring capabilities [3]. By employing this new approach, an airspace system is made more reliable and efficient, resulting in greater flexibility when planning flight routes as well as during takeoffs and landings, in addition to optimizing vertical profiles through the use of continuous climb and descent procedures [8].
There is a broad variety of RNAV and RNP procedures, varying from single- to multi-sensor systems, which use different forms of navigation equipment. Accuracy, integrity, continuity, and functionality standards must be met to perform the specific procedures. PBN allows, when coordinated with air traffic control (ATC), for a higher level of onboard automation to perform a specific flight path, eliminating the need for continuing pilot-to-ATC communication, which decreases an air traffic controller’s workload [9]. The precision and integrity of PBN allows an aircraft a more precise route, which improves airspace capacity and supports more flexible flight procedures. It also optimizes air route planning in terms of reducing fuel consumption, time, noise, and delays.
PBN relies either on the Global Positioning System (GPS) or Global Navigation Satellite Systems (GNSS), providing a system for navigation that derives a position solution with nearly worldwide coverage. In general, a triangulation process is used to determine the user’s position by analyzing the time of arrival of signals from several satellites to a receiver. However, because satellite signals can be impacted along their propagation paths, when a receiver measures the travel time and multiplies it by the speed of light, it does not provide the receiver with a true range: the result is the pseudo-range between the satellite and the receiver. Thus, the navigation integrity—the likelihood of an unnoticed position error exceeding a predetermined limit—must be confined to the criteria outlined by aviation regulators [10]. The development of energy-efficient GNSS signal-acquisition techniques, such as the collective detection approach, is critical to mitigating these limitations [11].
The lateral total system error (TSE) measures the performance of the airborne system, which consists of a lateral navigational system error (NSE) and a lateral flight technical error (FTE). Lateral FTE is defined as the lateral deviation relative to a predetermined position and a target trajectory. The use of satellite navigation augmentation systems has improved navigation precision and reduced NSE. For the RNP requirements, it is necessary to monitor the effectiveness of the airborne platform, and to send a notification in the event of a loss of accuracy [12]. Air authorities specify the navigation performance and lateral deviation necessary for RNAV and RNP procedures. For example, in an RNP 1 procedure, the maximum lateral deviation accepted is one nautical mile per each lateral side 95% of the time and two nautical miles for 99% of the time. Since aircraft equipment ensures the maximum lateral deviation, an airspace planner can design routes that are closer together, which expands airspace capacity.

2.2. Fast-Time Simulation

Two distinct simulation categories are commonly used in ATC studies: human-in-the-loop (HITL) and fast-time simulation. In HITL simulations, existing schemes are modeled with a superior level of precision. This is highly reliable in investigations into the synergy between humans and machines. However, it is costly, humans are susceptible to fatigue, and it has reduced adaptability and scaling ability, which is restricted to the ability of the testing platform. In contrast, HITL’s weaknesses are overcome by fast-time simulation. Fast-time simulation allows for the easy and quick modelling of additional capabilities and innovations for existing ATM infrastructure. With fast-time simulation, numerous simulation runs can be performed with varying configurations [13].
The airspace system consists of a wide variety of functions [14]. Airspace modellers use simulation to verify and test new concepts. Fast-time simulation evaluates several concepts, procedures, and infrastructures within a short time. Obstacles can be identified at an early stage, which improves a project prior to its completion, avoiding high and unnecessary spending. This research extends previous works, since it uses simulation to evaluate the benefits achieved in an airspace network when PBN procedures are applied. Evaluating the benefits includes an evaluation of fuel consumption and time savings during flight. Flight time savings are considered in all flight phases (take-off, landing, and cruise time). Moreover, each route of the network and each type of aircraft using the route is evaluated. The next section describes the applied methodology.

2.3. Flight Phases and Associated Procedures

For every flight phase, there is an associated procedure that standardizes pilots’ actions. Figure 1 shows all the flight phases and associated instrument flight procedures.
The procedures follow the guidelines of the air traffic control authority, and each airport has a specific set of procedures that must be followed. During departure and climb, an aircraft must follow an SID procedure for the specific runway. The en-route chart contains the airways to be followed by a specific aircraft and is suggested by the pilots and accepted by the ATC. For the descent and an approach for landing, a crew must follow a standard terminal arrival (STAR) and an instrument arrival procedure for the particular runway.
Since air traffic is a dynamic environment, aircraft can affect each other, possibly causing delays and increased fuel consumption. Airports and airspace are systematically correlated. An air transportation network consists of nodes that serve as airports and edges that represent the flight routes, which directly connect two airports [15]. The system comprises airports, airspace, ATC, and communication, navigation, and surveillance systems, which combine to produce a systematic, safe air traffic flow. The air transportation network’s overall performance depends on how two sub-networks interact: the airport infrastructure and the airspace system [16]. When flying in normal air traffic conditions, an aircraft must follow pre-determined routes, maintaining longitudinal, lateral, and vertical separation, as shown in Figure 2.
The separation standards are related to the type of rules for a specific flight; these rules are either instrument flight rules (IFR) or visual flight rules (VFR). As a general rule, on VFR flights, the pilot is responsible for maintaining a safe separation between their aircraft and any other aircraft. In contrast, in an IFR flight, ATC must maintain safety separation between the aircraft. The separation standards depend on the level of service and the type of airspace in which the flights are conducted. ATC capacity depends on the ability of the controllers to process the aircraft flying in a specific area. Therefore, the number of flights flying the same routes can significantly vary due to the controllers’ ability to process flights and because air traffic demand can vary with the time of day.

3. Literature Review

To avoid congestion at the TMA, landing and take-off procedures require an efficient design. [17]. Flight procedures are not just sets of waypoints. They are important entities in the ATFM environment and should be treated as the unit of analysis. Aircraft behaviour monitoring during their performance is important to understand how the procedures are functioning in the airspace [18].
RNAV has proven to be advantageous in a variety of TMAs at multiple airports, expanding airspace capacity and achieving efficiency in aircraft operations [19]. RNAV is also responsible for decreasing the demand for interactions between the pilot and ATC [20,21,22].
Robinson et al. [23] used controller-in-the-loop simulations to analyse RNAV arrival procedures at Philadelphia Airport (PHL). They ran two simulations and only analyses one aircraft type from US Airways. In the first simulation, all aircraft performed conventional procedures. In the second simulation, RNAV routes were assigned to all aircraft. Flight times, aircraft route dispersion, and distances travelled were examined as part of the analysis. The results showed a three percent reduction in distance and a four percent drop in travel time.
Barker et al. [24] also used controller-in-the loop to investigate the consequences associated with mixed TMA operations (RNAV equipped with non-RNAV equipped aircraft). They simulated a flow of 42 aircraft per hour. The results showed that the increasing number of RNAV-equipped planes reduced flying distances by 1.8 nautical miles on average, and reduced communication traffic, fuel consumption and variations in arrival times between aircraft.
Sprong et al. [25] compared RNAV versus conventional arrivals at Las Vegas Airport (LAS). Altitude, arrival interval, and flight time were used as the metrics. Real data from radar were used to generate the metrics, and there was a significant increase in aircraft flight heights in the TMA due to reduced vectoring in RNAV and a pre-programmed vertical profile. This reduced the aircraft fuel consumption. Aircraft experienced decreased lateral track dispersion, indicating that aircraft could fly more predictable and repeatable flight paths. The data also showed no statistically significant difference in airport capacity gain (total throughput) with RNAV compared to conventional procedures, but the standard deviation was lower with RNAV. Flight times and distances could not be compared using the obtained data because of changes in airspace and operations; the authors used simulation modelling instead. The simulation results showed that RNAV procedures reduced the time and distance flown, as well as vectoring.
At Atlanta Airport, Sprong [10] examined RNAVs and conventional standard instrument departures (SIDs). He validated his work using anecdotal data from airlines. Anecdotal data are an informal way to collect data and relies on personal testimony. The article used radar track data from before and after the implementation of PBN SID procedures. Under RNAV, aircraft often climbed out unimpeded, and flight times were reduced.
Mayer [26] investigated RNAV departure procedures for Dallas International Airport. The author used the Monte Carlo modeling approach, together with an ATC simulator, to evaluate the operational benefits. The analyses indicate an efficiency gain of 20 extra movements per hour and an average 1.3-min decrease in delay per departure.
Sprong and Mayer [27] analysed the radar data recorded before and after RNAV employment at arrival procedures for Phoenix Airport. Although the procedures were largely overlaid (conventional and RNAV presented the same horizontal and vertical layout), by combining ATC descent clearances with vertical guidance, continuous arrival descents were considerably increased at the TMA, which resulted in reduced fuel consumption and a 38% decrease in time spent in level flight. In turn, these reductions led to environmental benefits.
RNAV was examined by Timar et al. [28] as a means of reducing metroplex losses. A metroplex consists of multiple airports with a high level of interdependence in air traffic. They use a queuing system-based approach combined with flight trajectory analysis to measure the increase in aircraft throughput. SIDs and STARs implemented with RNAV showed notable improvements in throughput over previous procedures. The results also showed that the indexes vary according to the types of procedure performed. Procedures of the same type—e.g., RNAV SID—showed different gains compared to a specific procedure’s layout.
Simulations were used to analyse flight patterns over Croatian airspace, Novak and Jurkovac [29] exemplified how RNAV helps to increase flight efficiency. In their analysis, they simulated two route scenarios: one using conventional navigation procedures and the other using RNAV. The total number of conflicts in each case is used to measure the increase in air capacity and the decrease in flight delays. Conflicts were correlated with flight volume. Under a conventional scenario with a saturated number of aircraft, a maximum of 43 conflicts were recorded. In contrast, in the second scenario with the same setup, a maximum of four conflicts were observed. The ability of RNAV to create additional fixes or waypoints is considered the main reason for the improvement in the air traffic system.
Since RNAV has been implemented for a longer time, most studies focus on the evaluation of RNAV procedures. There is little research into the benefits of using PBN procedures. Muller et al. [6] report that, when the RNAV and RNP approaches were applied at Sea-Tac, fuel costs were decreased by 40%, but these benefits were only achieved when the routes were optimized. All cases were modelled with a homogenous fleet of Boeing 737-700/800/900s.
Pusateri [4] describes the advantages of RNP-integrated operations between Boston Airport (BOS) and Washington/Reagan Airport (DCA). Terminal Area Route Generation Evaluation and Traffic Simulation Tool (TARGETS) was used to model and run the RNP simulations. The study estimated reductions of 3:45 min on the route connecting DCA to BOS and 4:30 min on the route connecting BOS to DCA per operation. To estimate the benefits of the proposed RNP procedures, an aircraft flying with an operational cost of $75.27 per minute was used. The cost savings per flight were $282 from DCA to BOS and $338 from BOS to DCA.
Belle and Sherry [7] analysed the implementation of RNP at Chicago Airport (MDW). The benefit analysis estimated total potential benefits using the surveillance track, weather and operational data combined with a fuel burn model. The results show a potential average annual savings of 17,600 gallons at MDW.
Our study differs from previous ones for several reasons. Earlier studies concentrated their analysis on the departure phase [9,26], route phase [29], or arrival phase [9,23,24,25,27]. However, this approach does not consider the interaction and correlation of several flight phases. For this reason, we add to the existing body of knowledge by simulating all flight phases. Although Pusateri [4] also measures the benefits for all flight phases, we improve on his work by not restricting the investigation to a single aircraft model.
Previous studies focused only on the implementation of RNAV procedures [9,23,24,25,26,27,28,29], or RNP procedures [4,7]. The present study includes both RNAV and RNP. Although Muller et al. [6] also spotted both procedures, our study was able to capture the effect of the dynamic interaction between aircraft while flying PBN using a fast simulation, and quantified the benefits for several aircraft models.
Most studies focus only on a single airport, such as the studies conducted at the Philadelphia International Airport [23], Las Vegas International Airport [24,25], Atlanta Hartsfield-Jackson International Airport [9], Dallas-Fort Worth International Airport [26], Phoenix Sky Harbor International Airport [27], Seattle-Tacoma Airport [6], Boston Logan International Airport [4] and Chicago Midway airport [7]. Our study captured the effects of PBN at five major Brazilian airports. Together, these five airports account for about 43% of the total Brazilian air traffic, with 91.8 million passengers per year.

4. Modeling of PBN Procedures

This research estimates the benefits of PBN procedures implemented at five major Brazilian airports: São Paulo/Congonhas (SBSP), Campinas (SBKP), São Paulo/Guarulhos (SBGR), Rio de Janeiro/Santos Dumont (SBRJ), and Rio de Janeiro/Galeão (SBGL). The simulation compares the performance metrics of the PBN (RNAV and RNP) procedures with conventional procedures.
Two scenarios were explored in our research. Case 1 simulated an aircraft flying an established airline route in isolation and measured the minimum fuel consumption. In Case 2, an aircraft flies a typical day and experiences normal air traffic interaction with other aircraft. In Case 2, the simulation was built using the dataset for departing and arriving flights, and the route plan included the aircraft using the five studied airports and the aircraft passing through the studied airspace. In the studied airspace, there were about 4000 commercial flights per day. This research investigated whether the benefits gained in the isolated Case 1 were still achieved in the normal scenario in Case 2. For Case 1 and Case 2, all RNP approach procedures are of the RNP AR type.
For this research, we used the datasets provided by the Brazilian National Agency for Civil Aviation and the Brazilian Department of Airspace Control. For the simulation analysis, we used Jeppesen’s Total Airspace and Airport Modeler (TAAM) software. TAAM simulates in fast-time the operations of airspace and airports [30]. Before running the fast-time simulation, we built the air traffic scenario and the flight schedule. Finally, we analysed all the results.

4.1. TAAM Model

Although TAAM is a fast-time simulator for air traffic analysis, we needed to build the simulated scenarios in the software. 
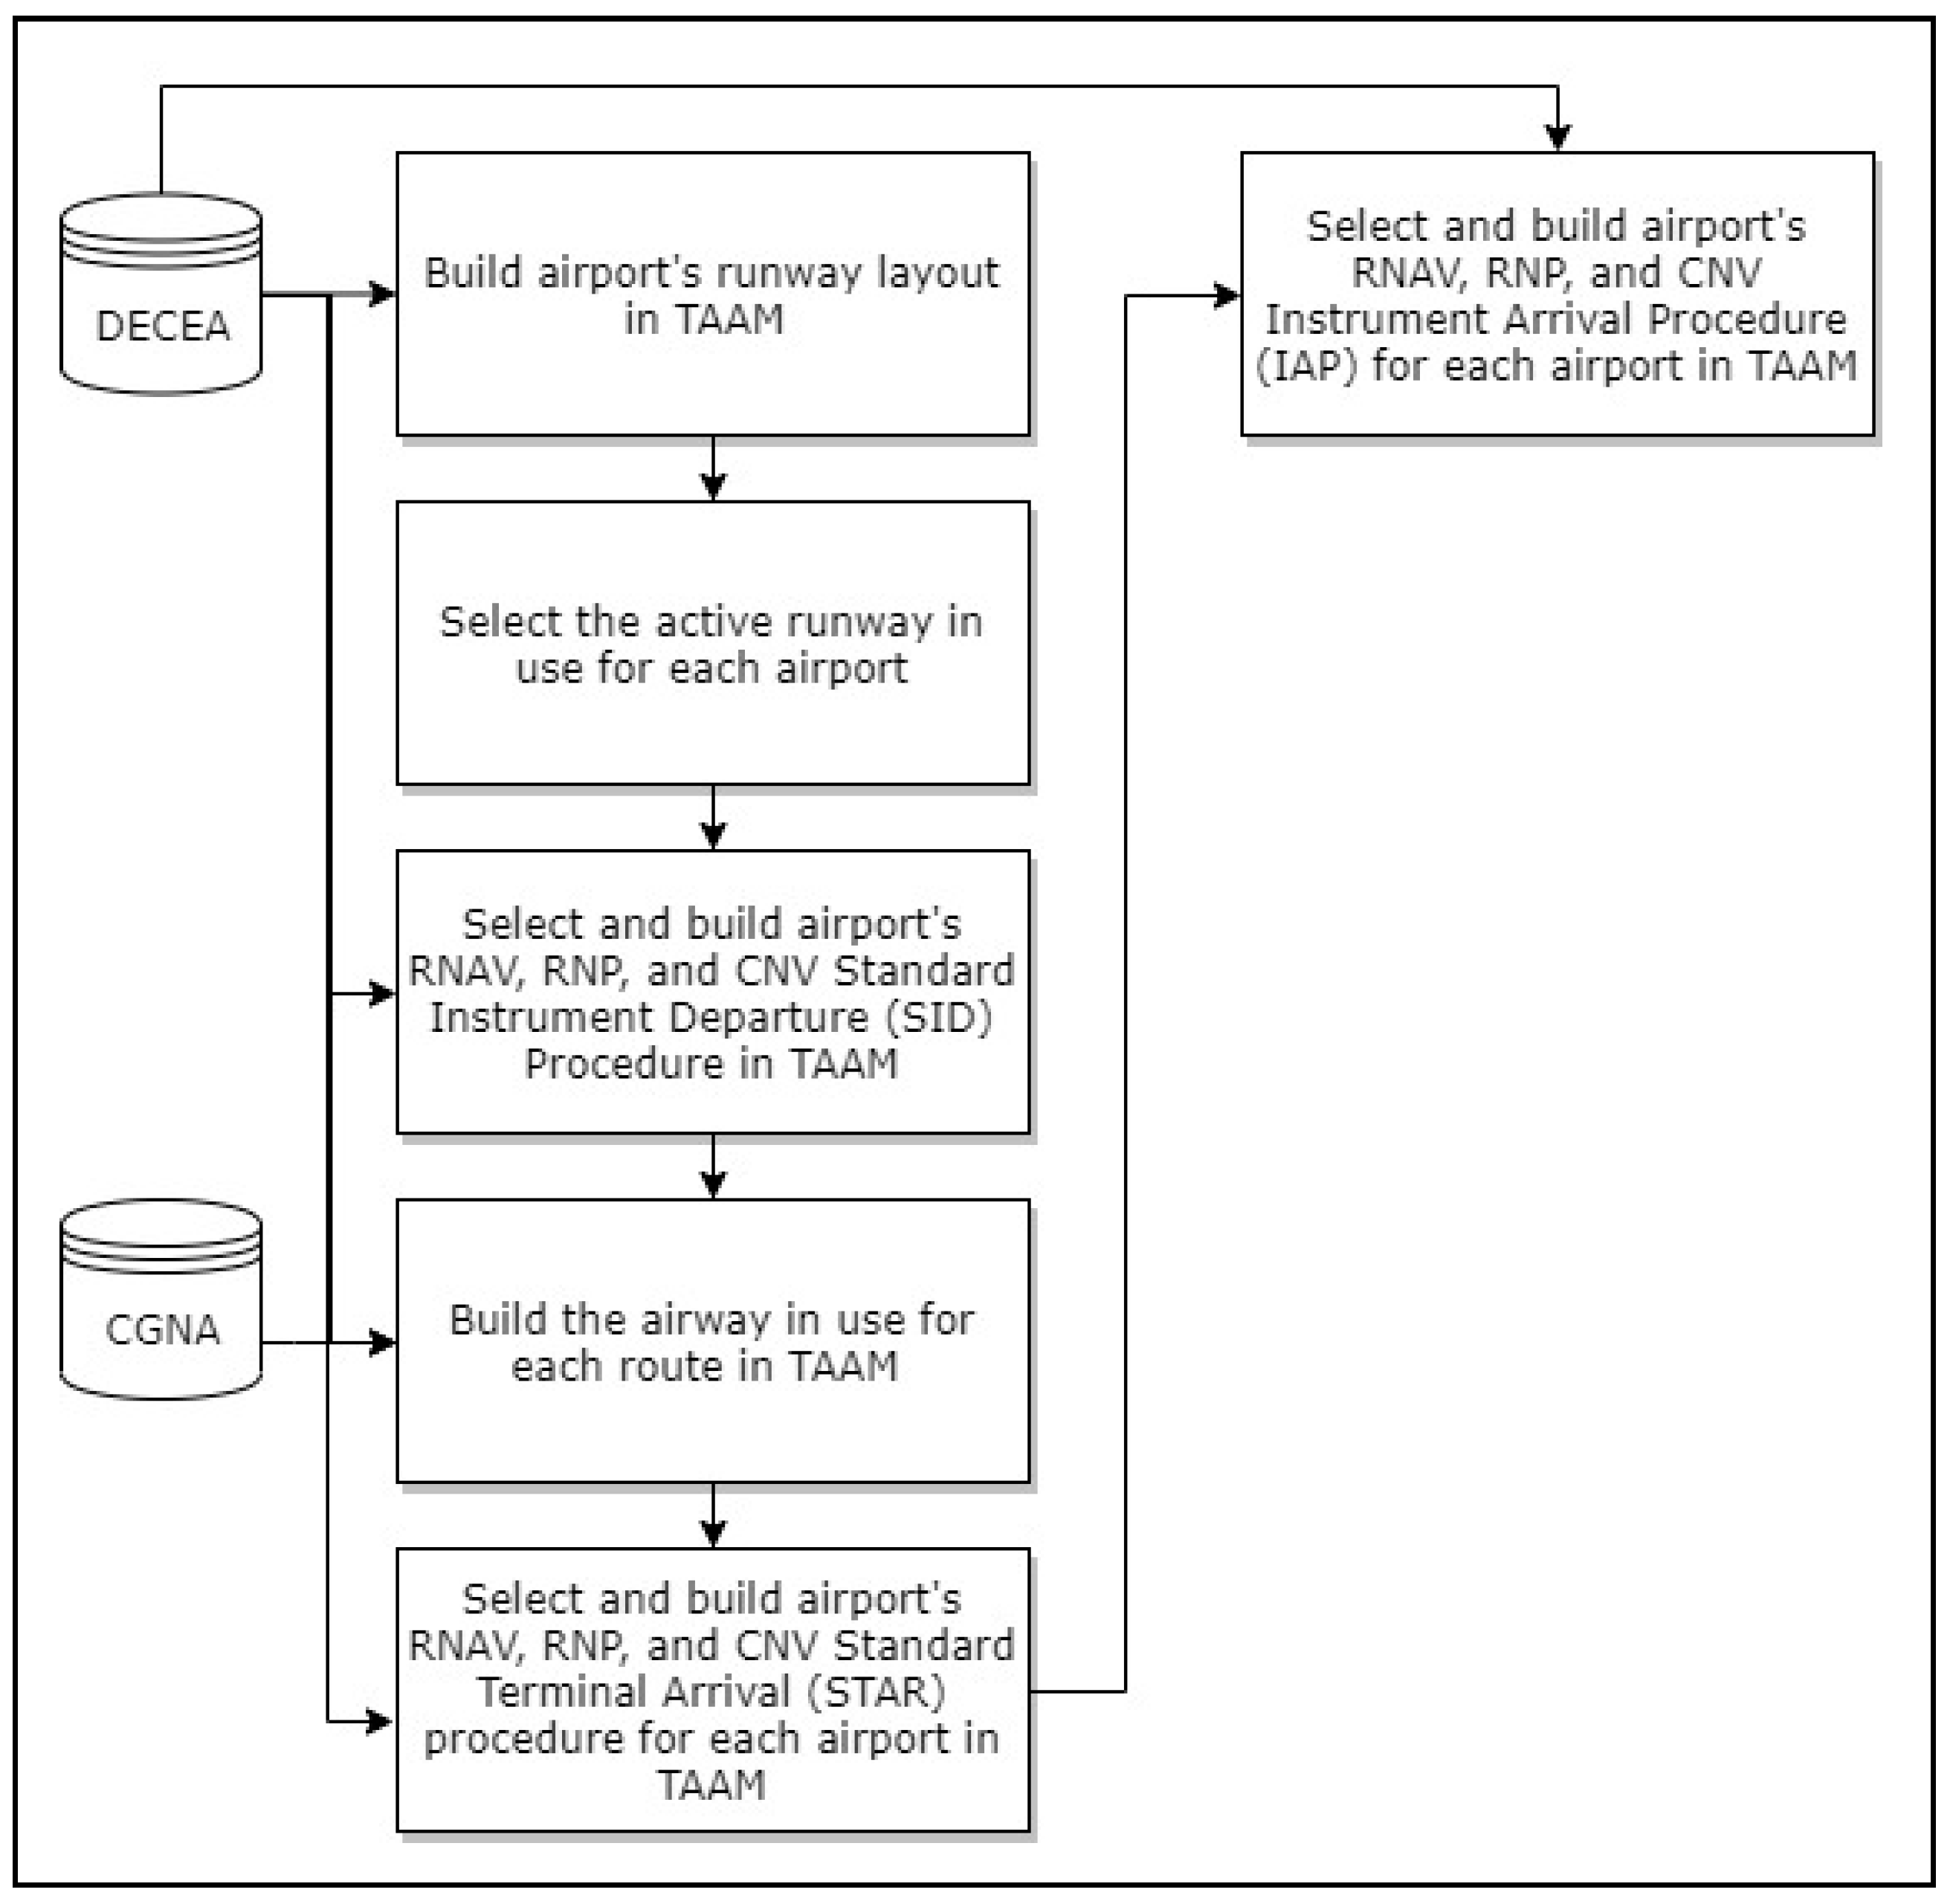
Figure 3 presents the flow chart used to build the TAAM scenario.
First, we constructed airport runways. Since we did not investigate the effect of airport congestion on the ground (taxiways and aprons), the simulation began and ended at the runways. The simulation process started at the selected runway and the aircraft acceleration for take-off. For each runway at an airport, there are two possible flight directions for aircraft operations. The scenario considers 12 routes that link the five airports. Even though there are about 20 possible routes, the routes between Rio de Janeiro/Galeão and Santos Dumont were not considered in this research because the two airports are very close and traffic between them is almost non-existent. The maximum distance between the airports in the study is 387 km. For each route and selected runway, we chose the SID, STAR, and IAC procedures. Then, we implemented these procedures in TAAM. To select the airways, we used the repetitive flight plans provided by the Brazilian Air Navigation Management Center—referred to as CGNA in Figure 3.

4.2. Flight Schedule

A total of 10 aircraft types were considered: ATR (ATR72), Boeing (B737-300, B737-700, B737-800), Airbus (A319, A320, A321), Fokker (F100), and Embraer (E145, E190). We built two different timetables. For Case 1, since each aircraft flies in isolation, we scheduled each aircraft to start and finish its simulated flight before encountering another aircraft. For Case 2, where a whole system is simulated, the departure times and respective origins and destinations were based on the Brazilian Air Transport Schedule database of a busy weekday. Times were converted to GMT standard time. The air traffic routes, aircraft model, and flight levels were based on the Brazilian repetitive flight plan database. For this reason, only aircraft in the medium category were included in the analysis of the results. Furthermore, it was assumed that, during a specific simulation, all aircraft and crews were qualified to operate the air navigation procedures; and all the NAVAID infrastructure required for a procedure was available.

4.3. Analysis of the Simulation Results

Flight time and distance are considered classic metrics, and lower values of these metrics indicate better results [25]. This work considers fuel burn and flight time to determine which procedure minimizes the costs of each type of aircraft flying a specific route. Case 1 obtains the best results regarding fuel burn. Comparing Case 1 to Case 2, we determined the inefficiencies of congested air traffic systems that had a PBN procedure and those that had a conventional one. To evaluate fuel consumption, TAAM uses the Base of Aircraft Data (BADA) to obtain the fuel consumption of each airplane. BADA is EUROCONTROL’s aircraft performance model.
During the study, the TAAM “aircraft performance randomization” function was disabled, and the mass levels were set as nominal to ensure that, when performing the flight procedures to be compared (RNP, RNAV, and conventional), a specific aircraft model maintains the same parameters, such as maximum take-off weight, departure time, descent start point, and landing touch point.
For instance, consider a situation in which we would like to examine the efficiency of a B737-700 performing a RNAV, RNP, or a conventional procedure on the route between SBGR and SBGL. We will need to run three simulations (one for each procedure type). Since the “aircraft performance randomization” function is disabled, all the performance parameters will be the same for the B737-700 during the three simulation runs. All the flight’s duration and fuel used differences will be connected to the aircraft performance during a determined flight procedure (RNP, RNAV, and conventional).
As the two parameters were adjusted for all aircraft, the differences in flight duration and fuel consumption between aircraft types performing the same flight procedure are linked to the aerodynamic and performance characteristics of a specific aircraft.
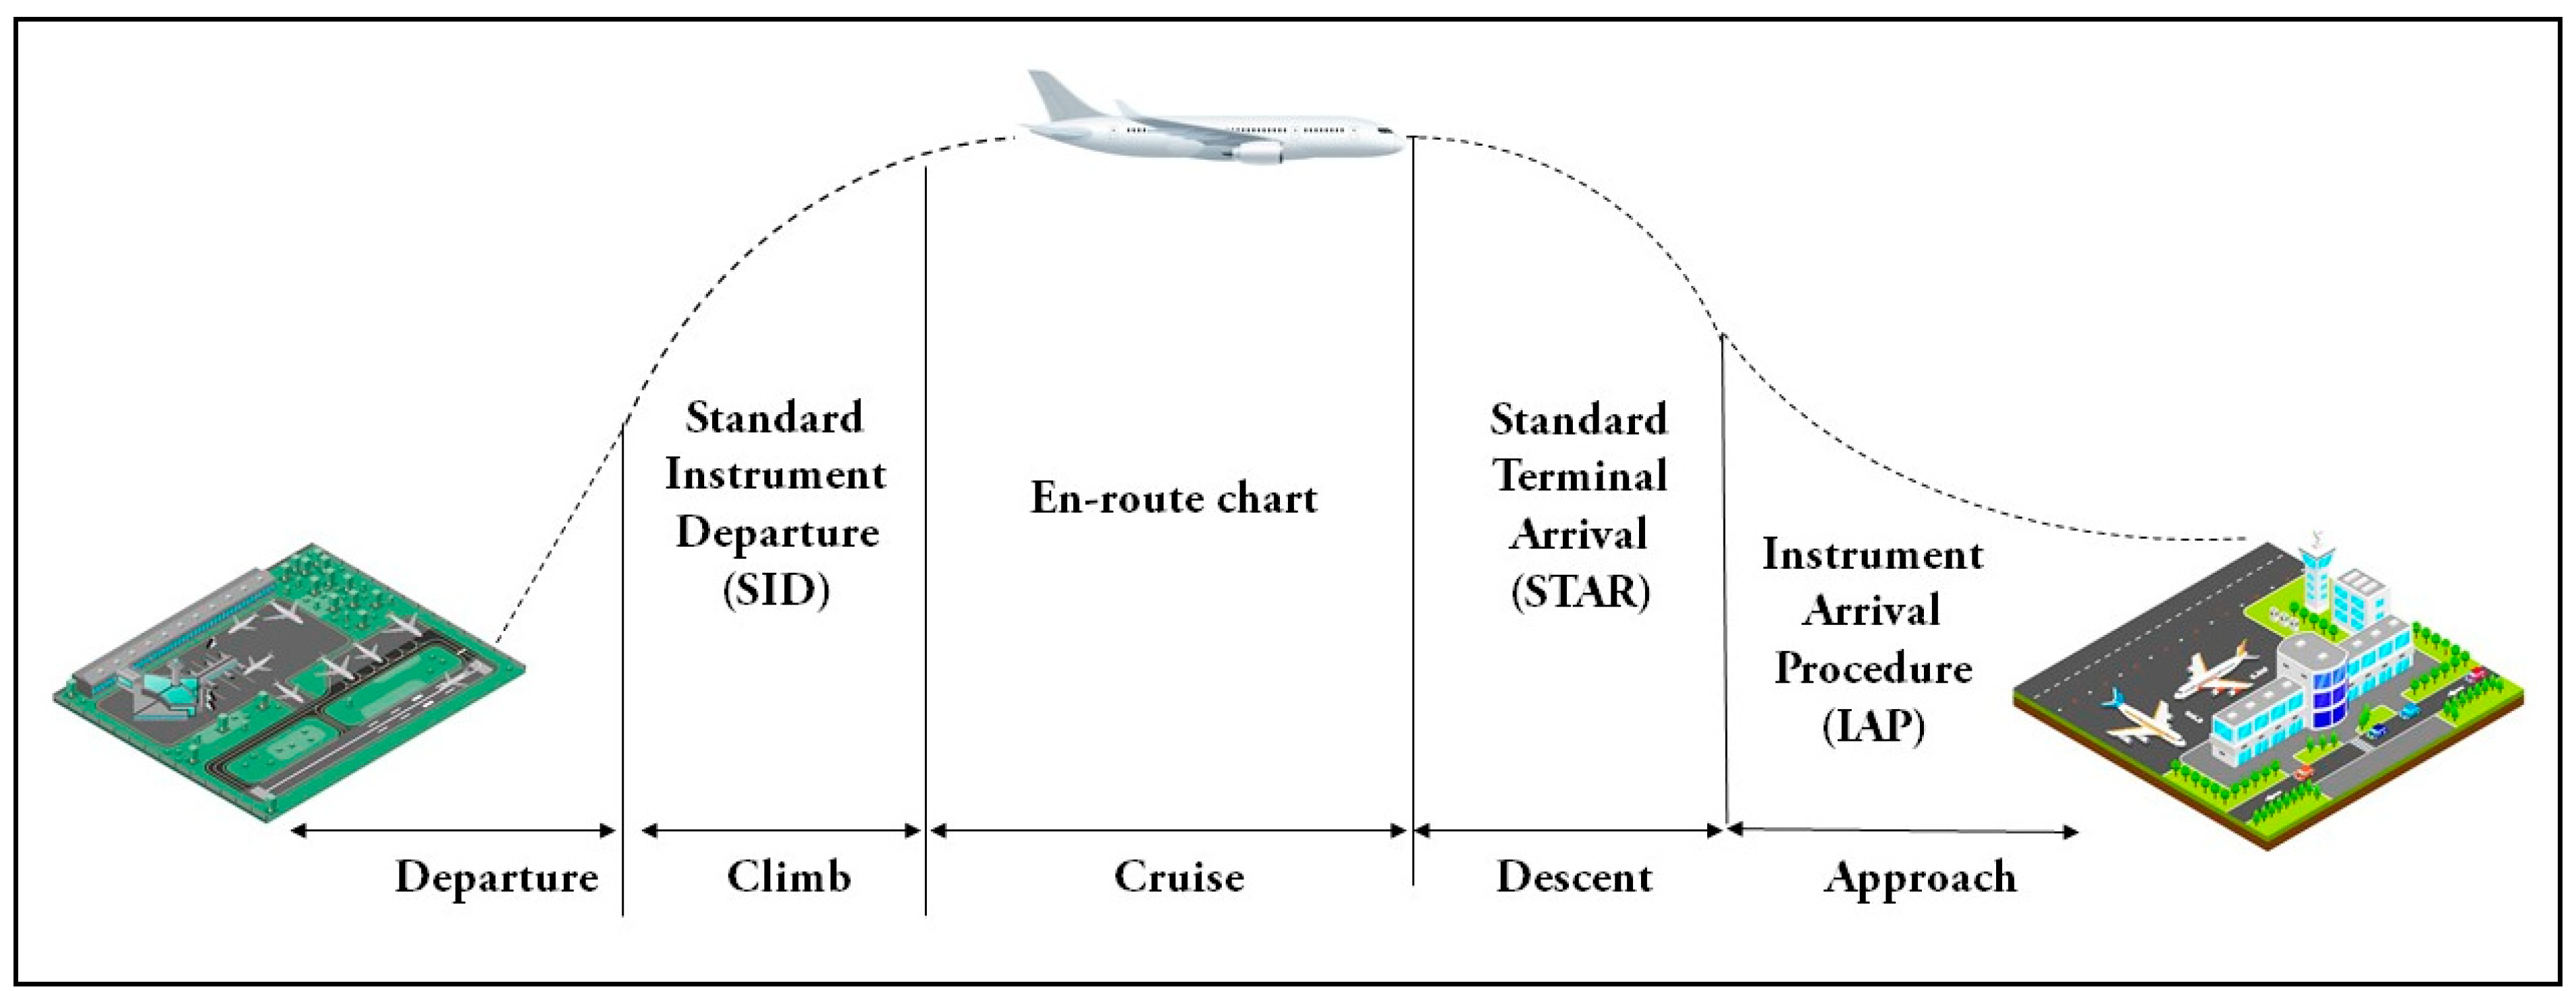
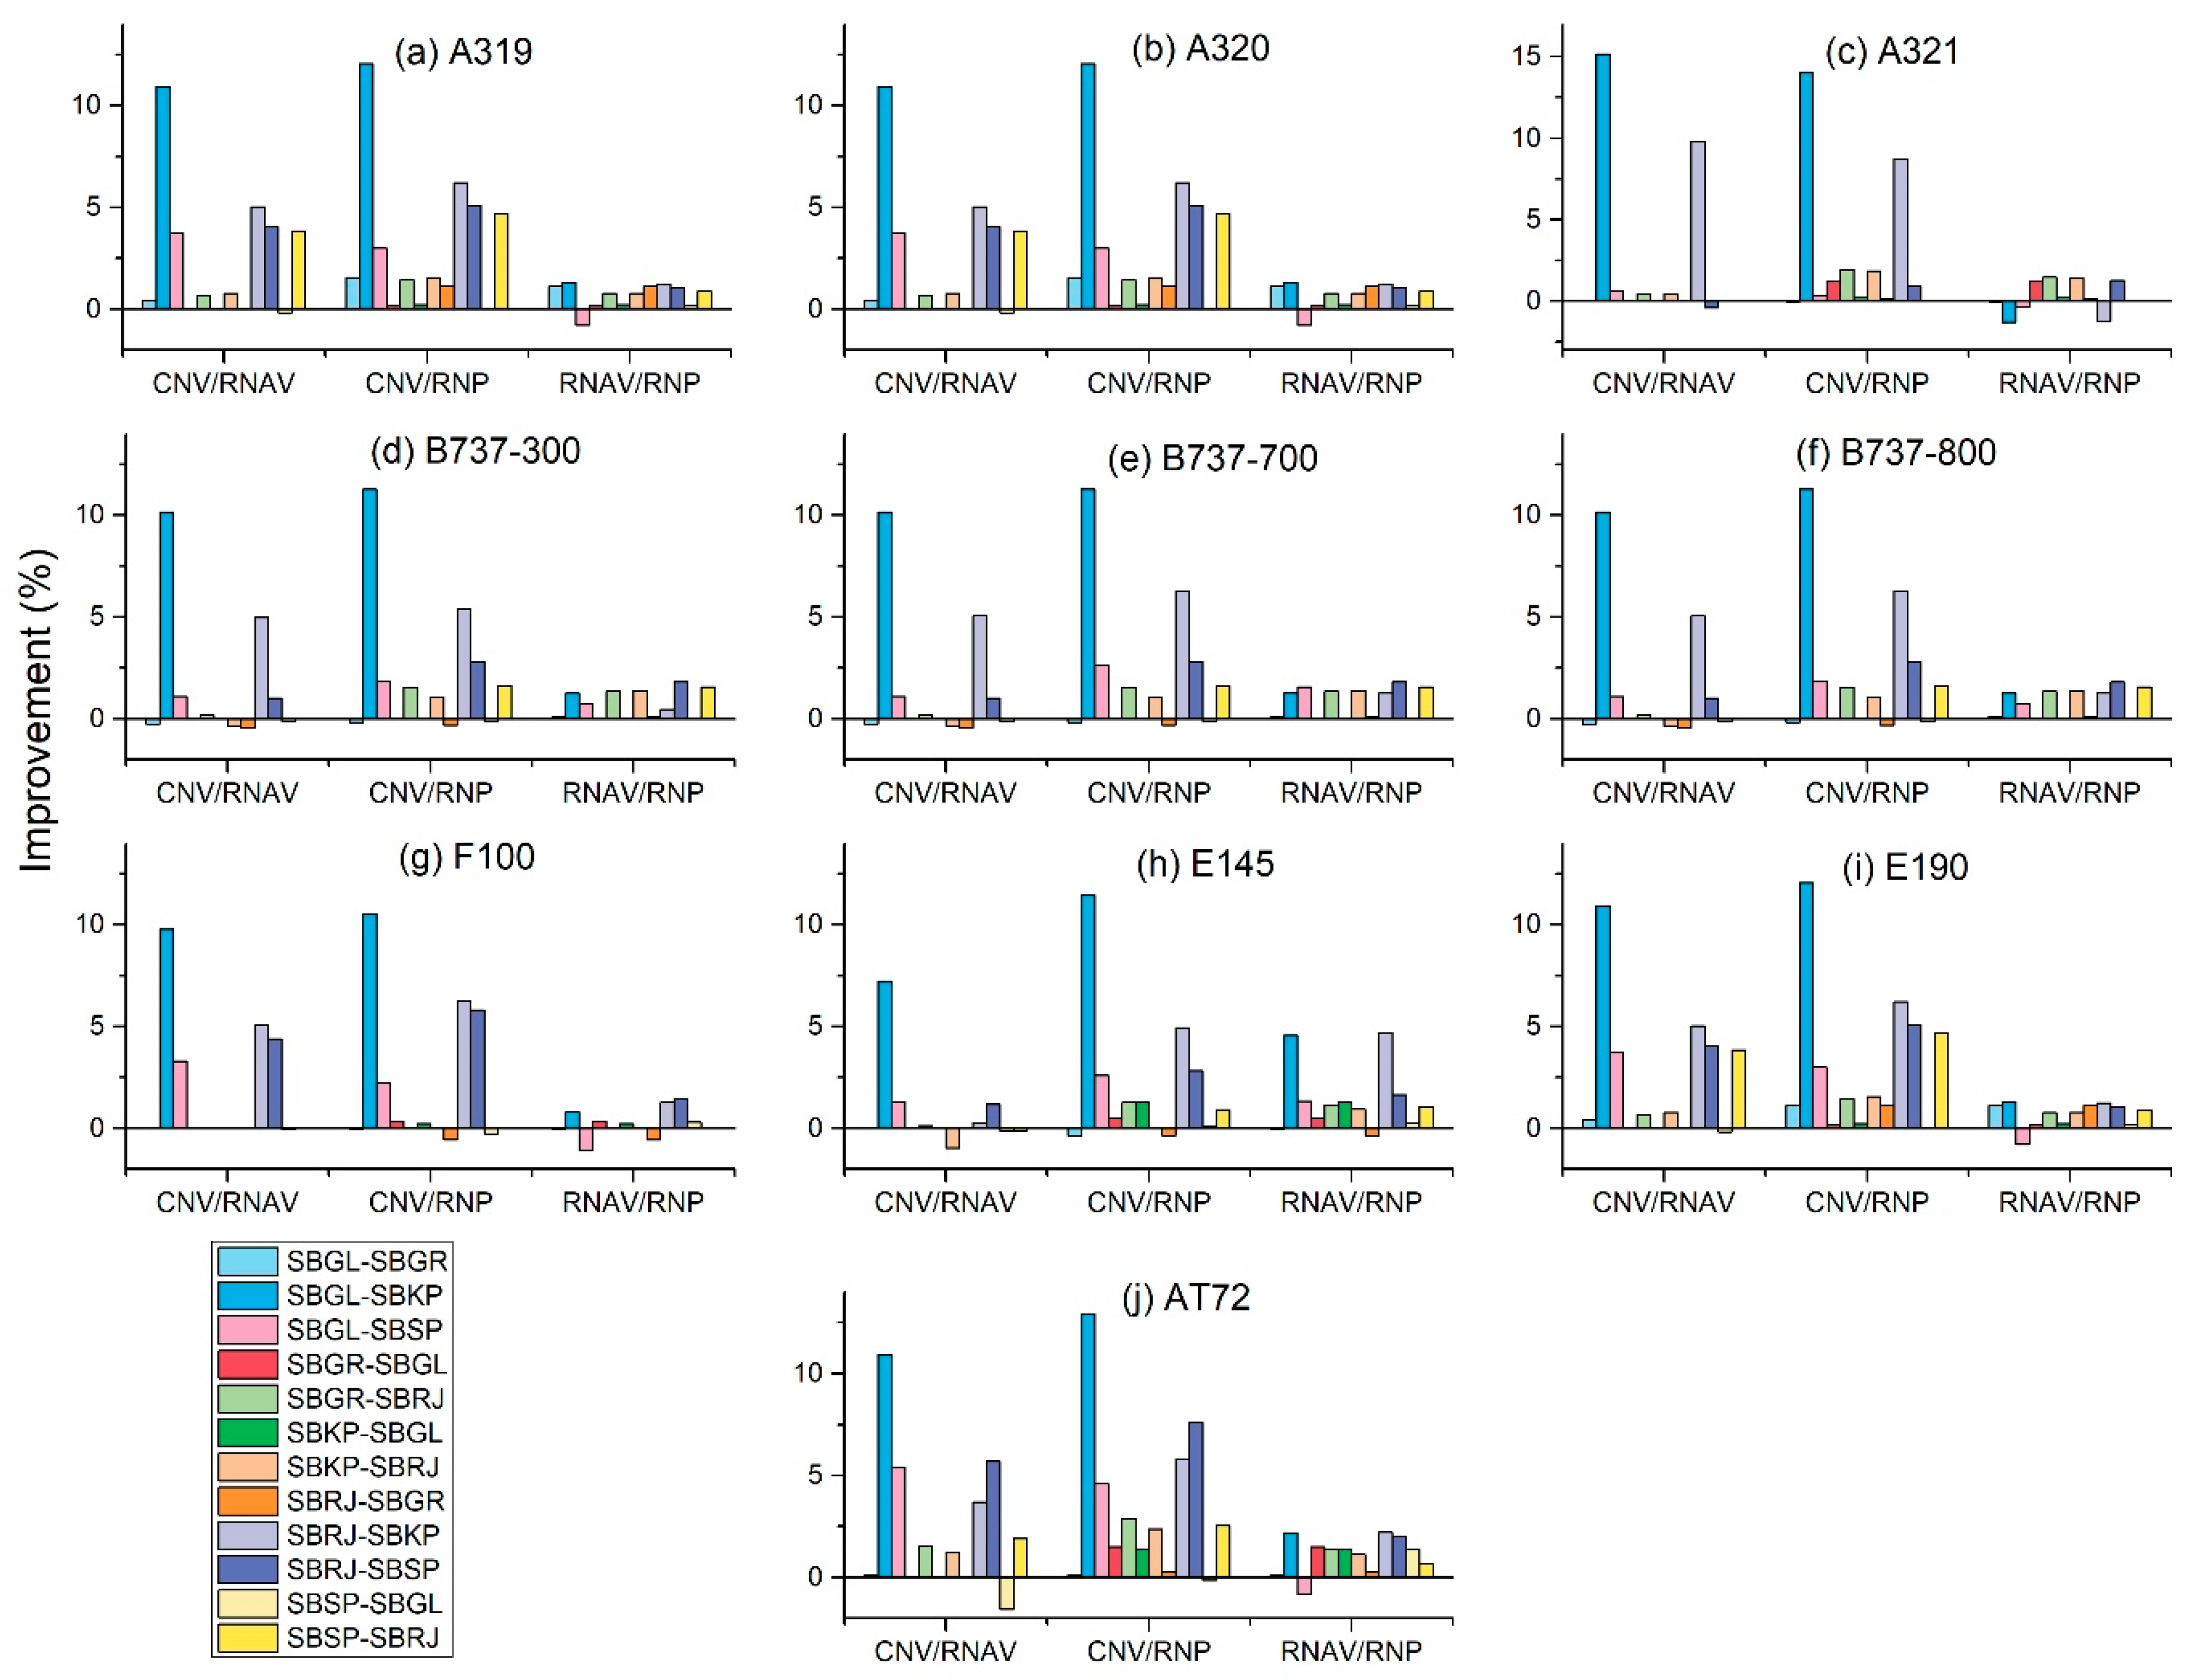
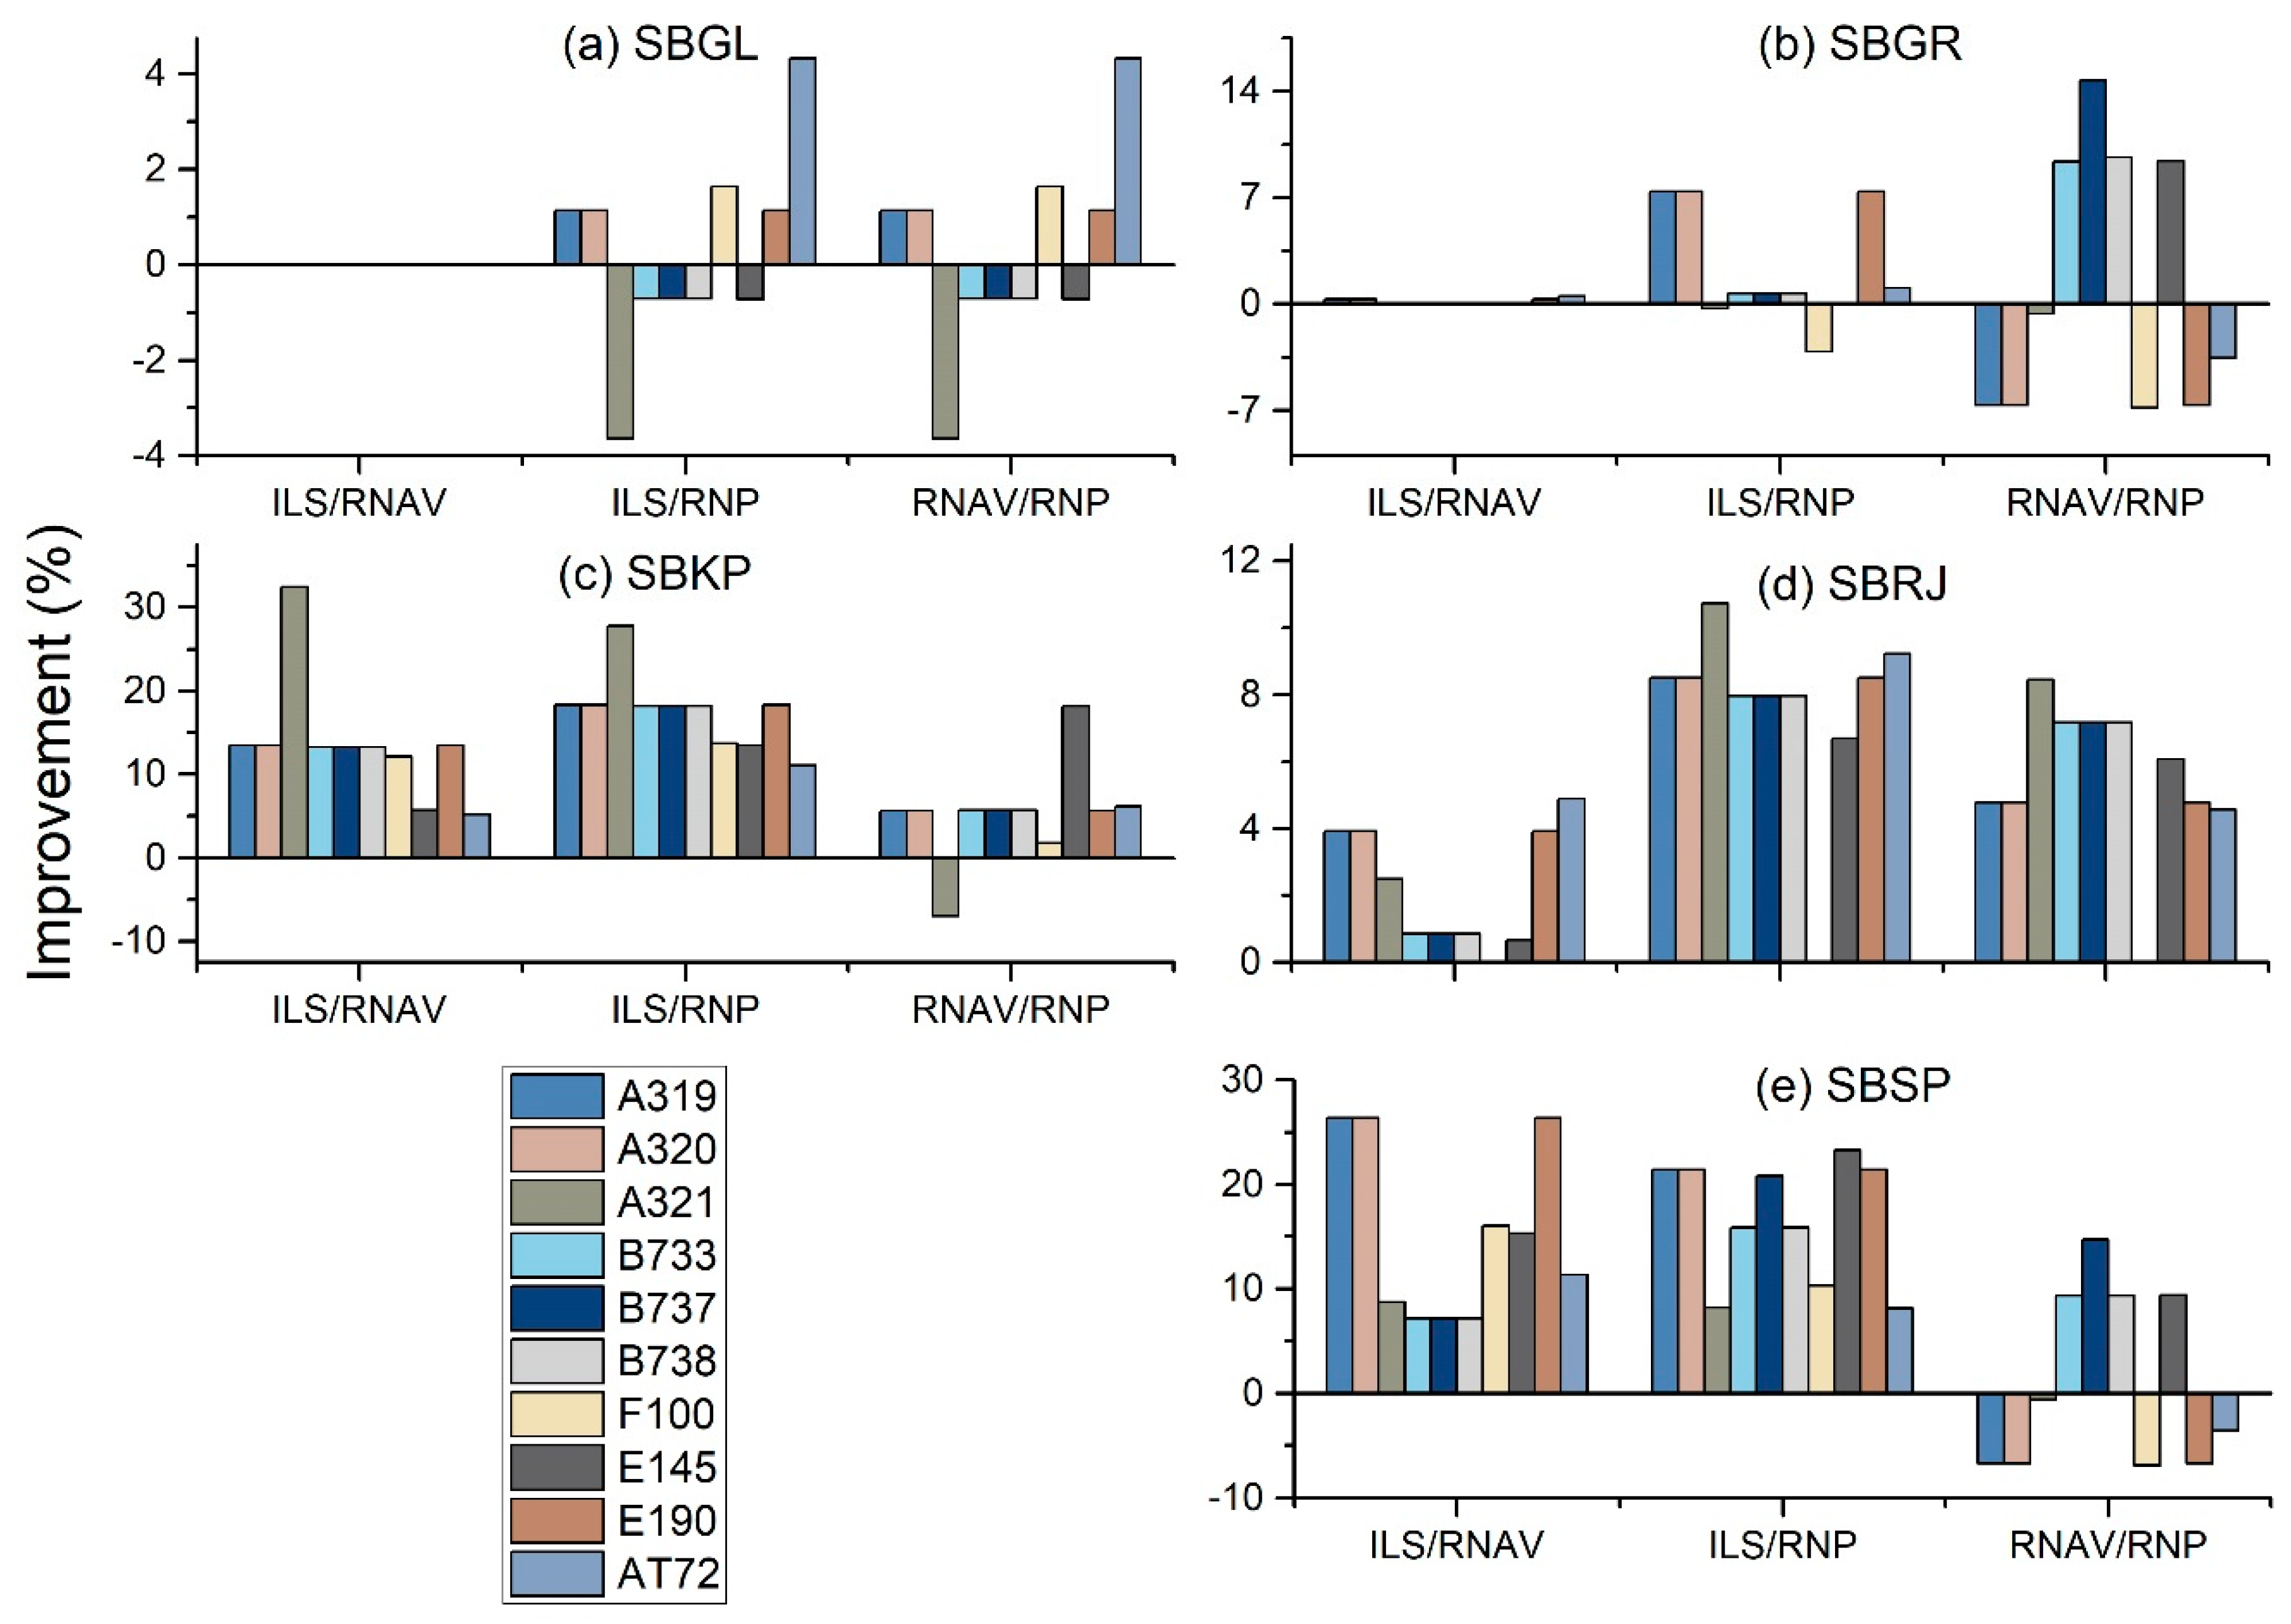
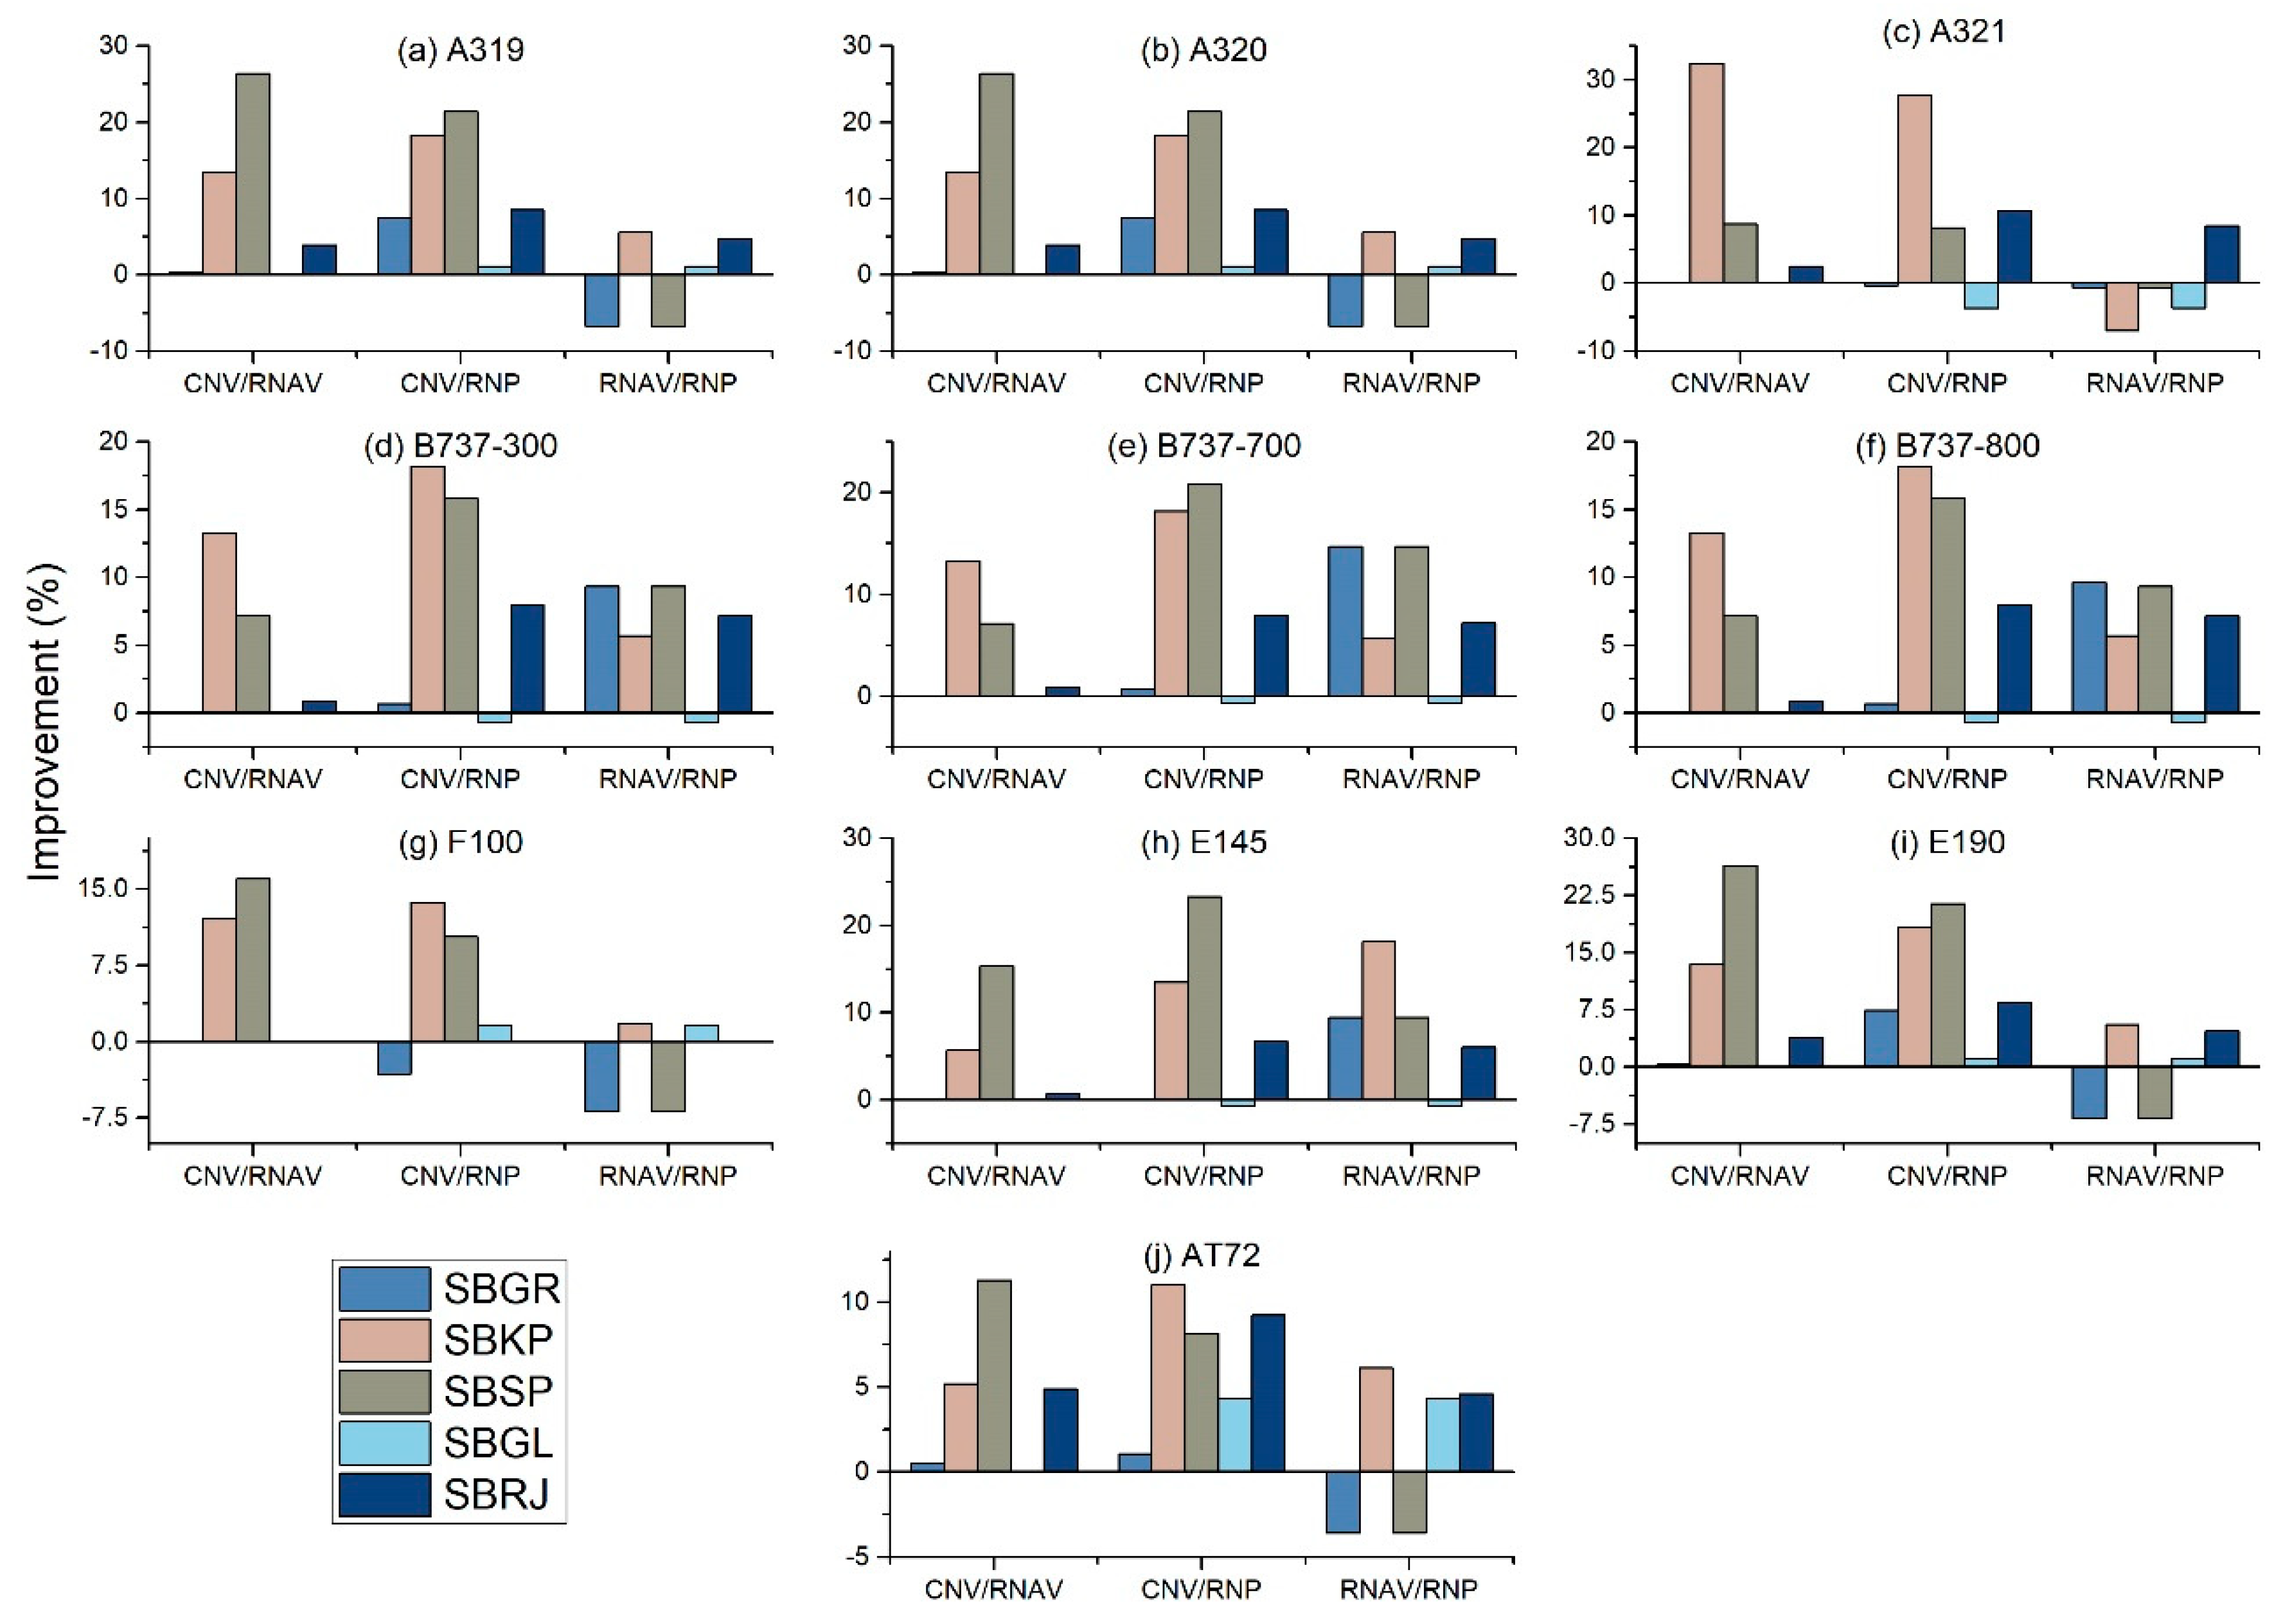
The results were measured in terms of percentage of improvement from the sum of all flight phases that the simulated flight must follow (Figure 1). We used Equation (1) to calculate the gains from one procedure compared to another procedure:
Gain   Procedure   A Procedure   B   % = ( flight   phases Procedure   A flight   phases Procedure   B ) flight   phases Procedure   A × 100  
where A and B can be PBN (RNP or RNAV) or conventional procedures.
In addition to the metric presented at Equation (1), researchers used other metrics, such as the ratio between the total distance flown and the direct distance of a given flight [31]. Studies of this type compare the observed distances (radar data analysis) with theoretical estimates (great circle distance). Due to the unavailability of this type of information for the present study, we chose to use the metric provided in Equation (1).

5. Case Studies and Analysis of the Results

5.1. Case 1—Ideal Scenario: No Air Traffic Congestion

The results for Case 1 showed that the PBN procedures must be analysed separately for each airport. Furthermore, each airport had a different pattern of flight procedures, and each aircraft behaved differently when performing the procedures. The Fokker 100 model was unable to land at SBRJ, and the model A321 was not able to take-off from SBSP because of the incompatible aircraft performance and runway characteristics. For Case 1, the fuel consumption analysis was divided into the route-level and arrival procedure-level.

5.1.1. Route-Level Analysis

Figure 4 and Figure 5 present route-level results. In Figure 4, the results are displayed by route and in Figure 5 the same results are shown by aircraft. The absence of representation means that there was no difference in fuel consumption between the procedures.
After the air traffic simulation model was constructed and run in TAAM, Equation (1) was used to calculate the percentage gains from one procedure compared to another procedure. When analysing the route connecting two airports, for each aircraft, three analyses were carried out. First, we compared the gains for the aircraft flying a conventional or a RNAV procedure, represented by (conventional/RNAV). Then, we compared the aircraft flying a conventional and an RNP procedure, represented by (conventional/RNP). Finally, we compared the aircraft flying an RNAV and RNP procedure, represented by (RNAV/RNP). Positive results show that the second procedure in the comparison had a lower total fuel consumption than the first. Negative results indicate that the first procedure was more economical.
When evaluating the procedures that provided the highest benefits, 76% of these procedures were RNP, 6% were RNAV, and 18% of the PBN or the conventional ones presented the same fuel consumption. PBN showed improvements, which shows the importance of the PBN approaches.
The RNAV procedures presented no benefits in some cases due to procedure overlaps. A procedure overlap is defined as an RNAV/RNP procedure, originally designed using conventional procedure standards where navigation points and aids are substituted for an RNAV/RNP database. We used a geographic information system (GIS) software to insert all the procedures’ waypoints and analyse the procedures for possible overlaps. For example, for the simulated route connecting SBGL and SBGR, all the flight phases have an associated instrument procedure, which can be RNAV, RNP, or a conventional procedure. Our study showed that, for this specific route, there were four pairs of overlaid procedure.
For all the analysed routes in the study, lateral overlaps were observed for the RNAV and conventional procedures in 50% of SID, 66.67% of the routes, 66.67% of STAR, and 79.5% of Instrument Approach Chart (IAC) procedures. Lateral overlay was not observed in RNP due to its specific modelling characteristics. These results are in accordance with the findings of Muller et al. [6]. Cost is the main reason for lateral overlay. When a procedure is designed, the air traffic authority must validate the scenario and the operation, which generally includes real flight trials. Using a validated scenario for conventional procedures can save the authorities time and money [6].
Comparing RNP and RNAV routes with conventional routes, about 86.67% and 82.5% of the RNP and RNAV routes, respectively, had higher savings. Moreover, about 20% and 15.84% of the RNP and RNAV routes, respectively, had gains above 5% compared with conventional routes. A few routes showed higher savings using the conventional approach compared to RNAV because there was a need to apply altitude restrictions to these routes, which reduced the savings that could be obtained by applying RNAV procedures.

5.1.2. Arrival Procedure-Level Analysis

Fuel consumption for the arrival procedures was evaluated using the TAAM software, as shown in Figure 6 and Figure 7. In Figure 6, the results are displayed by airport, and in Figure 7, the same results are shown by aircraft.
About 76.67% of RNP approaches had higher savings compared to the savings using RNAV procedures. Further, 43.34% of RNP approaches had savings higher than 5% compared with RNAV. In addition, comparing RNP and RNAV approaches with conventional, 86.66% and 94.16% of RNP and RNAV approaches, respectively, had higher savings than conventional savings. However, again, the conventional approach achieved higher savings on a few routes, mainly due to altitude restrictions.
The fuel consumption results showed the importance of measuring the PBN benefits of each individual aircraft model, considering their characteristics. These characteristics include the performance and the vertical and lateral profiles of the procedure per designed instrument approach. Each aircraft presented differing performance metrics per route, and, on some routes, a single vertical boundary differentiation changed the total fuel consumption.

5.2. Case 2—Normal Air Traffic Scenario

In this section, the simulation results are evaluated to determine whether the gains obtained in Case 1 will be maintained when the aircraft are in a normal air traffic situation. As shown in Table 1, the results of Case 2 indicate increased fuel consumption and/or total flight time compared to Case 1. Nevertheless, the results could still be considered quite reasonable, since the worst losses were never higher than 15%. The worst results for the fuel consumption loss (12.59% and 14.54%) were obtained for the routes between SBKP and SBGL. A possible explanation for these results is that this route is the longest one in the study.
This loss of efficiency is due to the measures used to maintain a safe, three-dimensional distance between the aircraft. The measures used to avoid collision include decreasing aircraft speed and implementing holding procedures, applied for sequencing. Therefore, these measures usually increase flight time and fuel consumption.
There is great variability in flight time and fuel consumption for an aircraft flying the same route because air traffic congestion can vary depending on the time of day (Figure 8). Since there can be a significant number of aircraft flying in the same airspace, ATC applies minimum separation measures for safety.
Figure 8 shows a variability difference for the flight time and fuel consumption on the same route. The average fuel gains were higher than the average flight-time gains. Muller, et al. [6] explain that, despite the fact that the duration of a flight is a major factor influencing how much fuel is used on a flight, total fuel consumption is influenced by a number of other factors, such as aircraft thrust, altitude, and weight. As a result, overall fuel consumption varies.
Real traffic data from the repetitive flight plans were studied to analyse Case 2: how the Brazilian commercial aviation routes are structured and if they differ from the real routes flown by the airlines. The Brazilian commercial aviation system has a total of 712 routes, and 646 of the routes used by the airlines show no difference compared with the ones in the repetitive flight plans. Therefore, about 9% of aircraft fly different routes from the registered ones, possibly resulting in more bottlenecks and congestion. A simulation was performed to obtain a heat map (Figure 9).
Figure 9 shows that the Rio de Janeiro and São Paulo terminal areas have the highest air traffic volume. It also shows the location of the main bottlenecks in the Brazilian air sector. These airspace bottlenecks result in increased congestion.
The last analysis evaluates the average savings per flight, obtained when all aircraft fly the same type of procedure for a determined route. Positive results show that the second procedure in the comparison had a lower total fuel consumption than the first. Negative results indicate that the first procedure was more beneficial. This analysis assumes that 1 kilo of jet fuel is worth US$1.00 [32]. Figure 10 shows the average daily savings in dollars per flight by route.
In all studied routes, PBN procedures (RNP or RNAV) are the most economical, and the average evaluated savings are about US$270.92 dollars per flight. Muller et al. [6] note that the evaluation of potential fuel and monetary savings could aid stakeholders in decisions about the implementation of RNAV/RNP procedures. The results agree with the International Civil Aviation Organization [3] study stating that PBN procedures allow for the airspace to be utilized more efficiently since an air traffic planner does not need to rely on ground aids to implement a navigation procedure.

6. Conclusions

Flight inefficiency remains a contributing factor to airline costs and passenger dissatisfaction. This reality highlights the need to mitigate this, and modernize the national airspace worldwide. One of the proposed solutions is the implementation of PBN procedures.
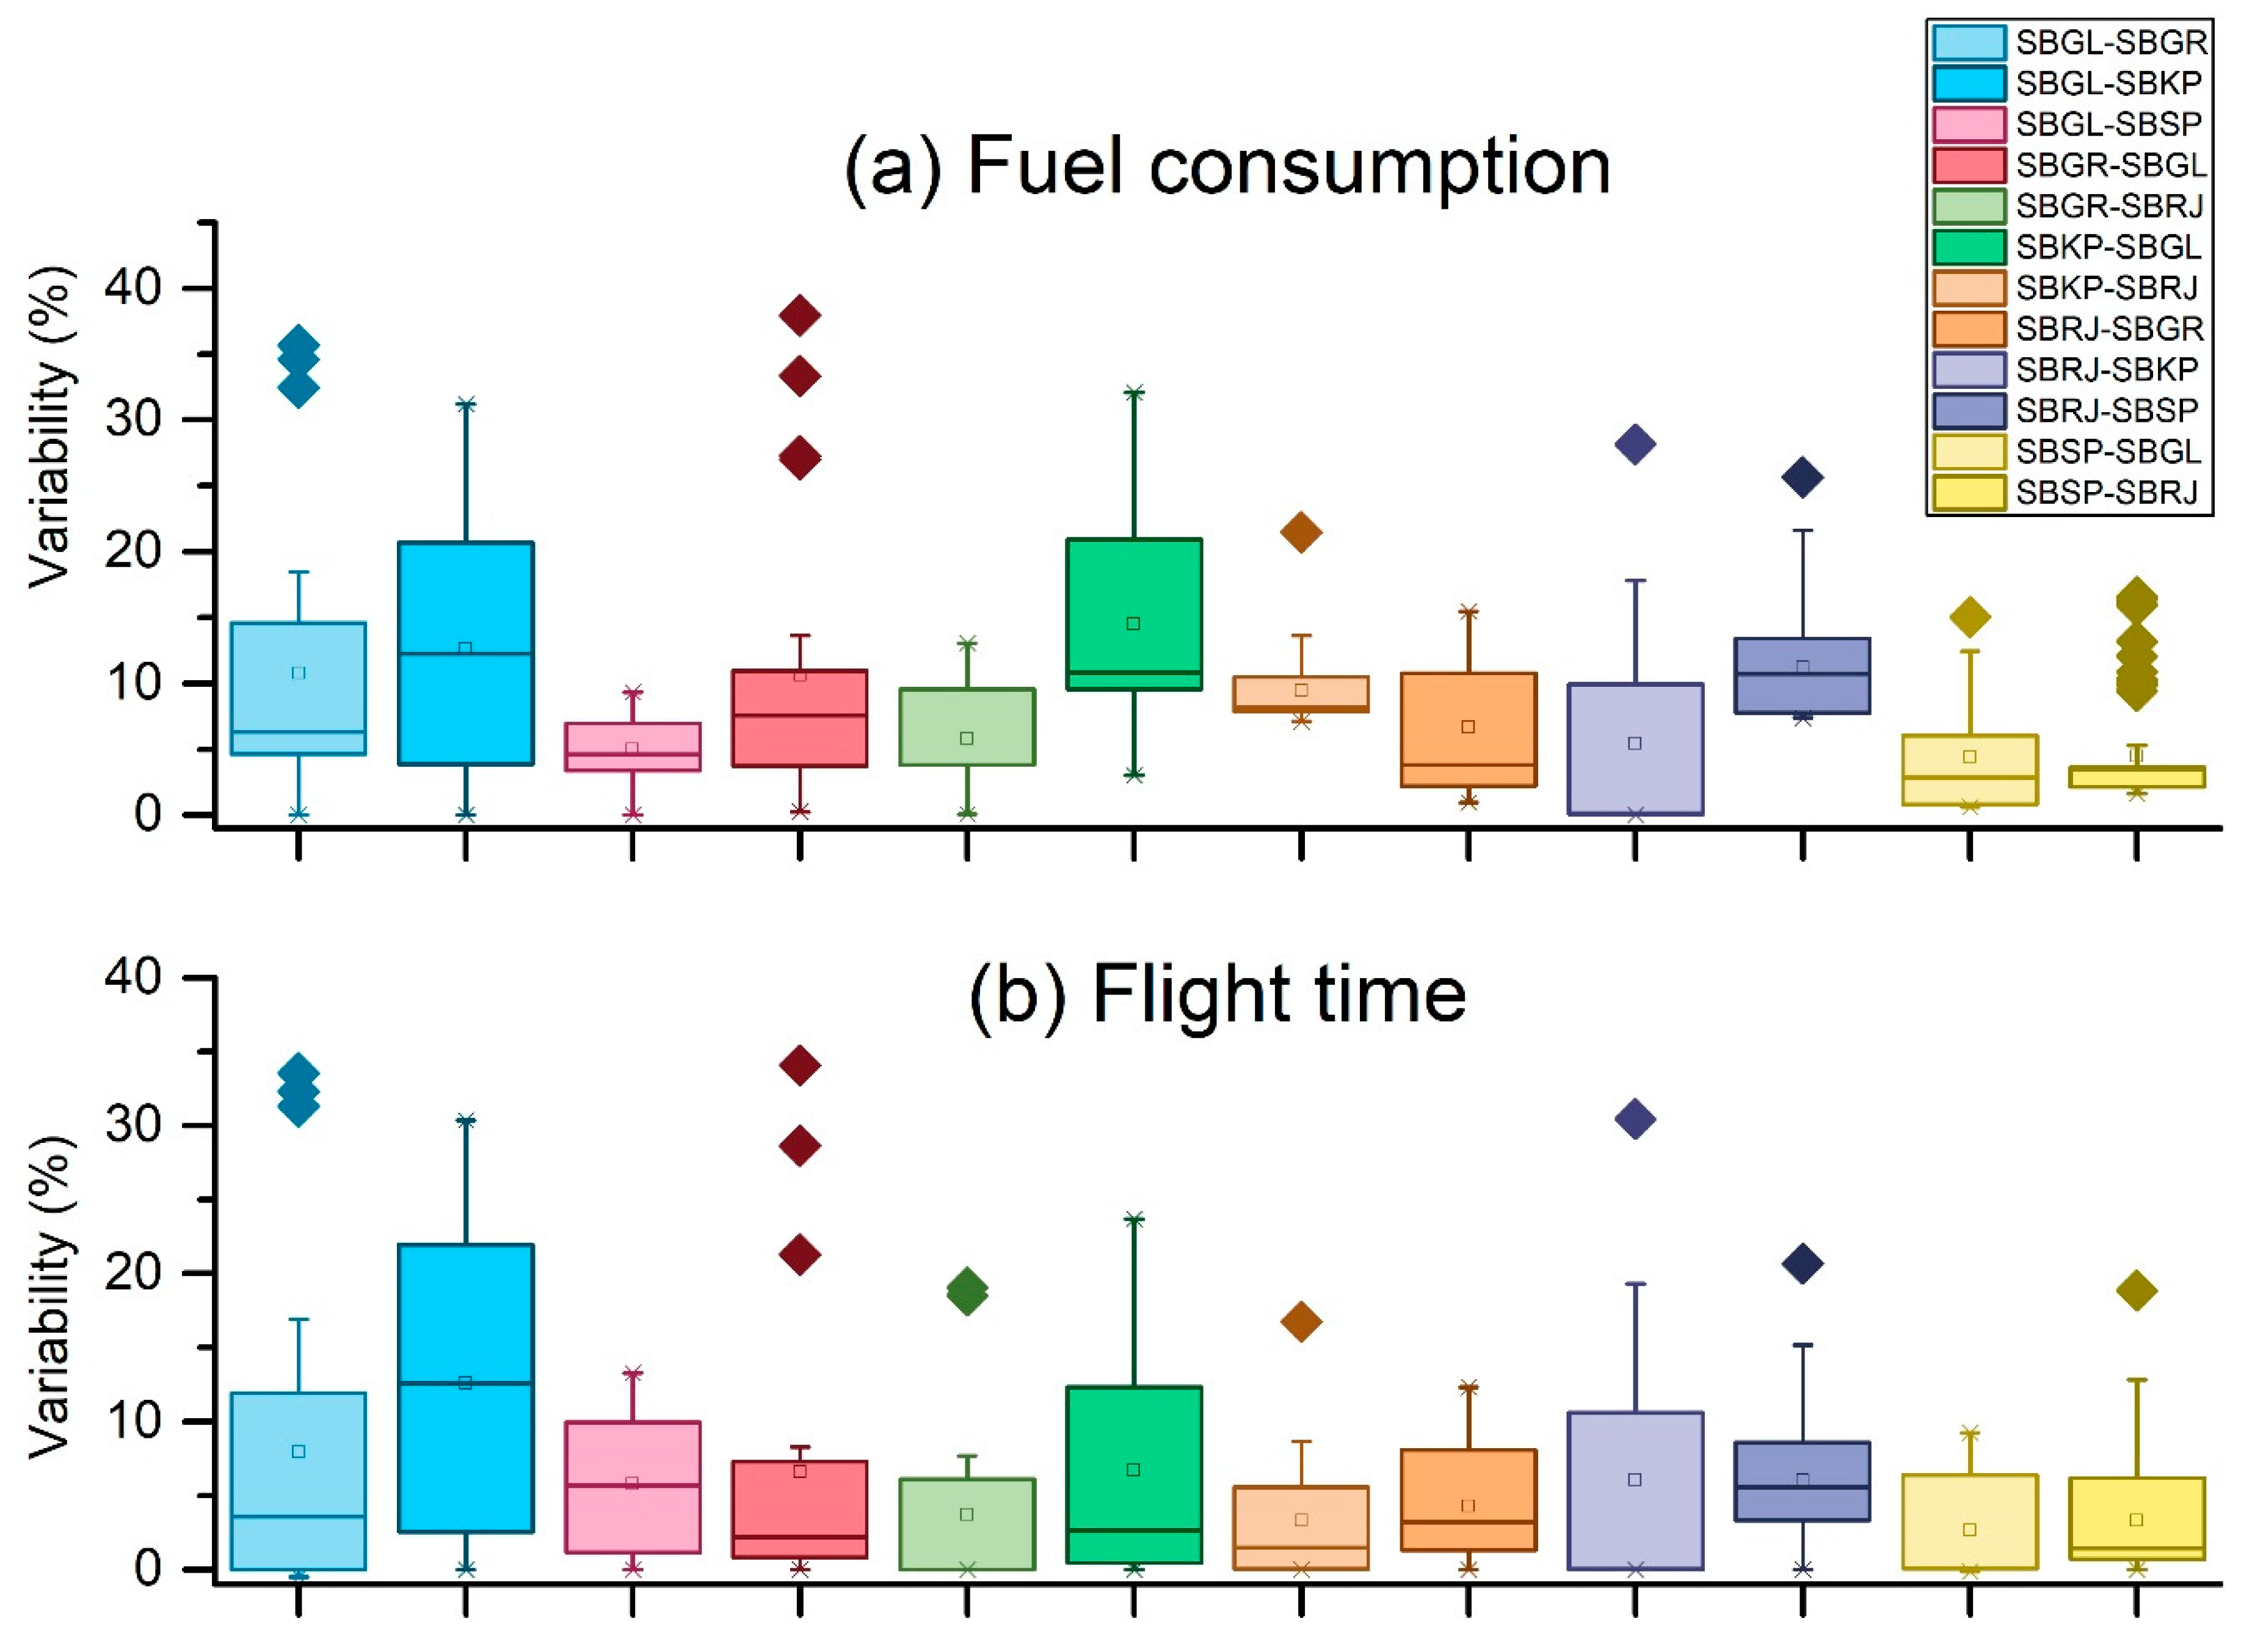
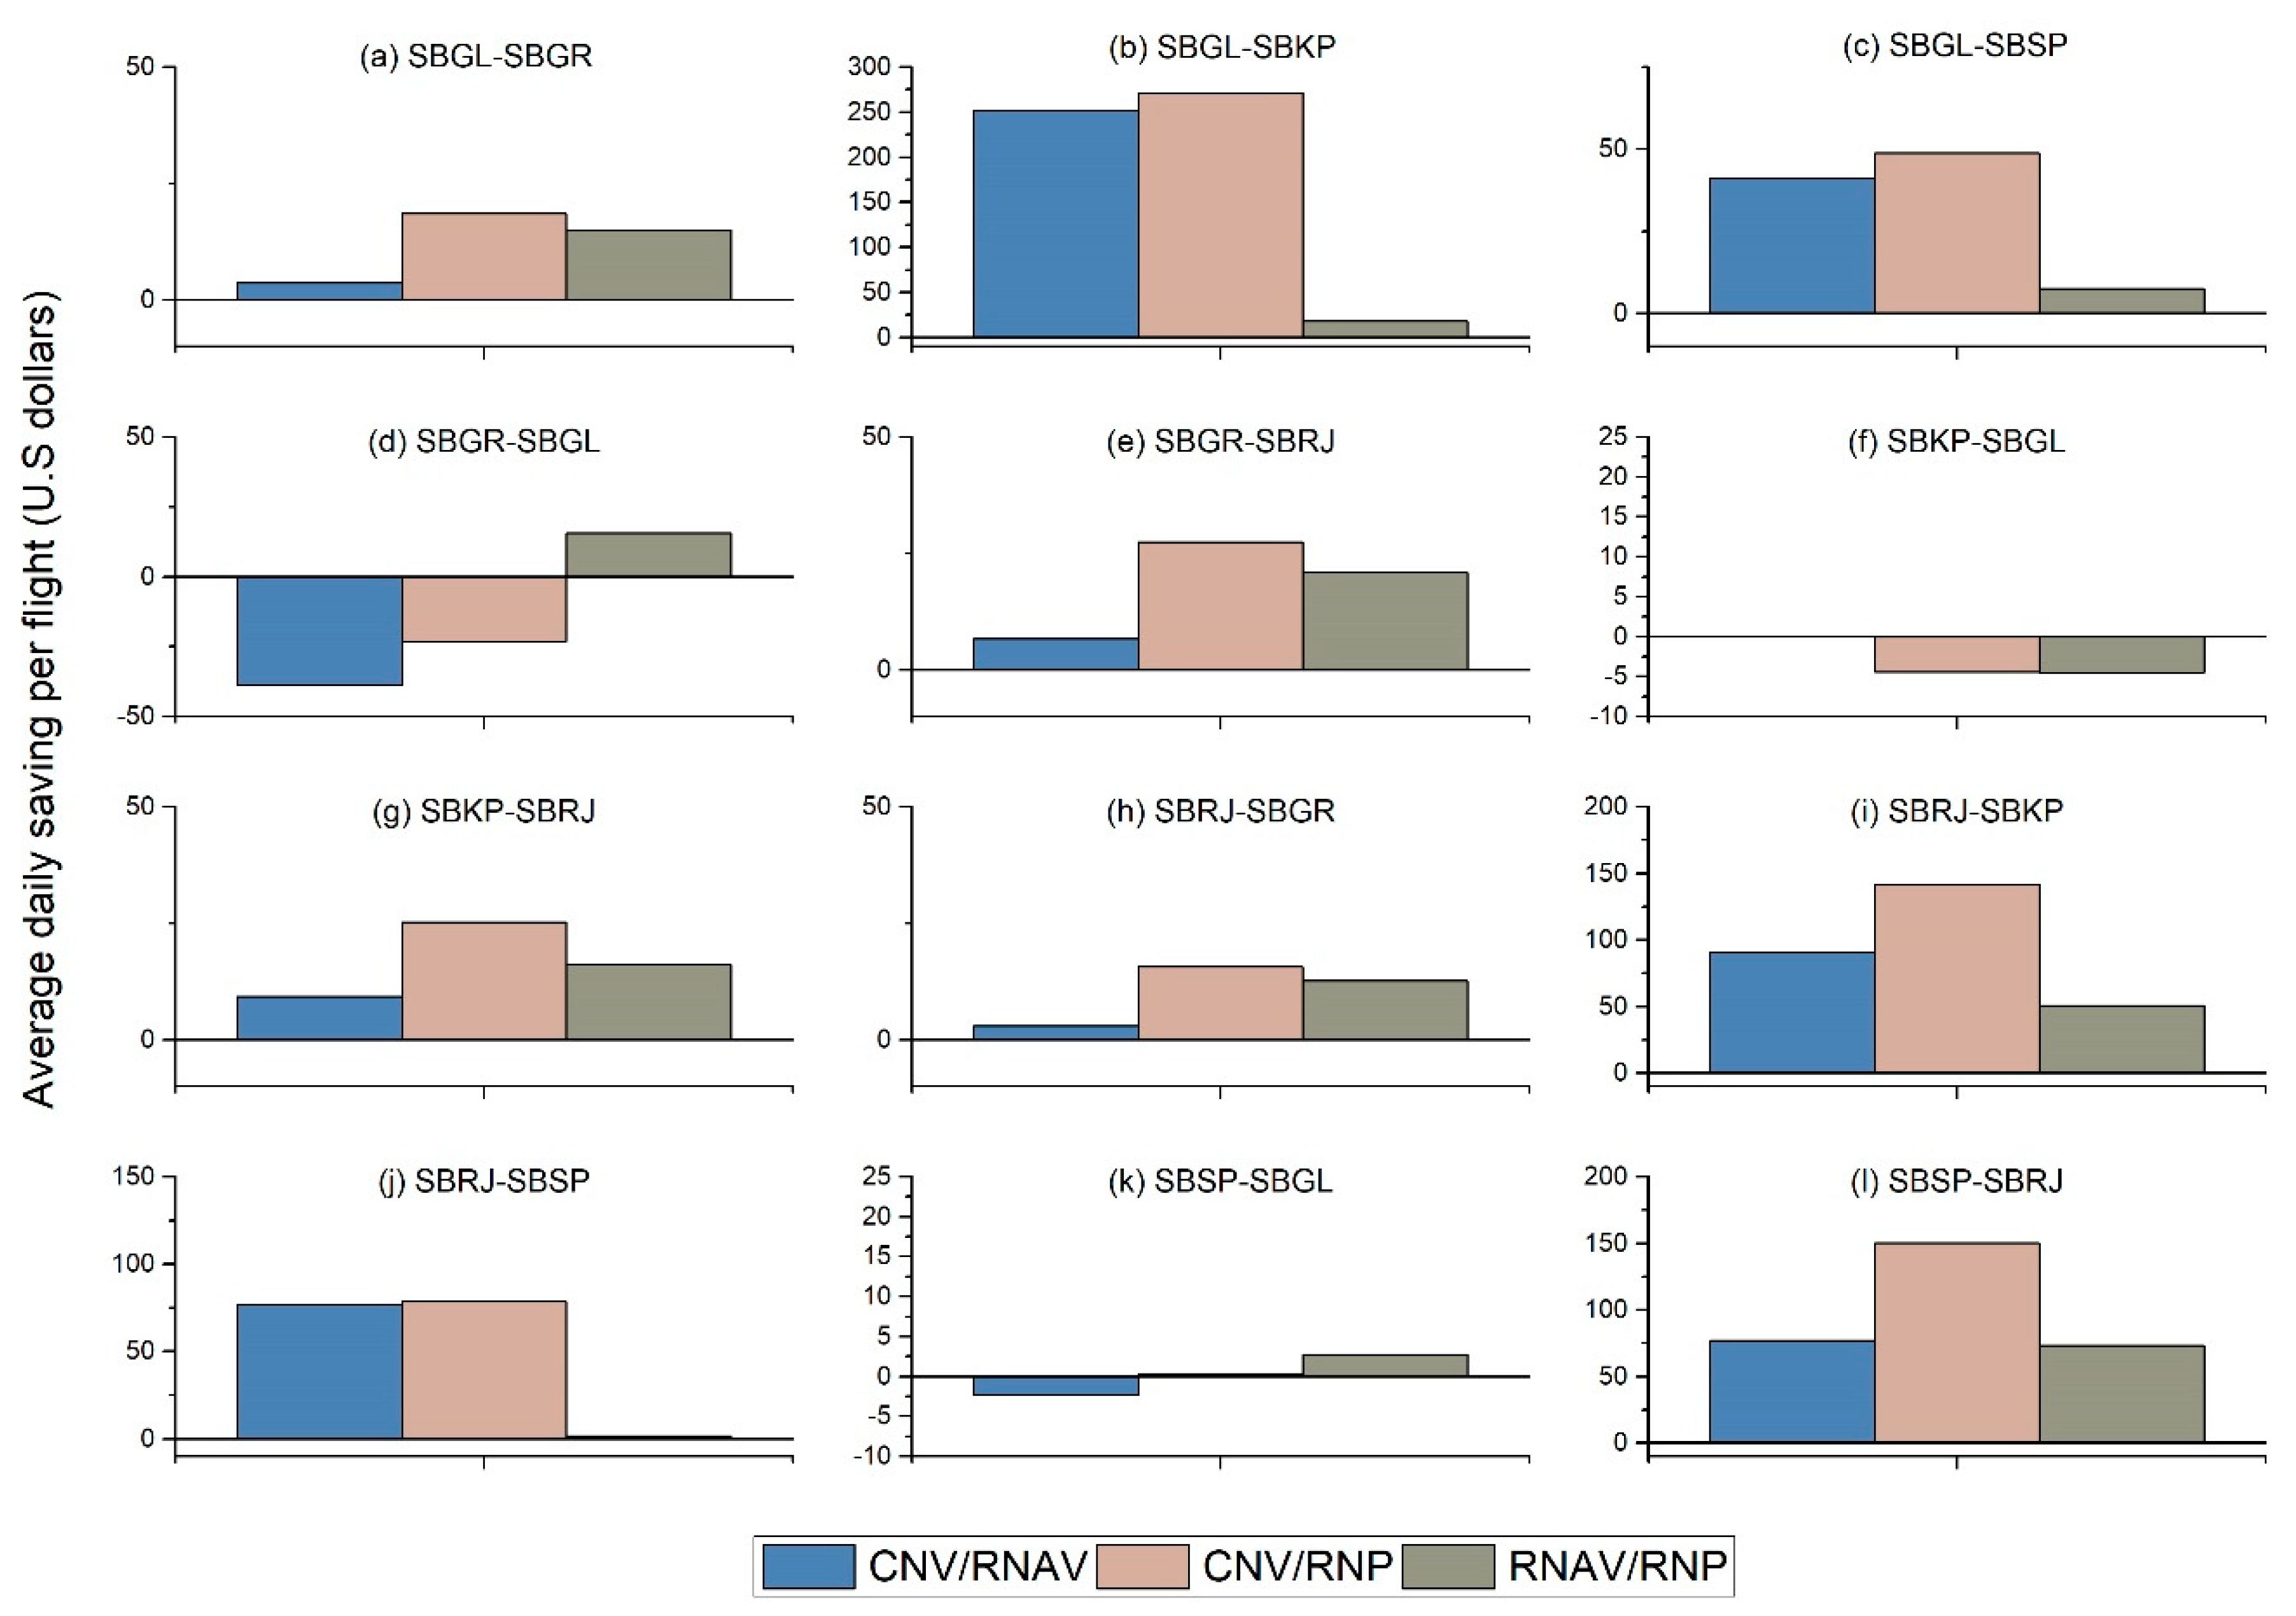
In this study, the application of the PBN procedures is evaluated for the Brazilian airspace system. Two cases were analysed. Case 1 simulates and quantifies the benefits of the introduction of the PBN procedures. The results show that the benefits are neither constant nor linear considering the type of aircraft and the procedure layout. Possible yearly savings of up to US$ 271 per flight were identified. Case 2 assumes the aircraft are in a normal air traffic situation and interacting with each other. On average, compared with Case 1, the aircraft losses which depended on the time of the day.
This study found that the introduction of PBN procedures brought benefits related to fuel burn, time and cost savings for different aircraft models. PBN procedures have improved air navigation. They allow for better route-planning, and the procedures do not depend on ground-based approaches. In an isolated scenario, the results showed that the benefits changed depending on aircraft type and procedure layout. In a normal air traffic situation where aircraft interact with each other, compared with the isolated scenario, the aircraft had, on average, losses due to interaction with other air traffic. This research shows that the savings are variable, as they are a function of the route and aircraft type. The PBN procedures are, therefore, an important step in the modernization of the airspace system, contributing to improvements in the efficiency of the air sector.
The introduction of the PBN procedures has been a breakthrough in air navigation. Its introduction allows for better planning of the routes, reducing the dependence on conventional approaches. This article considers fuel consumption and flight time as the key parameters to compare different procedures. Other parameters, such as the total number of air traffic conflicts and ATC controller workload, should be considered in future studies. Further studies should also evaluate if the gains obtained in this study are achievable in other airports around the world. With the projected demand for air transportation in the next decades, PBN procedures are an important step to modernizing national airspaces worldwide and improving the efficiency of the air sector.

Author Contributions

Conceptualization, D.A P., A.G.d.B. and C.J.P.A.; Formal analysis, D.A.P., A.G.d.B. and C.J.P.A.; Investigation, D.A.P. and C.J.P.A.; Methodology, D.A.P., A.G.d.B. and C.J.P.A.; Resources, C.J.P.A.; Supervision, A.G.d.B. and C.J.P.A.; Validation, D.A.P.; Writing—original draft, D.A.P.; Writing—review & editing, A.G.d.B. All authors have read and agreed to the published version of the manuscript.

Funding

The author received no specific funding for this work.

Institutional Review Board Statement

Not applicable.

Informed Consent Statement

Not applicable.

Data Availability Statement

Publicly available datasets were analyzed in this study. This data can be found here: https://data.mendeley.com/datasets/twnc66h94m/1 (accessed on 18 November 2021).

Conflicts of Interest

The authors declare that there is no conflict of interest regarding the publication of this paper.

References

  1. Morisset, T.; Odoni, A. Capacity, delay, and schedule reliability at major airports in Europe and the United States. Transp. Res. Rec. 2011, 2214, 85–93. [Google Scholar] [CrossRef]
  2. Schuster, W.; Ochieng, W. Performance requirements of future Trajectory Prediction and Conflict Detection and Resolution tools within SESAR and NextGen: Framework for the derivation and discussion. J. Air Transp. Manag. 2014, 35, 92–101. [Google Scholar] [CrossRef]
  3. International Civil Aviation Organization. Doc 9613—Performance-Based Navigation (PBN) Manual, 4th ed.; International Civil Aviation Organization: Montreal, QC, Canada, 2013. [Google Scholar]
  4. Pusateri, A.C. End-to-end RNP procedures. In Proceedings of the 2013 Integrated Communications, Navigation and Surveillance Conference (ICNS), 23–25 April 2013; IEEE: Herndon, VA, USA, 2013; pp. 1–10. [Google Scholar]
  5. Salgueiro, S.; Hansman, R.J. Potential Safety Benefits of RNP Approach Procedures. In Proceedings of the 17th AIAA Aviation Technology, Integration, and Operations Conference, Denver, CO, USA, 5–9 June 2017; p. 3597. [Google Scholar]
  6. Muller, D.; Uday, P.; Marais, K. Evaluation of the potential environmental benefits of RNAV/RNP arrival procedures. In Proceedings of the 11th AIAA Aviation Technology, Integration, and Operations (ATIO) Conference, Including the AIAA Balloon Systems Conference and 19th AIAA Lighter-Than, Virginia Beach, VA, USA, 20–22 September 2011; p. 6932. [Google Scholar]
  7. Belle, A.; Sherry, L. Benefits analysis of RNP approach procedure to runway 13C at Midway airport. In Proceedings of the 2014 Integrated Communications, Navigation and Surveillance Conference (ICNS) Conference Proceedings, Herndon, VA, USA, 8–10 April 2014; IEEE: Piscataway, NJ, USA, 2014; pp. N3-1–N3-9. [Google Scholar]
  8. Díaz, M.V.; Comendador, V.F.G.; Carretero, J.G.-H.; Valdés, R.M.A. Environmental benefits in terms of fuel efficiency and noise when introducing continuous climb operations as part of terminal airspace operation. Int. J. Sustain. Transp. 2020, 14, 903–913. [Google Scholar] [CrossRef]
  9. Sprong, K.R. Measuring the effects of RNAV departure procedures on airport efficiency. In Proceedings of the 24th Digital Avionics Systems Conference, Washington, DC, USA, 30 October–3 November 2005; IEEE: Piscataway, NJ, USA; pp. 2-D, 1–21. [Google Scholar]
  10. Dautermann, T. Civil air navigation using GNSS enhanced by wide area satellite based augmentation systems. Prog. Aerosp. Sci. 2014, 67, 51–62. [Google Scholar] [CrossRef]
  11. Andrianarison, M.; Sahmoudi, M. Efficient and innovative techniques for collective acquisition of weak GNSS signals. J. Comput. Commun. 2017, 5, 84–113. [Google Scholar] [CrossRef] [Green Version]
  12. Zhao, H.; Xu, X.; Zhang, J.; Zhu, Y. Extended estimation method for lateral flight technical error of perturbed system in performance based navigation. Aerosp. Sci. Technol. 2013, 30, 278–285. [Google Scholar] [CrossRef]
  13. Volf, P.; Jakubův, J.; Koranda, L.; Šišlák, D.; Pĕchouček, M.; Mereu, S.; Hilburn, B.; Nguyen, D.N. Validation of an air-traffic controller behavioral model for fast time simulation. In Proceedings of the 2014 Integrated Communications, Navigation and Surveillance Conference (ICNS) Conference Proceedings, 8–10 April 2014; IEEE: Herndon, VA, USA, 2014; pp. T1-1–T1-9. [Google Scholar]
  14. Sweet, D.N.; Manikonda, V.; Aronson, J.S.; Roth, K.; Blake, M. Fast-time simulation system for analysis of advanced air transportation concepts. In Proceedings of the AIAA Modeling and Simulation Technologies Conference, Monterey, CA, USA, 5–8 August 2002; AIAA: Reston, VA, USA, 2002; pp. 2002–4593. [Google Scholar]
  15. Wei, P.; Chen, L.; Sun, D. Algebraic connectivity maximization of an air transportation network: The flight routes’ addition/deletion problem. Transp. Res. Part E Logist. Transp. Rev. 2014, 61, 13–27. [Google Scholar] [CrossRef]
  16. Hossain, M.M.; Alam, S.; Delahaye, D. An evolutionary computational framework for capacity-safety trade-off in an air transportation network. Chin. J. Aeronaut. 2019, 32, 999–1010. [Google Scholar] [CrossRef]
  17. Chevalier, J.; Delahaye, D.; Sbihi, M.; Marechal, P. Departure and Arrival Routes Optimization Near Large Airports. Aerospace 2019, 6, 80. [Google Scholar] [CrossRef] [Green Version]
  18. Stewart, M.; Matthews, B. Objective assessment method for RNAV STAR adherence. In Proceedings of the 2017 IEEE/AIAA 36th Digital Avionics Systems Conference (DASC), St. Petersburg, FL, USA, 17–21 September 2017; IEEE: Piscataway, NJ, USA, 2017; pp. 1–9. [Google Scholar]
  19. Meric, Ö.S.; Usanmaz, O. A new standard instrument arrival: The point merge system. Aircr. Eng. Aerosp. Technol. 2013, 85, 136–143. [Google Scholar] [CrossRef]
  20. Laqui, C.; Barker, D.; DeArmon, J.; Farrell, D. Terminal RNAV: Analyses of Las Vegas McCarran international airport terminal RNAV operations. In Proceedings of the 22nd Digital Avionics Systems Conference, Proceedings (Cat. No.03CH37449), Indianapolis, IN, USA, 12–16 October 2003; IEEE: Piscataway, NJ, USA, 2003; Volume 1, pp. 1-E, 2-11-11. [Google Scholar]
  21. Becher, T.; Formosa, J. RNAV near-term terminal procedures development. In Proceedings of the 3rd USA/Europe Air Traffic Management R&D Seminar, Cambridge, MA, USA, 13–16 June 2000. [Google Scholar]
  22. Smith, E.C. Impact of RNAV terminal procedures on controller workload. In Proceedings of the 24th Digital Avionics Systems Conference, Washington, DC, USA, 30 October–3 November 2005; IEEE: Piscataway, NJ, USA; pp. 5-C, 3–51. [Google Scholar]
  23. Robinson, S.M.; DeArmon, J.S.; Becher, T.A. Benefits of RNAV terminal procedures: Air/ground communication reduction and airport capacity improvements [ATC]. In Proceedings of the 21st Digital Avionics Systems Conference, Irvine, CA, USA, 27–31 October 2002; IEEE: Piscataway, NJ, USA, 2002; p. 2D1. [Google Scholar]
  24. Barker, D.R.; Haltli, B.M.; Laqui, C.; MacWilliams, P.; McKee, K.L. Assessment of terminal RNAV mixed equipage. In Proceedings of the 23rd Digital Avionics Systems Conference (IEEE Cat. No. 04CH37576), Salt Lake City, UT, USA, 28 October 2004; IEEE: Piscataway, NJ, USA, 2004; pp. 2-B, 2–21. [Google Scholar]
  25. Sprong, K.R.; Haltli, B.M.; DeArmon, J.S.; Bradley, S. Improving flight efficiency through terminal area RNAV. In Proceedings of the 6th USA/Europe Air Traffic Management R&D Seminar, Baltimore, MD, USA, 27–30 June 2005. [Google Scholar]
  26. Mayer, R. Departure efficiency benefits of terminal rnav operations at dallas-fort worth international airport. In Proceedings of the 6th AIAA Aviation Technology, Integration and Operations Conference (ATIO), Wichita, KS, USA, 25–27 September 2006; p. 7774. [Google Scholar]
  27. Sprong, K.R.; Mayer, R.H. Analysis of RNAV arrival operations with descend via clearances at phoenix airport. In Proceedings of the 2007 IEEE/AIAA 26th Digital Avionics Systems Conference, Dallas, TX, USA, 21–25 October 2007; IEEE: Piscataway, NJ, USA, 2007; pp. 3-A-5-1–3-A-5-12. [Google Scholar]
  28. Timar, S.; Hunter, G.; Post, J. Assessing the benefits of NextGen performance based navigation (PBN). In Proceedings of the 10th USA/Europe Air Traffic Management Research and Development Seminar, Chicago, IL, USA, 10–13 June 2013. [Google Scholar]
  29. Novak, D.; Jurkovac, K. GNSS Navigation for Enabling More Efficient and Effective Air Traffic Management. Transp. Res. Procedia 2017, 28, 106–110. [Google Scholar] [CrossRef]
  30. Jeppesen Company. Total Airspace and Airport Modeler Manual; Jeppesen Company: Seattle, WA, USA, 2016. [Google Scholar]
  31. Kettunen, T.; Hustache, J.-C.; Fuller, I.; Howell, D.; Bonn, J.; Knorr, D. Flight efficiency studies in Europe and the United States. In Proceedings of the 13th USA/Europe Air Traffic Management Seminar, Vienna, Austria, 17–21 June 2019. [Google Scholar]
  32. ABEAR. Airlines Costs in Brazil. Available online: http://panorama.abear.com.br/dados-e-estatisticas/custos-das-empresas/ (accessed on 7 February 2019).
Figure 1. Flight phases and associated procedures. Source: The authors.
Energies 14 07800 g001
Figure 2. Longitudinal, lateral, and vertical separation. Source: The authors.
Energies 14 07800 g002
Figure 3. Flow chart for building TAAM scenarios. Source: The authors.
Energies 14 07800 g003
Figure 4. Case 1 route percentage improvement by route. (a) SBGL-SBGR; (b) SBGL-SBKP; (c) SBGL-SBSP; (d) SBGR-SBGL; (e) SBGR-SBRJ; (f) SBKP-SBGL; (g) SBKP-SBRJ; (h) SBRJ-SBGR; (i) SBRJ-SBKP; (j) SBRJ-SBSP; (k) SBSP-SBGL; (l) SBSP-SBRJ.
Energies 14 07800 g004
Figure 5. Case 1 route percentage improvement by aircraft. (a) A319; (b) A320; (c) A321; (d) B737-300; (e) B737-700; (f) B737-800; (g) F100; (h) E145; (i) E190; (j) AT72.
Energies 14 07800 g005
Figure 6. Case 1 approach; percentage improvement by airport. (a) SBGL; (b) SBGR; (c) SBKP; (d) SBRJ; (e) SBSP.
Energies 14 07800 g006
Figure 7. Case 1 approach; percentage improvement by aircraft. (a) A319; (b) A320; (c) A321; (d) B737-300; (e) B737-700; (f) B737-800; (g) F100; (h) E145; (i) E190; (j) AT72.
Energies 14 07800 g007
Figure 8. Gain variability for fuel consumption for each route due to air traffic interactions. (a) Fuel consumption; (b) Flight time.
Energies 14 07800 g008
Figure 9. Heat map of the traffic density in Brazilian air space and the studied area air traffic structure. Source: The authors.
Energies 14 07800 g009
Figure 10. Average daily savings in dollars by route. (a) SBGL-SBGR; (b) SBGL-SBKP; (c) SBGL-SBSP; (d) SBGR-SBGL; (e) SBGR-SBRJ; (f) SBKP-SBGL; (g) SBKP-SBRJ; (h) SBRJ-SBGR; (i) SBRJ-SBKP; (j) SBRJ-SBSP; (k) SBSP-SBGL; (l) SBSP-SBRJ.
Energies 14 07800 g010
Table 1. Comparing the results of the Ideal (case1) and the Real (Case 2).
RouteAverage Fuel Consumption—All Aircraft Types (% loss)Average Total Flight Time—All Aircraft Types (% loss)
SBGL-SBGR10.87.95
SBGL-SBKP12.5912.59
SBGL-SBSP55.76
SBGR-SBGL10.636.59
SBGR-SBRJ5.823.71
SBKP-SBGL14.546.67
SBKP-SBRJ9.53.31
SBRJ-SBGR6.714.3
SBRJ-SBKP5.476.07
SBRJ-SBSP11.196.02
SBSP-SBGL4.432.62
SBSP-SBRJ4.453.28
Average results8.435.74
Publisher’s Note: MDPI stays neutral with regard to jurisdictional claims in published maps and institutional affiliations.

