Article

The Effect of Foliar Application of K2SO4 or KH2PO4 on Skin Color of the ‘Kyoho’ Grape

1
The Key Laboratory of Characteristics of Fruit and Vegetable Cultivation and Utilization of Germolasm Resources of the Xinjiang Production and Construction Crops, Department of Horticulture, College of Agriculture, Shihezi University, Shihezi 832003, China
2
Xinjiang Academy of Agricultural Sciences, Shihezi 832000, China
3
College of Horticulture, Nanjing Agricultural University, 1 Weigang Road, Nanjing 210095, China
*
Authors to whom correspondence should be addressed.
Agronomy 2021, 11(11), 2361; https://doi.org/10.3390/agronomy11112361
Submission received: 3 October 2021 / Revised: 1 November 2021 / Accepted: 16 November 2021 / Published: 22 November 2021

Abstract

:
Anthocyanins in red grape skin have a positive effect on fruit color and human health. The effect of foliar potassium application on anthocyanin accumulation in grape skin is not well understood. The study aimed to better understand the mechanism of anthocyanin accumulation in grape skin in response to foliar sprays of K2SO4 and KH2PO4. In this study, we investigated the effects of foliar application of KH2PO4 (T2), K2SO4 (T1) and distilled water (CK) on the skin color of ‘Kyoho’ grapes at mid-ripe and mature stages. At 90 and 110 days after full bloom (DAFB), T2 had the greatest total soluble solids (TSS), flavonoid and total anthocyanin contents, followed by T1 and CK. At two stages, the titratable acid content decreased and the juice pH increased under T2 treatment relative to CK. T1 and T2 had lower lightness (L*) than CK, and the color index of red grapes (CIRG) under T1 and T2 increased at two stages compared to CK. KEGG metabolic pathway analysis revealed that flavonoid biosynthesis was the most significantly enriched pathway in CK vs. T2 at 90 and 110 DAFB. At 90 DAFB, T2 had higher expressions of phenylalanine ammonia-lyas (PAL), cytochrome P450 CYP73A100 (CYP73A), 4-coumarate: CoA ligase (4CL), chalcone synthase (CHS), flavanone 3-dioxygenase-like (F3H) and UDP glucose: flavonoid 3-o-glucosyl transferase (UFGT) than CK and T1. Foliar application of potassium fertilizer may accelerate anthocyanin accumulation by altering the transcript levels of PAL, CYP73A, 4CL, CHS, F3H, and UFGT of the flavonoid biosynthesis.

1. Introduction

Anthocyanins are important water-soluble pigments in grapes [1]. The color of red, purple, and dark purple grapes are dependent mainly on the content and components of anthocyanins in the skin [2]. High anthocyanin content in grapes not only enhances their aesthetic [3], but also performs a wide range of biological functions in plants, such as protection against antioxidant capacity, UV light, and pathogen attack [4,5]. Foods high in anthocyanins have been shown to lower the risks of diabetes, cancer and cardiovascular disease [6]. Red wines and red grapes are important source of anthocyanins for the human diet [4]. As a result, consumers, farmers and researchers are becoming more interested in the cultivation of grapes with good aesthetics [7].
The biosynthesis of anthocyanins depends on internal factors and external factors. Internal factors include the varieties, sugar accumulation levels, hormone levels, genetics [1], etc. The genetic features of grapes determine the great variation in the species and content of anthocyanins among different varieties. Anthocyanins, also known as flavonoids, are a type of secondary metabolites in plants. The biosynthesis of flavonoids is genetically regulated and controlled by the expression of structural and regulatory genes [8]. The flavonoid biosynthesis pathway is a branch of the phenylpropanoid biosynthesis process which requires several early biosynthetic genes such as phenylalanine ammonia-lyase (PAL), chalcone synthase (CHS), chalcone isomerase (CHI), and flavanone 3-hydroxylase (F3H) [1]. Dihydroflavonol 4-reductase (DFR), anthocyanin synthase (ANS), and UDP-glucose: flavonoid 3-glucosyltransferase (UFGT) are all involved in the formation of specific flavonoid compounds such as anthocyanins, proanthocyanidins, and flavonols at a later stage in the process [9,10]. Following the initial steps, the flavonoid pathway divides into proanthocyanidin, anthocyanin and flavonol branches. The first step in the phenylpropanoid pathway is catalyzed by PAL. PAL, cytochrome P450 CYP73A100 (CYP73A), and 4-coumaroyl-CoA synthase (4CL) all play a functional role in the general phenylpropanoid pathway from phenylalanine to 4-coumaroyl-CoA [11]. CHS, CHI, F3H, flavonoid 3′,5′-hydroxylase (F3′5′H), flavonol synthase/flavanone 3-hydroxylase (FLS), and ANS catalyzed the production of different anthocyanin subgroups by modifying the molecular skeleton and/or backbone [12]. The final step in the anthocyanin biosynthesis pathway is catalyzed by UFGT [13].
External factors include environmental factors (water, light, temperature), soil composition, viticultural practices [4], etc. The foliar spraying of fertilizers and plant growth regulators has become an important viticultural practice to avoid deficiencies and improve quality [14]. Sprays of (NH4)2SO4 increased tomato total soluble solids (TSS) and titratable acid content but decreased vitamin C content and fruit postharvest freshness [15]. Spraying amino acid selenium fertilizer with a dosage of 12,000 mL/hm2 achieved the best effect of increasing the selenium content and improving the quality of mangoes [16]. Foliar iron application promotes flavonoid accumulation in grape berries grown in iron-deficient soil [17]. The foliar application of phenylalanine and methyl jasmonate improved the aromatic composition of Grenache grapes [18]. Ethephon was sprayed on red grapes to improve the color of berries; however, ethephon treatment can cause berries to soften, reducing the commercial value of the grapes [19]. ABA promoted grape coloration, but the high cost of ABA reduces its practical application [19,20].
Foliar spraying of fertilizers is a more target-oriented, cost-effective, and fertilizer-use efficient technique, and diminishes nutrient and environmental degradation losses [21]. Foliar applications of potassium can quickly and efficiently correct the deficiency, especially at the end of the season when soil application may not be feasible or effective [22]. Foliar fertilization with P and K of grapevines accelerated the accumulation of sugars and anthocyanins [14]. Spraying K2SO4 on black grape leaves significantly increased anthocyanin, total protein content and antioxidant enzyme activities in the berries [23]. Post flowering foliar application of 0.5% KH2PO4 improved yield and quality of jackfruit and accelerated harvesting in jackfruit [24]. Foliar spraying of K2SO4 or KH2PO4 fertilizers improved the chlorophyll content and fruit size of grapes [25]. However, very few studies have been undertaken on the effects of foliar potassium fertilizer application on the grape skin color. The aim of the present study was to determine the effects of foliar sprays of K2SO4 or KH2PO4 on ‘Kyoho’ grape skin coloration at two-stage and preliminarily explain the metabolic mechanism of its effect on coloration by transcriptome sequencing and analysis, so as to provide a theoretical basis for the production of high-quality grapes.

2. Materials and Methods

2.1. Experimental Site and Experimental Design

This study was carried out in a plastic greenhouse at Shihezi University’s experimental station (43°32′ N, 85°97′ E) from 8 May 2019 until the end of August 2019. The research material consisted of 5-year-old ‘Kyoho’ grape plants. The grape plants were cultivated in a container (root control bag) filled with sandy loam soil. The diameter of the bag was 50 cm, and the height was 50 cm. Chemical fertilizers were applied during the growing season. The amount of chemical fertilizer applied per vine was 184.00 g N, 87.32 g P, and 398.30 g K. A total of 11 irrigations were carried out during the whole growth period, and the irrigation interval was 10 days. The plants were grown with interplant spacing of 0.5 m within rows and 0.5 m between rows and trained to a “Y” form with each fruit cane bearing two clusters. Each vine has two canes.
The experiment used a randomized complete block design with three replicates of three treatments. There were nine plots used, with each plot containing 15 healthy, well-grown grape plants. The three treatments were as follows: (1) foliar spraying of distilled water as CK, (2) foliar spraying of 0.5% K2SO4 as T1, and (3) foliar spraying of 0.5% KH2PO4 as T2. Foliar application of fertilizer was performed at 63 (at veraison) and 70 days after full bloom (DAFB) by using a knapsack sprayer. For each application, 600 mL/vine was sprayed over leaves. Spraying treatments were performed in the early morning one hour after sunrise. All other agronomic operations were performed uniformly for all the treatments.
The samples were collected at 90 (mid-ripe stage) and 110 DAFB (mature stage). Each replication had 60 clusters, from which 20 clusters were randomly selected. Sixty grape berries were randomly selected from the upper, middle, and lower parts of 20 clusters (3 berries per cluster) of each replication at two sampling time, and all samples were immediately transported to the laboratory in ice boxes. Berry skin was separated from pulp, and pulp tissues were further removed by rubbing the internal side of the skin against sandpaper. The skin and pulp were flash frozen in liquid nitrogen and stored at −80 °C until further processing.

2.2. Determination of Physicochemical Indices of Berries

The total soluble solids (TSS) content of grape berries was determined with a digital refractometer (PR-100α; Atago, Tokyo, Japan). The pH was measured with a Mettler Toledo FE20 Desktop pH-Meter (Mettler Toledo Instruments Co., Ltd., Shanghai, China). The titratable acid content of the grape berries was estimated according to the method described by Ben Rejeb et al. [26]. The samples were titrated to pH 8.1 with sodium hydroxide using a pH meter. The titratable acid content of the grape berries was calculated, and the result are expressed in grams per litre of tartaric acid. The solidity–acid ratio = TSS/titratable acid. For TSS, titratable acid and pH, a composite sample (30 grape berries) was used for each replicate. Mid-ripe stage of grape was determined according to the minimum edible standard (total soluble sugar content ≥ 12.50% and solidity–acid ratio ≥ 20:1) [27], and mature stage was determined according to the peak TSS content.

2.3. Chromaticity Values of Fruits

Thirty grape berries (the upper, middle, and lower parts of 10 clusters) were randomly collected from each replicate, and berry color was measured using a Minolta® CR-200 colorimeter (Choromo Meter CR-200, Minolta Camera Co., Ltd., Osaka, Japan) to obtain the following variables from the equatorial portion of berries (n = 4 per berry) and described by the CIE L*, a*, and b* color space coordinates [26]. The L* value represents the lightness of colors, with a range of 0 to 100 (0, black; 100, white). The a* value is negative for green and positive for red. The b* value is negative for blue and positive for yellow. The chroma values (C*) = [(a*)2 + (b*) 2]0.5, hue angle, h° (0–360°) = arctangent b*/a*, and h° is on the color wheel (0° = red; 90° = yellow; 180° = green; 270° = blue). The color index of red grape (CIRG) was calculated using the formula: CIRG = (180 − arctangent b*/a*)/(L* + C*). Based on the CIRG values, the berry color was classified into 5 categories: green-yellow (<2), pink (2 to 4), red (4 to 5), dark red (5 to 6), and blue-black (>6.0) [28].

2.4. Pigment Content in Fruits

The flavonoid content in grape skin was determined according to the method of Jiang et al. [29]. The data are expressed as mg equivalents of rutin per g grapes fresh weight. The total anthocyanin content in grape skin was determined by the pH differential method [1]. The data are expressed as mg equivalents of cyanidin-3-monoglucoside per g grape skin fresh weight. The chlorophyll and carotenoid content in grape skin were assayed using a spectrophotometric method after cell extraction with 95% ethanol [30]. The calculation formula is as follows:
Ca = 13.95 × OD665 − 6.88 × OD649
Cb = 24.96 × OD649 − 7.32 × OD665
Cchlorophyll = Ca + Cb
Ccarotenoid = (1000 × OD470 − 2.05 × Ca − 114.8 × Cb)/245

2.5. Transcriptome Sequencing and Analysis

All samples were analyzed with three biological replicates. For RNA-Seq, cDNA libraries were constructed with an Ultra™ RNA Library Prep Kit for Illumina (Beverly, MA, USA), and the raw read sequences were obtained by Shanghai Personal Biotechnology Co., Ltd. (Shanghai, China) using Illumina HiSeqTM 2000 with 6 Gb reads per sample. The raw reads were initially processed to obtain clean reads using HISAT by removing the adapter and low-quality sequences [31]. After quality trimming, the clean reads were aligned to the reference genome of Vitis vinifera (http://plants.ensembl.org/Vitis_vinifera/Info/Index, accessed on 2 February 2021) using TopHat software [32]. TopHat (version 2.0.9) [33] was used to set two mismatches and multihits ≤1, and the resulting assemblies were merged together to give rise to the final transcriptome assembly using CD-HIT-EST v4.6 [34]. The expression level of each transcript was determined by calculating fragments per kilobase per million reads (FPKM) with RSEM software [35]. Significantly differentially expressed genes were detected by comparing the raw counts of each transcript using DESeq2 software [36]. Genes with p-adjust < 0.05 and |log2FC| ≥ 1 were defined as significantly differentially expressed genes (DEGs). Enrichment analyses of DEG sets in the Kyoto Encyclopedia of Genes and Genomes (KEGG) pathways (p < 0.05) were performed using the OmicShare tools (www.omicshare.com/tools, accessed on 2 February 2021). The KEGG enrichment analysis was carried out using the R Package [37]. KEGG provides a reference knowledge base for linking genomes to life through the process of pathway mapping [38]. The KOBAS software were used to test the statistical enrichment of differentially expressed genes in KEGG pathways [39].

2.6. Statistical Analysis

One-way analysis of variance (ANOVA) was performed with SPSS 20.0 (version 20.0, Chicago, IL, USA) and the significance was tested at the 5% level using Duncan’s multiple range test.

3. Results

3.1. Effect of Different Potassium Fertilizers on ‘Kyoho’ Grape Berries Quality

The highest TSS content was observed in T2 at 90 and 110 DAFB. The TSS content of T1 and T2 were higher than that of CK at 110 DAFB. For titratable acid content, there were significant differences between the CK, T1, and T2 treatments. The titratable acid content of grape berries decreased significantly under the T1 and T2 treatments compared to the CK at 90 and 110 DAFB (Table 1). T2 had the highest solidity–acid ratio and pH, while CK had the lowest solidity–acid ratio and pH at both stages (Table 1). The pH values of T1 and T2 were both higher than the pH value of CK at 90 and 110 DAFB.

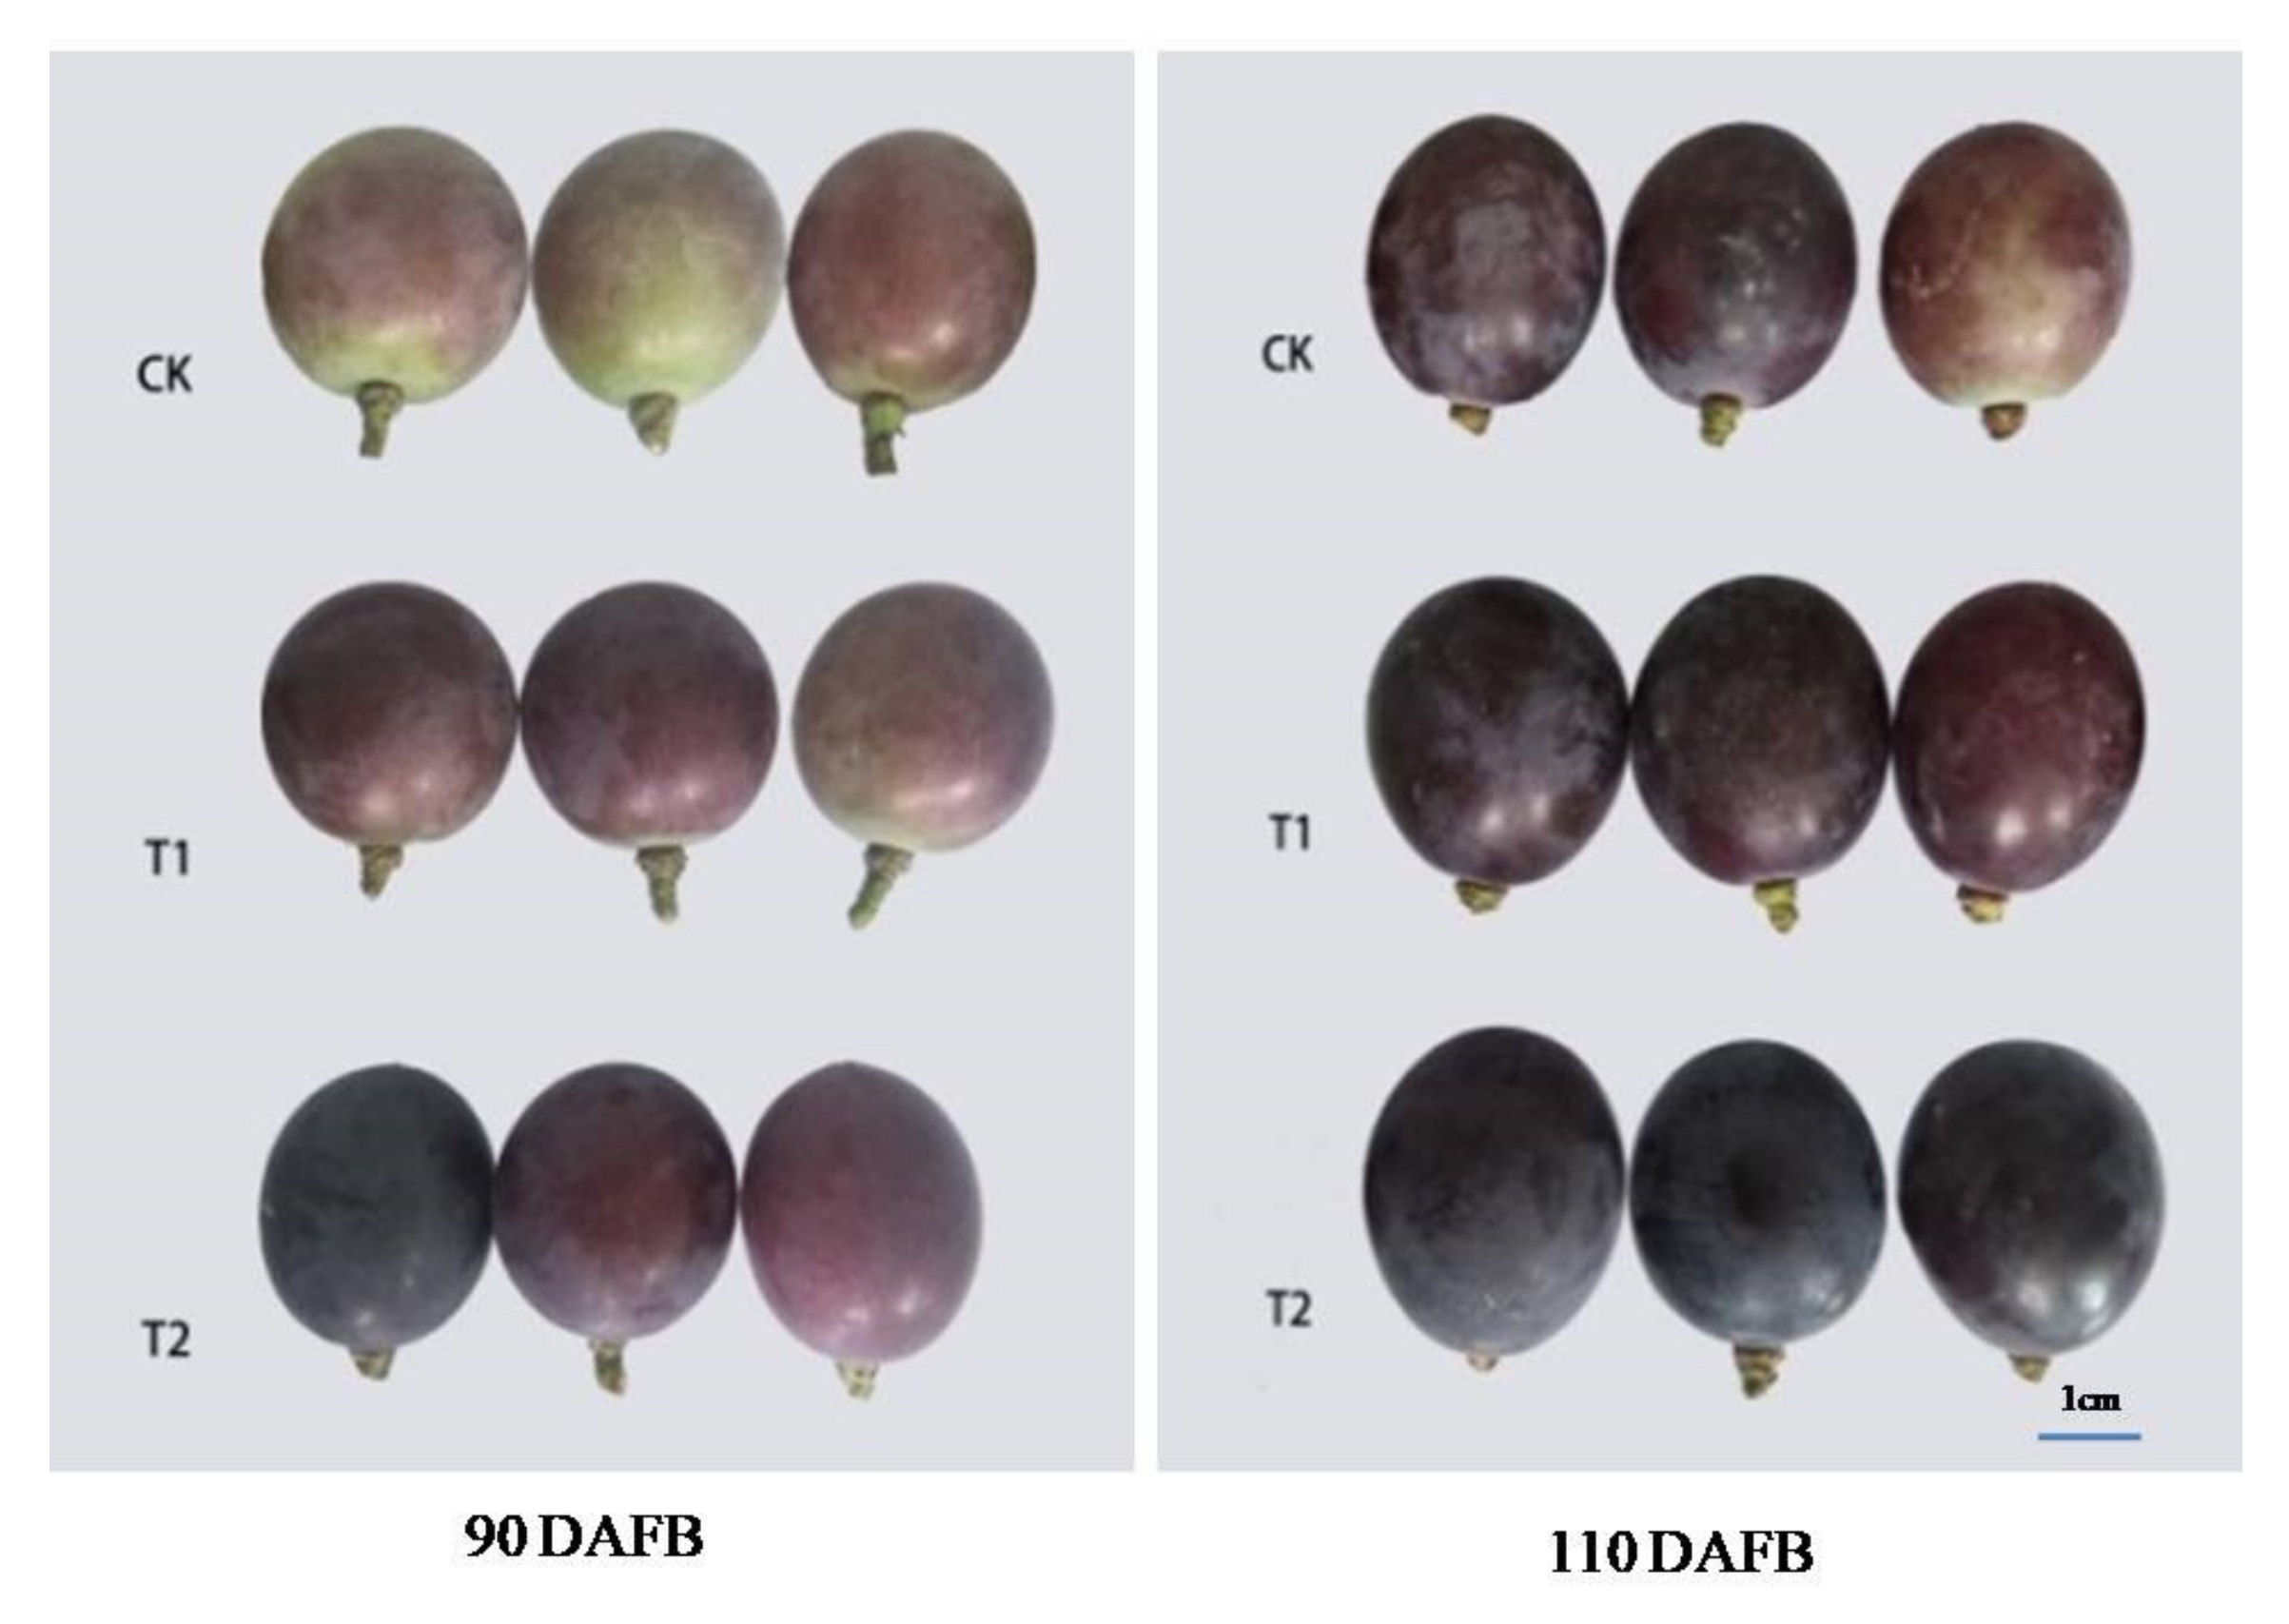
3.2. Effect of Different Potassium Fertilizers on Colorimetric Characteristics of ‘Kyoho’ Grape Berry Color

The L* value for the three treatments at 90 DAFB ranged from 33.39 to 29.02 (Figure 1 and Table 2). At 90 and 110 DAFB, the highest L* value was found in CK, while the lowest L* value was found in T2. At both stages, the grapes all presented reddish coloration (positive a* values). The a* value with T2 > T1 > CK changed from more to less red at 90 DAFB. However, the highest a* value was presented in CK, while the lowest a* value was in T2 at 110 DAFB. Interestingly, C* followed the same pattern as a* in all treatments. At 90 DAFB, the b* values revealed two distinct groups: CK (3.12) and T1 (2.19), with positive b* values indicating yellowish coloration, and T2 (−0.17), with negative b* value indicating bluish coloration (Table 2). All the grapes presented bluish coloration (negative b* values) with T2 < T1 < CK from more to less blue at 110 DAFB (Table 2). The h° of T1 treatment decreased compared to CK treatment, dropping from a value of 39.61 to 22.79 at 90 DAFB. T2 treatment showed a significant increase, reaching a value of 353.74 at 90 DAFB. The h° ranged from 354.12 to 331.41 at 110 DAFB for the three treatments, with T1 and T2 treatments having lower h° than CK treatment. Based on the CIRG index, the berries of CK were classified as pink (2 < CIRG < 4), and T1 and T2 treated berries as red (4 < CIRG < 5) at 90 DAFB (Table 2). The berries of CK and T1 treatments were classified as dark red (5 < CIRG < 6) and T2 treated berries as blue-black (CIRG > 6.0).

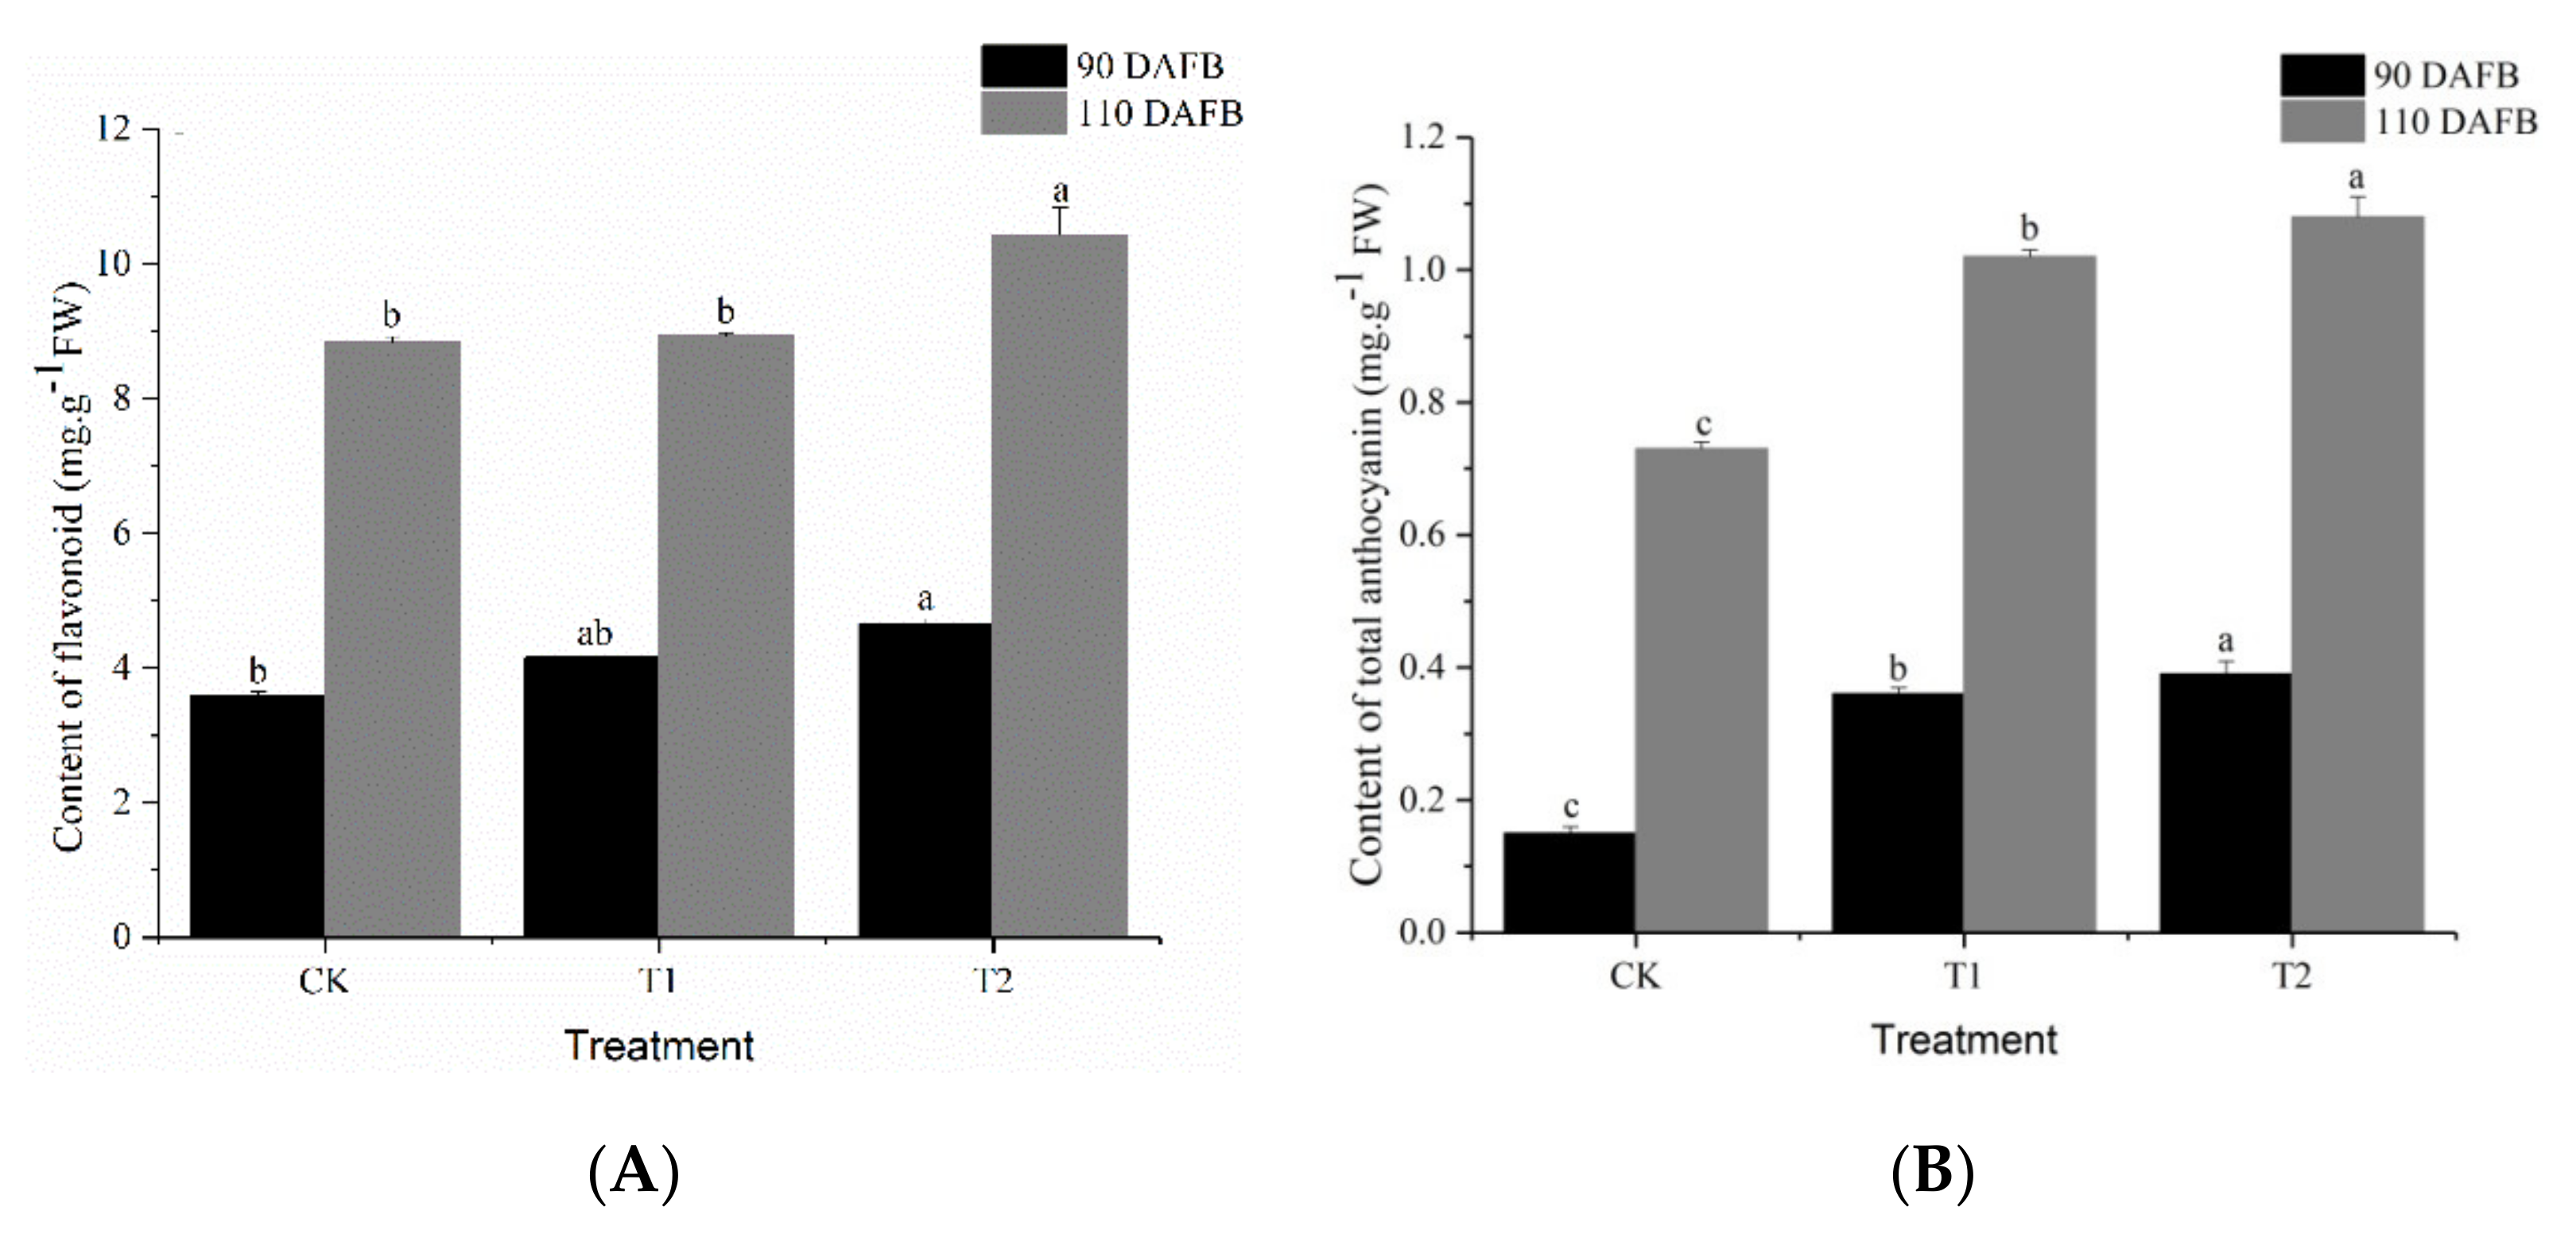
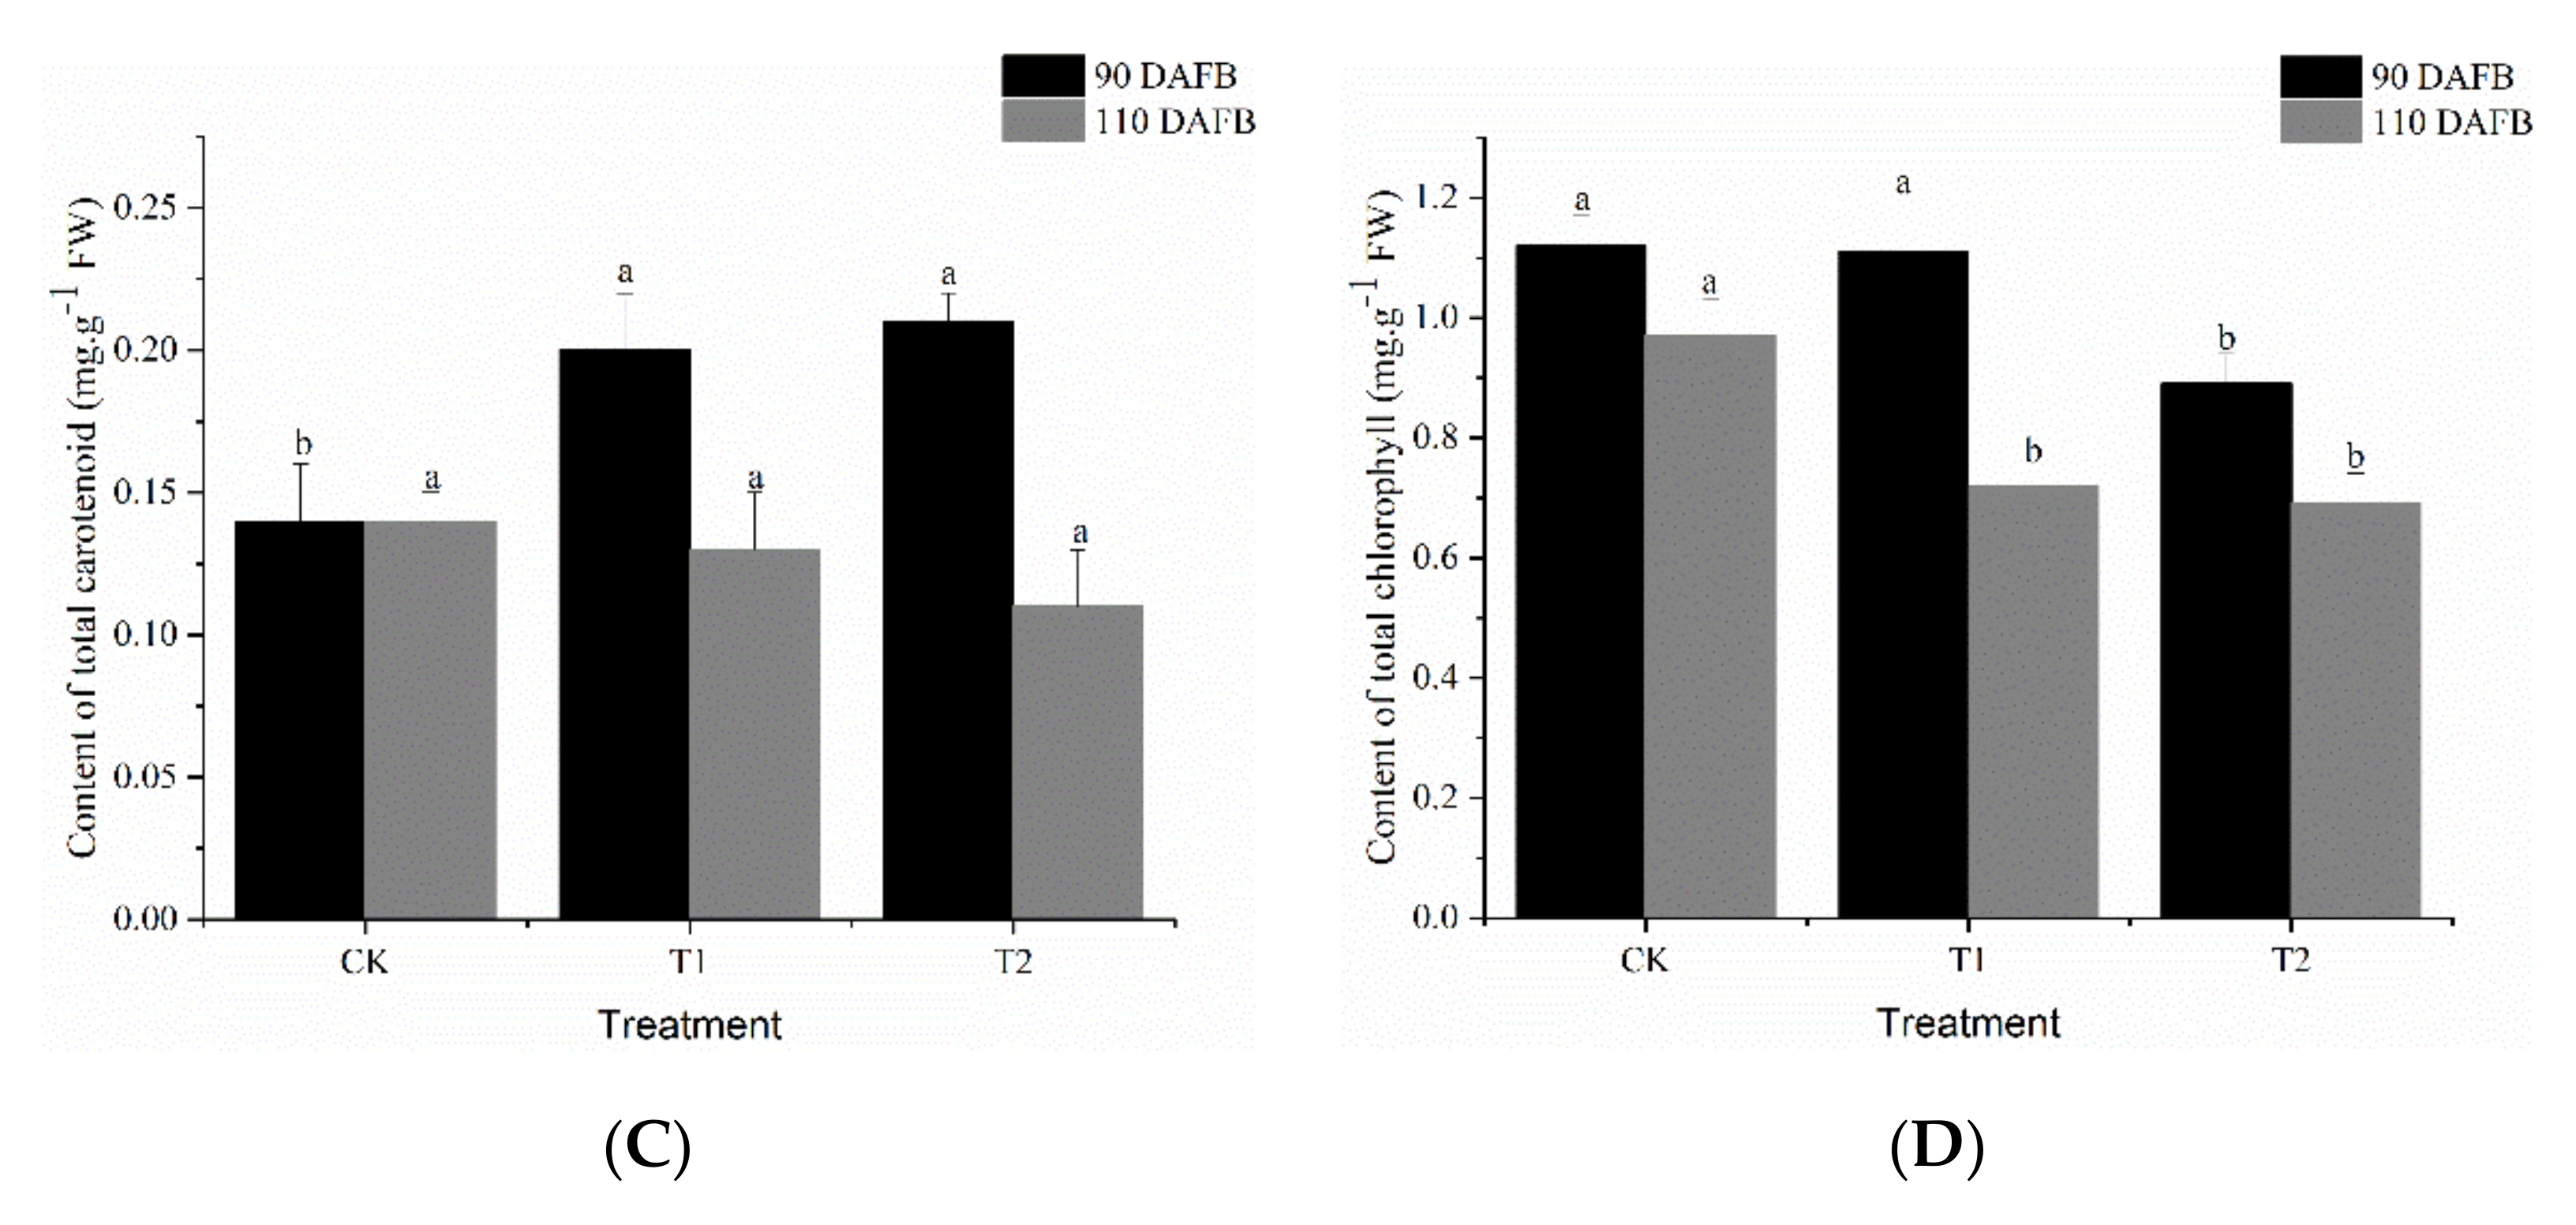
3.3. Effect of Different Potassium Fertilizers on Pigment Content in ‘Kyoho’ Grape Skin

The flavonoid content was T2 > T1 > CK from highest to lowest at 90 and 110 DAFB. The flavonoid content in the T2 treatment was significantly higher than that in the CK treatment at the two stages (Figure 2A). As shown in Figure 2B, the total anthocyanin content in the T1 and T2 treatments was significantly higher than that in the CK treatment at 90 and 110 DAFB. The total carotenoid content in the T2 treatment was 50.00% higher than the total carotenoid content in the CK treatment at 90 DAFB, but the content in the T2 treatment was 47.62% lower than the content in the CK treatment at 110 DAFB. The total carotenoid content was T2 < T1 < CK from less to more (Figure 2C). The content of total chlorophyll was lowest in the T2 treatment and highest in the CK treatment at two stages (Figure 2D).

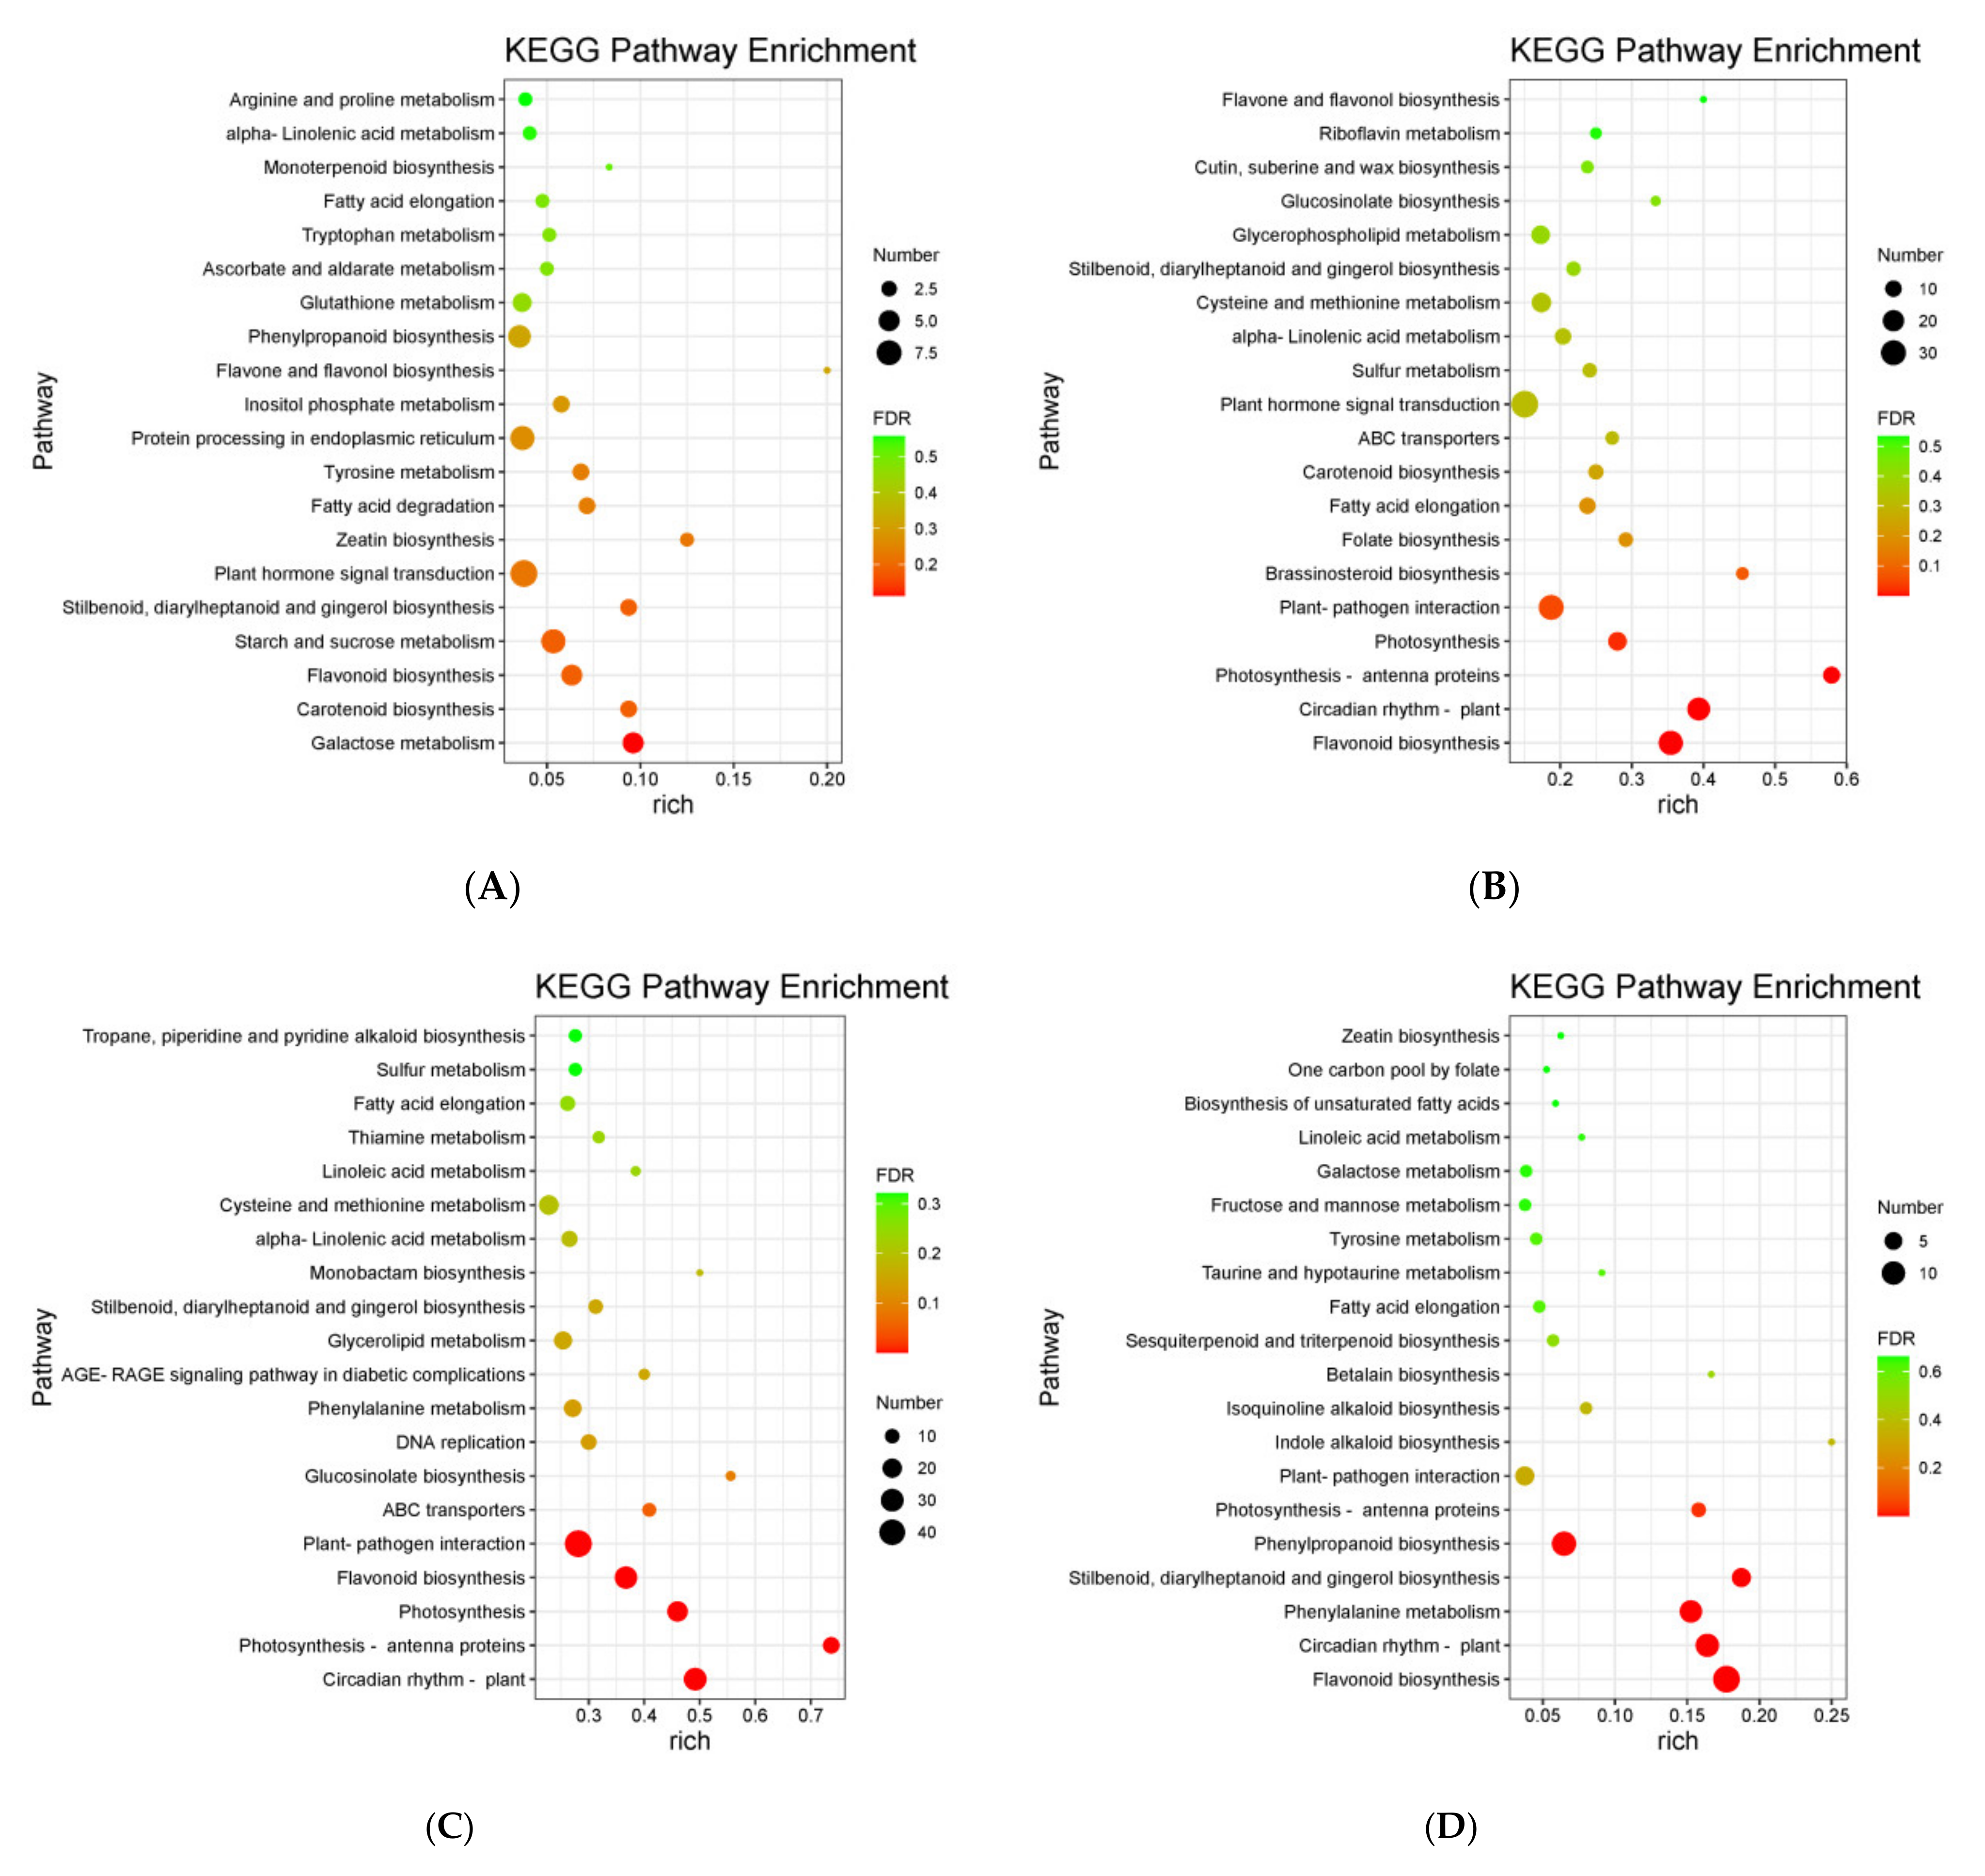
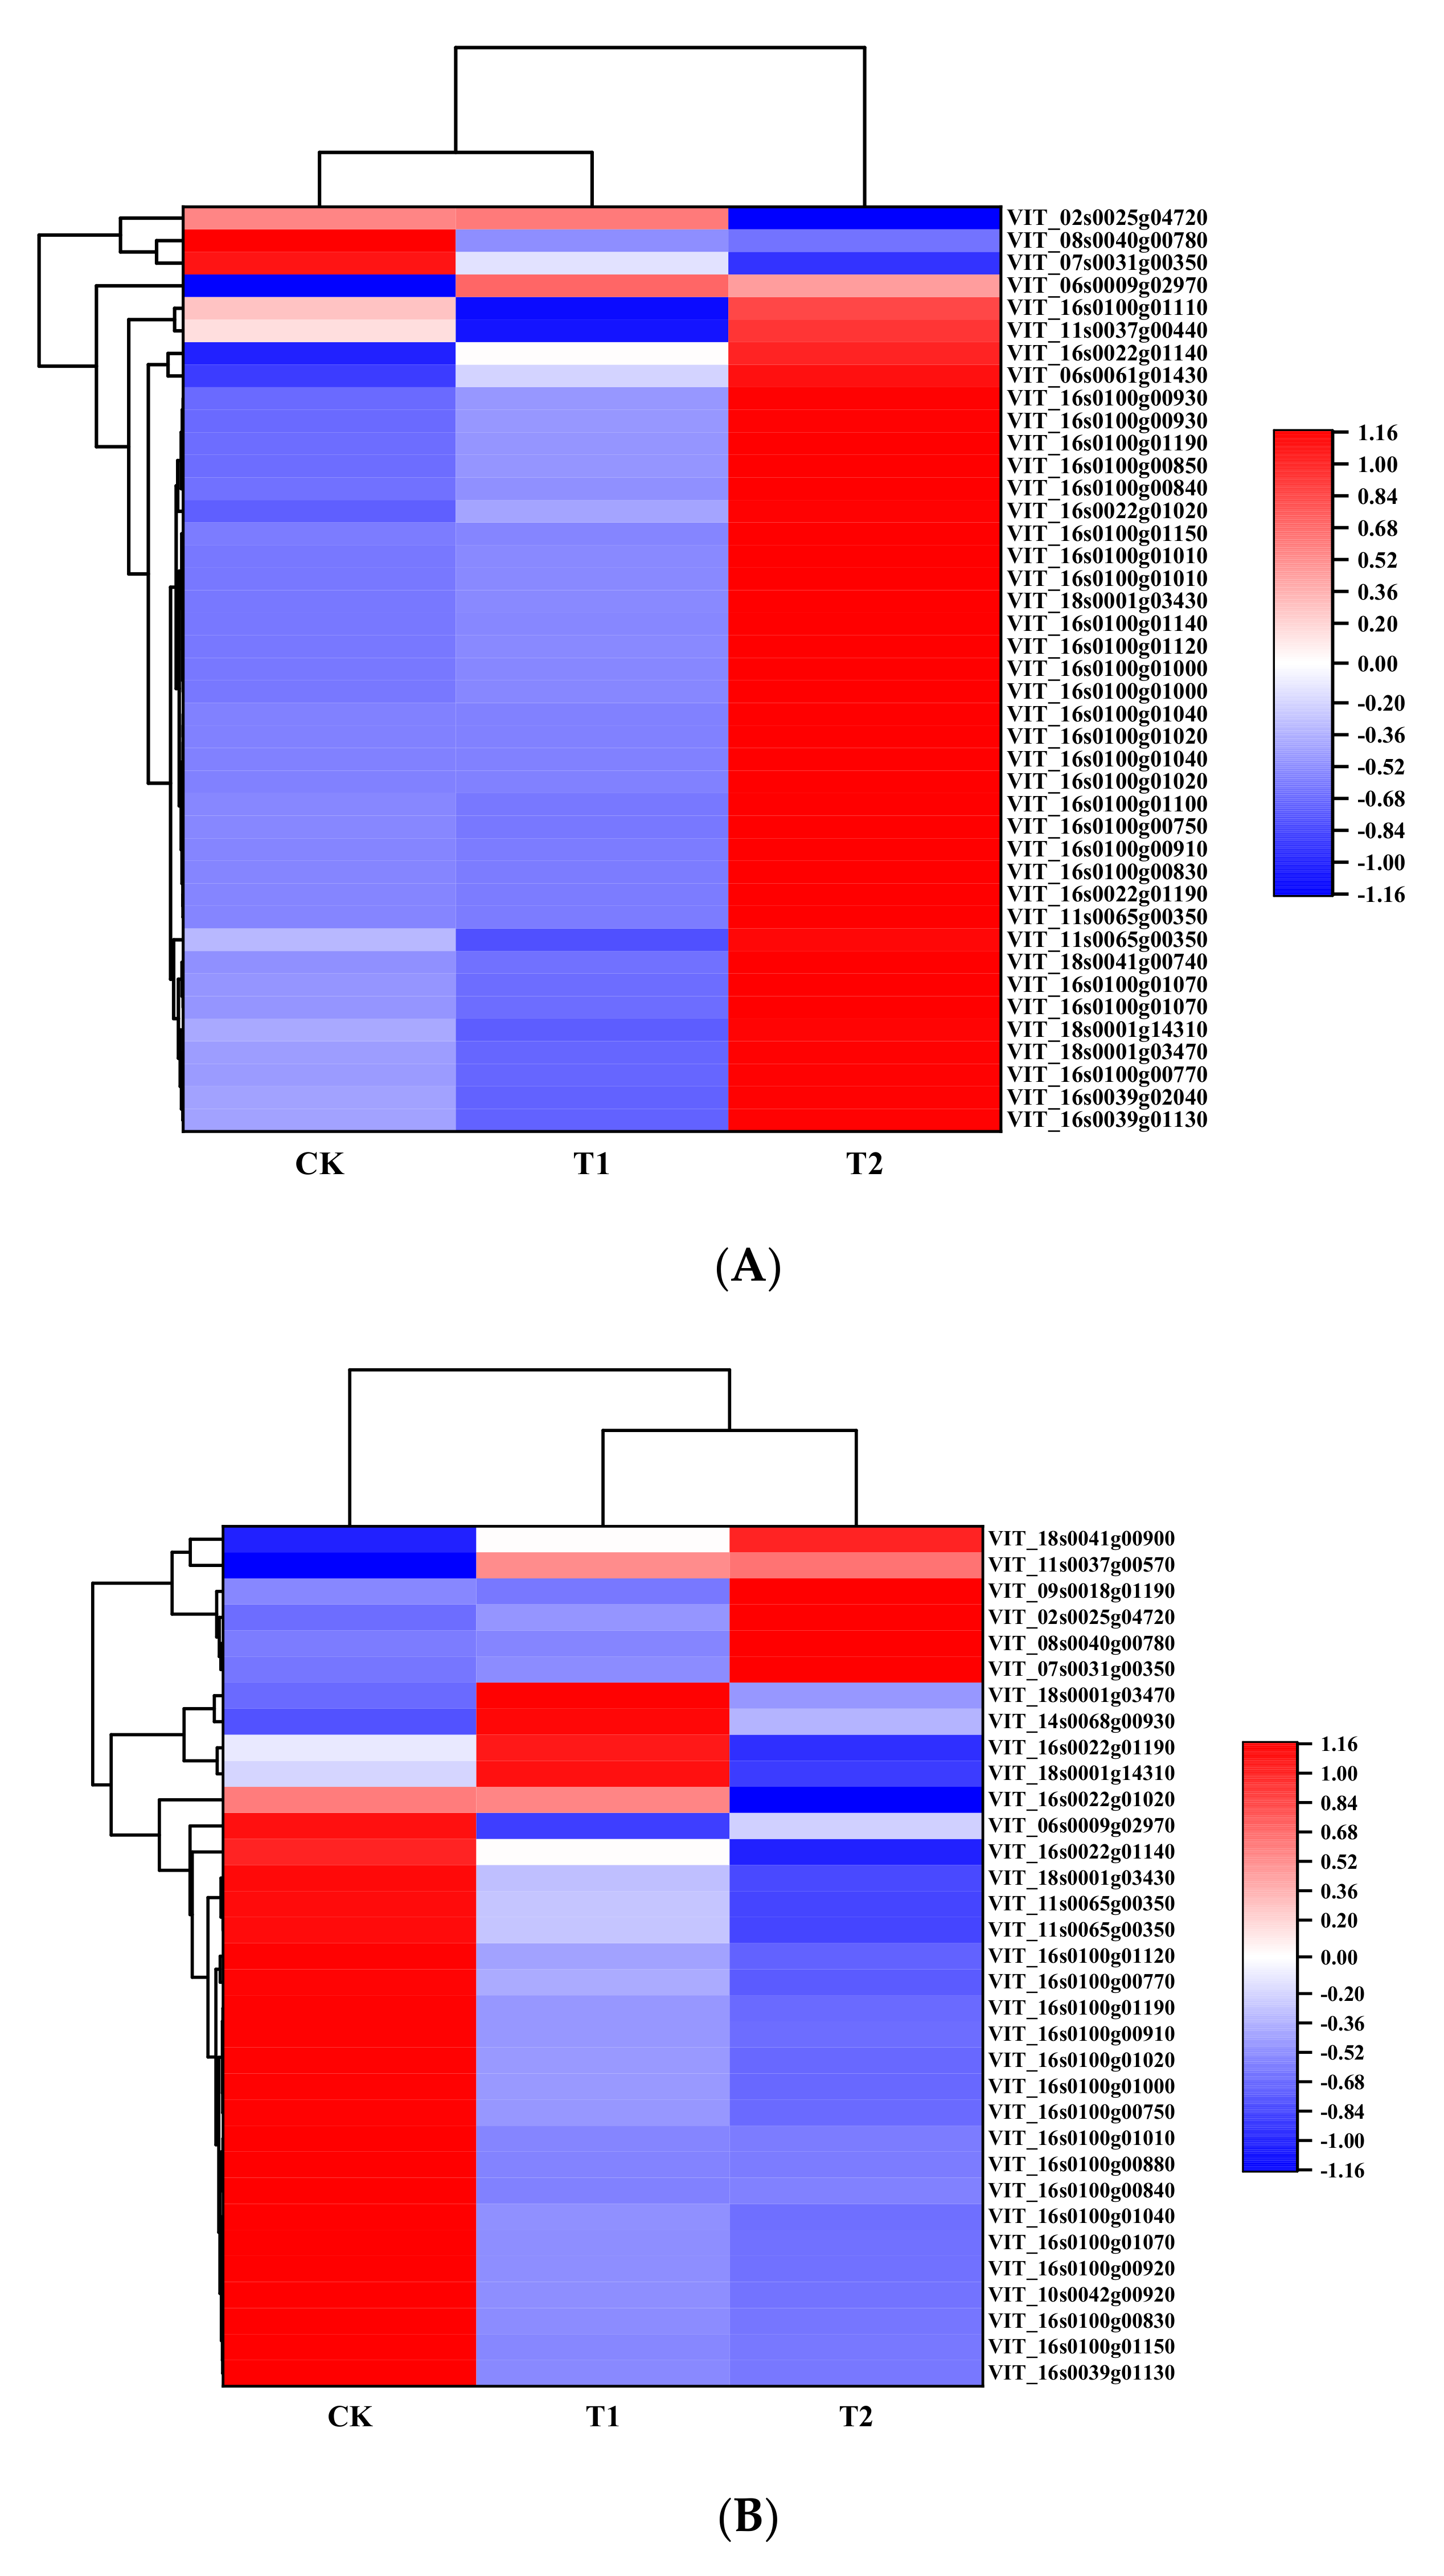
3.4. KEGG Enrichment Analysis of DEGs

The figures showed the first 20 paths with the lowest significant p values (Figure 3). In the comparison of CK vs. T2 at 90 DAFB, the top three enriched pathways were ‘flavonoid biosynthesis’, ‘circadian rhythm-plant’, and ‘photosynthesis-antenna proteins’ (Figure 3B). In the comparison of CK vs. T1, the most significantly enriched pathway was ‘galactose metabolism’, followed by ‘starch and sucrose metabolism’ and ‘flavonoid biosynthesis’ (Figure 3A). At 110 DAFB, in the comparison of CK vs. T2, the top five enriched pathways were ‘flavonoid biosynthesis’, ‘circadian rhythm-plant’, ‘photosynthesis-antenna proteins’, ‘stilbenoid, diarylheptanoid, and gingerol biosynthesis’, and ‘phenylpropanoid biosynthesis’ (Figure 3D). In the comparison of CK vs. T1, the top five were ‘circadian rhythm-plant’, ‘photosynthesis-antenna proteins’, ‘photosynthesis’, ‘flavonoid biosynthesis’, and ‘plant–pathogen interaction’ (Figure 3C). In our results, ‘flavonoid biosynthesis’ was found to be enriched in all four comparisons. The flavonoid biosynthesis pathways contained 25 upregulated DEGs and 3 downregulated DEGs in the CK vs. T2 comparison at 90 DAFB. The flavonoid biosynthesis pathways contained 7 upregulated and 22 downregulated DEGs in CK vs. T2 at 110 DAFB.

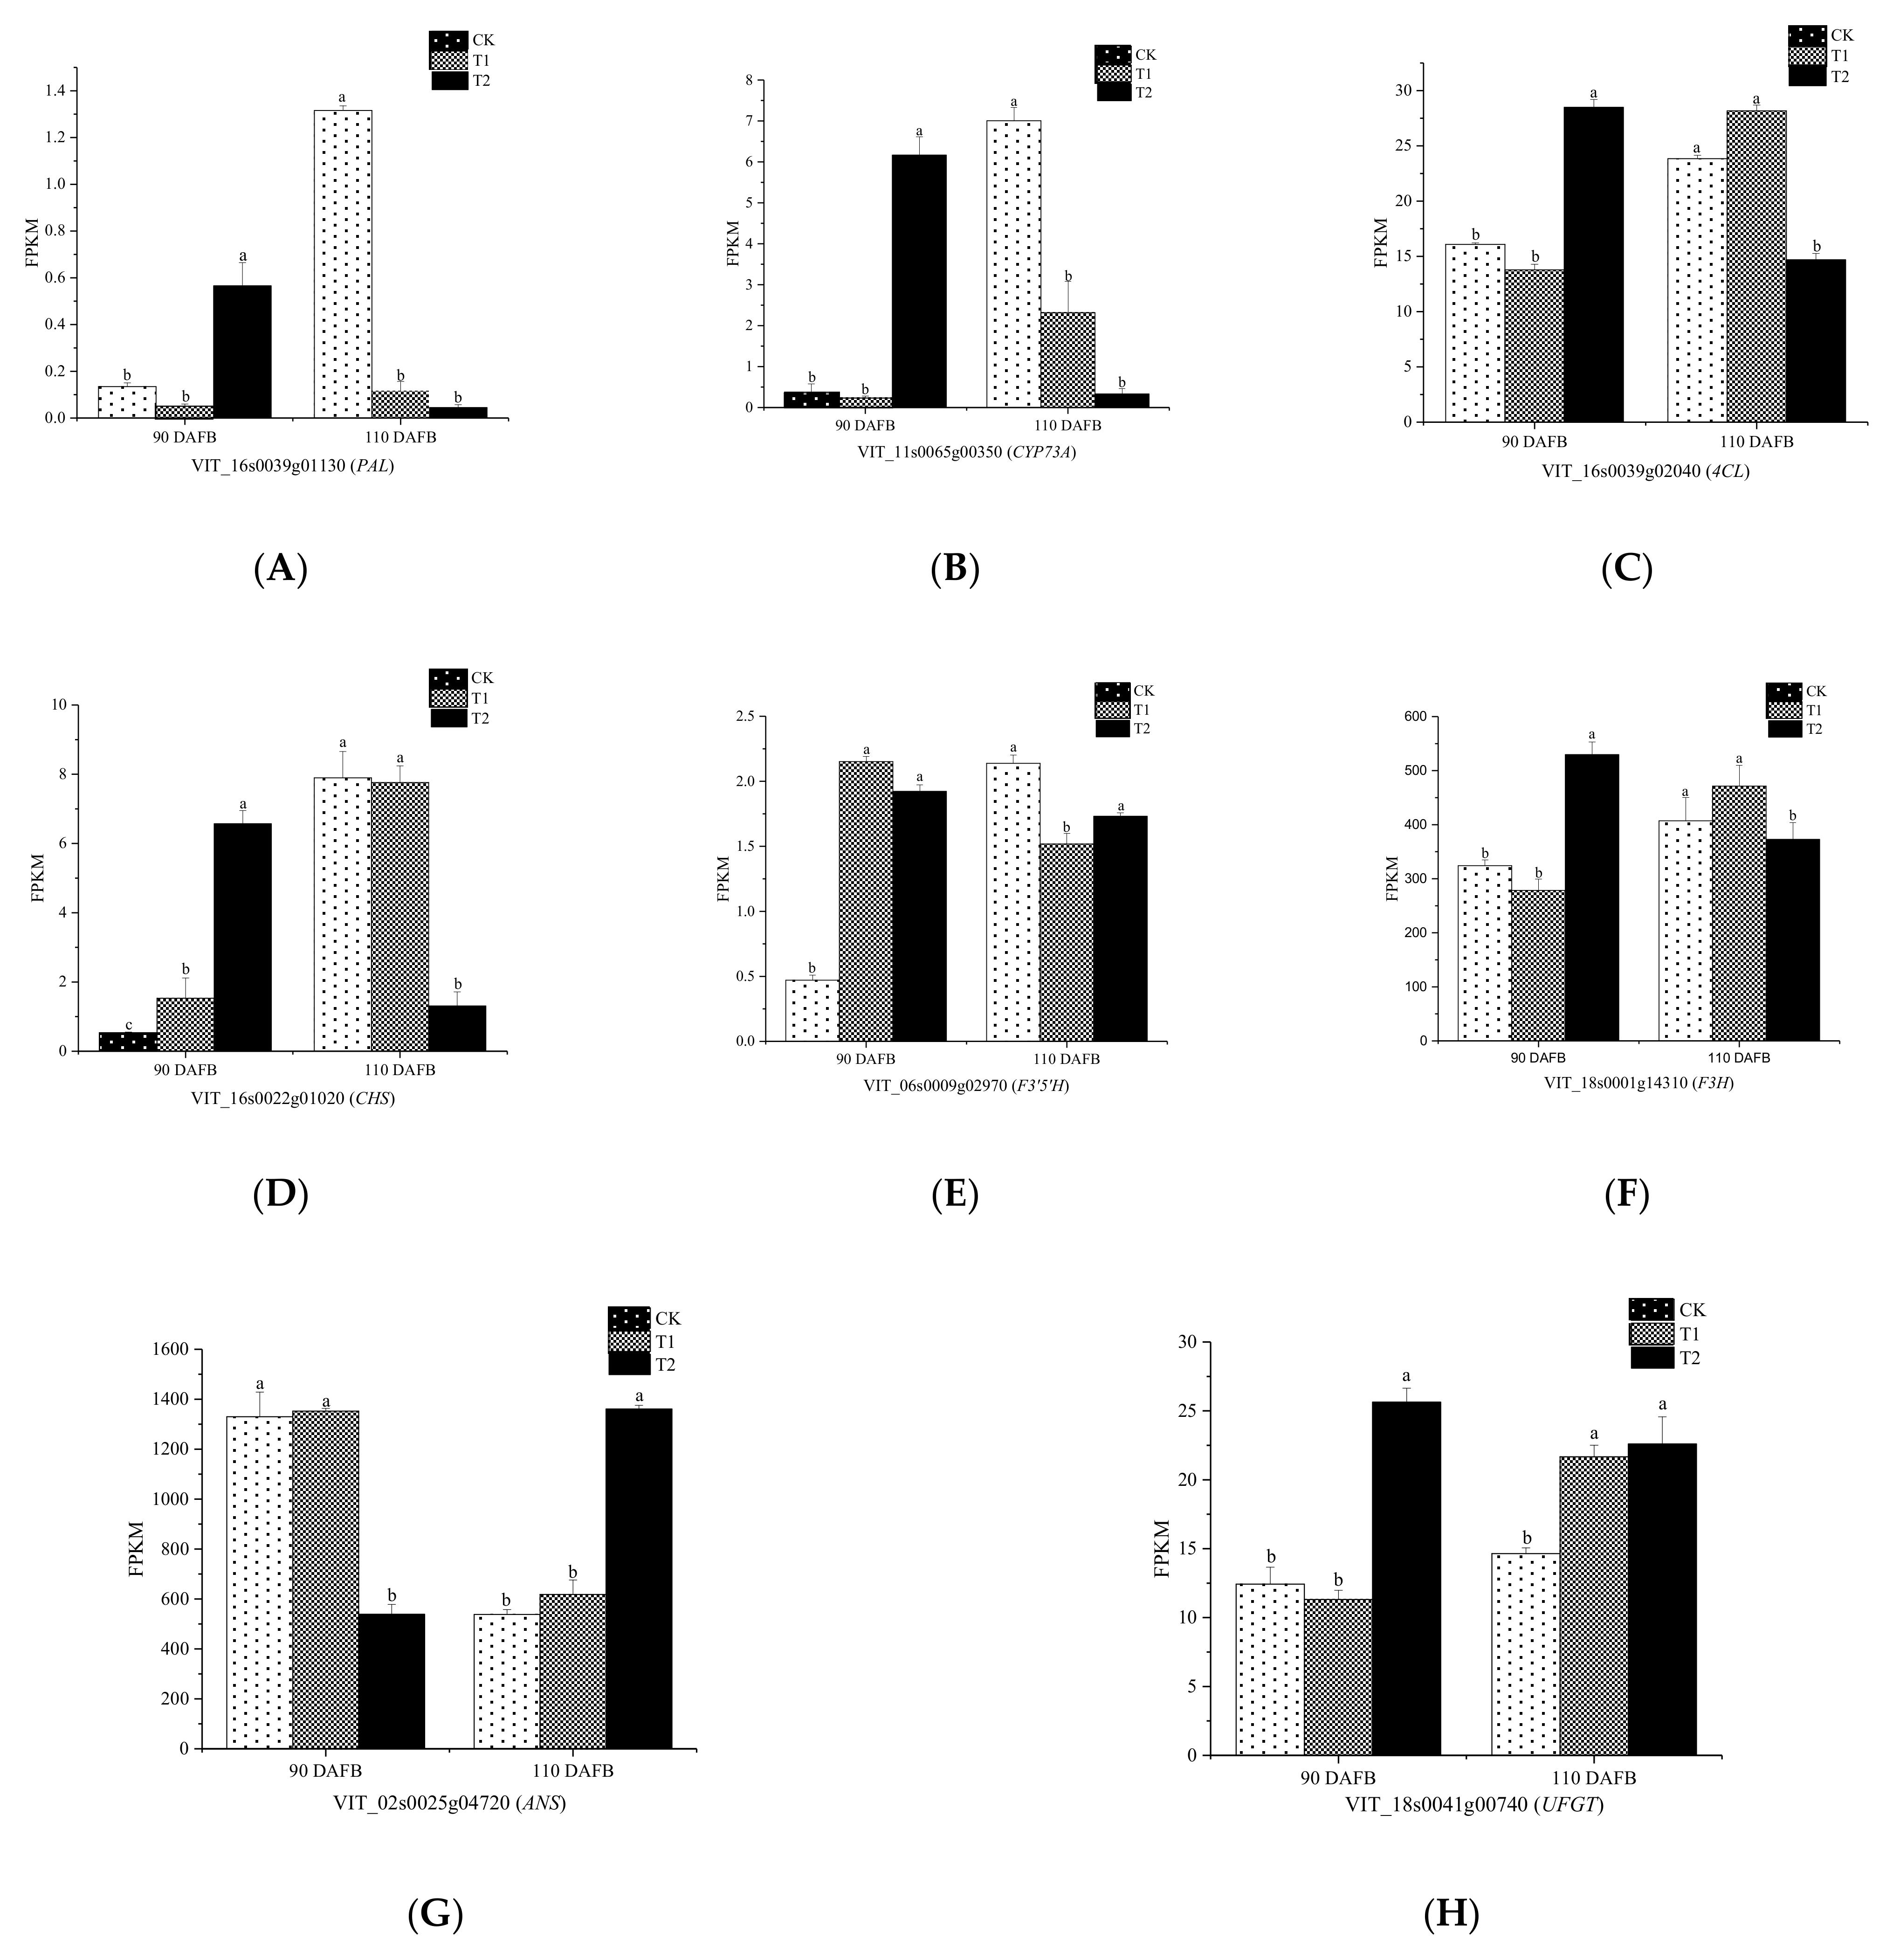
3.5. Candidate Genes Associated with the Flavonoid Biosynthesis Pathway

According to the analysis above, the different coloration in these treatments was regulated by flavonoid biosynthesis. Anthocyanins belong to the class of flavonoid compounds. In this study, 35 structural genes were identified at 90 DAFB. Of these, 30 genes were highly upregulated in T2 treatment (Figure 4A; Table S1). These 30 genes included one PAL gene, twenty-two CHS genes, one CYP73A gene, one 4CL gene, one F3H gene, one F3′5′H gene, two FLS genes, and one UGFT gene (Table S1). The expression levels of most structural genes related to flavonoid metabolic pathways were higher in the T2 treatment than in the T1 and CK treatments, leading to higher anthocyanin accumulation. Thirty-three DEGs that putatively participate in flavonoid biosynthesis were identified at 110 DAFB. Of these, 26 genes were downregulated in T2 treatment (Figure 4B; Table S2). These 26 genes included one PAL gene, nineteen CHS genes, one CYP73A gene, one 4CL gene, one F3H gene, one F3′5′H gene, one FLS gene, and one anthocyanidin 5,3-O-glucosyltransferase-like gene (Table S2).
The PAL, CYP73A, 4CL, F3H, and UFGT gene expression of grapes in the T2 treatment was significantly higher than the gene expression of grapes in the T1 and CK treatments at 90 DAFB. The lowest FPKMs of the PAL, CYP73A, 4CL, F3H, and UFGT genes were detected for the T1 treatment at 90 DAFB. The expression of the CHS gene in grapes peaked in the T2 treatment at 90 DAFB (Figure 5D). The FPKM of the F3′5′H gene in the T1 and T2 treatments was significantly higher than that in the CK treatment at 90 DAFB (Figure 5E). The FPKM of ANS was higher in the CK and T1 treatments at 90 DAFB (Figure 5G). The PAL, CYP73A, and CHS gene expression of grapes in the CK treatment was significantly higher than those in the T1 and T2 treatments at 110 DAFB. The lowest FPKMs of the PAL, CYP73A, and CHS genes were found in the T2 treatment at 110 DAFB. The expression of the 4CL and F3H genes of grapes peaked in the T1 treatment at 110 DAFB (Figure 5C,F). The lowest FPKMs of the 4CL and F3H genes were detected in the T2 treatment at 90 DAFB. The FPKM of the F3′5′H gene in the CK and T2 treatments was significantly higher than that in the T1 treatment at 90 DAFB (Figure 5E). The FPKMs of ANS and UFGT in T2 treatment were highest of three treatments at 110 DAFB (Figure 5G,H).

4. Discussion

Foliar spraying of fertilizer with P and K on grapes can accelerate the accumulation of sugars and increased solidity–acid ratio [14]. Spraying KH2PO4 or K2SO4 on the leaves of grapes promotes the growth of grape berries, with KH2PO4 having a greater effect [25]. Tomato TSS was higher in KH2PO4 sprayed plants than in CK plants [40]. Foliar KH2PO4 (0.5%) sprays improved reducing, non-reducing, and total sugars contents of kokum fruit compared to CK [41]. In our study, foliar application of K2SO4 or KH2PO4 to grape leaves increased the TSS, pH and solidity–acid ratio. The TSS content, pH, and solidity–acid ratio under the KH2PO4 treatment were the highest of the three treatments at 90 and 110 DAFB (Table 1).
Grape berries showed a decrease in L*, suggesting a reduction of lightness of color [42]. In our study, treated grape berries had significantly lower L* when compared to CK. KH2PO4 treatment of grapes resulted in a significant decrease in L* of three treatments at two stages, indicating that the berries in the KH2PO4 treated groups were darker than the CK group [43]. Lower b* values and higher a* values were detected after the K2SO4 or KH2PO4 treatments at 90 DAFB; and the berries from these groups showed higher C* values (5.65 and 6.51) than the CK group. However, the h° of T1 treatment was 22.79 and the h° of T2 treatment was 353.74 (Table 2), implying a diversion from the red towards blue color [20]. Higher b* values and lower a* values were detected after the K2SO4 and KH2PO4 treatments at 110 DAFB; and the berries from these groups showed lower C* values (3.09 and 1.90) and lower hue angle values (350.69 and 331.41) than the control group. Lower C* indicates a low color purity [42,44]. These results indicated that berries in K2SO4 and KH2PO4 treatment had purer color than those in the CK. Our research results are consistent with those of Deng et al. [45].
The immature fruits are green, which is primarily due to chlorophyll. The loss of green color has been associated with chlorophyll breakdown and is a sign of fruit ripening [46]. The chlorophyll content decreased during grape berries development and ripening [47]. In our study, total chlorophyll content of T1 and T2 decreased compared to CK at two stages (Figure 2D). This result indicates that foliar spraying of potassium fertilizer on grapes may accelerate the ripening of grape. When a large amount of anthocyanin accumulates, the grapes will be red or purple [13]. Foliar fertilization with P and K accelerated anthocyanin accumulation in grape [14]. The KH2PO4 treatment showed the highest total anthocyanins content at 90 and 110 DAFB (Figure 2B). KEGG metabolic pathway analysis revealed that flavonoid biosynthesis was the most differentially regulated process in CK vs. T2 at 90 and 110 DAFB (Figure 3B,D). Ban et al. [48] reported foliar spraying of abscisic acid increased the expression of VvPAL, VvCHS, and VvCHI genes at 7 days after treatment in ‘Kyoho’ grape berries. In the study of Deng et al., SUNRED (a biostimulant) treatments increased the expression of genes involved in anthocyanin biosynthesis pathway, such as PAL, CHI, DFR, F3H, CHS, and UFGT at 90 days after anthesis [45]. The FPKM of CHI, CHS, and F3H in ‘Summer Black’ gradually increased from 14 to 70 days after anthesis, while those of its early-ripening mutant ‘Tiangong Moyu’ increased and then decreased, reaching the highest value at 56 days after anthesis [49]. In our study, VIT_16s0039g01130 (PAL), VIT_11s0065g00350 (CYP73A), VIT_16s0039g02040 (4CL), VIT_16s0022g01020 (CHS), and VIT_18s0001g14310 (F3H) in the T2 treatment significantly increased than that in T1 and CK treatments at 90 DAFB. The PAL, CYP73A, and CHS gene expression of grapes in the CK treatment was significantly higher than those in the T1 and T2 treatments at 110 DAFB. The increase in anthocyanins was due to increase expression of key genes in the anthocyanin biosynthesis pathway, such as VvMYBA1 and VvUFGT [20]. The expression level of VIT_18s0041g00740 (UFGT) in the T2 treatment was the highest of the three treatments at two stages. Thus, these results indicated that spraying potassium fertilizer on the leaves of ‘Kyoho’ grape may accelerate anthocyanin accumulation by altering the transcript levels of PAL, CYP73A, 4CL, CHS, F3′5′H, F3H, and UFGT of the flavonoid biosynthesis and promote early ripening of grapes.

5. Conclusions

Foliar application of K2SO4 and KH2PO4 to grapes increased the TSS content, juice pH, total anthocyanin content, and CIRG at 90 and 110 DAFB. Foliar application of potassium fertilizer may accelerate anthocyanin accumulation by altering the transcript levels of PAL, CYP73A, 4CL, CHS, F3′5′H, F3H, and UFGT of the flavonoid biosynthesis. In terms of fertilizer efficiency, the relationship between the two fertilizers was KH2PO4 > K2SO4.

Supplementary Materials

The following are available online at https://www.mdpi.com/article/10.3390/agronomy11112361/s1, Table S1: Candidate structural genes related to flavonoid biosynthesis at 90 DAFB. Table S2: Candidate structural genes related to flavonoid biosynthesis at 110 DAFB.

Author Contributions

Conceptualization, L.W. and K.Y.; data curation, L.W. and B.Z.; formal analysis, P.L.; funding acquisition, K.Y.; investigation, X.B.; methodology, L.W. and P.L.; project administration, P.L. and H.J.; supervision, F.Z.; visualization, L.W.; writing—original draft, L.W.; writing—review and editing, F.O.P., K.Y. and J.F. All authors have read and agreed to the published version of the manuscript.

Funding

This research was funded by the National Key Research and Development Program (2018YFD1000200), the Natural Science Foundation of China (31760550) and the Transformation Project of Scientific and Technological Achievements of the Xinjiang Production and Construction Corps (2020BA006). Innovative Top Talents Project of Shihezi University (CXBJ202002).

Institutional Review Board Statement

Not applicable.

Informed Consent Statement

Not applicable.

Conflicts of Interest

The authors declare no conflict of interest.

References

  1. Yang, B.; He, S.; Liu, Y.; Liu, B.; Ju, Y.; Kang, D.; Sun, X.; Fang, Y. Transcriptomics integrated with metabolomics reveals the effect of regulated deficit irrigation on anthocyanin biosynthesis in Cabernet Sauvignon grape berries. Food Chem. 2020, 314, 126170. [Google Scholar] [CrossRef]
  2. Conesa, M.R.; Falagán, N.; Rosa, J.M.D.L.; Aguayo, E.; Domingo, R.; Pastor, A.P. Post-veraison deficit irrigation regimes enhance berry coloration and health-promoting bioactive compounds in ‘Crimson Seedless’ table grapes. Agric. Water Manag. 2016, 163, 9–18. [Google Scholar] [CrossRef]
  3. Ding, S.; Che, C.; Xu, Z.; Du, X.; Li, J.; Li, J.-Q.; Xiao, Y.; Qin, Z. The effect of a novel powerful ABA mimic on the improvement of color in grapes and its mechanism. bioRxiv 2020. [Google Scholar] [CrossRef] [Green Version]
  4. Soubeyrand, E.; Basteau, C.; Hilbert, G.; van Leeuwen, C.; Delrot, S.; Gomes, E. Nitrogen supply affects anthocyanin biosynthetic and regulatory genes in grapevine cv. Cabernet-Sauvignon berries. Phytochemistry 2014, 103, 38–49. [Google Scholar] [CrossRef]
  5. Ren, Z.; Qiu, F.; Wang, Y.; Yu, W.; Liu, C.; Sun, Y.; Wang, Y.; Zhang, X.; Xing, S.; Tao, S.; et al. Network Analysis of Transcriptome and LC-MS Reveals a Possible Biosynthesis Pathway of Anthocyanins in Dendrobium officinale. Biomed. Res. Int. 2020, 2020, 6512895. [Google Scholar] [CrossRef]
  6. Kim, Y.; Je, Y. Flavonoid intake and mortality from cardiovascular disease and all causes: A meta-analysis of prospective cohort studies. Clin. Nutr. ESPEN 2017, 20, 68–77. [Google Scholar] [CrossRef]
  7. Wang, Q.; Zheng, H.; Gao, S.; Li, H.; Tao, J. Transcriptomic analysis of berry development and a corresponding analysis of anthocyanin biosynthesis in teinturier grape. J. Plant Interact. 2019, 14, 617–629. [Google Scholar] [CrossRef]
  8. Zhao, J.; Dixon, R.A. The ‘ins’ and ‘outs’ of flavonoid transport. Trends Plant Sci. 2010, 15, 72–80. [Google Scholar] [CrossRef] [PubMed] [Green Version]
  9. Jeong, S.T.; Goto-Yamamoto, N.; Hashizume, K.; Esaka, M. Expression of the flavonoid 3′-hydroxylase and flavonoid 3′, 5′-hydroxylase genes and flavonoid composition in grape (Vitis vinifera). Plant Sci. 2006, 170, 61–69. [Google Scholar] [CrossRef]
  10. Premathilake, A.T.; Ni, J.; Shen, J.; Bai, S.; Teng, Y. Transcriptome analysis provides new insights into the transcriptional regulation of methyl jasmonate-induced flavonoid biosynthesis in pear calli. BMC Plant Biol. 2020, 20, 388. [Google Scholar] [CrossRef]
  11. Dong, W.; Li, M.; Li, Z.; Li, S.; Zhu, Y.; Xu, H.; Wang, Z. Transcriptome analysis of the molecular mechanism of Chrysanthemum flower color change under short-day photoperiods. Plant Physiol. Biochem. 2020, 146, 315–328. [Google Scholar] [CrossRef]
  12. Yue, J.; Zhu, C.; Zhou, Y.; Niu, X.; Miao, M.; Tang, X.; Chen, F.; Zhao, W.; Liu, Y. Transcriptome analysis of differentially expressed unigenes involved in flavonoid biosynthesis during flower development of Chrysanthemum morifolium ‘Chuju’. Sci. Rep. 2018, 8, 13414. [Google Scholar] [CrossRef] [PubMed] [Green Version]
  13. Ali, M.B.; Howard, S.; Chen, S.; Wang, Y.; Yu, O.; Kovacs, L.G.; Qiu, W. Berry skin development in Norton grape: Distinct patterns of transcriptional regulation and flavonoid biosynthesis. BMC Plant Biol. 2011, 11, 7. [Google Scholar] [CrossRef] [Green Version]
  14. Topalovic, A.; Slatnar, A.; Stampar, F.; Knezevic, M.; Veberic, R. Influence of foliar fertilization with P and K on chemical constituents of grape cv. ‘Cardinal’. J. Agric. Food Chem. 2011, 59, 10303–10310. [Google Scholar] [CrossRef]
  15. Souri, M.K.; Dehnavard, S. Tomato plant growth, leaf nutrient concentrations and fruit quality under nitrogen foliar applications. Adv. Hort. Sci. 2018, 32, 41–47. [Google Scholar]
  16. Nong, M.; Chen, J.; Gan, W.; Pan, L.; Xing, Y.; Liu, Y. Effects of Amino Acid Selenium Foliar Fertilizer on Selenium Content and Quality of Mango. Agric. Biotech. 2020, 9, 92–94. [Google Scholar]
  17. Shi, P.; Song, C.; Chen, H.; Duan, B.; Zhang, Z.; Meng, J. Foliar applications of iron promote flavonoids accumulation in grape berry of Vitis vinifera cv. Merlot grown in the iron deficiency soil. Food Chem. 2018, 253, 164–170. [Google Scholar] [CrossRef]
  18. Román, S.M.-S.; Garde-Cerdán, T.; Baroja, E.; Rubio-Bretón, P.; Pérez-Álvarez, E.P. Foliar application of phenylalanine plus methyl jasmonate as a tool to improve Grenache grape aromatic composition. Sci. Hortic. 2020, 272, 109515. [Google Scholar] [CrossRef]
  19. Yamamoto, L.Y.; Marinho de Assis, A.; Roberto, S.R.; Bovolenta, Y.R.; Nixdorf, S.L.; García-Romero, E.; Gómez-Alonso, S.; Hermosín-Gutiérrez, I. Application of abscisic acid (S-ABA) to cv. Isabel grapes (Vitis vinifera × Vitis labrusca) for color improvement: Effects on color, phenolic composition and antioxidant capacity of their grape juice. Food Res. Int. 2015, 77, 572–583. [Google Scholar] [CrossRef]
  20. Olivares, D.; Contreras, C.; Muñoz, V.; Rivera, S.; González-Agüero, M.; Retamales, J.; Defilippi, B.G. Relationship among color development, anthocyanin and pigment-related gene expression in ‘Crimson Seedless’ grapes treated with abscisic acid and sucrose. Plant Physiol. Bioch. 2017, 115, 286–297. [Google Scholar] [CrossRef]
  21. Aslani, M.; Souri, M.K. Beneficial effects of foliar application of organic chelate fertilizers on French bean production under field conditions in a calcareous soil. AHS 2018, 32, 265–272. [Google Scholar]
  22. Sekhon, N.K.; Singh, C.B. Plant Nutrient Status during Boll Development and Seed Cotton Yield as Affected by Foliar Application of Different Sources of Potassium. AJPS 2013, 4, 1409–1417. [Google Scholar] [CrossRef] [Green Version]
  23. Zareei, E.; Javadi, T.; Aryal, R. Biochemical composition and antioxidant activity affected by spraying potassium sulfate in black grape (Vitis vinifera L. cv. Rasha). J. Sci. Food. Agri. 2018, 98, 5632–5638. [Google Scholar] [CrossRef]
  24. Haldankar, P.M.; Thorat, V.; Mayekar, A.J.; Khirsagar, P.J.; Korake, G.N.; Khandekar, R.G. Effect of paclobutrazol and post flowering foliar sprays of nutrients for accelerating harvesting of jackfruit. Indian. J. Hortic. 2014, 71, 476–480. [Google Scholar]
  25. Li, A.; Gui, M.; Wang, M.; Liu, Z. Effects of foliar application of NaH2PO4, K2SO4 and KH2PO4 on Expression of Genes Related to Phosphorus and Potassium Assimilate in Grape. MPB 2018, 16, 5415–5426. [Google Scholar]
  26. Ben Rejeb, I.; Dhen, N.; Kassebi, S.; Gargouri, M.; Roussis, I.G. Quality Evaluation and Functional Properties of Reduced Sugar Jellies Formulated from Citrus Fruits. J. Chem. 2020, 2020, 5476872. [Google Scholar] [CrossRef]
  27. Mikulic-Petkovsek, M.; Skvarc, A.; Rusjan, D. Biochemical composition of different table grape cultivars produced in Slovenia. J. Hortic. Sci. Biotech. 2019, 94, 368–377. [Google Scholar] [CrossRef]
  28. Carreño, J.; Martínez, A.; Almela, L.; Fernández-López, J.A. Measuring the color of table grapes. Res. Appl. 1996, 21, 50–54. [Google Scholar]
  29. Jiang, W.; Na, L.; Dapeng, Z.; Lyndel, M.; Bing, C.; Yuanjing, L.; Lihua, S. Elevated temperature and drought stress significantly affect fruit quality and activity of anthocyanin-related enzymes in jujube (Ziziphus jujuba Mill. cv. ‘Lingwuchangzao’). PLoS ONE 2020, 15, e0241491. [Google Scholar]
  30. Guo, Y.; Bai, J.; Duan, X.; Wang, J. Accumulation characteristics of carotenoids and adaptive fruit color variation in ornamental pepper. Sci. Hortic. 2021, 275, 109699. [Google Scholar] [CrossRef]
  31. Haider, M.S.; Kurjogi, M.M.; Khalil-Ur-Rehman, M.; Fiaz, M.; Pervaiz, T.; Jiu, S.; Haifeng, J.; Chen, W.; Fang, J. Grapevine immune signaling network in response to drought stress as revealed by transcriptomic analysis. Plant Physiol. Biochem. 2017, 121, 187–195. [Google Scholar] [CrossRef] [PubMed]
  32. Yu, J.; Zhu, M.; Wang, M.; Xu, Y.; Chen, W.; Yang, G. Transcriptome analysis of calcium-induced accumulation of anthocyanins in grape skin. Sci. Hortic. 2020, 260, 108871. [Google Scholar] [CrossRef]
  33. Trapnell, C.; Pachter, L.; Salzberg, S.L. TopHat: Discovering splice junctions with RNA-Seq. Bioinformatics 2009, 25, 1105–1111. [Google Scholar] [CrossRef]
  34. Fu, L.; Niu, B.; Zhu, Z.; Wu, S.; Li, W. CD-HIT: Accelerated for clustering the next-generation sequencing data. Bioinformatics 2012, 28, 3150–3152. [Google Scholar] [CrossRef]
  35. Yao, Q.; Huang, H.; Tong, Y.; Tong, E.; Gao, L. Transcriptome Analysis Identifies Candidate Genes Related to Triacylglycerol and Pigment Biosynthesis and Photoperiodic Flowering in the Ornamental and Oil-Producing Plant, Camellia reticulata (Theaceae). Front. Plant. Sci. 2016, 7, 163. [Google Scholar] [CrossRef] [PubMed] [Green Version]
  36. Varet, H.; Brillet-Guéguen, L.; Coppée, J.-Y.; Dillies, M.-A. SARTools: A DESeq2- and EdgeR-Based R Pipeline for Comprehensive Differential Analysis of RNA-Seq Data. PLoS ONE 2016, 11, e0157022. [Google Scholar] [CrossRef] [Green Version]
  37. Young, M.D.; Wakefield, M.J.; Smyth, G.K.; Oshlack, A. Gene ontology analysis for RNA-seq: Accounting for selection bias. Genome Biol. 2010, 11, 161–476. [Google Scholar] [CrossRef] [Green Version]
  38. Minoru, K.; Michihiro, A.; Susumu, G.; Masahiro, H.; Mika, H.; Masumi, I.; Toshiaki, K.; Shuichi, K.; Shujiro, O.; Toshiaki, T.; et al. KEGG for linking genomes to life and the environment. Narnia 2008, 36 (Suppl. 1), D480–D484. [Google Scholar]
  39. Mao, X.; Cai, T.; Wei, L. Automated genome annotation and pathway identification using the KEGG Orthology (KO) as a controlled vocabulary. Bioinformatics 2005, 21, 7. [Google Scholar] [CrossRef]
  40. Chapagain, B.P.; Wiesman, Z. Effect of Nutri-Vant-PeaK foliar spray on plant development, yield, and fruit quality in greenhouse tomatoes. Sci. Hortic. 2003, 102, 177–188. [Google Scholar] [CrossRef]
  41. Haldankar, P.M.; Somavanshi, A.V. Studies on the effect of foliar sprays of nutrients after fruit set on harvesting, yield and quality of kokum (Garcinia indica Choisy). Indian J. Hortic. 2015, 72, 38–42. [Google Scholar] [CrossRef]
  42. Ferrara, G.; Mazzeo, A.; Matarrese, A.M.S.; Pacucci, C.; Pacifico, A.; Gambacorta, G.; Faccia, M.; Trani, A.; Gallo, V.; Cafagna, I.; et al. Application of Abscisic Acid (S-ABA) to ‘Crimson Seedless’ Grape Berries in a Mediterranean Climate: Effects on Color, Chemical Characteristics, Metabolic Profile, and S-ABA Concentration. J. Plant. Growth Regul. 2013, 32, 491–505. [Google Scholar] [CrossRef]
  43. Chen, H.; Yang, J.; Deng, X.; Lei, Y.; Xie, S.; Guo, S.; Ren, R.; Li, J.; Zhang, Z.; Xu, T. Foliar-sprayed manganese sulfate improves flavonoid content in grape berry skin of Cabernet Sauvignon (Vitis vinifera L.) growing on alkaline soil and wine chromatic characteristics. Food Chem. 2020, 314, 126182. [Google Scholar] [CrossRef]
  44. Shahab, M.; Roberto, S.R.; Ahmed, S.; Colombo, R.C.; Silvestre, J.P.; Koyama, R.; Souza, R.T.D. Relationship between anthocyanins and skin color of table grapes treated with abscisic acid at different stages of berry ripening. Sci. Hortic. 2020, 259, 108859. [Google Scholar] [CrossRef]
  45. Deng, Q.; Xia, H.; Lin, L.; Wang, J.; Yuan, L.; Li, K.; Zhang, J.; Lv, X.; Liang, D. SUNRED, a natural extract-based biostimulant, application stimulates anthocyanin production in the skins of grapes. Sci. Rep. 2019, 9, 2590. [Google Scholar] [CrossRef] [PubMed] [Green Version]
  46. Hornero-Méndez, D.; de Gómez-Ladrón Guevara, R.; Mínguez-Mosquera, M.I. Carotenoid biosynthesis changes in five red pepper (Capsicum annuum L.) cultivars during ripening. Cultivar selection for breeding. J. Agric. Food Chem. 2000, 48, 3857–3864. [Google Scholar] [CrossRef]
  47. Fernández-López, J.A.; Almela, L.; Muñoz, J.A.; Hidalgo, V.; Carreño, J. Dependence between colour and individual anthocyanin content in ripening grapes. Food Res. Int. 1998, 31, 667–672. [Google Scholar] [CrossRef]
  48. Ban, T.; Ishimaru, M.; Kobayashi, S.; Goto-Yamamoto, N.; Horiuchi, S. Abscisic acid and 2,4-dichlorophenoxyacetic acid affect the expression of anthocyanin biosynthetic pathway genes in ‘Kyoho’ grape berries. J. Hortic. Sci. Biotech. 2015, 78, 586–589. [Google Scholar] [CrossRef]
  49. Wei, L.; Cao, Y.; Cheng, J.; Xiang, J.; Shen, B.; Wu, J. Comparative transcriptome analyses of a table grape ‘Summer Black’ and its early-ripening mutant ‘Tiangong Moyu’ identify candidate genes potentially involved in berry development and ripening. J. Plant Interact. 2020, 15, 213–222. [Google Scholar] [CrossRef]
Figure 1. Visual color of ‘Kyoho’ grape berries at two stages.
Agronomy 11 02361 g001
Figure 2. Some pigment contents in the ‘Kyoho’ grape skin under different potassium fertilizer treatments. (A) Content of flavonoid. (B) Content of total anthocyanin. (C) Content of total carotenoid. (D) Content of total chlorophyll. Each value represents the mean ± SD for three biological replicate samples. Error bars represent SD. Bars labeled with different letters in the same period indicate significant difference between treatments.
Agronomy 11 02361 g002aAgronomy 11 02361 g002b
Figure 3. The top 20 enriched KEGG pathways of DEGs. (A) CK vs. T1 at 90 DAFB; (B) CK vs. T2 at 90 DAFB; (C) CK vs. T1 at 110 DAFB; (D) CK vs. T2 at 110 DAFB. The circle size represents the number of DEGs detected in the KEGG pathway. The rich factor is the ratio of DEGs to the total background gene number in each pathway.
Agronomy 11 02361 g003
Figure 4. Expression pattern of differentially expressed genes (DEGs) involved in flavonoid synthesis. (A) Candidate structural genes related to flavonoid biosynthesis at 90 DAFB. (B) Candidate structural genes related to flavonoid biosynthesis at 110 DAFB. The Z-score value is represented by the depth of color, with red representing upregulation and blue representing downregulation.
Agronomy 11 02361 g004
Figure 5. The expression analysis of key genes for flavonoid biosynthesis in grape berries under different potassium fertilizer treatments at two stages. Expression of the PAL (A), CYP73A (B), 4CL (C), CHS (D), F3′5′H (E), F3H (F), ANS (G), and UFGT (H) genes, which are associated with flavonoid biosynthesis in grape skins. Values presented are the means ± SD (n ≥ 3). Error bars represent SD. Bars labeled with different letters in the same period indicate significant difference between treatments. PAL: phenylalanine ammonia-lyase, CYP73A: cytochrome P450 CYP73A100, 4CL: 4-coumarate: CoA ligase, CHS: chalcone synthase, F3′5′H: flavonoid-3′5′-hydroxylase, F3H: flavanone 3-dioxygenase-like, ANS: leucoanthocyanidin dioxygenase, UFGT: UDP glucose: flavonoid 3-o-glucosyl transferase.
Agronomy 11 02361 g005
Table 1. Physicochemical indexes in ‘Kyoho’ grape berries under different potassium fertilizer treatments.
TreatmentTotal Soluble Solids (%)Titratable Acid (%)Solidity–Acid RatiopH
CK14.20 ± 0.76 b0.66 ± 0.05 a21.43 ± 0.25 c3.34 ± 0.01 c
90 DAFBT113.80 ± 0.15 b0.51 ± 0.02 b27.19 ± 0.19 b3.42 ± 0.02 b
T214.90 ± 0.39 a0.34 ± 0.01 c44.15 ± 0.22 a3.75 ± 0.01 a
CK17.40 ± 0.43 b0.35 ± 0.01 a50.07 ± 0.43 c3.52 ± 0.01 c
110 DAFBT117.80 ± 0.60 ab0.28 ± 0.06 b64.14 ± 0.16 b3.86 ± 0.02 b
T218.10 ± 0.08 a0.24 ± 0.01 c74.64 ± 0.28 a3.95 ± 0.03 a
Values presented are the means ± standard deviation (SD) (n ≥ 3). Different lowercase letters in the same row indicate significant differences between treatments as calculated by Duncan’s test (p < 0.05).
Table 2. The chromaticity values of the ‘Kyoho’ grape berries under different potassium fertilizer treatments.
90 DAFB 110 DAFB
CKT1T2CKT1T2
L*33.39 ± 0.90 a30.65 ± 1.42 b29.02 ± 0.93 c27.18 ± 1.10 a26.73 ± 0.18 b26.54 ± 0.62 b
a*3.77 ± 1.16 b5.21 ± 0.64 a6.47 ± 0.82 a4.37 ± 0.76 a3.05 ± 1.63 b1.67 ± 0.51 c
b*3.12 ± 1.24 a2.19 ± 0.73 b−0.71 ± 0.39 c−0.45 ± 0.11 a−0.50 ± 0.13 b−0.91 ± 0.23 a
C*4.89 ± 0.42 b5.65 ± 0.56 a6.51 ± 0.80 a4.39 ± 0.77 a3.09 ± 1.58 b1.90 ± 0.48 c
39.61 ± 2.54 b22.79 ± 1.29 b353.74 ± 10.33 a354.12 ± 11.24 a350.69 ± 5.67 ab331.41 ± 7.86 b
CIRG3.67 ± 0.54 c4.33 ± 0.57 b5.24 ± 0.87 a5.88 ± 0.23 c6.34 ± 0.56 b7.60 ± 1.21 a
L*: lightness; The a* value is negative for green and positive for red; The b* value is negative for blue and positive for yellow; C*: chroma values; h°: hue angle; CIRG: color index of red grape. Values presented are the means ± SD (n ≥ 3). Different lowercase letters in the same line indicate significant differences between treatments as calculated by Duncan’s test (p < 0.05).
Publisher’s Note: MDPI stays neutral with regard to jurisdictional claims in published maps and institutional affiliations.

