
Quantification of Urban Patterns and Processes through Space and Time Using Remote Sensing Data: A Comparative Study between Three Saudi Arabian Cities


Abstract
:1. Introduction
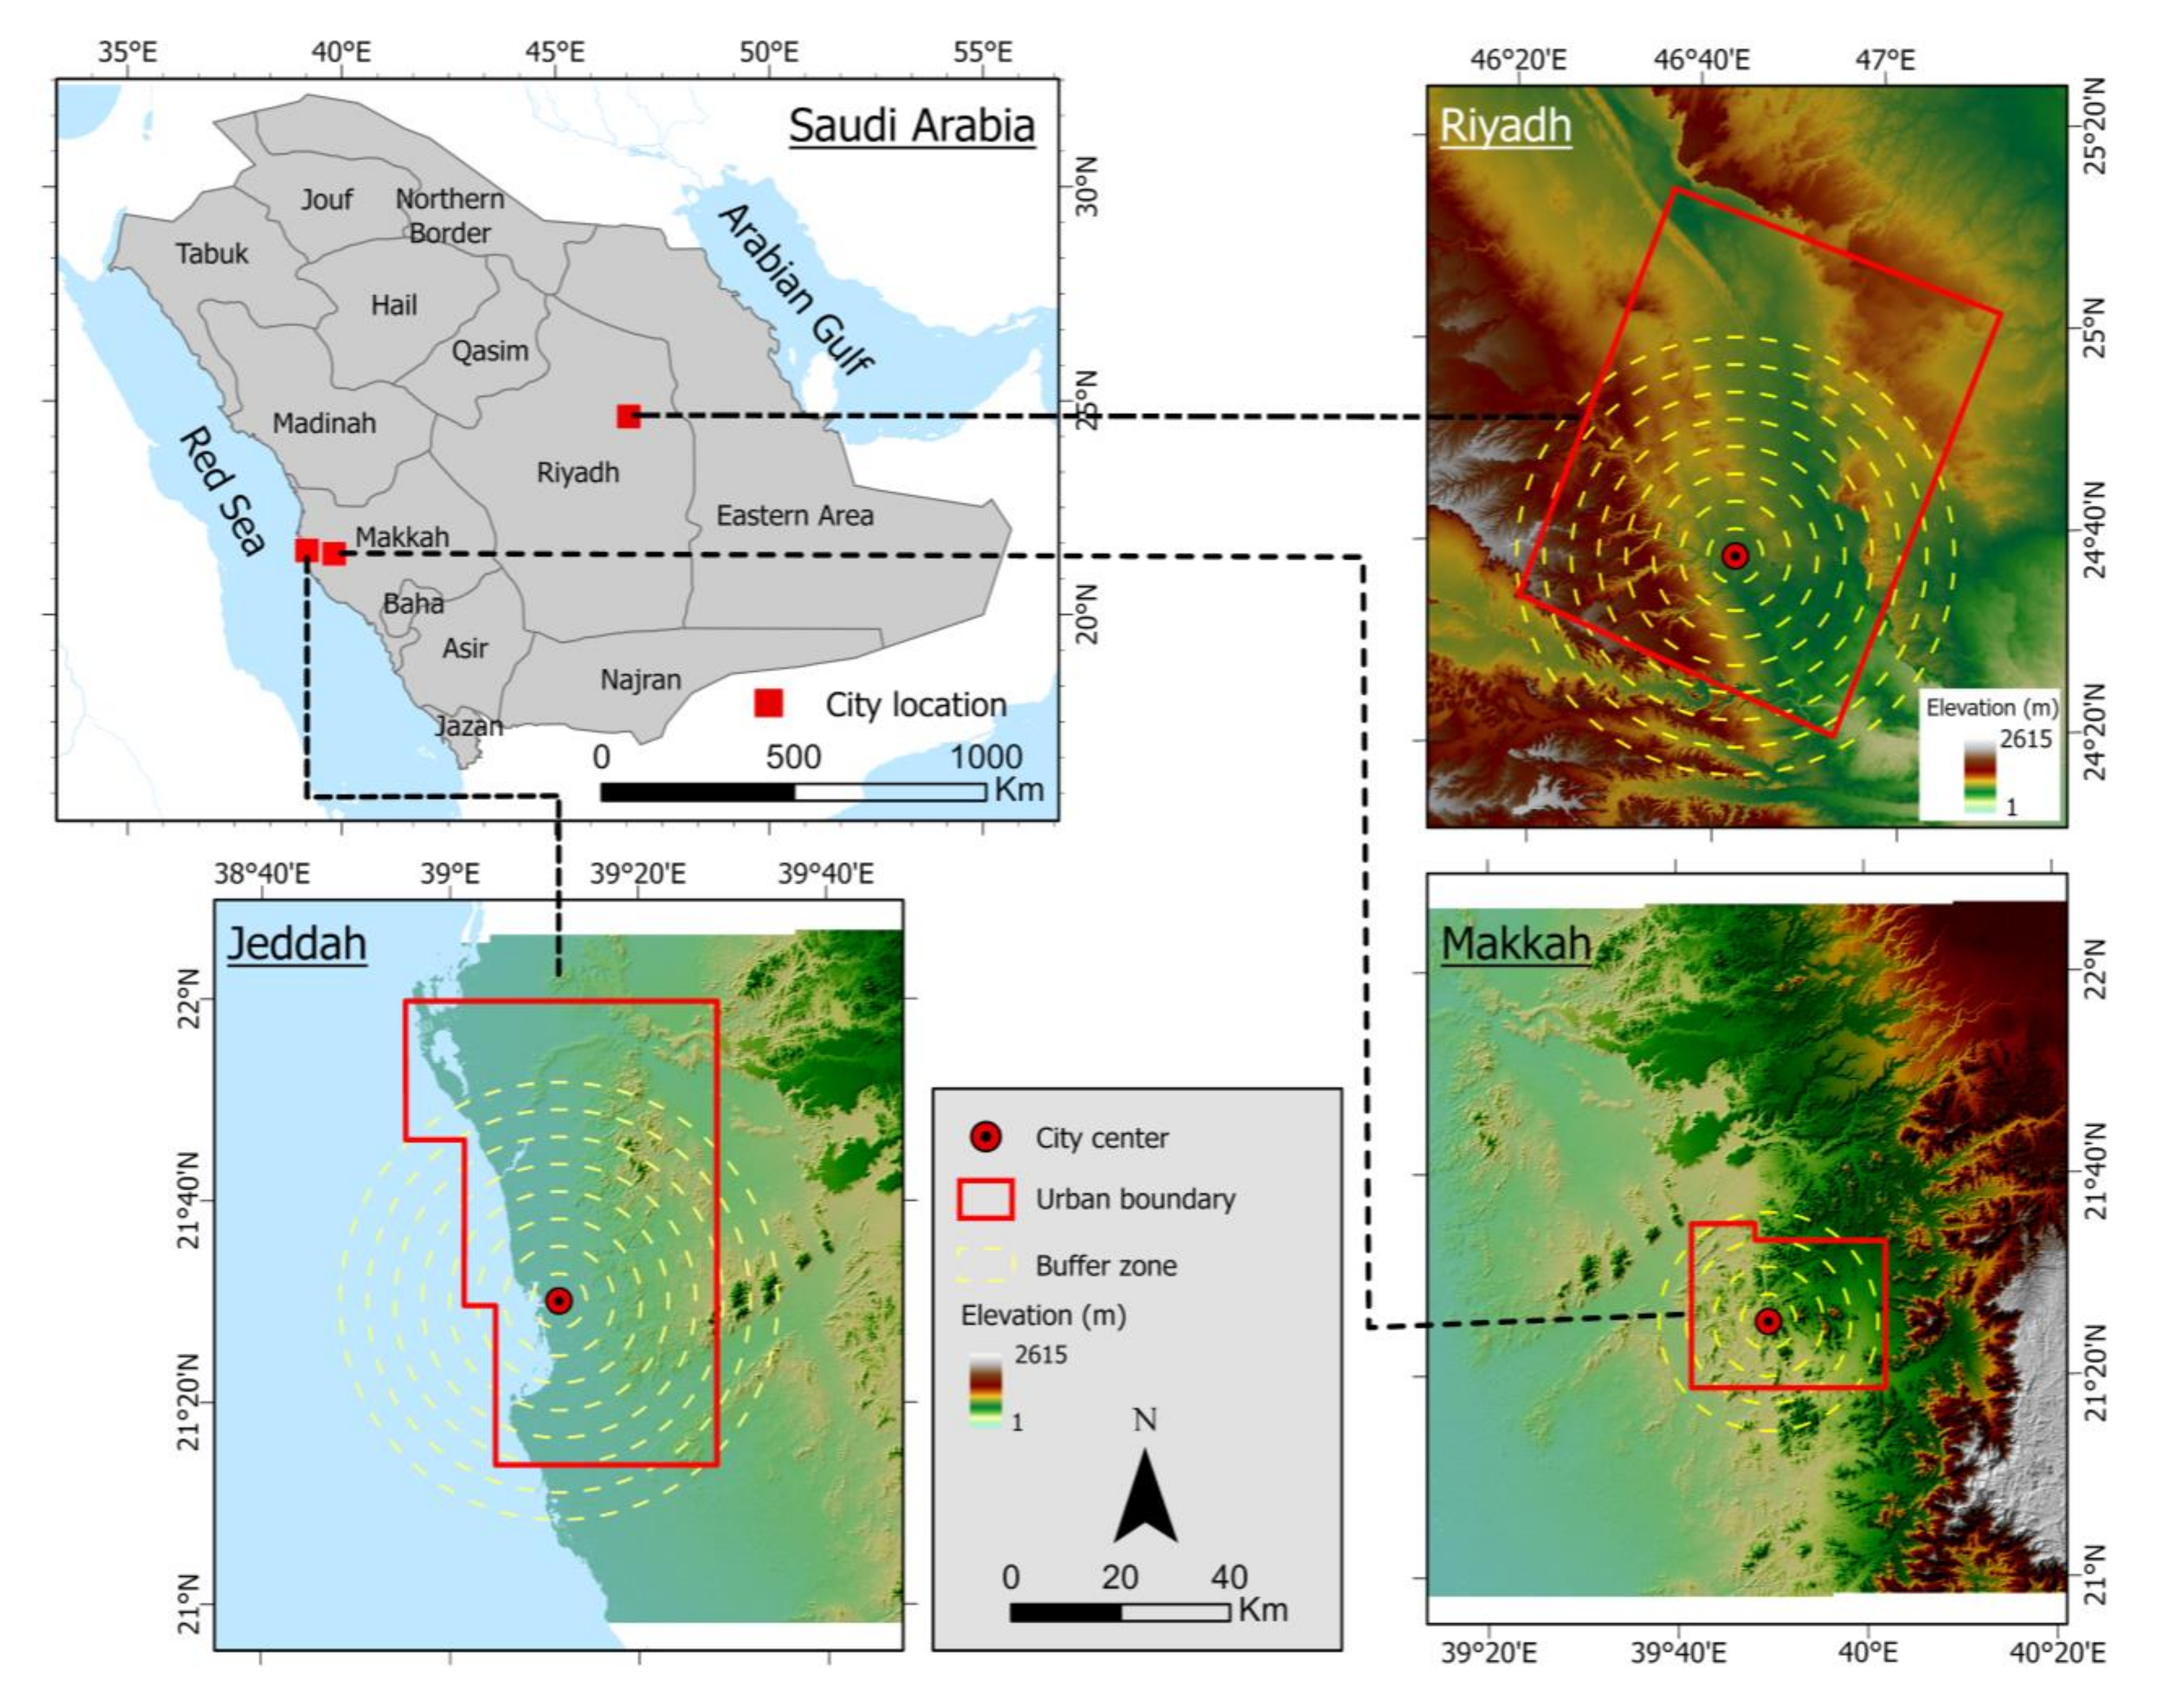
2. Study Area
3. Materials and Methods
3.1. Data and Pre-Processing
3.2. Image Classification
3.3. Accuracy Assessment
3.4. Spatial Urban Metrics
3.5. Analysis Framework
4. Results
4.1. Accuracy Assessment
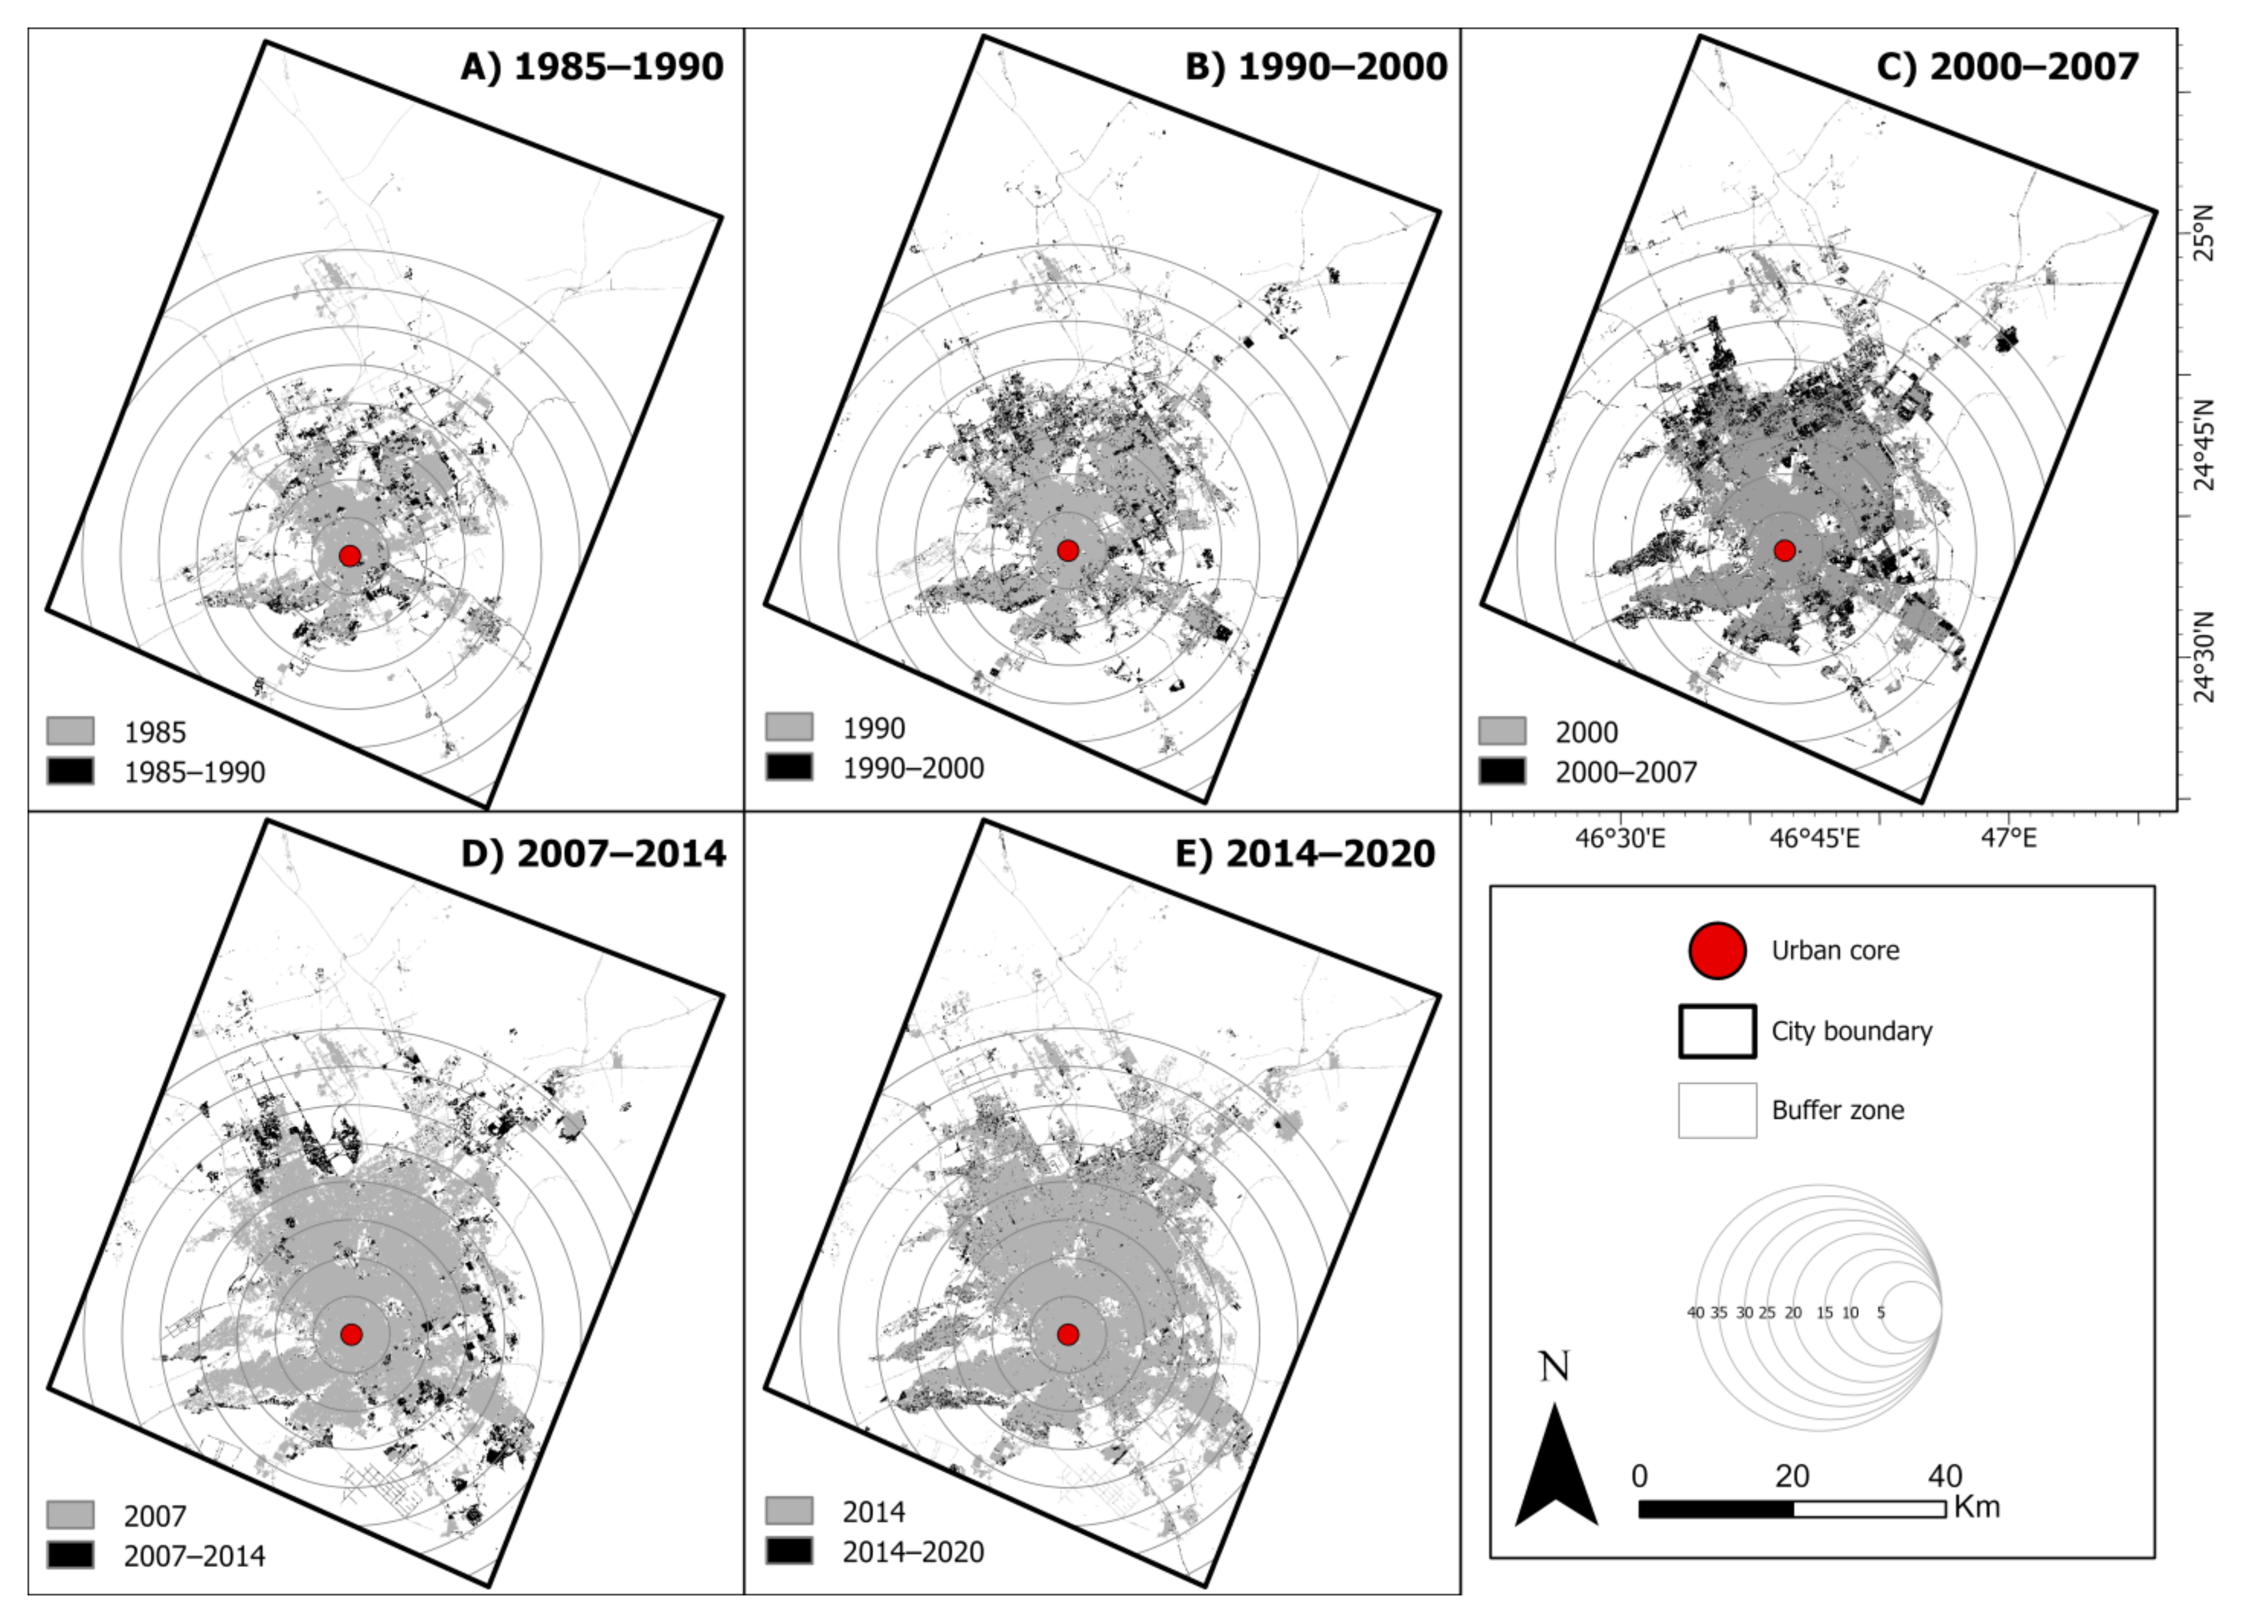
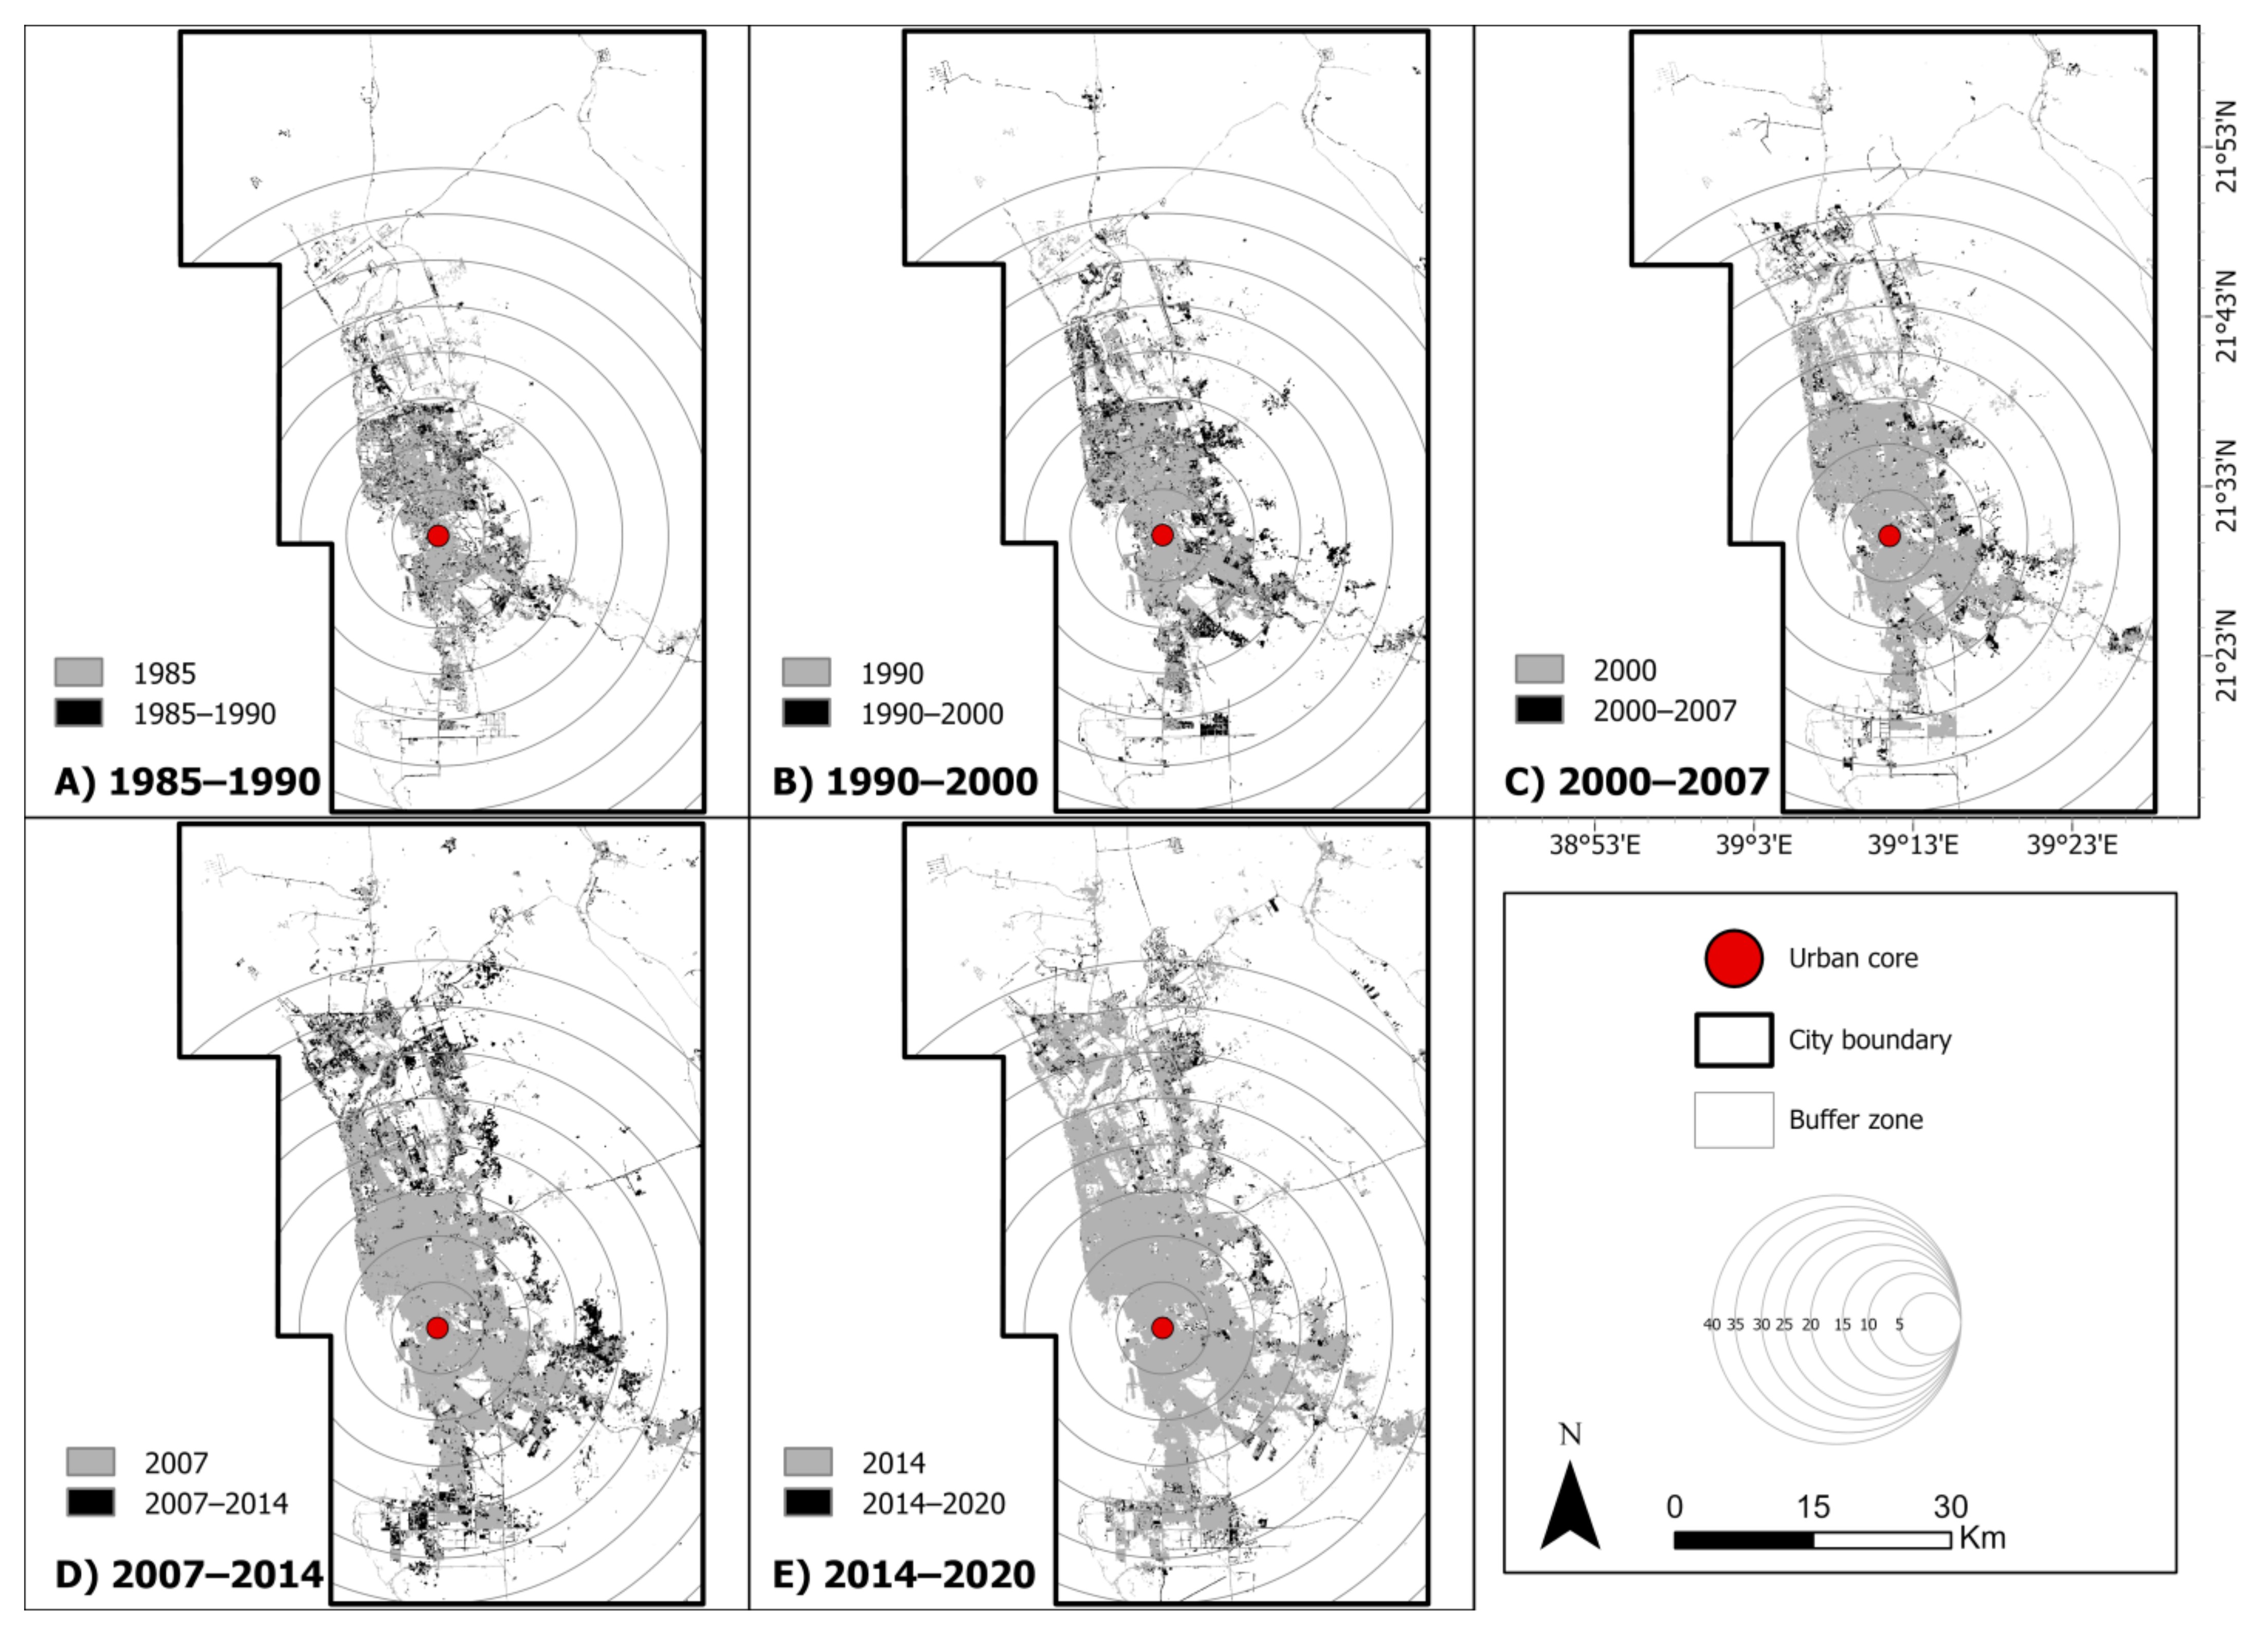
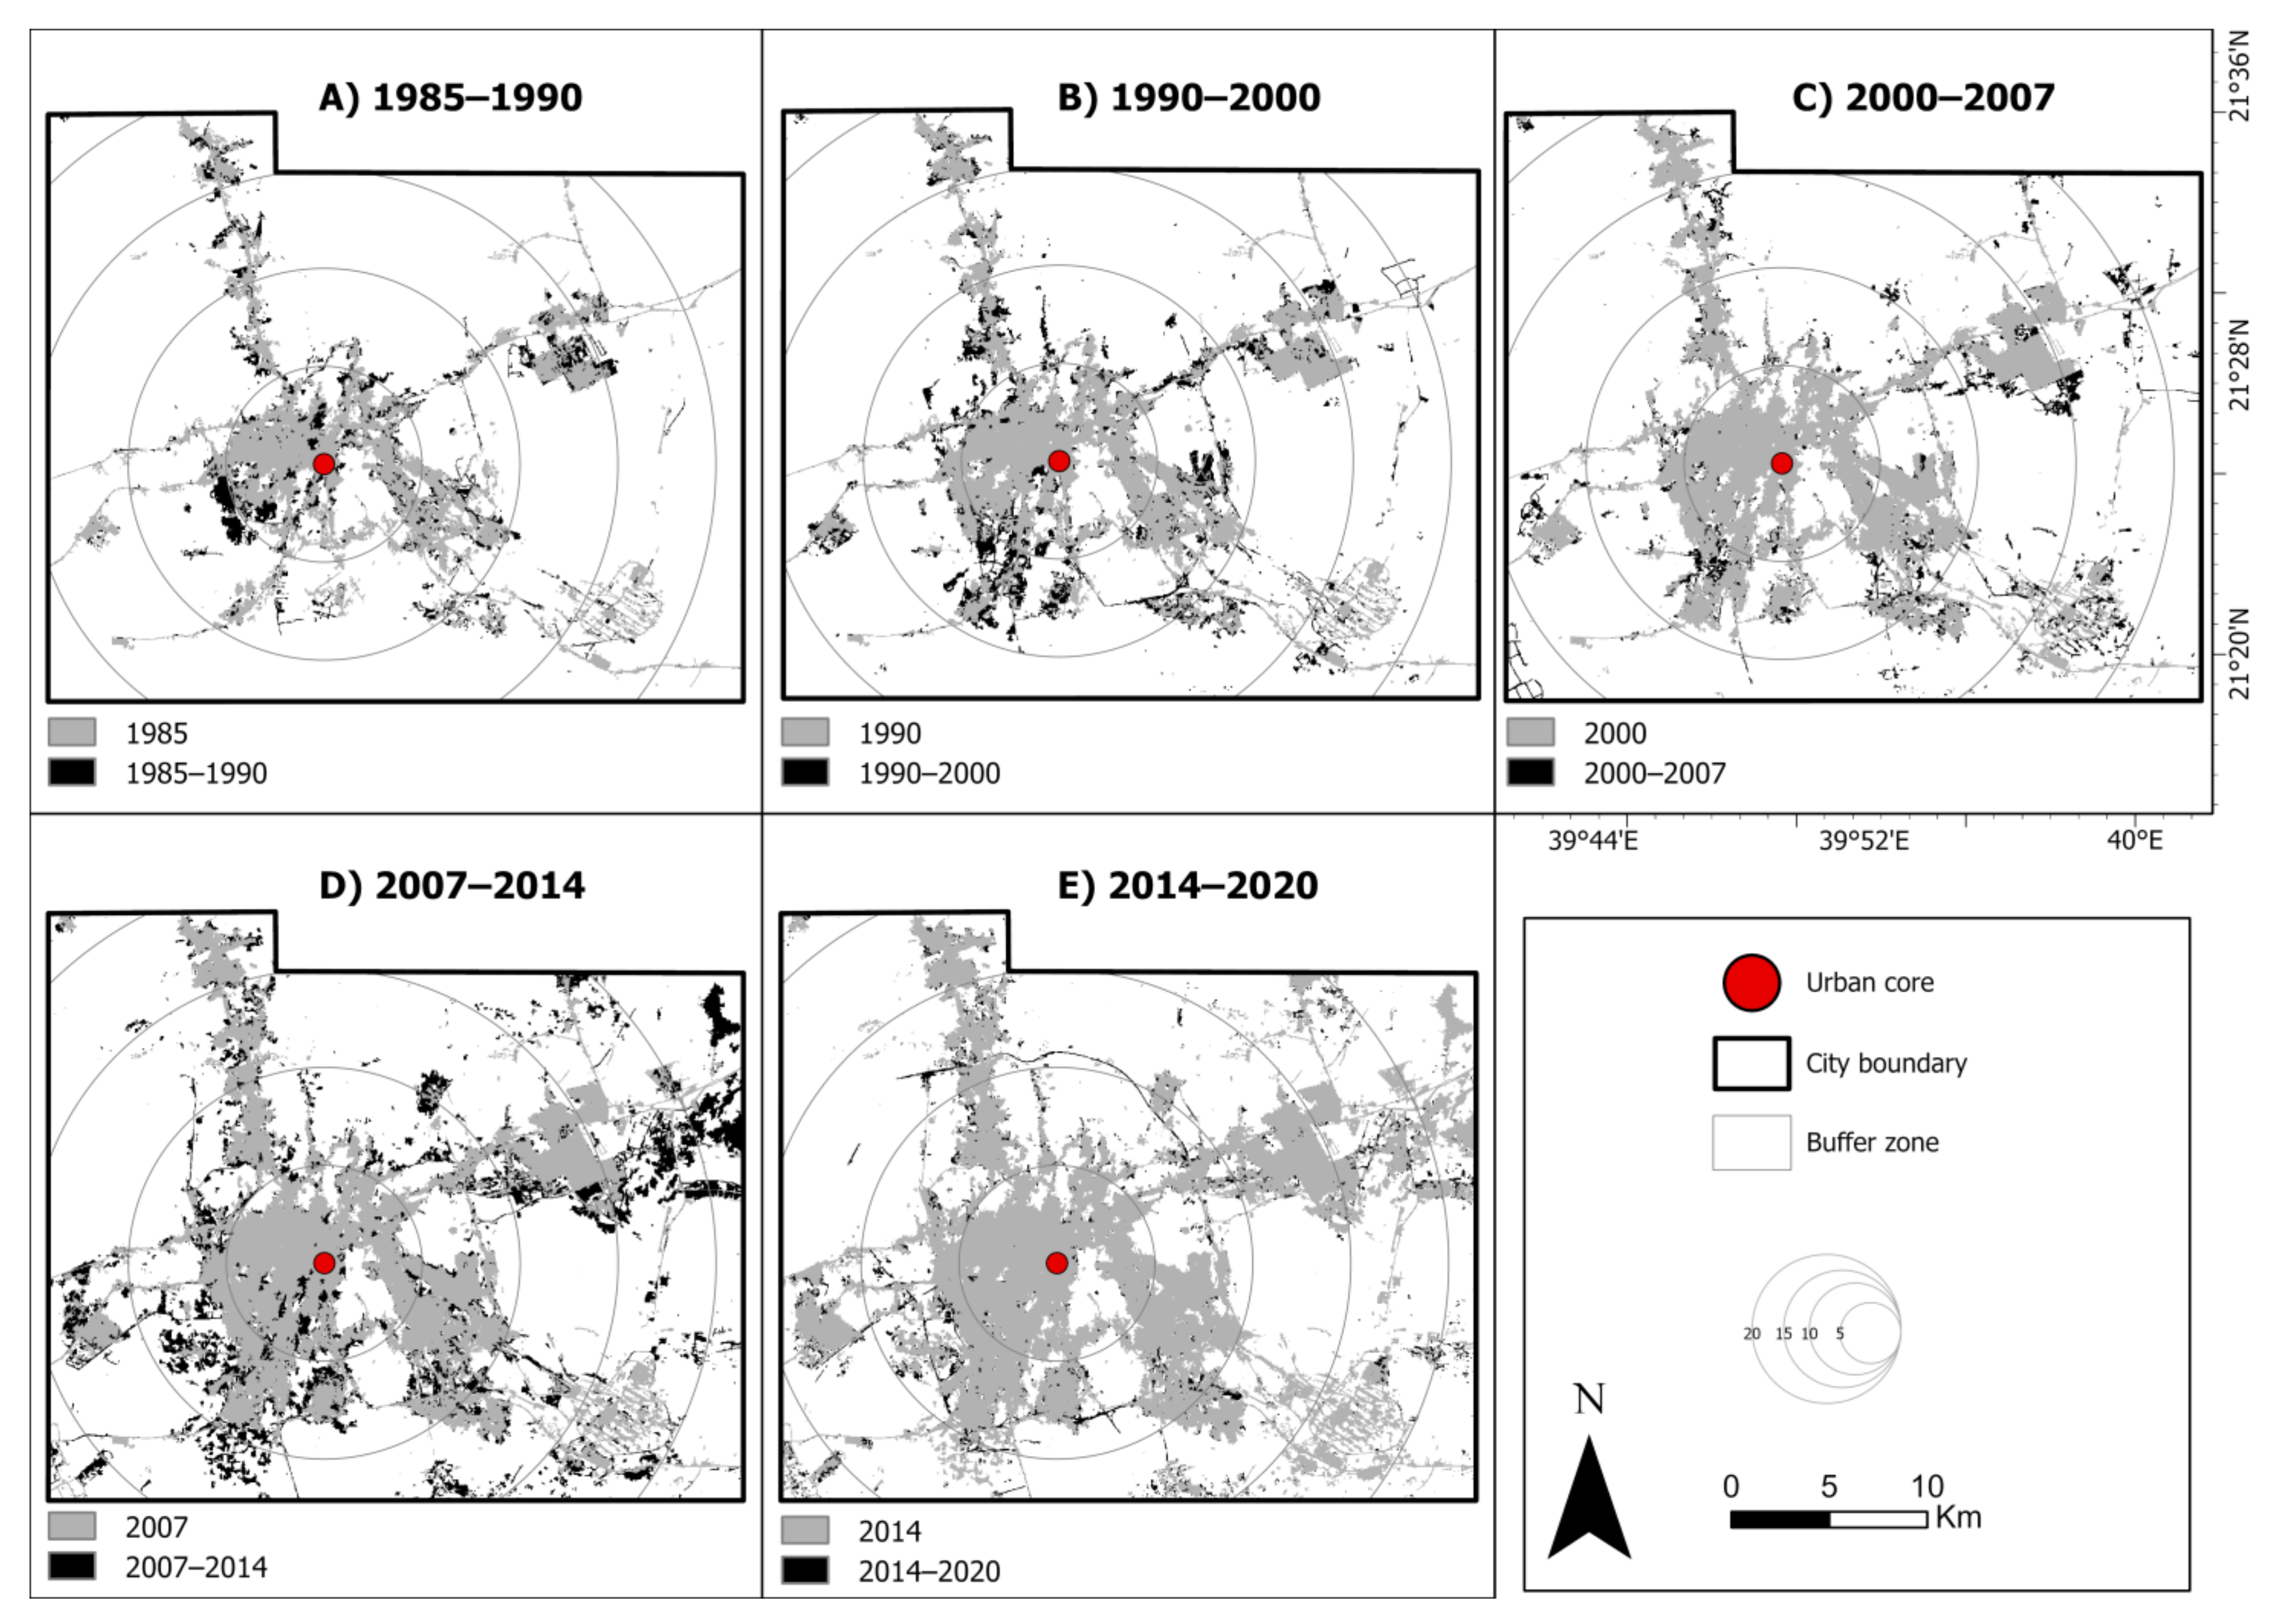
4.2. Urban Spatiotemporal Change Detection
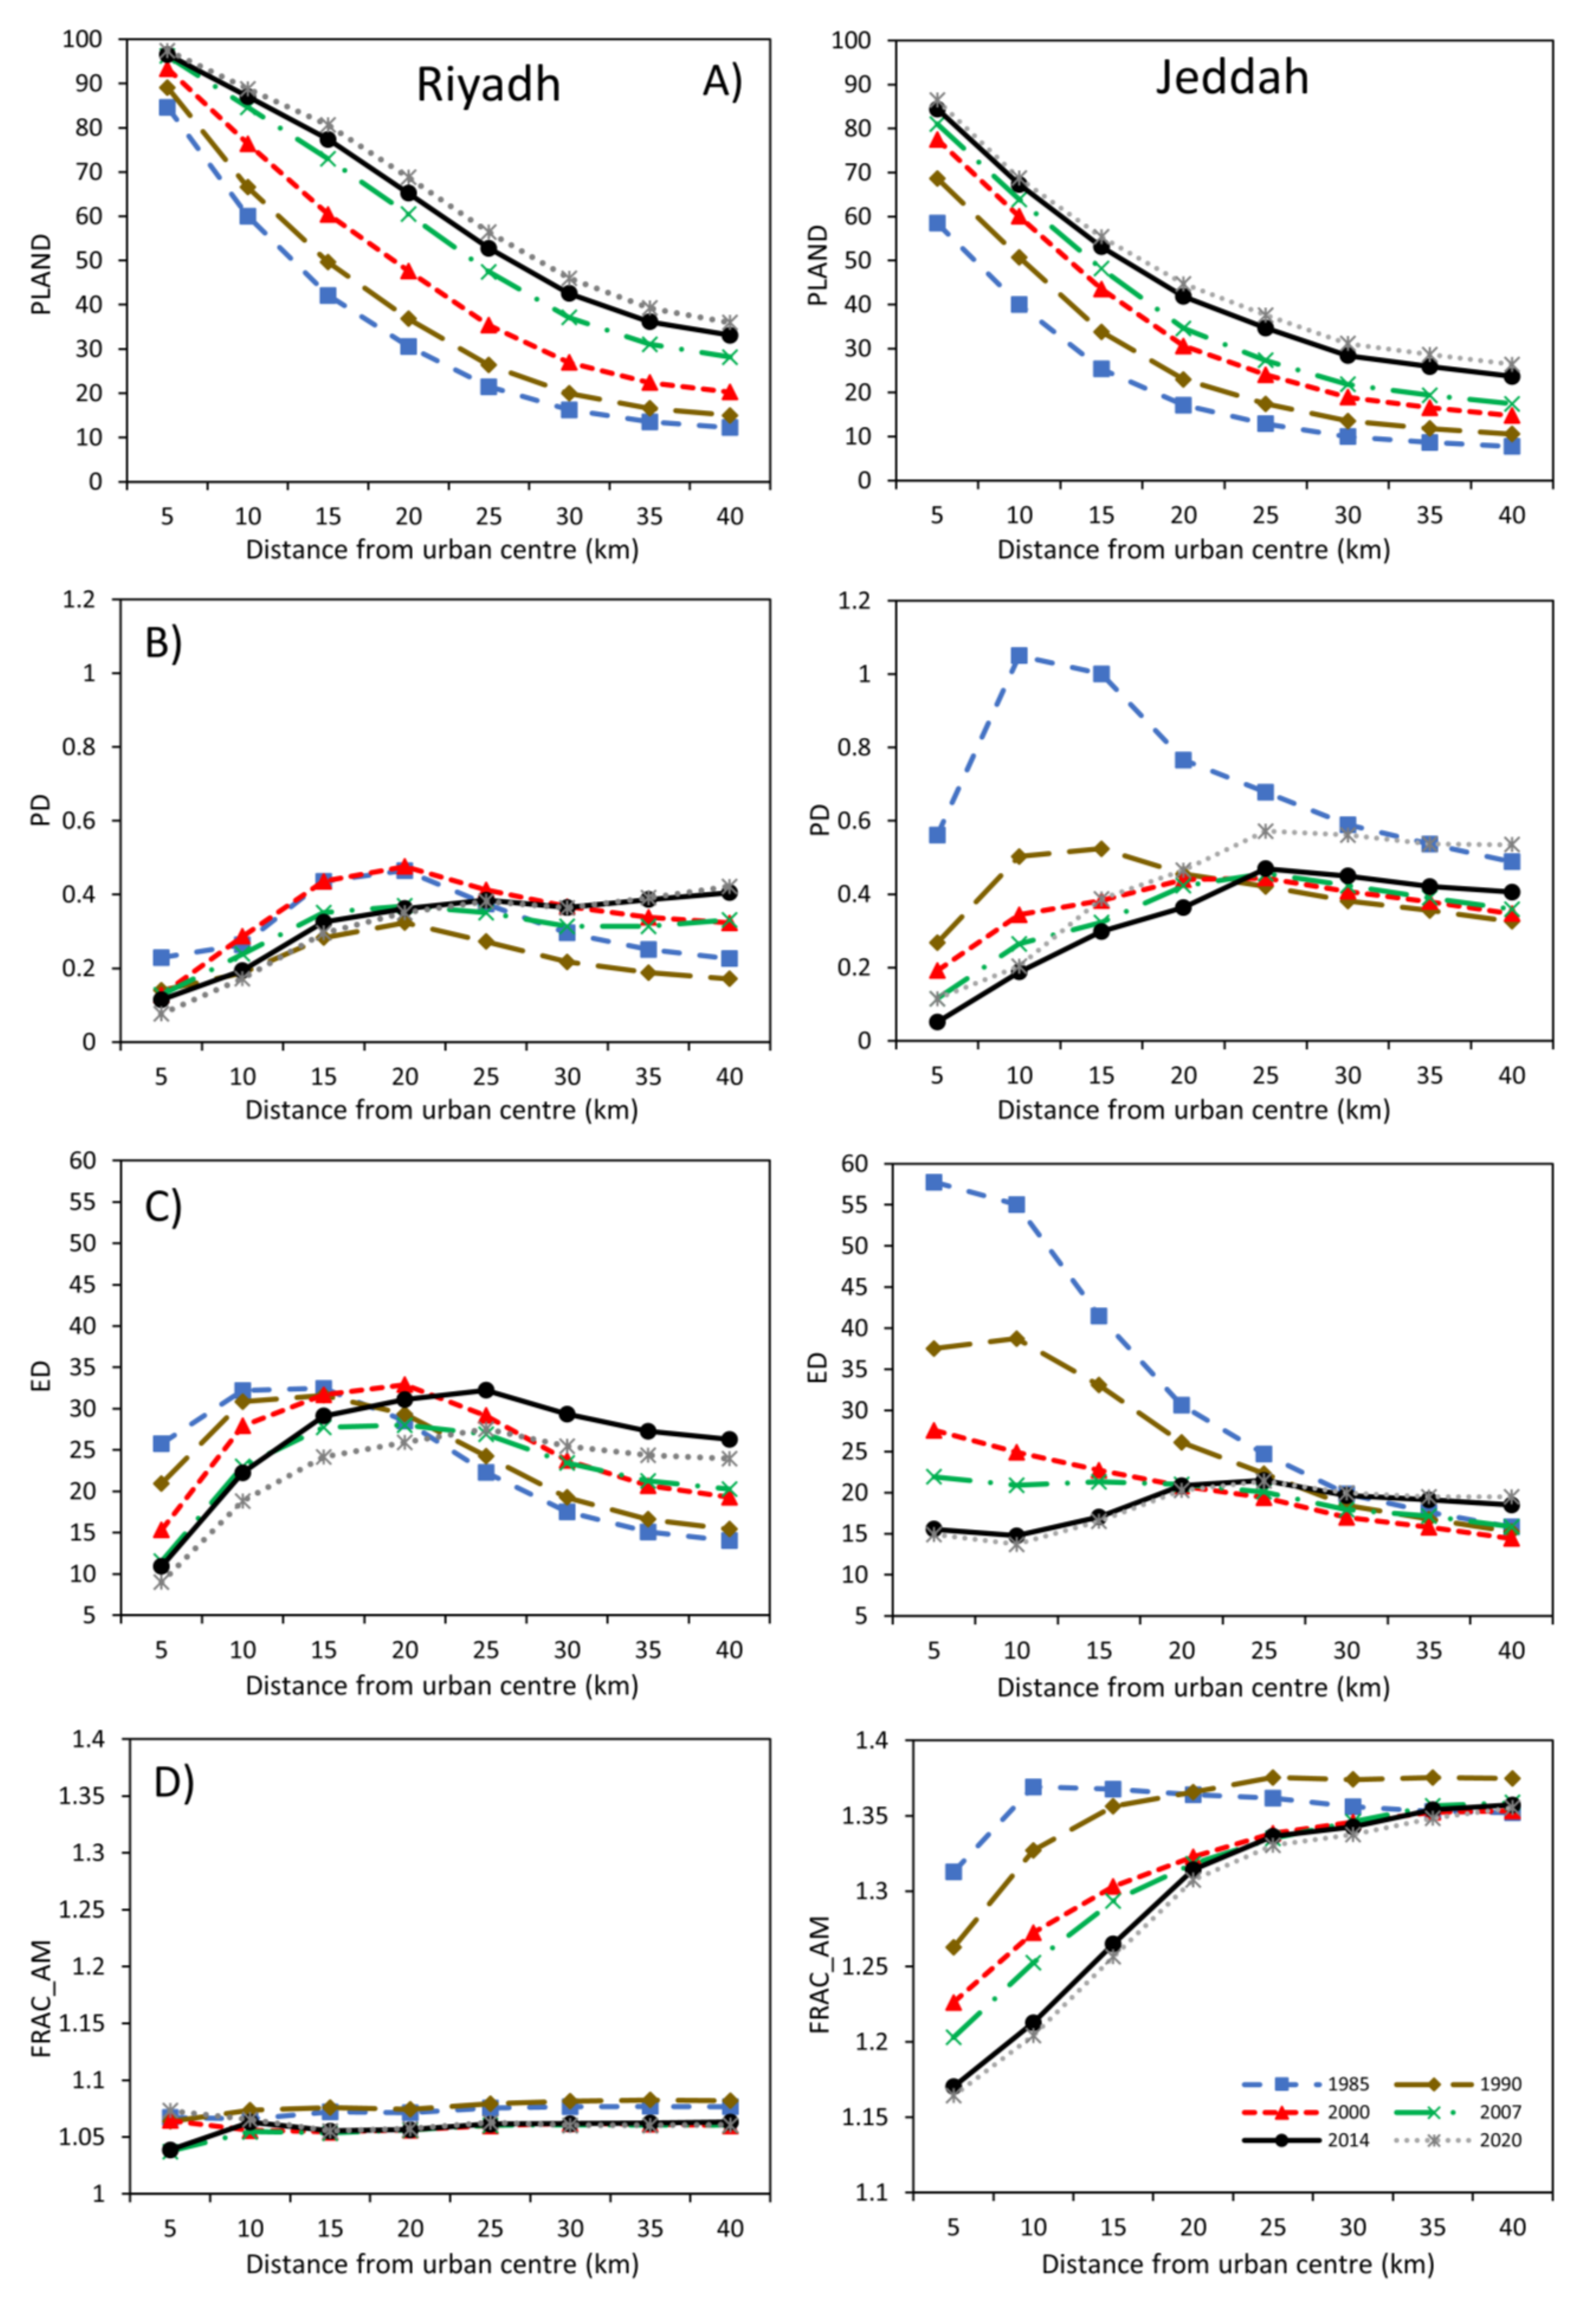
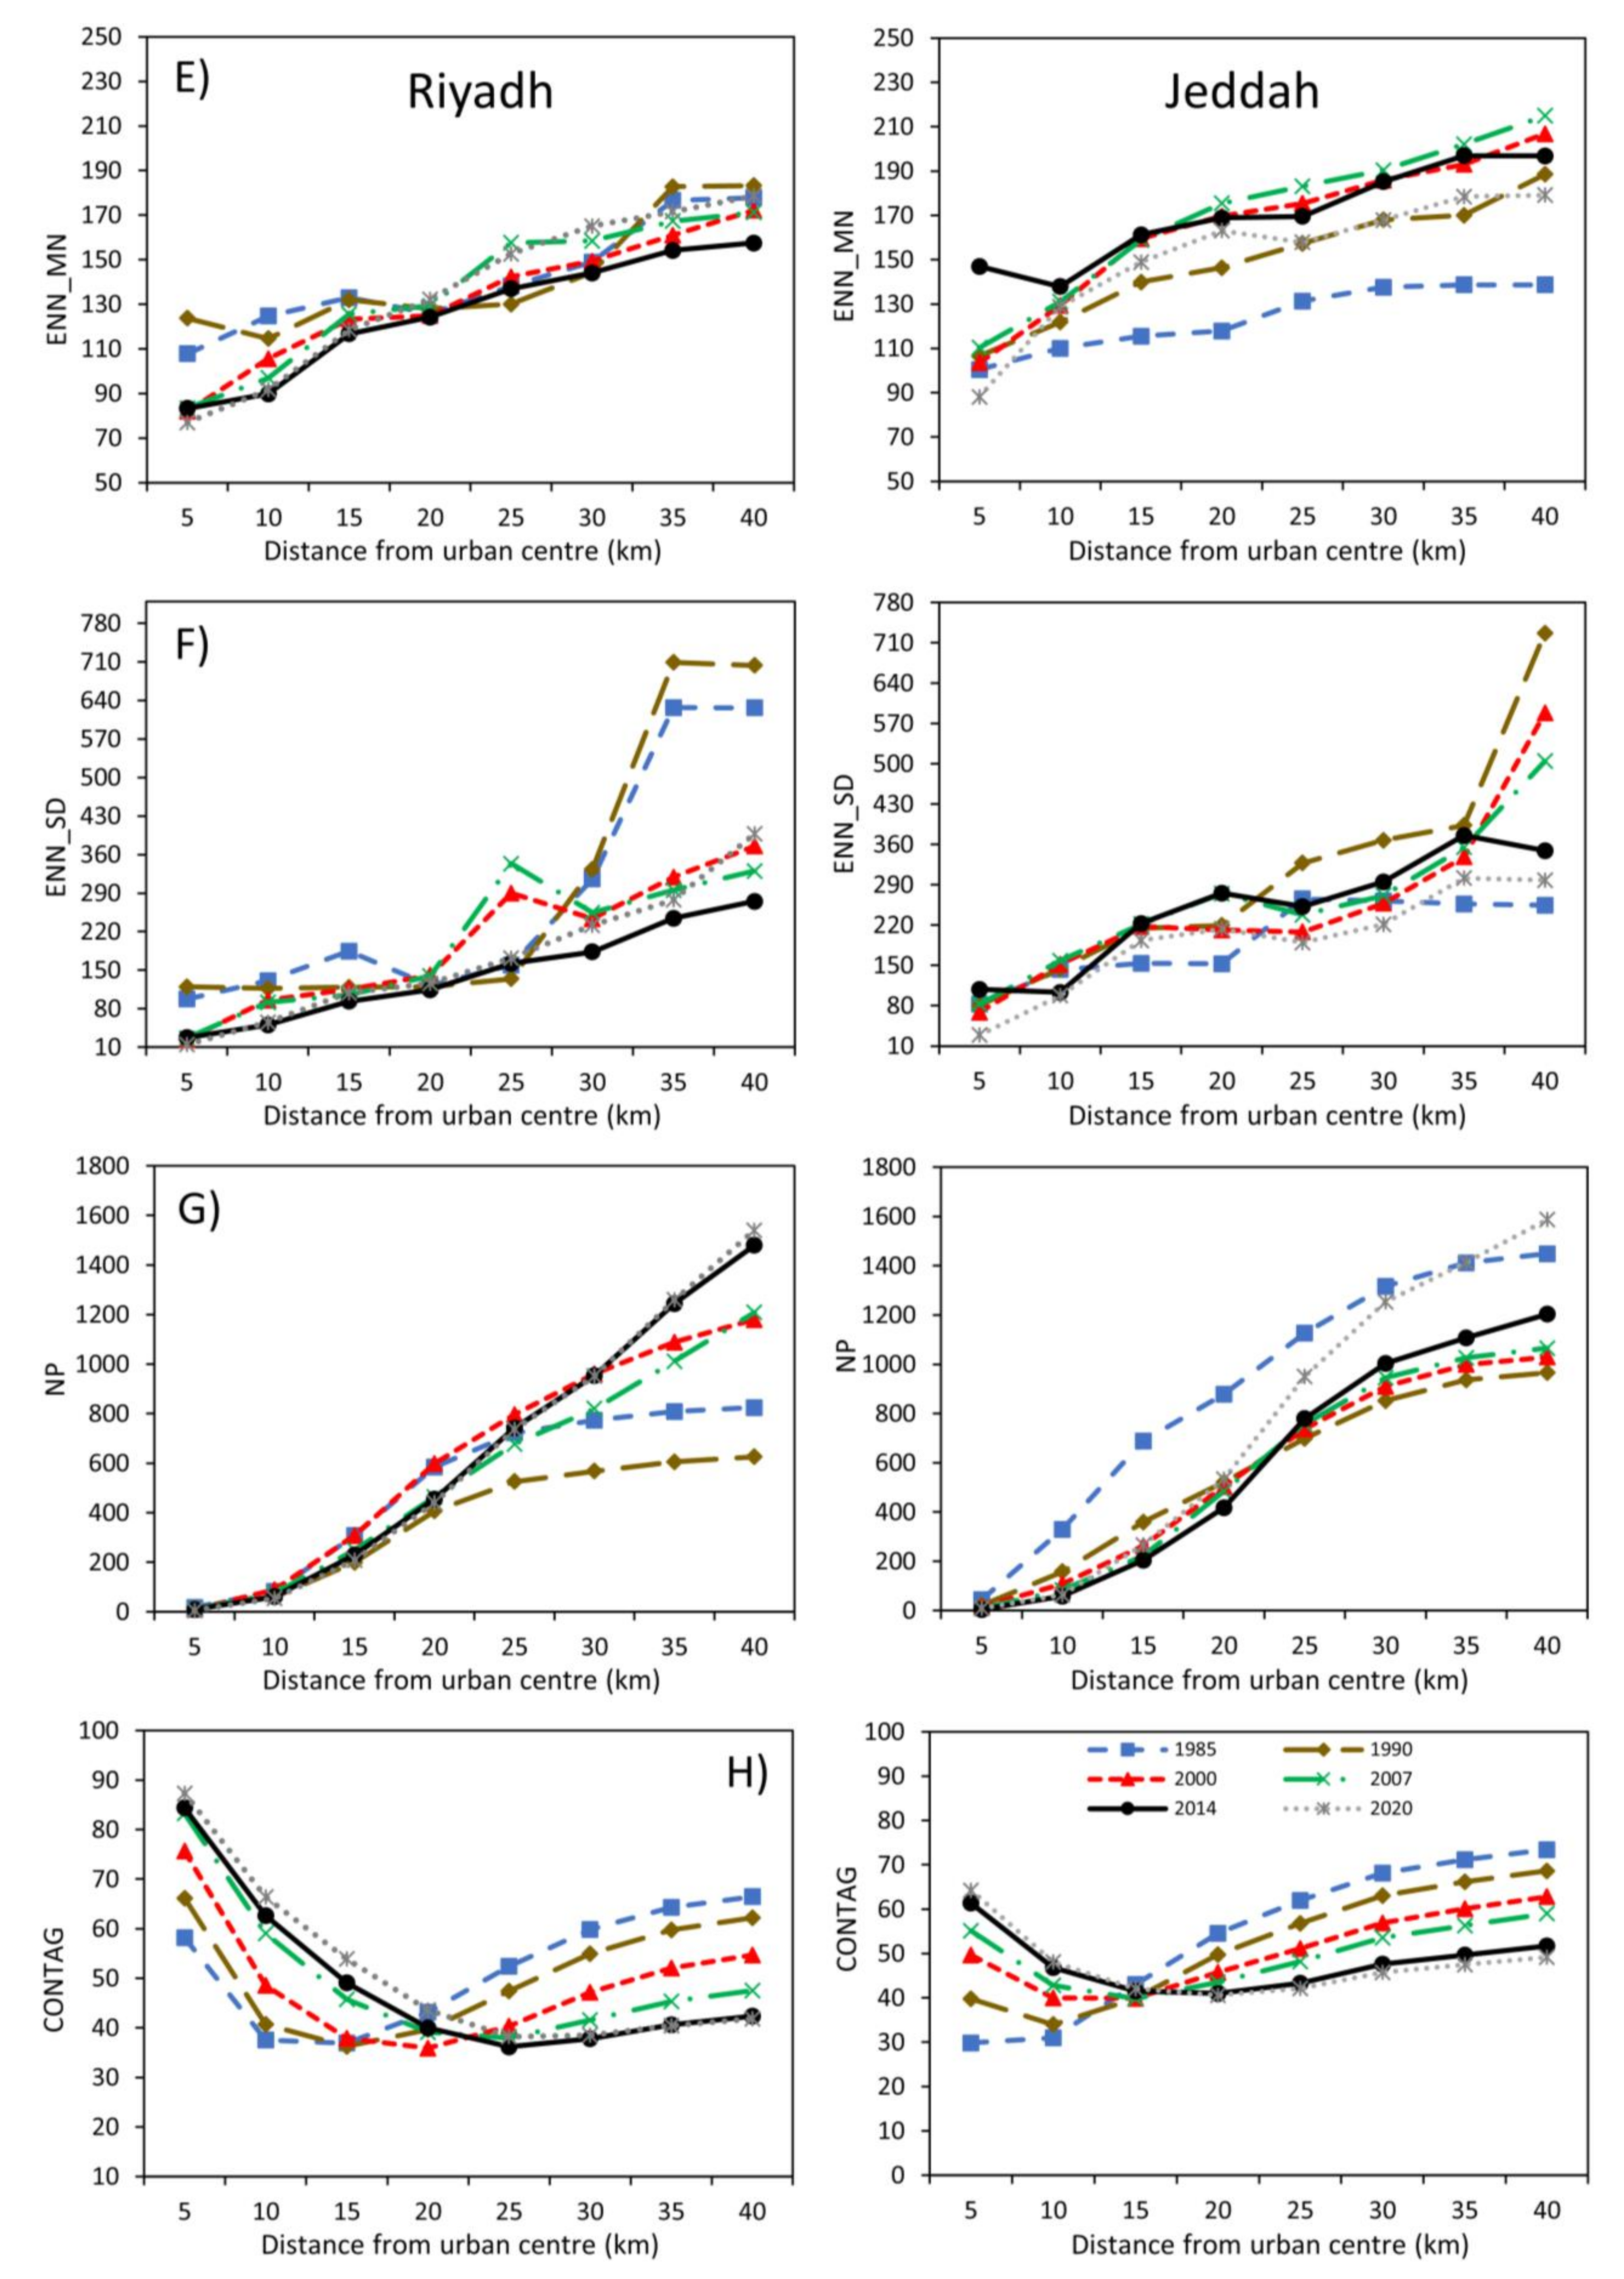
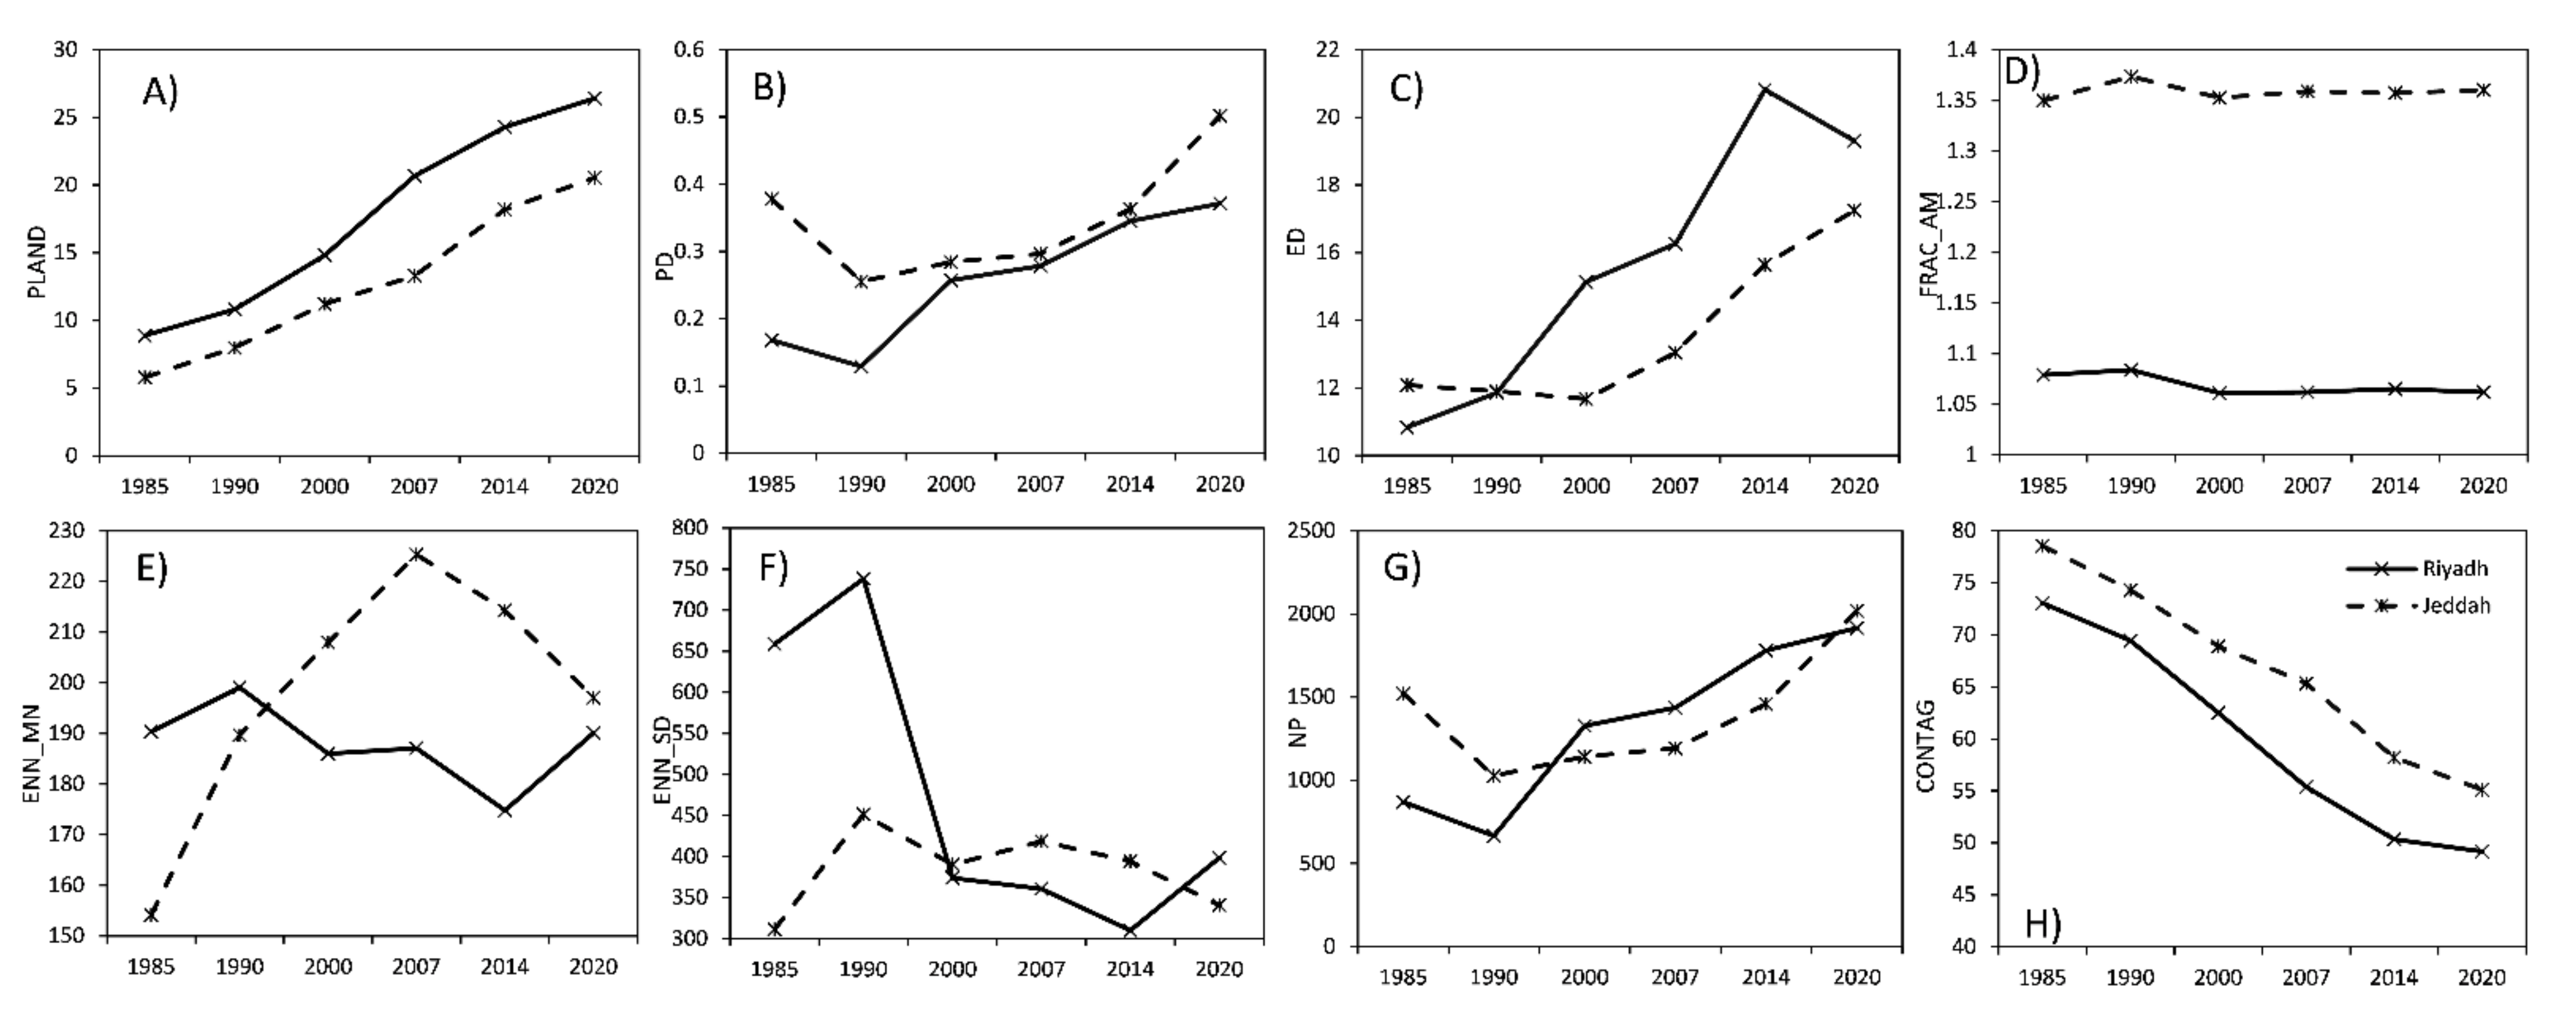
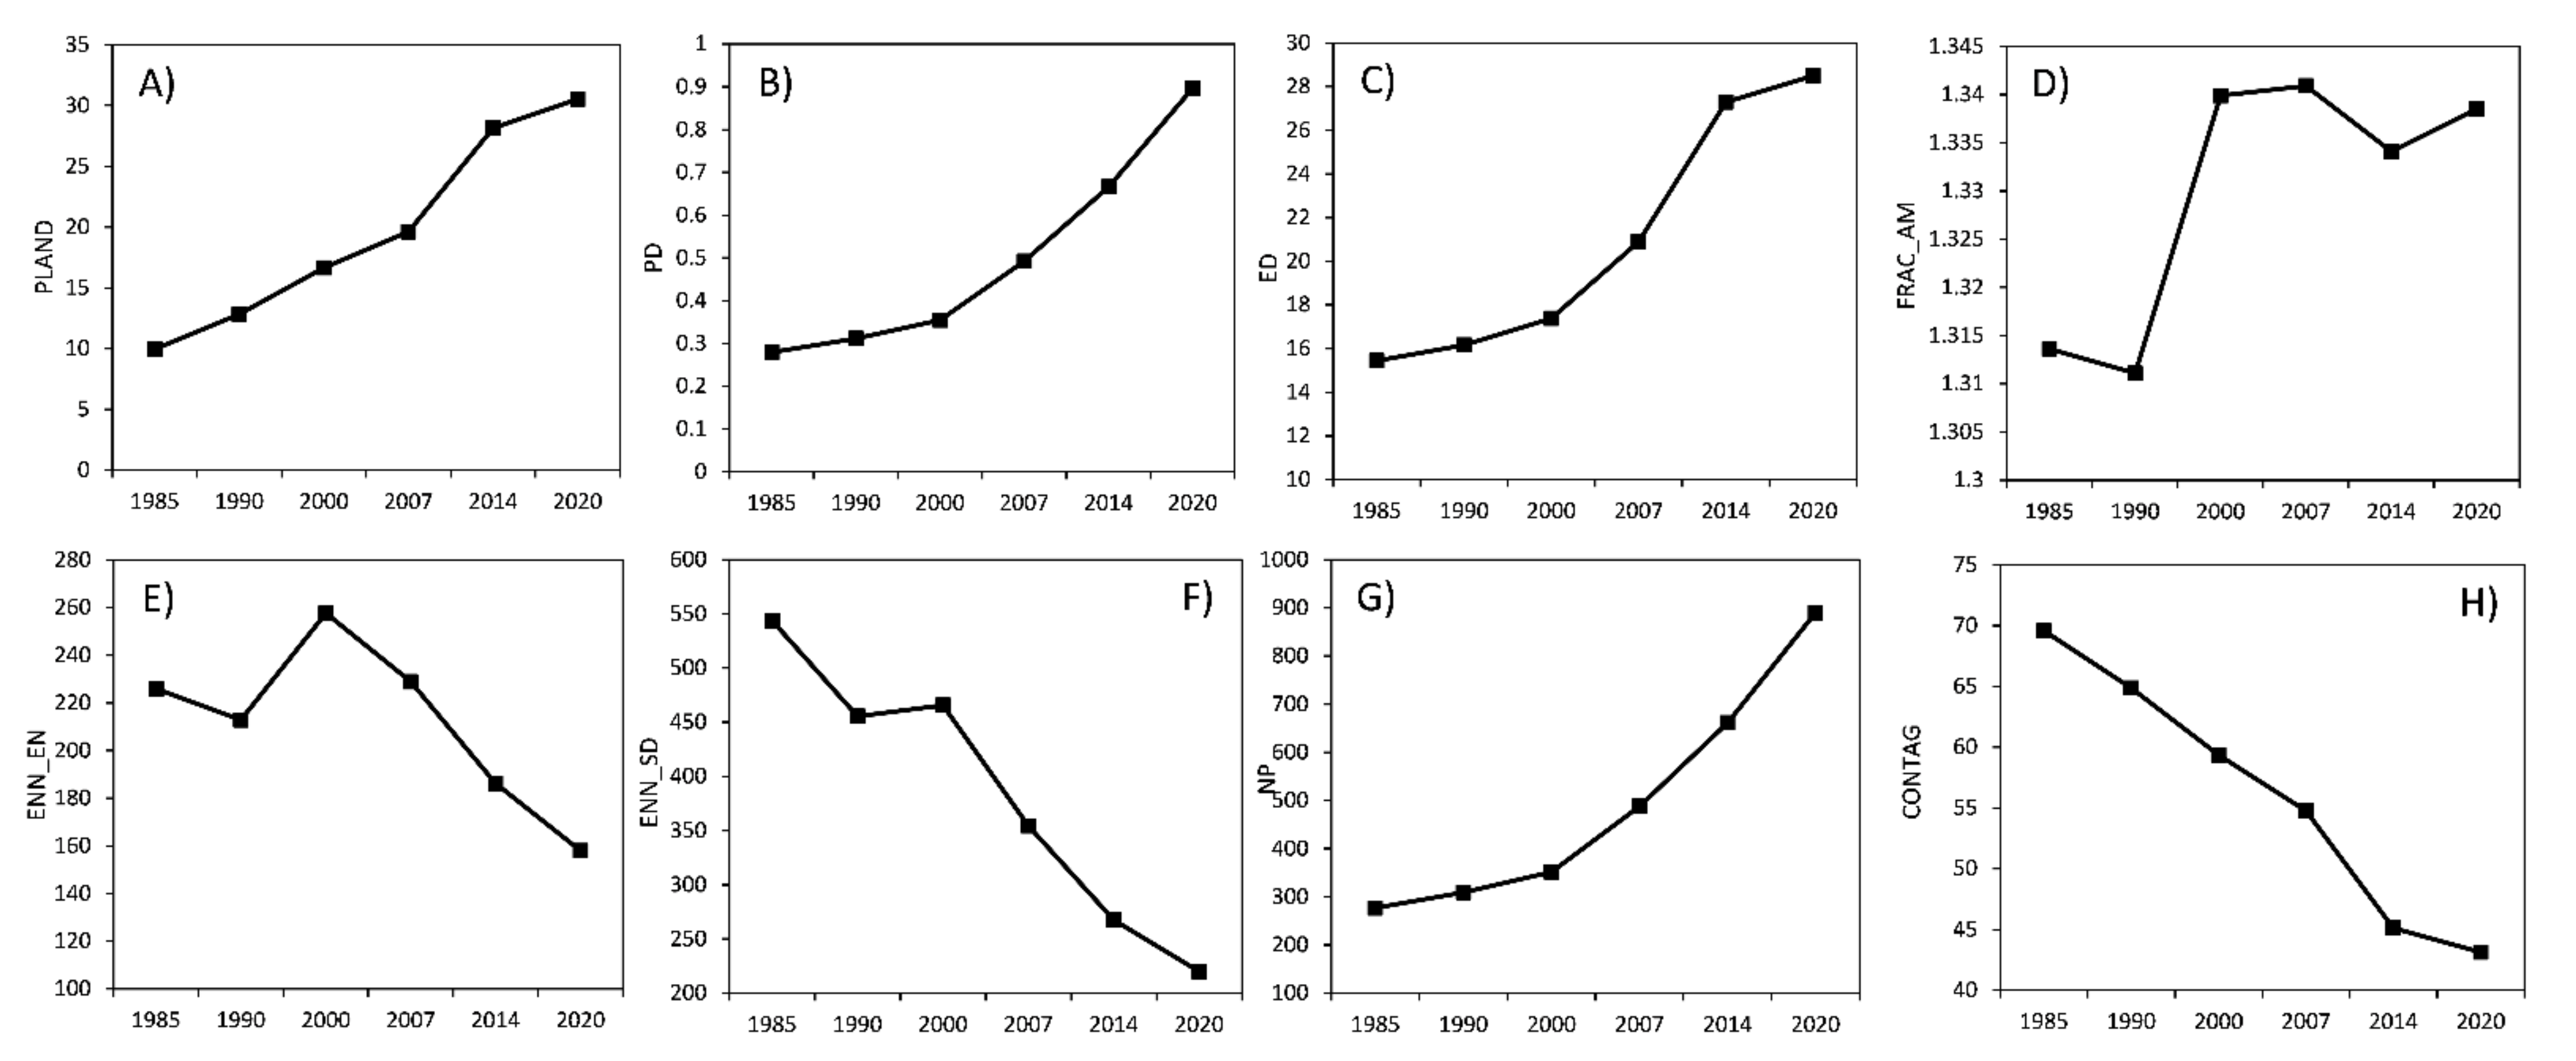
4.3. Urban Patterns and Processes
5. Discussion
6. Conclusions
Funding
Institutional Review Board Statement
Informed Consent Statement
Data Availability Statement
Conflicts of Interest
References
- Zhou, X.; Chen, H. Impact of urbanization-related land use land cover changes and urban morphology changes on the urban heat island phenomenon. Sci. Total Environ. 2018, 635, 1467–1476. [Google Scholar] [CrossRef]
- Hou, L.; Wu, F.; Xie, X. The spatial characteristics and relationships between landscape pattern and ecosystem service value along an urban-rural gradient in Xi’an city, China. Ecol. Indic. 2020, 108, 105720. [Google Scholar] [CrossRef]
- United Nations. World Population Prospects 2019. Department of Economic and Social Affairs Population Division; United Nations: New York, NY, USA, 2019. [Google Scholar]
- Seto, K.C.; Fragkias, M. Quantifying Spatiotemporal Patterns of Urban Land-use Change in Four Cities of China with Time Series Landscape Metrics. Landsc. Ecol. 2005, 20, 871–888. [Google Scholar] [CrossRef]
- Zhang, X.Q. The Economic Role of Cities; UN-HABITAT: Nairobi, Kenya, 2011. [Google Scholar]
- Grimm, N.B.; Faeth, S.H.; Golubiewski, N.E.; Redman, C.L.; Wu, J.; Bai, X.; Briggs, J.M. Global Change and the Ecology of Cities. Science 2008, 319, 756–760. [Google Scholar] [CrossRef] [PubMed] [Green Version]
- Alberti, M. The Effects of Urban Patterns on Ecosystem Function. Int. Reg. Sci. Rev. 2005, 28, 168–192. [Google Scholar] [CrossRef]
- Liu, Z.; He, C.; Wu, J. General Spatiotemporal Patterns of Urbanization: An Examination of 16 World Cities. Sustainability 2016, 8, 41. [Google Scholar] [CrossRef] [Green Version]
- Alberti, M.; Palkovacs, E.P.; Roches, S.D.; Meester, L.D.; Brans, K.I.; Govaert, L.; Grimm, N.B.; Harris, N.C.; Hendry, A.P.; Schell, C.J.; et al. The Complexity of Urban Eco-evolutionary Dynamics. BioScience 2020, 70, 772–793. [Google Scholar] [CrossRef]
- Zhou, Y.; Smith, S.J.; Zhao, K.; Imhoff, M.; Thomson, A.; Bond-Lamberty, B.; Asrar, G.R.; Zhang, X.Q.; He, C.; Elvidge, C.D. A global map of urban extent from nightlights. Environ. Res. Lett. 2015, 10, 054011. [Google Scholar] [CrossRef]
- Li, X.; Zhou, W.; Ouyang, Z. Forty years of urban expansion in Beijing: What is the relative importance of physical, socioeconomic, and neighborhood factors? Appl. Geogr. 2013, 38, 1–10. [Google Scholar] [CrossRef]
- Arribas-Bel, D.; Sanz-Gracia, F. The validity of the monocentric city model in a polycentric age: US metropolitan areas in 1990, 2000 and 2010. Urban Geogr. 2014, 35, 980–997. [Google Scholar] [CrossRef] [Green Version]
- Mubarak, F.A. Urban growth boundary policy and residential suburbanization: Riyadh, Saudi Arabia. Habitat Int. 2004, 28, 567–591. [Google Scholar] [CrossRef]
- Alqurashi, A.F.; Kumar, L. Land use and land cover change detection in the Saudi Arabian desert cities of Makkah and Al-Taif using satellite data. Adv. Remote Sens. 2014, 3, 106–119. [Google Scholar] [CrossRef]
- Al-Hathloul, S.; Mughal, M.A. Urban growth management-the Saudi experience. Habitat Int. 2004, 28, 609–623. [Google Scholar] [CrossRef]
- Gamboa, J. City Expanding to The Desert Horizon: Riyadh’s problem of explosive growth and urban sprawl. Geography 2008, 554, 7–14. [Google Scholar]
- Alqurashi, A.F.; Kumar, L. Spatiotemporal patterns of urban change and associated environmental impacts in five Saudi Arabian cities: A case study using remote sensing data. Habitat Int. 2016, 58, 75–88. [Google Scholar] [CrossRef]
- Chen, J.; Chen, J.; Liao, A.; Cao, X.; Chen, L.; Chen, X.; He, C.; Han, G.; Peng, S.; Lu, M.; et al. Global land cover mapping at 30m resolution: A POK-based operational approach. ISPRS J. Photogramm. Remote Sens. 2015, 103, 7–27. [Google Scholar] [CrossRef] [Green Version]
- Toure, S.I.; Stow, D.A.; Shih, H.; Weeks, J.; Lopez-Carr, D. Land cover and land use change analysis using multi-spatial resolution data and object-based image analysis. Remote Sens. Environ. 2018, 210, 259–268. [Google Scholar] [CrossRef]
- Roy, D.P.; Wulder, M.A.; Loveland, T.R.; Woodcock, C.E.; Allen, R.G.; Anderson, M.C.; Helder, D.; Irons, J.R.; Johnson, D.M.; Kennedy, R.; et al. Landsat-8: Science and product vision for terrestrial global change research. Remote Sens. Environ. 2014, 145, 154–172. [Google Scholar] [CrossRef] [Green Version]
- Goldblatt, R.; Stuhlmacher, M.F.; Tellman, B.; Clinton, N.; Hanson, G.; Georgescu, M.; Wang, C.; Serrano-Candela, F.; Khandelwal, A.K.; Cheng, W.; et al. Using Landsat and nighttime lights for supervised pixel-based image classification of urban land cover. Remote Sens. Environ. 2018, 205, 253–275. [Google Scholar] [CrossRef]
- Sinha, P.; Verma, N.K.; Ayele, E. Urban built-up area extraction and change detection of Adama Municipal area using time-series Landsat images. Int. J. Adv. Remote Sens. GIS 2016, 5, 1886–1895. [Google Scholar] [CrossRef]
- Deliry, S.I.; Avdan, Z.Y.; Avdan, U. Extracting urban impervious surfaces from Sentinel-2 and Landsat-8 satellite data for urban planning and environmental management. Environ. Sci. Pollut. Res. 2021, 28, 6572–6586. [Google Scholar] [CrossRef]
- Zhang, C.; Sargent, I.; Pan, X.; Li, H.; Gardiner, A.; Hare, J.; Atkinson, P.M. An object-based convolutional neural network (OCNN) for urban land use classification. Remote Sens. Environ. 2018, 216, 57–70. [Google Scholar] [CrossRef] [Green Version]
- Myint, S.W.; Gober, P.; Brazel, A.; Grossman-Clarke, S.; Weng, Q. Per-pixel vs. object-based classification of urban land cover extraction using high spatial resolution imagery. Remote Sens. Environ. 2011, 115, 1145–1161. [Google Scholar] [CrossRef]
- Yu, W.; Zhou, W.; Qian, Y.; Yan, J. A new approach for land cover classification and change analysis: Integrating backdating and an object-based method. Remote Sens. Environ. 2016, 177, 37–47. [Google Scholar] [CrossRef]
- Frankhauser, P. Fractal geometry for measuring and modelling urban patterns. In The Dynamics of Complex Urban Systems: An Interdisciplinary Approach; Albeverio, S., Andrey, D., Giordano, P., Vancheri, A., Eds.; Physica-Verlag HD: Heidelberg, Germany, 2008; pp. 213–243. [Google Scholar]
- Aguilera, F.; Valenzuela, L.M.; Botequilha-Leitão, A. Landscape metrics in the analysis of urban land use patterns: A case study in a Spanish metropolitan area. Landsc. Urban Plan. 2011, 99, 226–238. [Google Scholar] [CrossRef]
- O’Neill, R.V.; Krummel, J.R.; Gardner, R.H.; Sugihara, G.; Jackson, B.; DeAngelis, D.L.; Milne, B.T.; Turner, M.G.; Zygmunt, B.; Christensen, S.W.; et al. Indices of landscape pattern. Landsc. Ecol. 1988, 1, 153–162. [Google Scholar] [CrossRef]
- McGarigal, K. Landscape Pattern Metrics; Wiley StatsRef; Statistics Reference Online: New York, NY, USA, 2014. [Google Scholar]
- Schneider, A.; Woodcock, C.E. Compact, Dispersed, Fragmented, Extensive? A comparison of urban growth in twenty-five global cities using remotely sensed data, pattern metrics and census information. Urban Stud. 2008, 45, 659–692. [Google Scholar] [CrossRef]
- Dietzel, C.; Herold, M.; Hemphill, J.J.; Clarke, K.C. Spatio-temporal dynamics in California’s Central Valley: Empirical links to urban theory. Int. J. Geogr. Inf. Sci. 2005, 19, 175–195. [Google Scholar] [CrossRef]
- Alahmadi, M.; Atkinson, P.M. Three-fold urban expansion in Saudi Arabia from 1992 to 2013 observed using calibrated DMSP-OLS night-time lights imagery. Remote Sens. 2019, 11, 2266. [Google Scholar] [CrossRef] [Green Version]
- Alahmadi, M.; Mansour, S.; Martin, D.; Atkinson, P.M. An improved index for urban population distribution mapping based on nighttime lights (DMSP-OLS) data: An experiment in Riyadh Province, Saudi Arabia. Remote Sens. 2021, 13, 1171. [Google Scholar] [CrossRef]
- Aljoufie, M.; Zuidgeest, M.; Brussel, M.; van Maarseveen, M. Spatial–temporal analysis of urban growth and transportation in Jeddah City, Saudi Arabia. Cities 2013, 31, 57–68. [Google Scholar] [CrossRef]
- Rahman, M.T. Detection of land use/land cover changes and urban sprawl in Al-Khobar, Saudi Arabia: An analysis of multi-temporal remote sensing data. ISPRS Int. J. Geo-Inf. 2016, 5, 15. [Google Scholar] [CrossRef]
- Alqurashi, A.F.; Kumar, L.; Sinha, P. Urban land cover change modelling using time-series satellite images: A case study of urban growth in five cities of Saudi Arabia. Remote Sens. 2016, 8, 838. [Google Scholar] [CrossRef] [Green Version]
- Wardak, A. Crime and social control in Saudi Arabia. In Transnational and Comparative Criminology; Routledge-Cavendish: London, UK, 2005; pp. 91–116. [Google Scholar]
- Benz, U.C.; Hofmann, P.; Willhauck, G.; Lingenfelder, I.; Heynen, M. Multi-resolution, object-oriented fuzzy analysis of remote sensing data for GIS-ready information. ISPRS J. Photogramm. Remote Sens. 2004, 58, 239–258. [Google Scholar] [CrossRef]
- Drǎguţ, L.; Tiede, D.; Levick, S.R. ESP: A tool to estimate scale parameter for multiresolution image segmentation of remotely sensed data. Int. J. Geogr. Inf. Sci. 2010, 24, 859–871. [Google Scholar] [CrossRef]
- Taubenböck, H.; Esch, T.; Felbier, A.; Wiesner, M.; Roth, A.; Dech, S. Monitoring urbanization in mega cities from space. Remote Sens. Environ. 2012, 117, 162–176. [Google Scholar] [CrossRef]
- Zhou, W.; Troy, A. An object-oriented approach for analysing and characterizing urban landscape at the parcel level. Int. J. Remote Sens. 2008, 29, 3119–3135. [Google Scholar] [CrossRef]
- Zhou, W.; Troy, A.; Grove, M. Object-based land cover classification and change analysis in the Baltimore Metropolitan Area using multitemporal high resolution remote sensing data. Sensors 2008, 8, 1613–1636. [Google Scholar] [CrossRef] [Green Version]
- Alqurashi, A.F.; Kumar, L. An assessment of the impact of urbanization and land use changes in the fast-growing cities of Saudi Arabia. Geocarto Int. 2017, 34, 78–97. [Google Scholar] [CrossRef]
- McGarigal, K.; Cushman, S.A.; Neel, M.; Ene, E. FRAGSTATS: Spatial Pattern Analysis Program for Categorical Maps. Computer Software Program Produced by the Authors at the University of Massachusetts, Amherst. 2002. Available online: http://www.umass.edu/landeco/research/fragstats/fragstats (accessed on 18 January 2021).
- Cabral, A.I.R.; Costa, F.L. Land cover changes and landscape pattern dynamics in Senegal and Guinea Bissau borderland. Appl. Geogr. 2017, 82, 115–128. [Google Scholar] [CrossRef]
- Yu, Z.; Wang, Y.; Deng, J.; Shen, Z.; Wang, K.; Zhu, J.; Gan, M. Dynamics of hierarchical urban green space patches and implications for management policy. Sensors 2017, 17, 1304. [Google Scholar] [CrossRef] [PubMed] [Green Version]
- Liu, S.; Zhang, X.Q.; Feng, Y.; Xie, H.; Jiang, L.; Lei, Z. Spatiotemporal dynamics of urban green space influenced by rapid urbanization and land use policies in Shanghai. Forests 2021, 12, 476. [Google Scholar] [CrossRef]
- Abubakar, G.A.; Wu, J.; Shahtahmassebi, A.R.; Wang, K. Necessity of a multifaceted approach in analyzing growth of impervious surfaces. Sustainability 2020, 12, 4109. [Google Scholar] [CrossRef]
- Hesselbarth, M.H.K.; Sciaini, M.; With, K.A.; Wiegand, K.; Nowosad, J. landscapemetrics: An open-source R tool to calculate landscape metrics. Ecography 2019, 42, 1648–1657. [Google Scholar] [CrossRef] [Green Version]
- Mandeli, K. Public space and the challenge of urban transformation in cities of emerging economies: Jeddah case study. Cities 2019, 95, 102409. [Google Scholar] [CrossRef]
- Alsaud, A.B.; Yas, H.; Alatawi, A. A new decision-making approach for Riyadh makes up 50 percent of the non-oil economy of Saudi Arabia. J. Contemp. Issues Bus. Gov. 2021, 27, 3376–3392. [Google Scholar]
- Altuwaijri, H.A.; Alotaibi, M.H.; Almudlaj, A.M.; Almalki, F.M. Predicting urban growth of Arriyadh city, capital of the Kingdom of Saudi Arabia, using Markov cellular automata in TerrSet geospatial system. Arab. J. Geosci. 2019, 12, 135. [Google Scholar] [CrossRef]
- Boulila, W.; Ghandorh, H.; Khan, M.A.; Ahmed, F.; Ahmad, J. A novel CNN-LSTM-based approach to predict urban expansion. Ecol. Inform. 2021, 64, 101325. [Google Scholar] [CrossRef]
- Malik, S.A. Rural Migration and Urban Growth in Riyadh, Saudi Arabia; University of Michigan: Ann Arbor, MI, USA, 1973. [Google Scholar]
- Chen, M.; Zhang, H.; Liu, W.; Zhang, W. The global pattern of urbanization and economic growth: Evidence from the last three decades. PLoS ONE 2014, 9, e103799. [Google Scholar] [CrossRef] [Green Version]
- Vincent, P. Saudi Arabia: An Environmental Overview; CRC Press: London, UK, 2008. [Google Scholar]
- Rahman, M.T.; Aldosary, A.S.; Mortoja, M.G. Modeling future land cover changes and their effects on the land surface temperatures in the Saudi Arabian Eastern Coastal City of Dammam. Land 2017, 6, 36. [Google Scholar] [CrossRef]
- Xu, C.; Liu, M.; Zhang, C.; An, S.; Yu, W.; Chen, J.M. The spatiotemporal dynamics of rapid urban growth in the Nanjing metropolitan region of China. Landsc. Ecol. 2007, 22, 925–937. [Google Scholar] [CrossRef]
- Li, J.; Li, C.; Zhu, F.; Song, C.; Wu, J. Spatiotemporal pattern of urbanization in Shanghai, China between 1989 and 2005. Landsc. Ecol. 2013, 28, 1545–1565. [Google Scholar] [CrossRef]
- Li, S.; Liu, X.; Li, Z.; Wu, Z.; Yan, Z.; Chen, Y.; Gao, F. Spatial and temporal dynamics of urban expansion along the Guangzhou–Foshan inter-city rail transit corridor, China. Sustainability 2018, 10, 593. [Google Scholar] [CrossRef] [Green Version]
- Ranagalage, M.; Morimoto, T.; Simwanda, M.; Murayama, Y. Spatial analysis of urbanization patterns in four rapidly growing south Asian cities using Sentinel-2 Data. Remote Sens. 2021, 13, 1531. [Google Scholar] [CrossRef]


| City | Sensor | Path/Row | Date |
|---|---|---|---|
| Riyadh | TM | 165–166/43 | (13–20 January 1985), (14–15 August 1990), (18–25 August 2000) |
| ETM+ | (20–29 July 2007) | ||
| OLI | (9–16 August 2014), (2–9 March 2020) | ||
| Jeddah | TM | 170/45 | (9 June 1985), (11 September 1990) |
| ETM+ | (1 November 2000), (17 August 2007) | ||
| OLI | (29 September 2014), (24 May 2020) | ||
| Makkah | TM | 169/45 | (30 March 1985), (27 August 1990) |
| ETM+ | (6 August 2000), (5 August 2007) | ||
| OLI | (5 August 2014), (15 April 2020) |
| Metric (Abbreviation) | Description | Equation | |
|---|---|---|---|
| Percent of landscape (PLAND) | A composition metric that measures the percentage of the landscape belonging to urban area. | Pi = proportion of the landscape occupied by patch type (class) i; aij = area (m2) of patch ij; A = Area of the total landscape (m2). | |
| Patch density (PD) | An aggregation metric that measures the fragmentation of urban landscape. | ni = number of patches in the landscape of patch type (class) i. | |
| Edge density (ED) | Describes the configuration of urban landscape. | eik = total length (m) of edge in landscape involving patch type (class) i. | |
| Area weighted mean patch fractal dimension (FRAC_AM) | A shape metric that measures the complexity of patches based on a perimeter to area ratio. Here, area weighting is applied for each patch. | Pij = perimeter (m) of patch ij. | |
| Mean of Euclidean nearest-neighbour distance (ENN_MN) | An aggregation metric that summarises each class as the mean of each patch belonging to urban area. | ENN[patchij] = the Euclidean nearest-neighbour distance of patch ij. | |
| Standard deviation of Euclidean nearest-neighbour distance (ENN_SD) | An aggregation metric that summarises each class as the standard deviation of each patch belonging to urban area. | ||
| Number of patches (NP) | An aggregation metric that measures the fragmentation of urban area. | ||
| Contagion (CONTAG) | An aggregation metric that describes the probability of two random cells belonging to the same class. | Pq = the adjacency table for all classes divided by the sum of the table; t = the number of classes in the landscape. |
| Date | Riyadh | Jeddah | Makkah | |||||||||
|---|---|---|---|---|---|---|---|---|---|---|---|---|
| Producer’s | User’s | Overall | Kappa | Producer’s | User’s | Overall | Kappa | Producer’s | User’s | Overall | Kappa | |
| 1985 | 92.7 | 96.2 | 97.8 | 0.93 | 88.1 | 98.0 | 97.1 | 0.91 | 88.9 | 93.5 | 96.9 | 0.89 |
| 1990 | 88.7 | 96.1 | 96.8 | 0.90 | 90.8 | 95.4 | 96.9 | 0.91 | 95.9 | 92.1 | 97.0 | 0.92 |
| 2000 | 96.4 | 93.9 | 97.8 | 0.94 | 93.3 | 95.6 | 97.7 | 0.93 | 97.1 | 94.3 | 98.0 | 0.94 |
| 2007 | 97.7 | 90.8 | 96.9 | 0.92 | 94.4 | 94.0 | 97.3 | 0.92 | 95.1 | 97.2 | 98.0 | 0.95 |
| 2014 | 96.9 | 95.4 | 97.7 | 0.94 | 94.1 | 90.7 | 96.5 | 0.90 | 97.2 | 92.7 | 96.8 | 0.93 |
| 2020 | 97.8 | 92.9 | 96.8 | 0.93 | 94.9 | 86.2 | 94.5 | 0.86 | 96.9 | 94.0 | 96.7 | 0.93 |
| Distance (km) | Increase (%) | ||||
|---|---|---|---|---|---|
| 1985–1990 | 1990–2000 | 2000–2007 | 2007–2014 | 2014–2020 | |
| 5 | 5.3 | 4.8 | 3.0 | 0.4 | 0.9 |
| 10 | 10.9 | 14.7 | 10.8 | 2.9 | 2.0 |
| 15 | 17.9 | 21.8 | 20.7 | 6.0 | 4.2 |
| 20 | 20.5 | 29.3 | 26.9 | 7.8 | 5.5 |
| 25 | 22.8 | 34.1 | 34.1 | 11.2 | 7.0 |
| 30 | 23.0 | 34.9 | 37.7 | 14.6 | 8.1 |
| 35 | 22.6 | 35.2 | 38.6 | 16.4 | 8.6 |
| 40 | 22.2 | 35.3 | 39.1 | 17.4 | 8.7 |
| * >40 | 21.7 | 36.8 | 39.6 | 17.6 | 8.8 |
| Distance (km) | Increase (%) | ||||
|---|---|---|---|---|---|
| 1985–1990 | 1990–2000 | 2000–2007 | 2007–2014 | 2014–2020 | |
| 5 | 17.4 | 12.9 | 4.5 | 4.2 | 2.4 |
| 10 | 26.8 | 18.3 | 6.4 | 5.3 | 2.1 |
| 15 | 33.2 | 28.9 | 10.5 | 10.4 | 4.2 |
| 20 | 33.9 | 33.2 | 13.0 | 21.0 | 6.9 |
| 25 | 35.1 | 37.9 | 13.7 | 26.8 | 8.5 |
| 30 | 35.7 | 39.7 | 15.5 | 29.9 | 9.6 |
| 35 | 36.5 | 39.9 | 17.4 | 33.4 | 10.5 |
| 40 | 36.7 | 39.9 | 18.0 | 35.6 | 11.7 |
| * >40 | 37.7 | 40.7 | 18.6 | 36.7 | 13.0 |
| Distance (km) | Increase (%) | ||||
|---|---|---|---|---|---|
| 1985–1990 | 1990–2000 | 2000–2007 | 2007–2014 | 2014–2020 | |
| 5 | 20.1 | 12.1 | 3.1 | 10.8 | 1.3 |
| 10 | 28.0 | 30.9 | 10.4 | 27.1 | 6.5 |
| 15 | 29.5 | 29.8 | 14.6 | 34.2 | 8.1 |
| 20 | 29.0 | 29.7 | 17.1 | 39.1 | 8.3 |
| * >20 | 28.9 | 29.8 | 17.9 | 43.4 | 8.4 |
Publisher’s Note: MDPI stays neutral with regard to jurisdictional claims in published maps and institutional affiliations. |
© 2021 by the author. Licensee MDPI, Basel, Switzerland. This article is an open access article distributed under the terms and conditions of the Creative Commons Attribution (CC BY) license (https://creativecommons.org/licenses/by/4.0/).
Share and Cite
Alqurashi, A.F. Quantification of Urban Patterns and Processes through Space and Time Using Remote Sensing Data: A Comparative Study between Three Saudi Arabian Cities. Sustainability 2021, 13, 12615. https://doi.org/10.3390/su132212615
Alqurashi AF. Quantification of Urban Patterns and Processes through Space and Time Using Remote Sensing Data: A Comparative Study between Three Saudi Arabian Cities. Sustainability. 2021; 13(22):12615. https://doi.org/10.3390/su132212615
Chicago/Turabian StyleAlqurashi, Abdullah F. 2021. "Quantification of Urban Patterns and Processes through Space and Time Using Remote Sensing Data: A Comparative Study between Three Saudi Arabian Cities" Sustainability 13, no. 22: 12615. https://doi.org/10.3390/su132212615
APA StyleAlqurashi, A. F. (2021). Quantification of Urban Patterns and Processes through Space and Time Using Remote Sensing Data: A Comparative Study between Three Saudi Arabian Cities. Sustainability, 13(22), 12615. https://doi.org/10.3390/su132212615