Article

Mini-Crack Detection of Conveyor Belt Based on Laser Excited Thermography

1
Key Laboratory of Metallurgical Equipment and Control Technology of Ministry of Education, Wuhan University of Science and Technology, Wuhan 430081, China
2
Hubei Key Laboratory of Mechanical Transmission and Manufacturing Engineering, Wuhan University of Science and Technology, Wuhan 430081, China
3
Key Laboratory for Port Handling Technology Ministry of Communication, Wuhan University of Technology, Wuhan 430063, China
*
Author to whom correspondence should be addressed.
Appl. Sci. 2021, 11(22), 10766; https://doi.org/10.3390/app112210766
Submission received: 7 October 2021 / Revised: 10 November 2021 / Accepted: 11 November 2021 / Published: 15 November 2021

Abstract

:
For a belt conveyor, a belt with mini-cracks influences the safety of the operation of the belt conveyor devices significantly. The lumpy material rubbing against a belt with mini-cracks will lead to detrimental tears on the belt while the conveyor works at high speeds. In order to detect mini-cracks in a timely manner, before the occurrence of large tears, a new mini-crack detection method for conveyor belts based on laser excited thermography is proposed. A laser beam is applied to generate a heat wave on the belt surface, so the corresponding thermal images can be recorded by an infrared camera. Then, an algorithm for extracting and fusing the features of mini-crack belt’s thermal images is firstly proposed by using time sequence analysis. It could transform multiple sequential thermal images into a single thermal image according to the frame difference method, so that the infrared thermal response of the mini-crack over time could be recorded quickly. To reveal the features of mini-crack, the power function image enhancement algorithm is proposed. After that, the threshold segmentation and Hough transform algorithm are used to determine the size of the mini-crack. The experimental results show that the mini-cracks with length of 50–140 mm, width of 1–10 mm, and depth of 5 mm can be successfully detected, and the detection accuracy could reach 96%. The detection results of different sizes of mini-crack show that the laser excited thermography has high damage sensitivity (1 mm diameter mini-crack detection), high accuracy (96%), lower power consumption (15 W laser excitation), and high SNR (signal-to-noise ratio).

1. Introduction

Conveyor belt is one of the critical components of belt conveyor system for continuously bulk materials transportation. It carries and transports various of powder, granular, and bulk materials [1]. With the widely use of belt conveyor system in the industrial field, the equipment safety has been widely concerned [2]. For example, belt fracture or longitudinal tear accidents account for a considerable part of all conveyor belt safety accidents. Hence, the research of the tear detection of conveyor belts is of great significance [3,4].
A rubber–textile conveyor belt is usually made of three-layer composite materials, in which the rubber is used for the upper and bottom layers, and nylon and steel cord are used for the belt core. The tear of conveyor belt generally occurs when lumpy material first rubs against the upper layer and then penetrates the lower covering layer [5]. The entire tearing process goes through scratch, wear, puncture, and longitudinal tear [6]. In order to prevent the conveyor belt from breaking due to tearing and repair the belt, it is necessary to detect the early damage of the conveyor belt.
At present, there are generally two methods of conveyor belt crack detection: contact detection and non-contact detection. The contact detection methods usually add an extra mechanical component [7], embed an induction coil [8] or a radio frequency identification device [9] into the conveyor belt for tear detection. However, the contact detection method would gradually reduce the detection accuracy due to contact wear. Therefore, the non-contact defect detection method has been gradually developed. More and more defect detection methods based on machine vision are proposed in non-contact detection methods [10]. In ref. [11], an improved single-scale Retinex (SSR) algorithm is used for image enhancement, and the features—including the area, damage level, and squareness—are extracted by the greyscale image. Reference [12] aims at surface damage identification of conveyor belts. A multi-class support vector machine (SVM) real-time detection system is proposed based on visual saliency. In order to further improve the identification accuracy, Wang et al. [13] propose a longitudinal tear detection of a conveyor belt under uneven light based on Haar-Ada Boost and Cascade algorithm. Zhang et al. [14] propose a new detection method that can simultaneously detect multiple faults based on an improved Yolov3 algorithm. Nevertheless, these methods based on visible light images and image processing algorithm are very sensitive to light intensity and dusty environment, which would trigger false alarms. In order to highlight the crack features more obviously, auxiliary equipment is applied to the crack detection of conveyor belt. Qiao et al. [15] use laser and area light sources to enhance the contrast between conditional features and conveyor belt surface. They propose a false corner filtration and single-point feature identification method to detect longitudinal tears. In ref. [16], two red laser stripes are projected on the back of the upper conveyor belt to improve detection efficiency and precision.
At the same time, many scholars [17] consider the local heating of the conveyor belt caused by the friction between materials and the conveyor belt, and adopted infrared vision to detect conveyor belt tears. Reference [18] proposes the bidirectional reflectance distribution function (BRDF) to build models of infrared spectroscopic imaging. Yang et al. [19] use only one infrared camera to capture images for early-warning of longitudinal tear and proposed a simple automatic threshold select algorithm for the infrared image binarization. Yang et al. [20] propose a novel approach based on infrared spectrum analysis for early warning of longitudinal tearing of the conveyor belt. In ref. [21], an integrative binocular vision detection (IBVD) method is proposed with visible and infrared vision fusion. To reduce the poor visibility impact on IBVD, a dual-band infrared detection (DBID) technique is proposed by analyzing mid-infrared and long infrared images to meet the requirement of real-time online detection [22]. Concerning the feature of normal, wear and tear of conveyor belt, Hou et al. [23] propose a multispectral visual detection method to distinguish the different feature state of the conveyor belt. However, infrared imaging equipment is susceptible to external radiation. When the amount of infrared radiation in the target area is equal to that in the environment, the quality of infrared images will be affected [24]. Therefore, the defect detection method based on infrared imaging needs to further enhance the infrared characteristics of the target region.
Benefitting from the recent advances in structural health monitoring (SHM) [25,26] and nondestructive testing (NDT) [27,28], many different methods, such as thermography [29,30], ultrasonics [31,32], have been developed, and some of them have been applied to detection/monitoring of cracks on conveyor belts. J. Gonzalez et al. [33] used a CW laser to scan the surface of stainless steel samples with constant motion for submicron crack detection. Ishikawa et al. [34] studied a CO2 laser scanning device for scanning carbon fiber reinforced plastic (CFRP) samples at a distance and determining the crack zone by analyzing the temperature of the defect surface. James et al. [35] proposes the impact damage detection of polymer composites (aircraft components) based on remote line scanning thermal Imager. Montinaro et al. [36] used the continuous laser scanning of metal fiber laminates (FMLs) to analyze the interlaminar peeling defects of metal fiber laminates (FMLs) by thermal image. Swiderski et al. [37] used a semiconductor laser to heating the multi-layer carbon composite material, which was composed of carbon fiber fabric and thin epoxy resin (CFRP). The temperature field changes on the sample surface were recorded and used to detect the delamination defects. Salazar et al. [38] proposes a nondestructive testing method based on flying spot thermography, which is used to measure thermal diffusivity and crack width.
The method of laser excited thermography is an active thermography method. Compared with the passive thermography method (which uses an infrared camera to collect the thermal wave generated in the process of conveyor belt friction heating), the laser excited thermography does not rely on the local heating characteristics caused by conveyor belt friction and can detect mini-cracks before the occurrence of a large tear.
In order to meet the needs of industrial development, a mini-crack detection method on conveyor belt based on laser excited thermography is proposed in this paper. The surface of the conveyor belt is heated by a laser beam, then the frame difference method is used to extract the image to quickly record the temperature change of the mini-crack under laser heating. The image features are extracted and fused by mini-crack feature imaging algorithm. At the same time, the power function image enhancement algorithm based on thermal signals further reveals the features of mini-cracks. Finally, the threshold segmentation and Hough transform algorithm are used to determine the size of the mini-cracks.
The rest of the paper is organized as follows. Section 2 reviews the basics about mini-crack detection using laser excited thermography. Section 3 proposes the detailed method with algorithms for the mini-crack detection based on the laser excited thermography. Section 4 presents the experimental methods, results, and the discussion. Finally, Section 5 concludes the paper with recommendation for future work.

2. Mini-Crack Detection System Based on Laser Excited Thermography

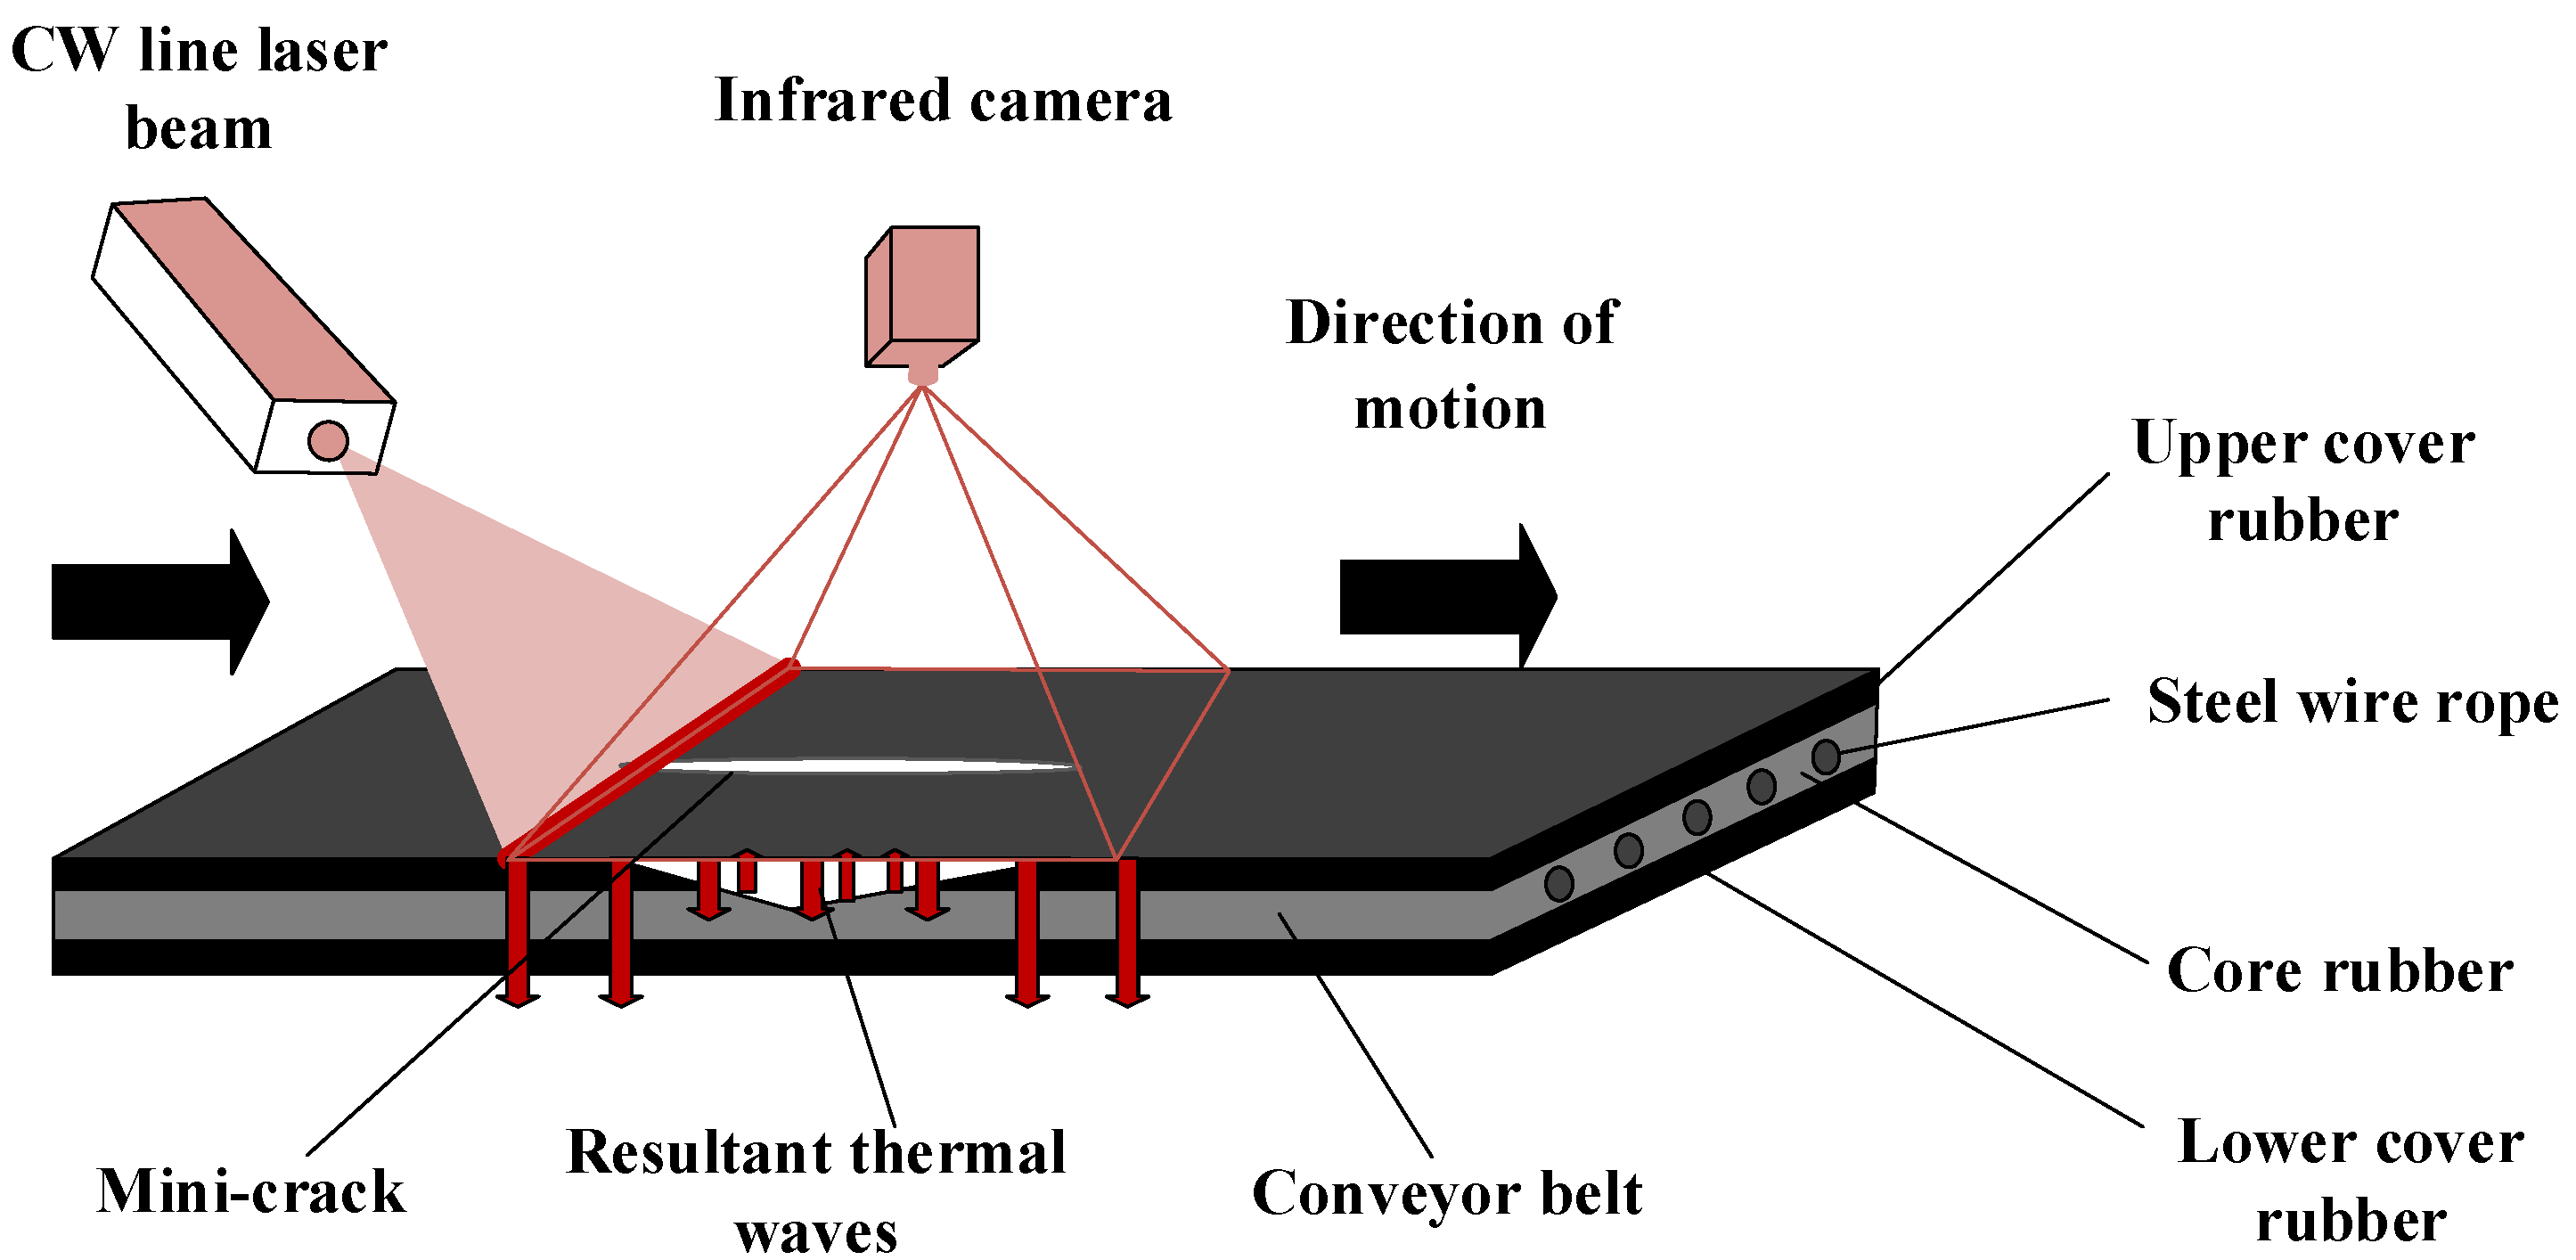
2.1. Detection Theory

Figure 1 illustrates the working principle of laser excited thermography for conveyor belt mini-crack detection. The conveyor belt is composed of the upper, intermediate, and lower layers. The rubber in the upper and lower layers is mainly butadiene rubber (BR), and the intermediate layer is a mixture of styrene butadiene rubber (SBR) and natural rubber (NR) to maintain good adhesion to the wire rope [39]. When the mini-cracks appear on the conveyor belt, the intermediate layer rubber will be exposed.
The transmission peaks of the butadiene rubber in the range of 3.3–3.6 μm are based on the infrared spectrum of the conveyor belt. The infrared spectrum analysis of the intermediate layer rubber (SBR, NR) shows that the main peak of transmittance is within the range of 6.6–7.1 μm [40]. In other words, different materials will produce different temperature changes under laser beam irradiation, which emitted different of infrared light intensity [41].
Therefore, the damage of conveyor belt can be judged by analyzing the intensity of infrared radiation. When the conveyor belt is scanned by the CW laser beam, the thermal wave propagation characteristics are different of the mini-cracked area and the normal area. Then, the mini-crack can be easily detected by capturing the thermal wave distribution in the conveyor belt. Therefore, the method of laser excited thermography can be used for mini-crack detection. Furthermore, considering sensor installation and feasibility, a mini-crack-detection system based on laser excited thermography is designed. The proposed system can automatically detect mini-cracks when the conveyor belt moves longitudinally.

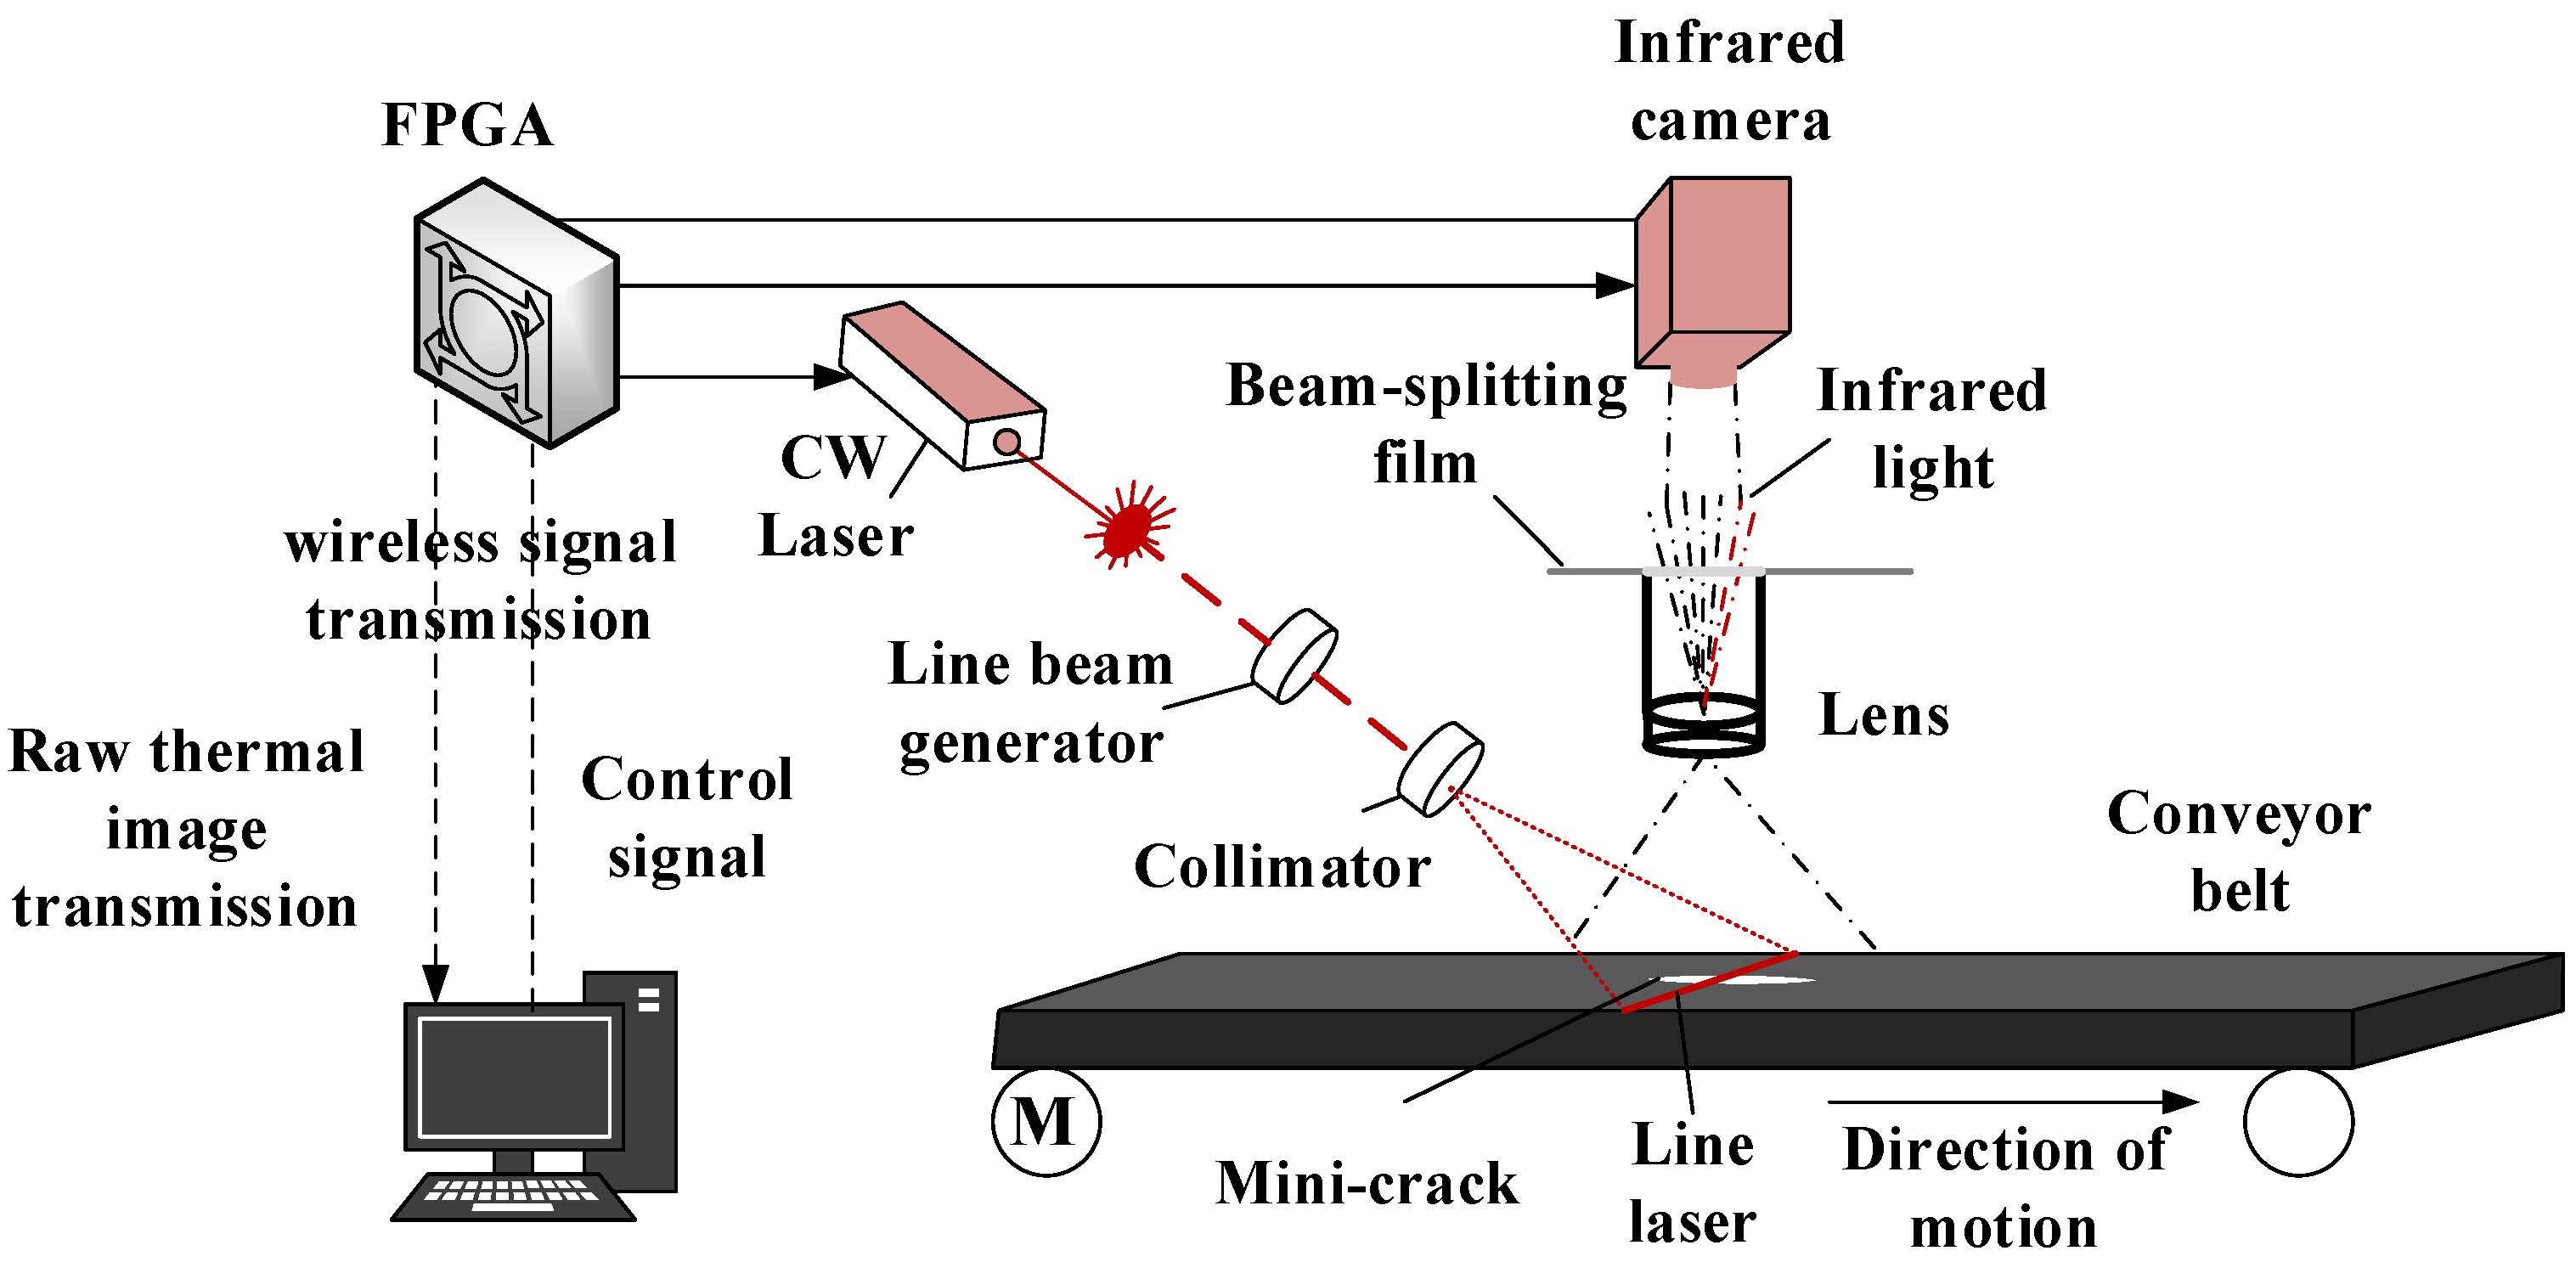
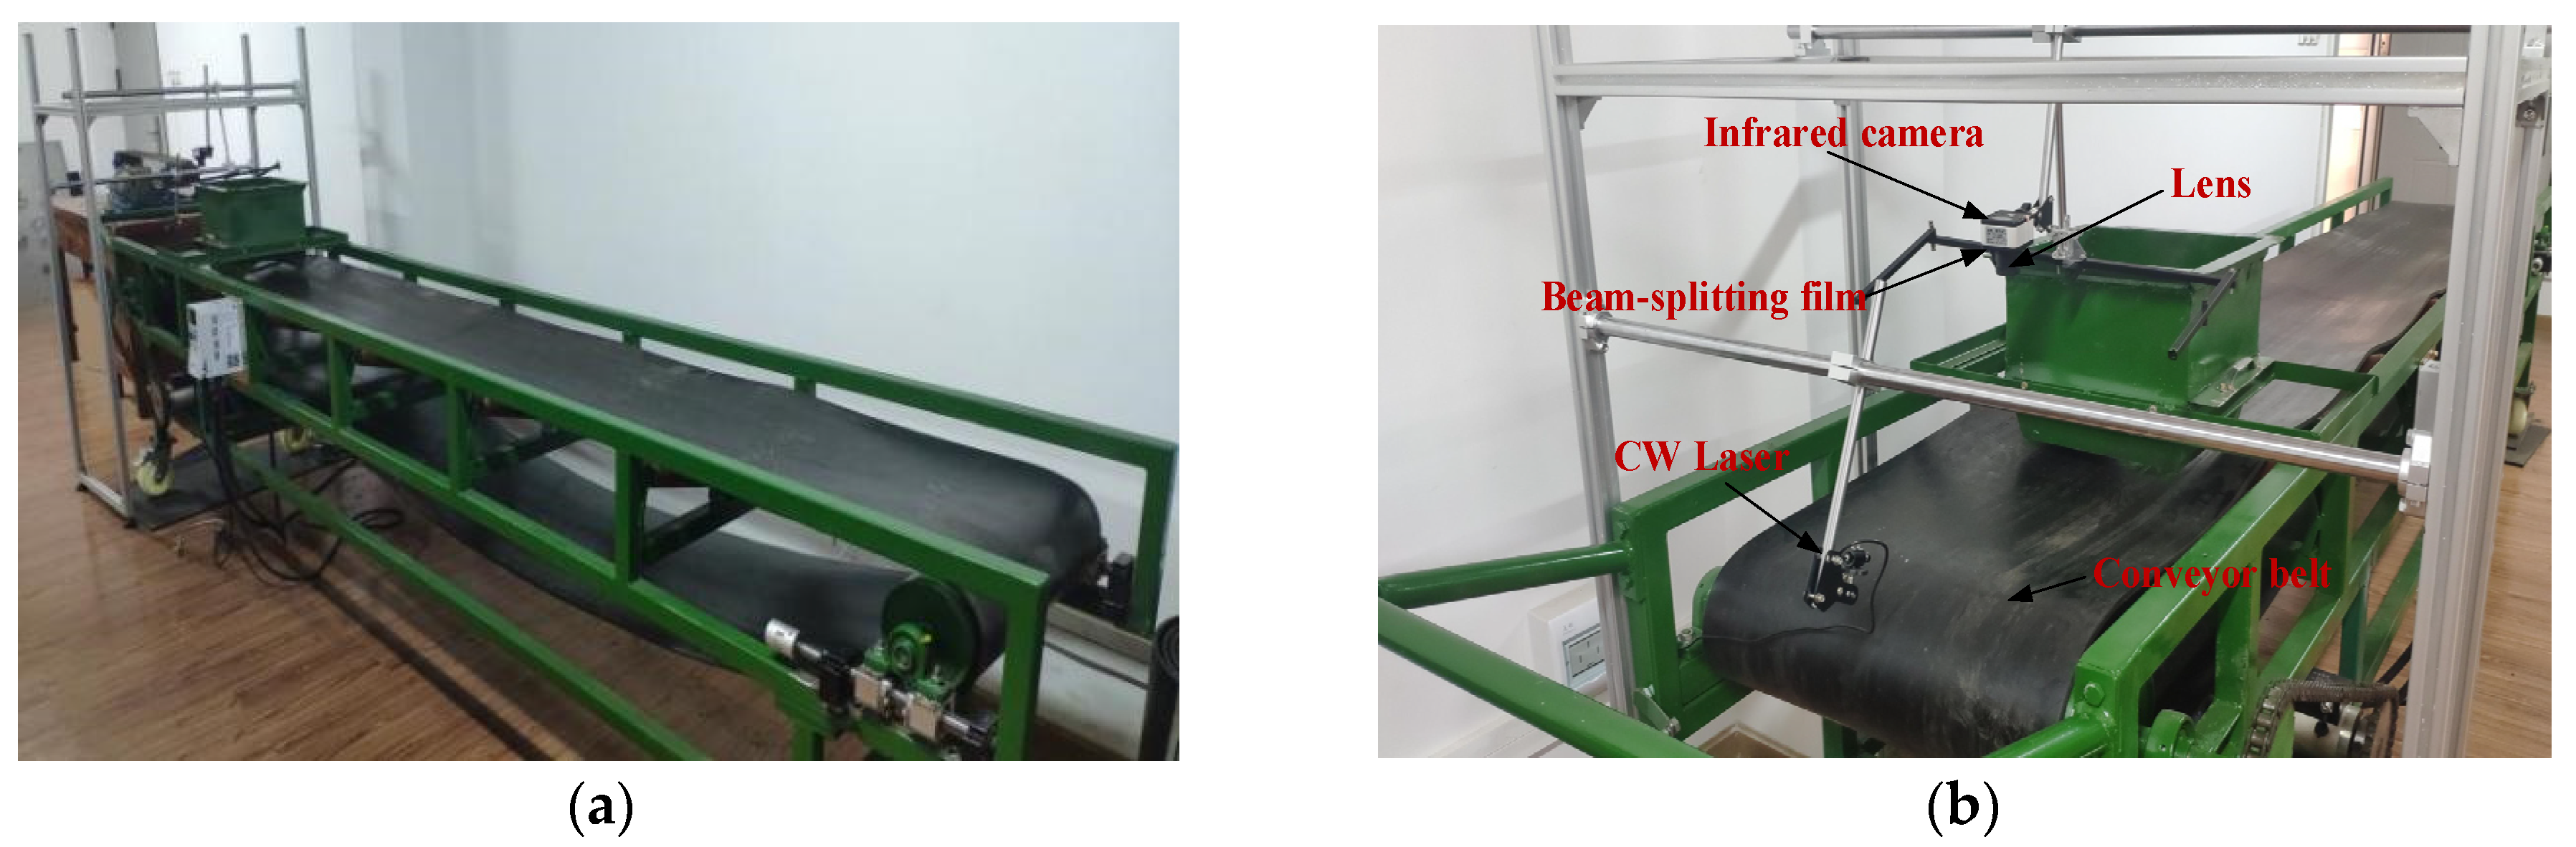
2.2. Detection System

The schematic of the mini-crack detection system based on laser excited thermography is shown in Figure 2, and the system is composed of a CW laser scanning device, an image acquisition device, and a control device. The surface of the conveyor belt is heated by a CW laser beam, and an infrared camera records the corresponding thermal response simultaneously. Then, the thermal response is transmitted to the image processing unit.
The CW laser scanning device consists of a CW laser beam generator and a collimator. When the conveyor belt runs continuously, the space-fixed CW laser beam actively scans the conveyor belt surface and generates thermal waves. The CW laser scanning device receives the control signal and emits a CW laser beam to the conveyor belt. Then the collimator is used as a beam generator to transformed CW point laser beam into line laser. The infrared radiation intensity from the conveyor belt depends on materials in different layers and belt speed when the moving belt heated by the same laser beam. In this paper, a CW laser with the power of 15 W is used as a heat source. The conveyor belt which consists of three-layer composite rubber materials operates at maximum running speed of 1 m/s.
The image acquisition device consists of a focusing lens, a beam splitting membrane and an infrared camera. A focusing lens is used to adjust the focal length of the infrared camera. Beam splitting membranes are used to separate the visible and the infrared beam. The spectrum working range of the beam splitting membrane is 6.5–7.5 μm [42]. The beam splitting membranes can prevent the light beyond the limited wavelength from entering the thermal imager, which can avoid the influence of infrared of infrared and visible light in the environment on infrared thermal imaging to a certain extent. Finally, the infrared camera captures the thermal wave on the conveyor belt.
The control unit is used to control the operation of the conveyor belt and the start-up of the CW laser scanning device. To avoid surface overheating, the CW laser scanning device is usually started after the conveyor belt operates normally and shut down before the conveyor stops running.

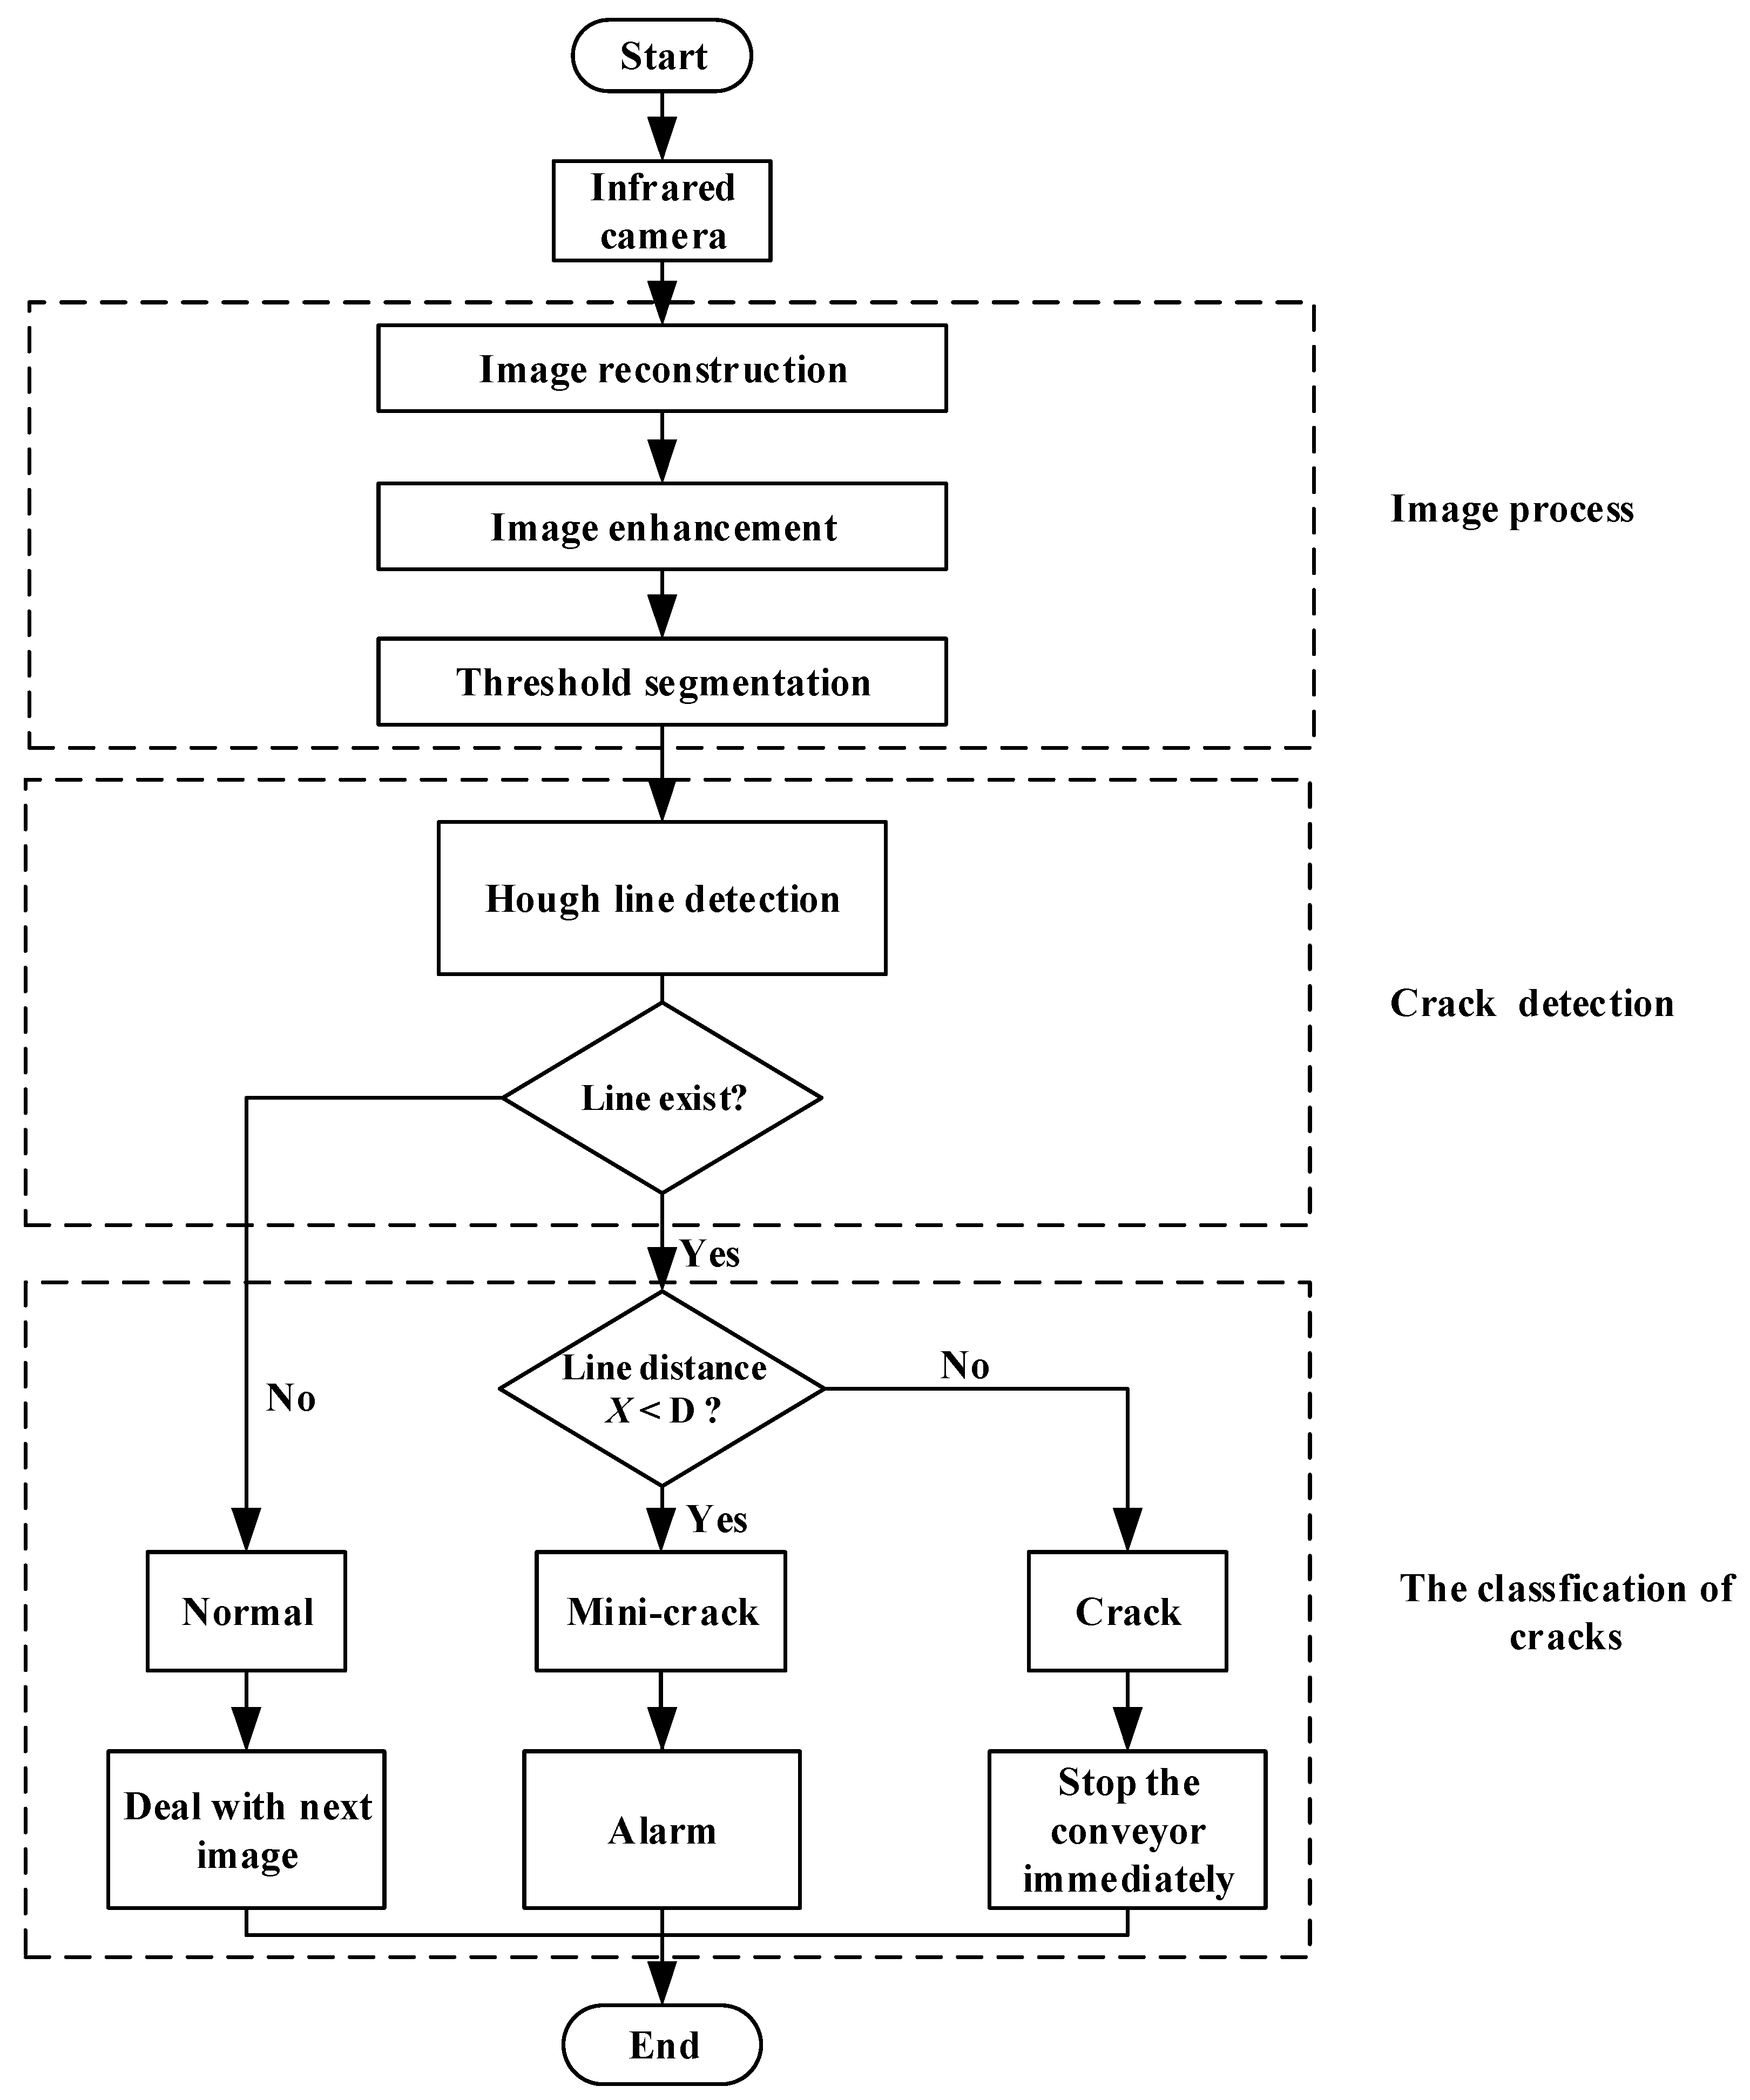
3. Principle of the Proposed Method

In this section, a new assessment method of conveyor belt mini-crack is proposed. The method consists of mini-crack feature extraction, image enhancement, threshold segmentation, and mini-crack determination.

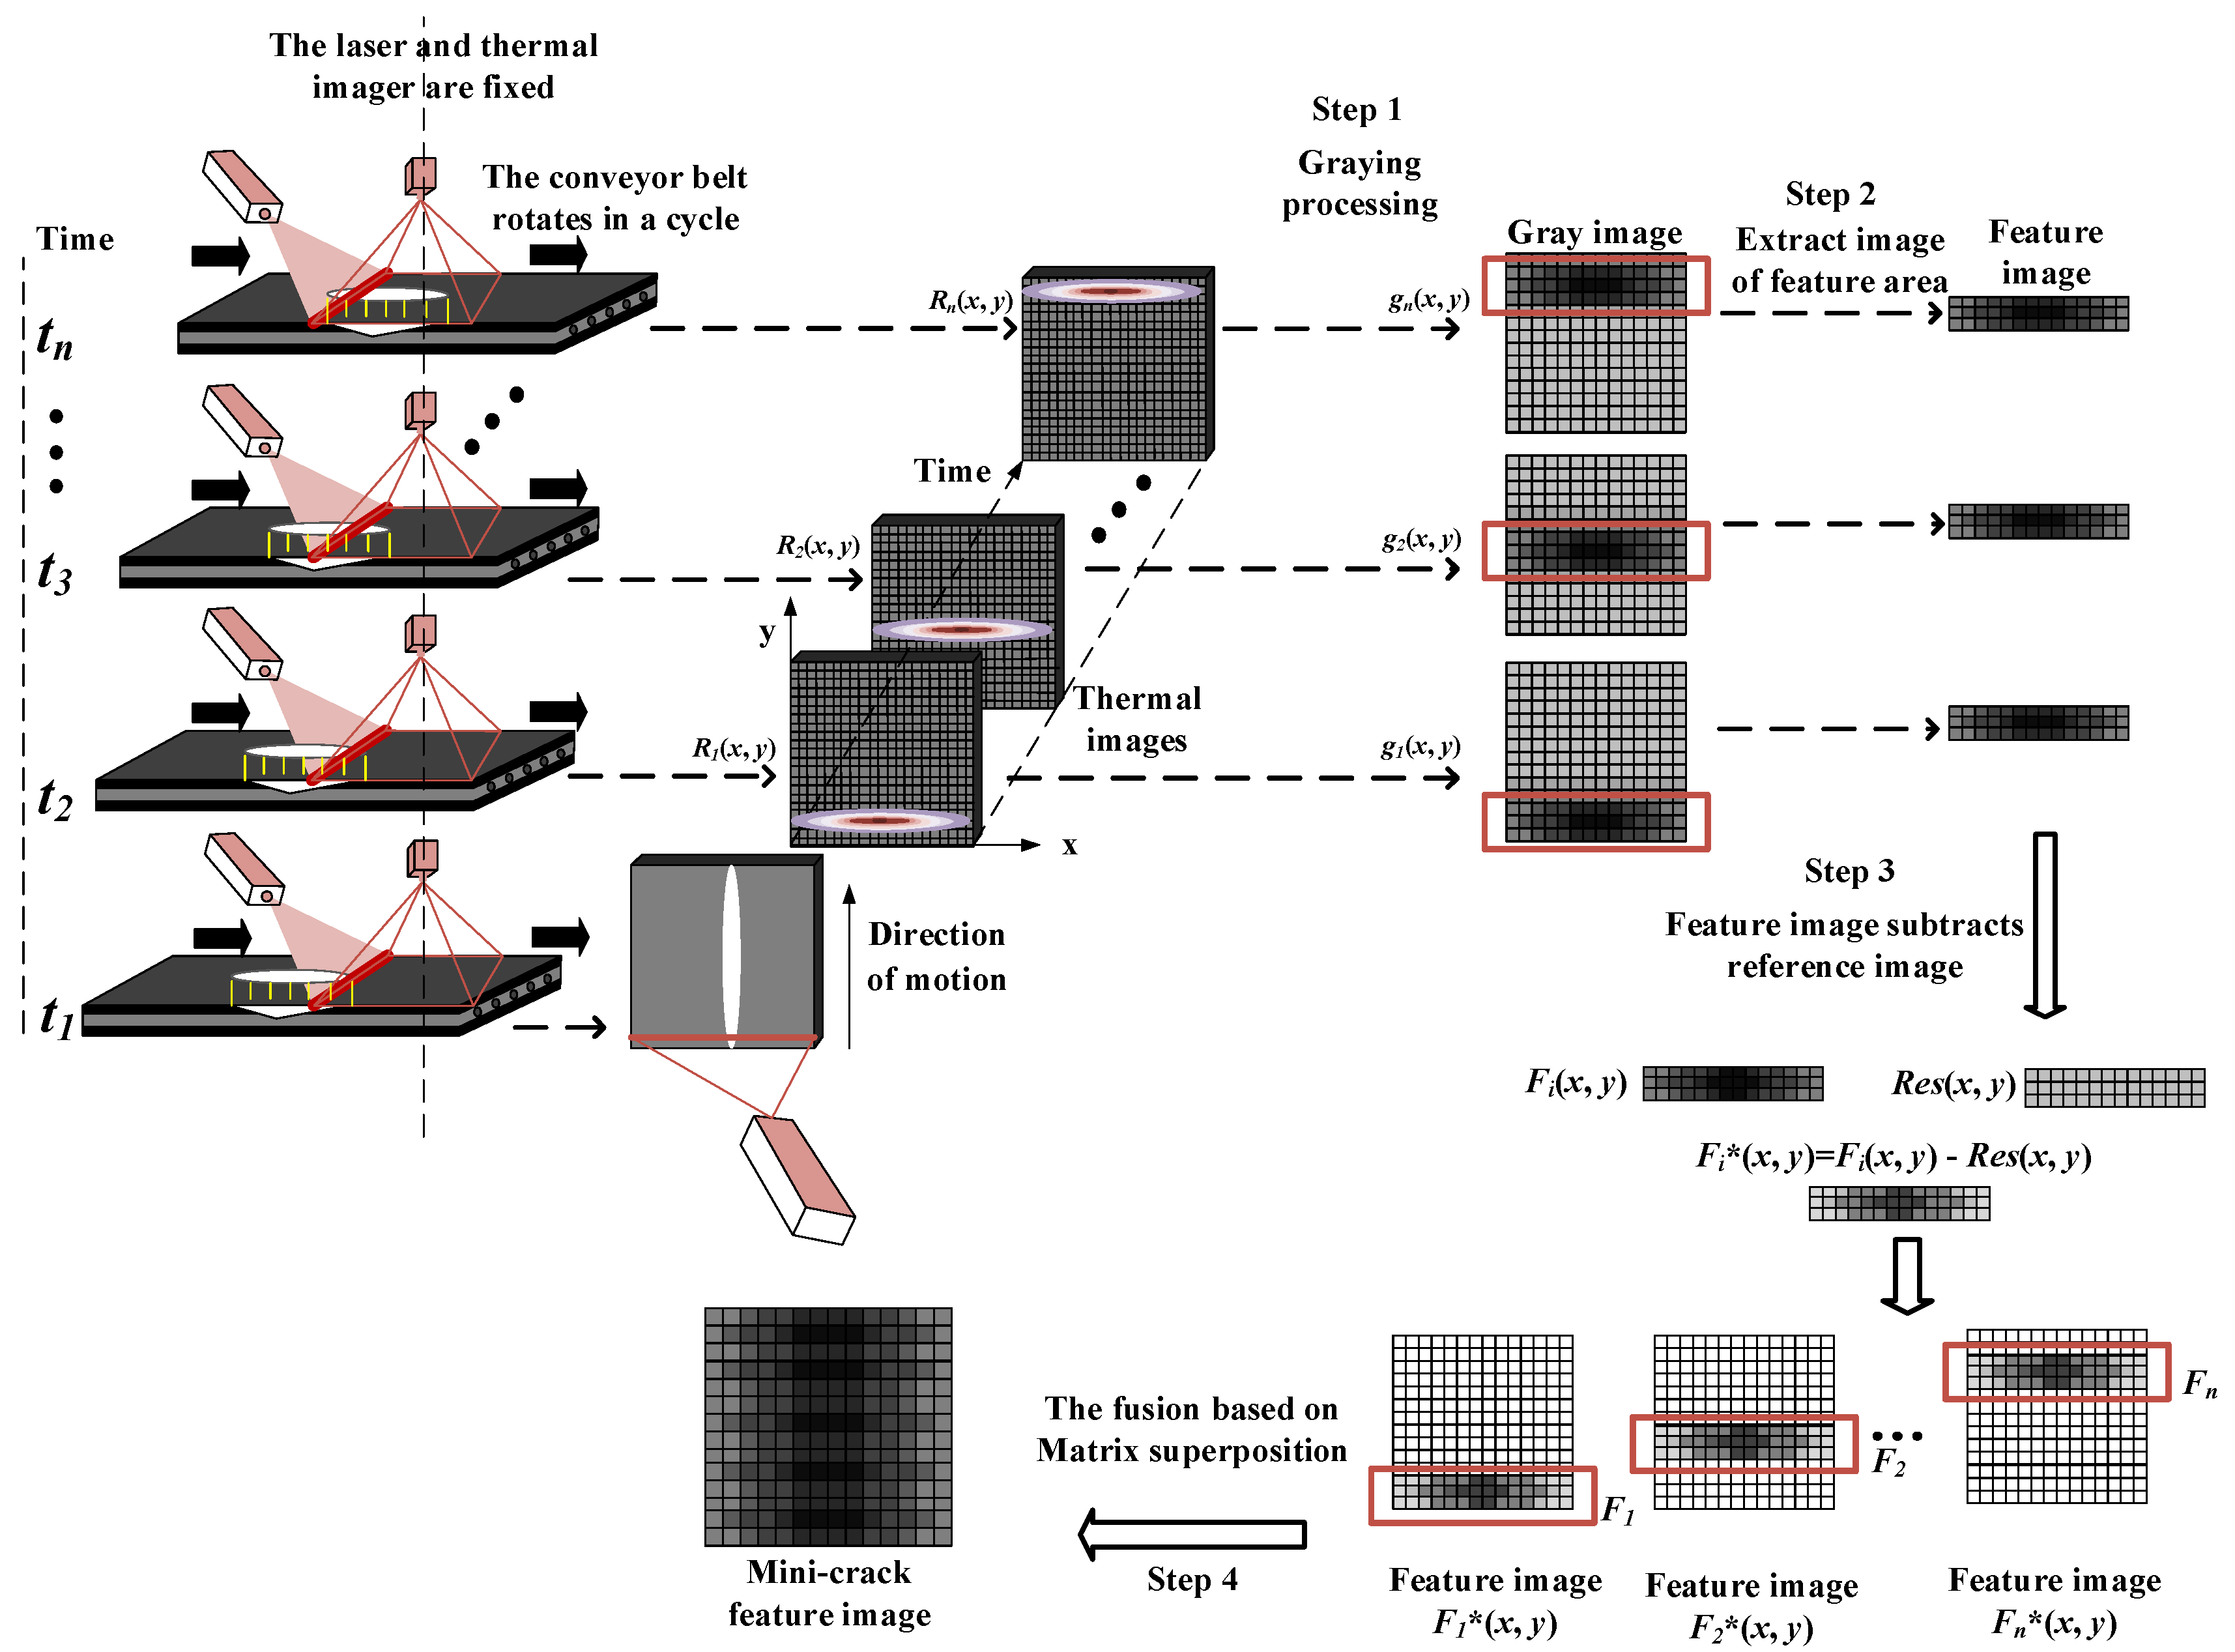
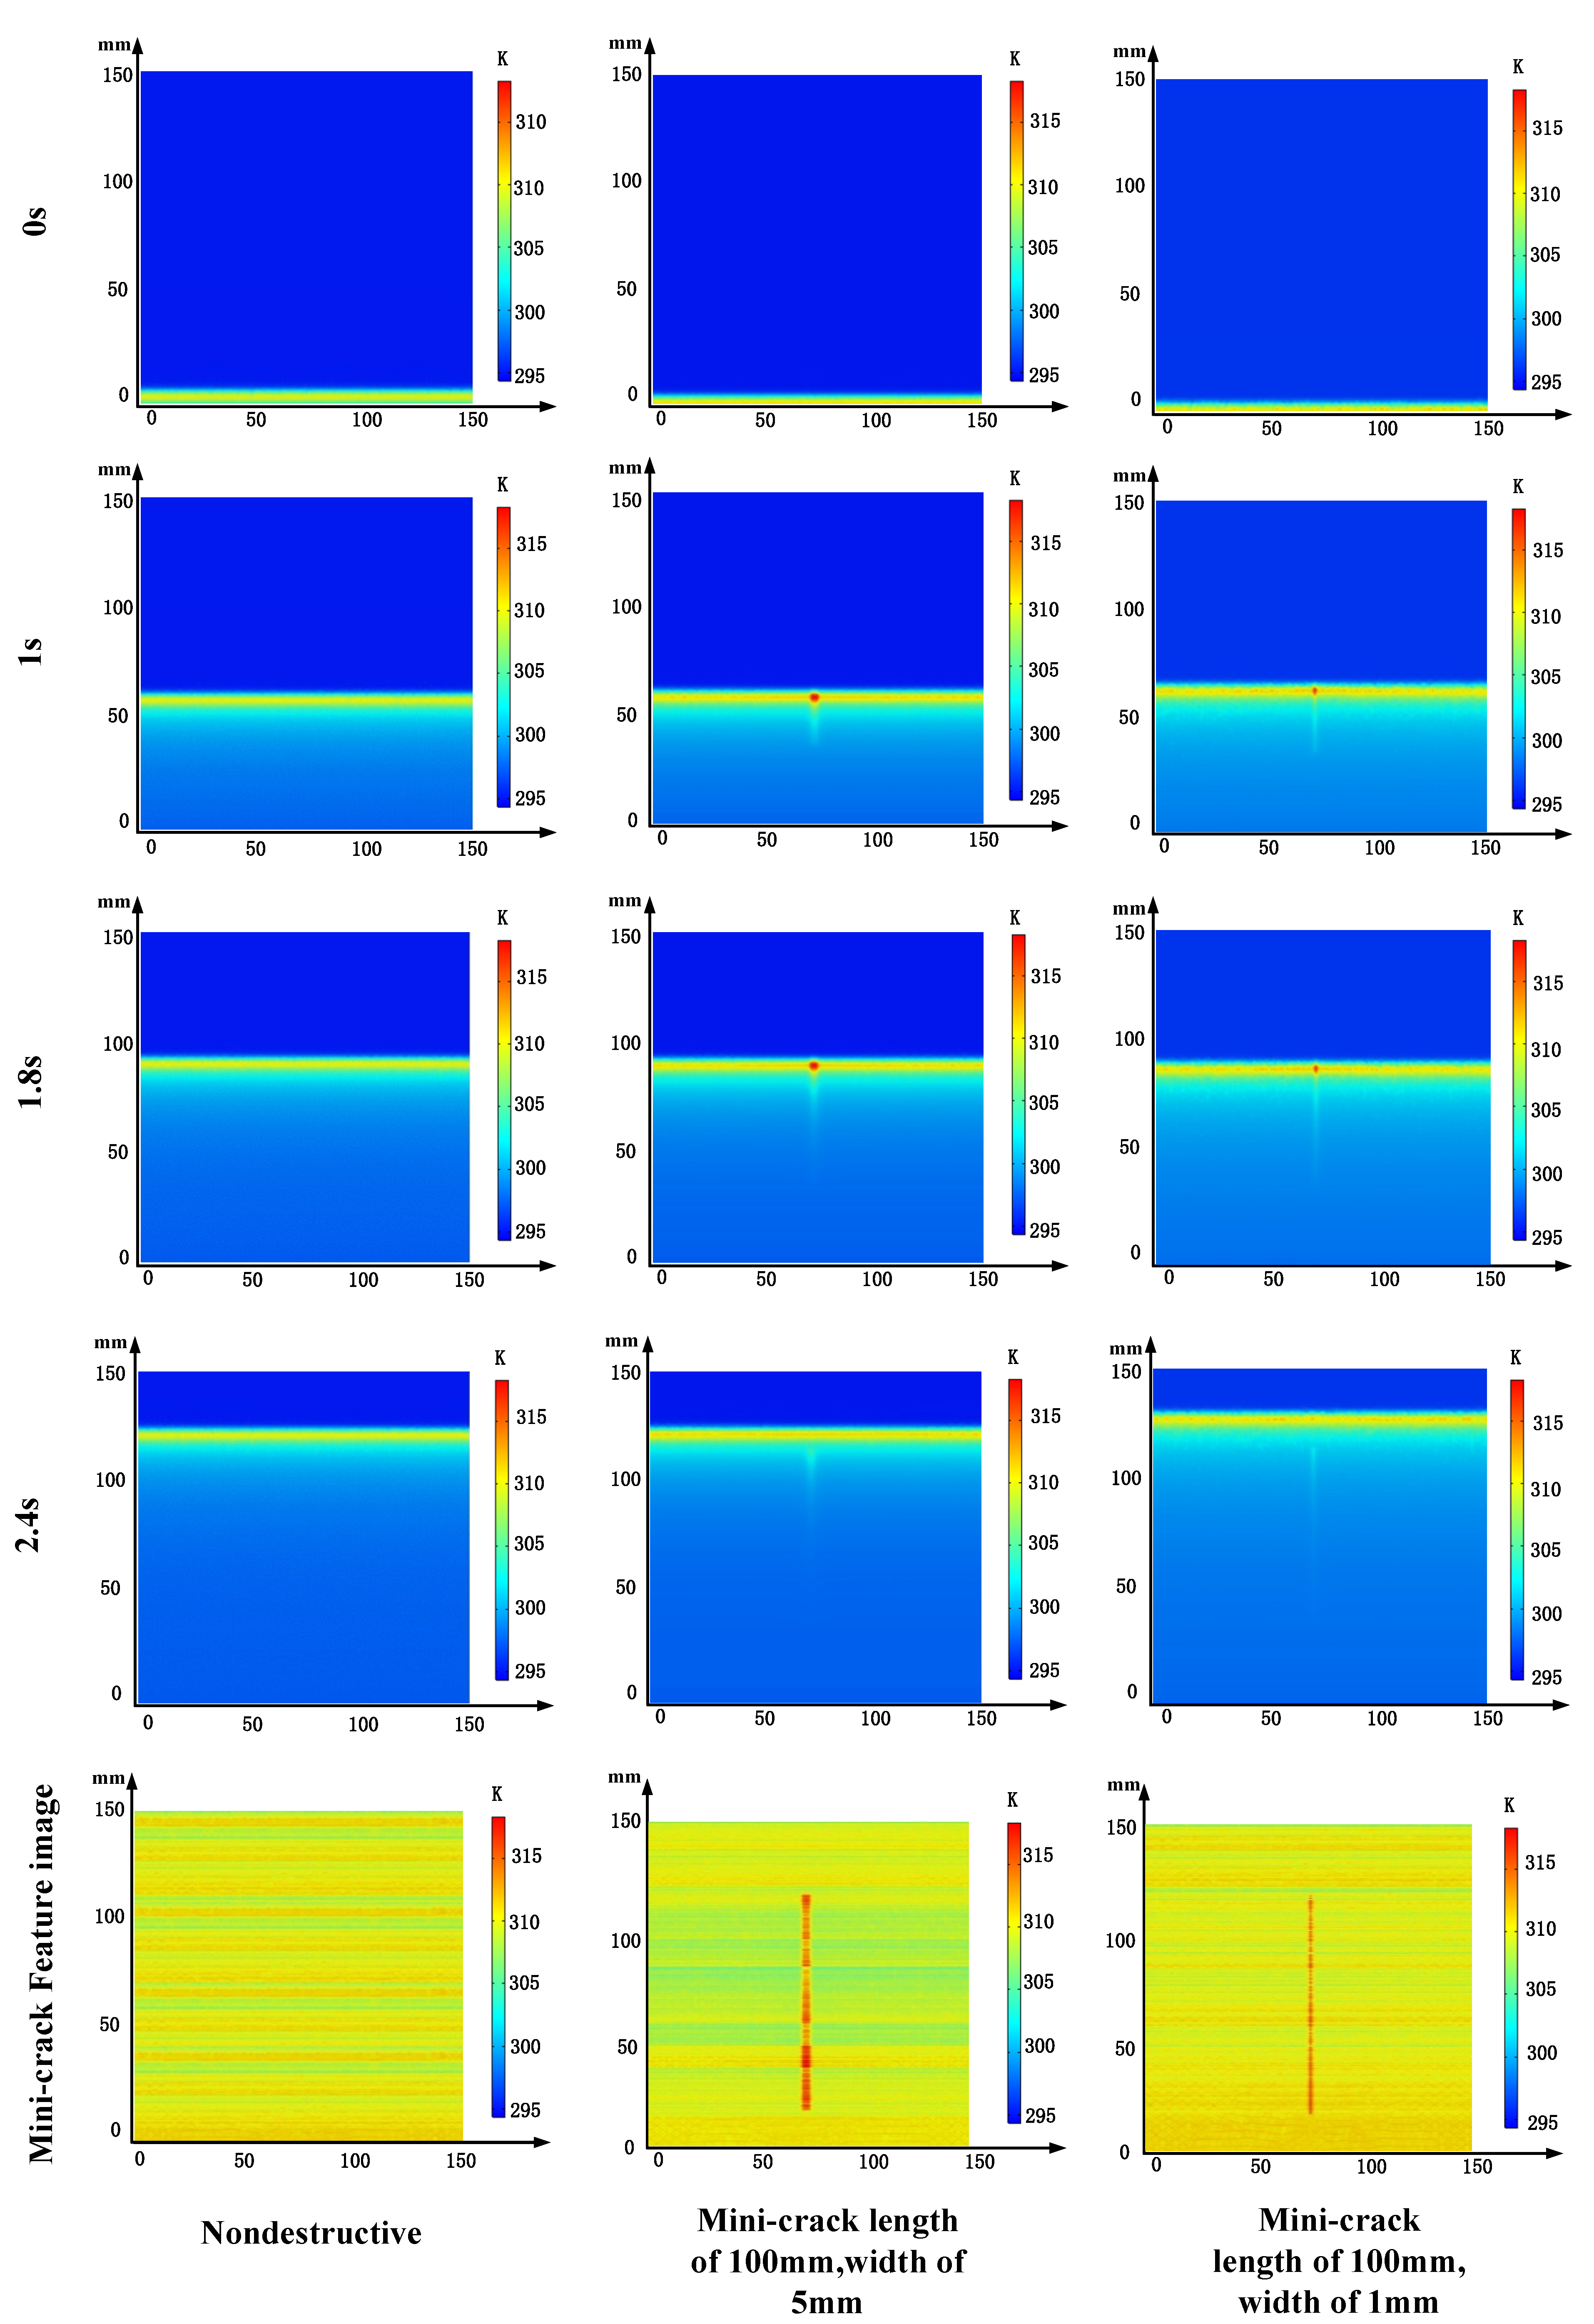
3.1. Mini-Crack Feature Extraction Based on Laser Excited Thermography

Mini-crack feature extraction based on laser excited thermography is shown in Figure 3. The process of image reconstruction is shown in Figure 4. CW laser and infrared camera are fixed. As the conveyor belt rotates, the infrared camera and CW laser are turned on at the same time to record the infrared thermal image of the conveyor belt surface under laser excitation. The infrared camera collects n frames thermal images in the time period of T. Feature extraction is carried out on each image to obtain the feature image ni, and then the n feature images are fused according to time series. A new mini-crack feature image M can be obtained by fusing the feature images ni of all the excitation point regions in the time period T. It is worth noting that timely capture of laser excited thermography can effectively avoid the impact of excitation point cooling and thermal radiation diffusion on the final mini-crack determination results. The specific steps are as follows:
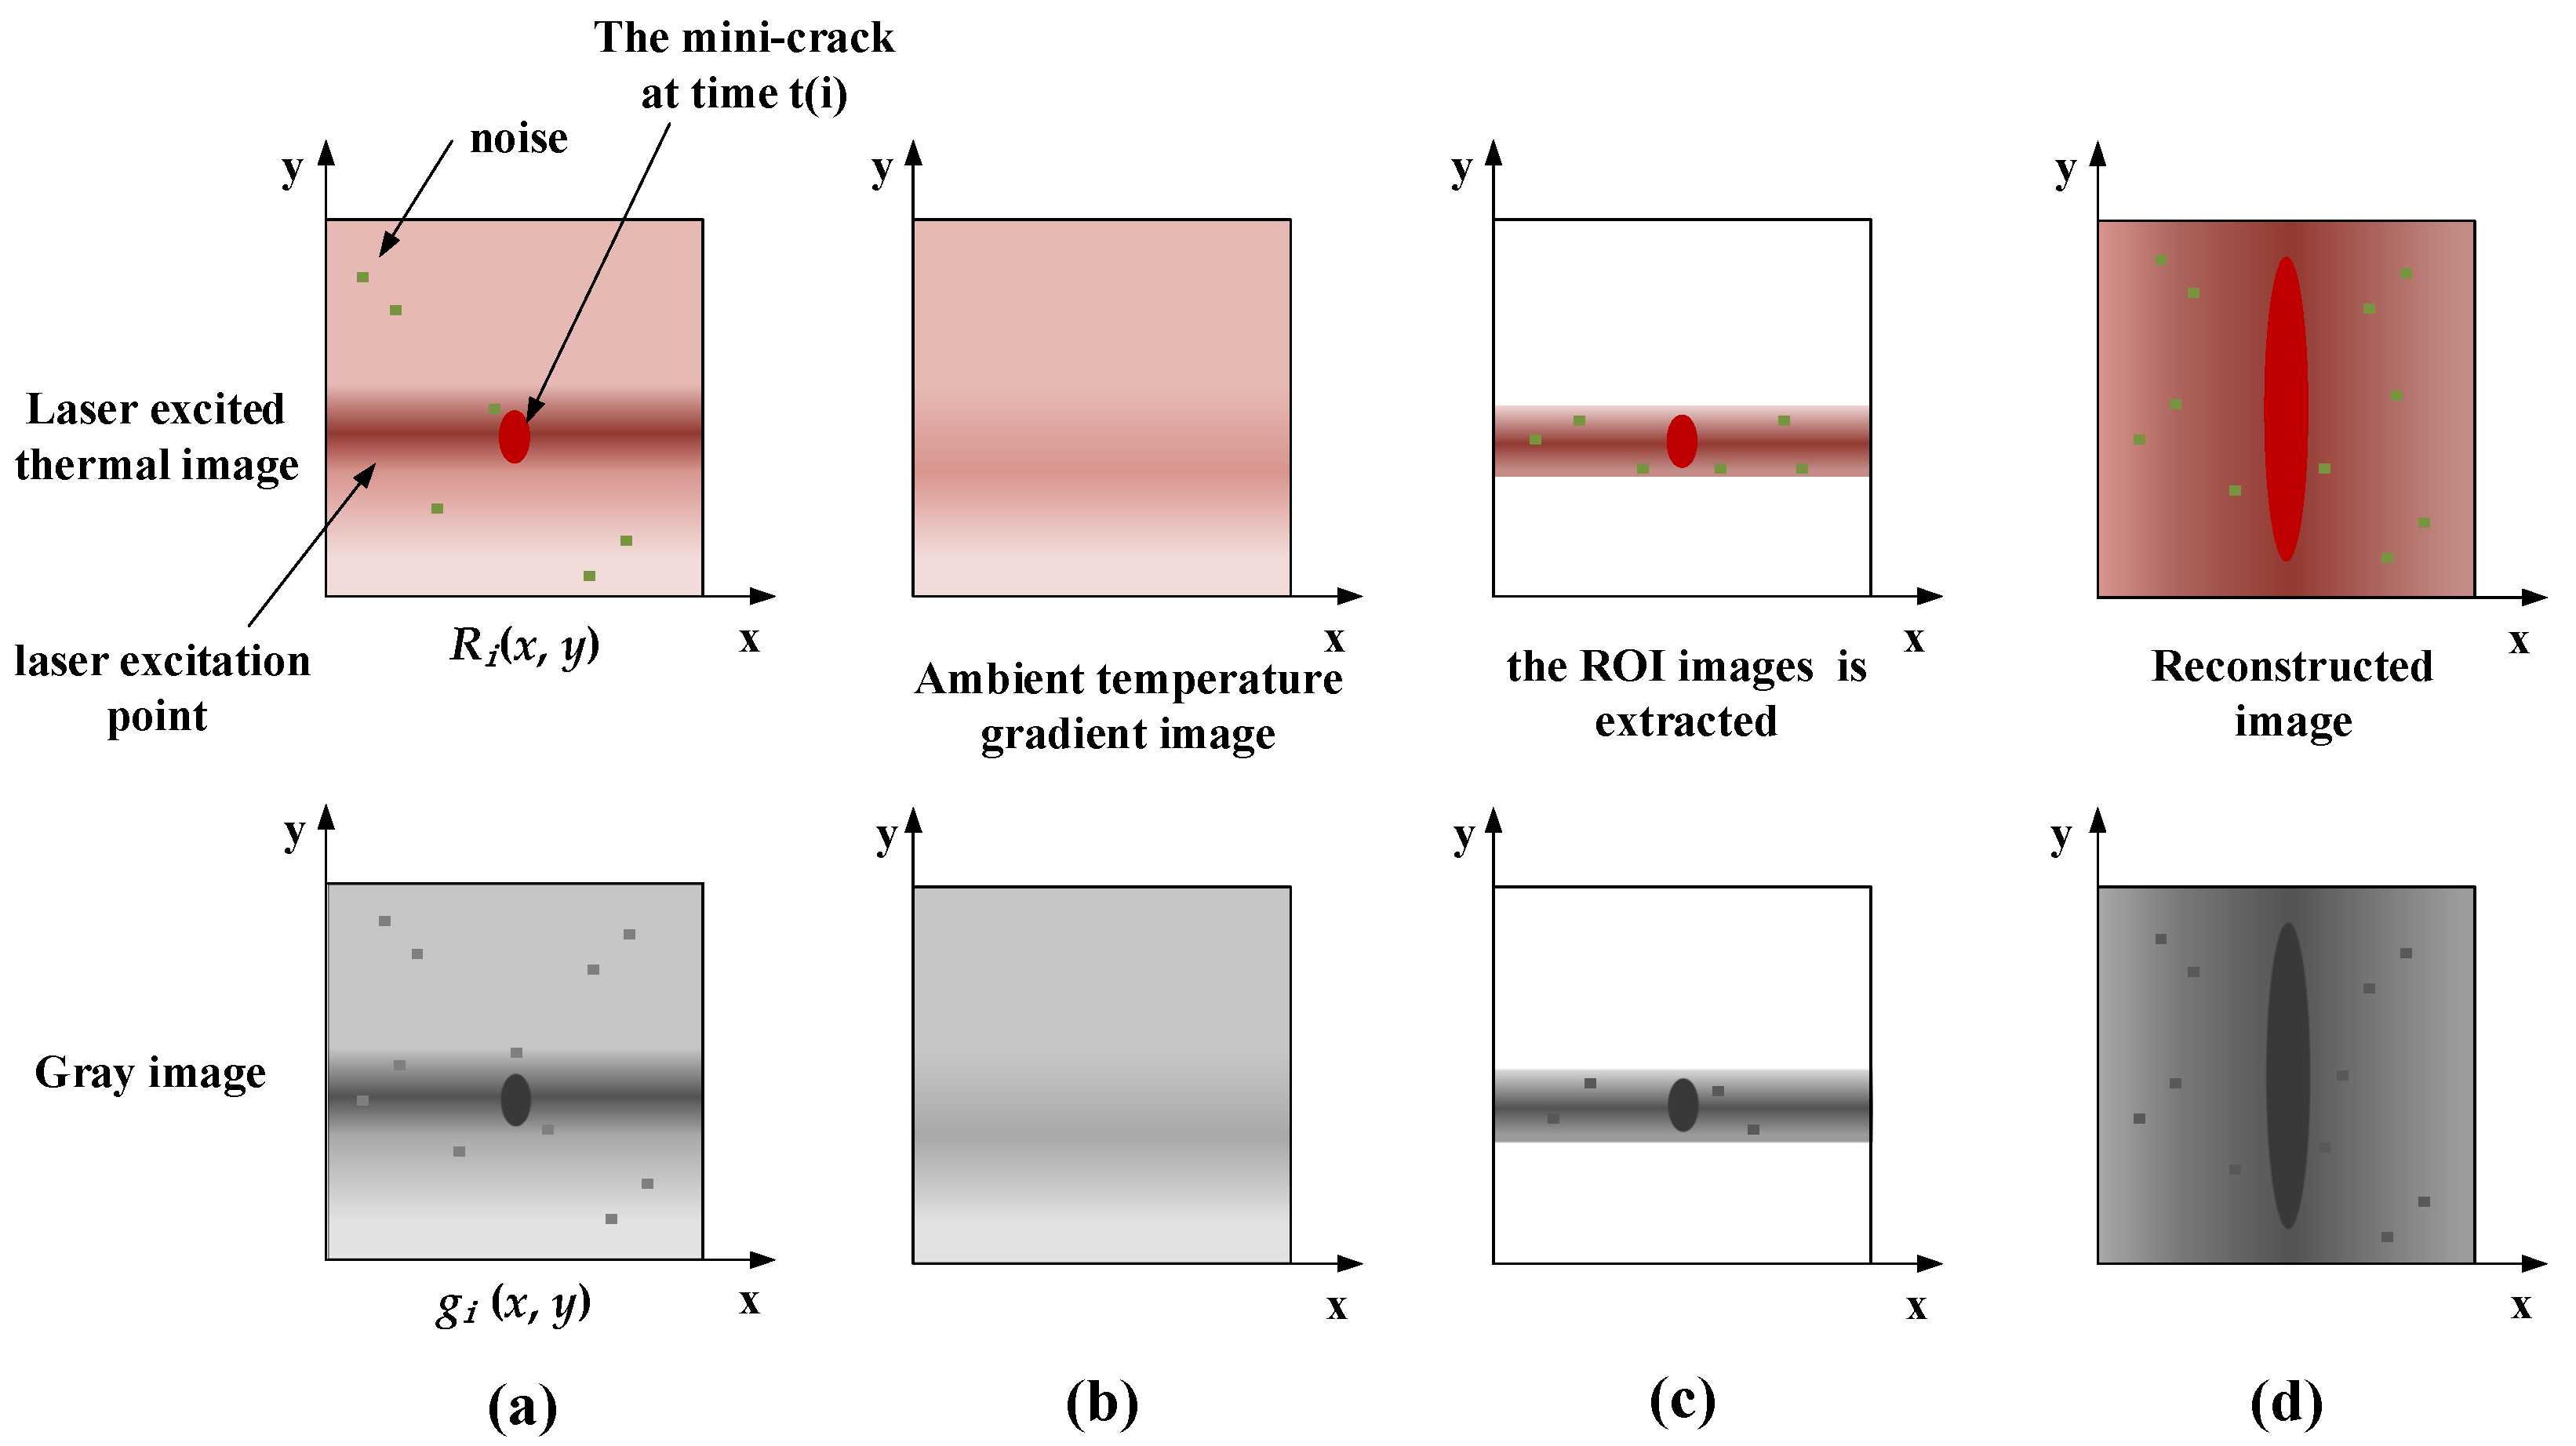
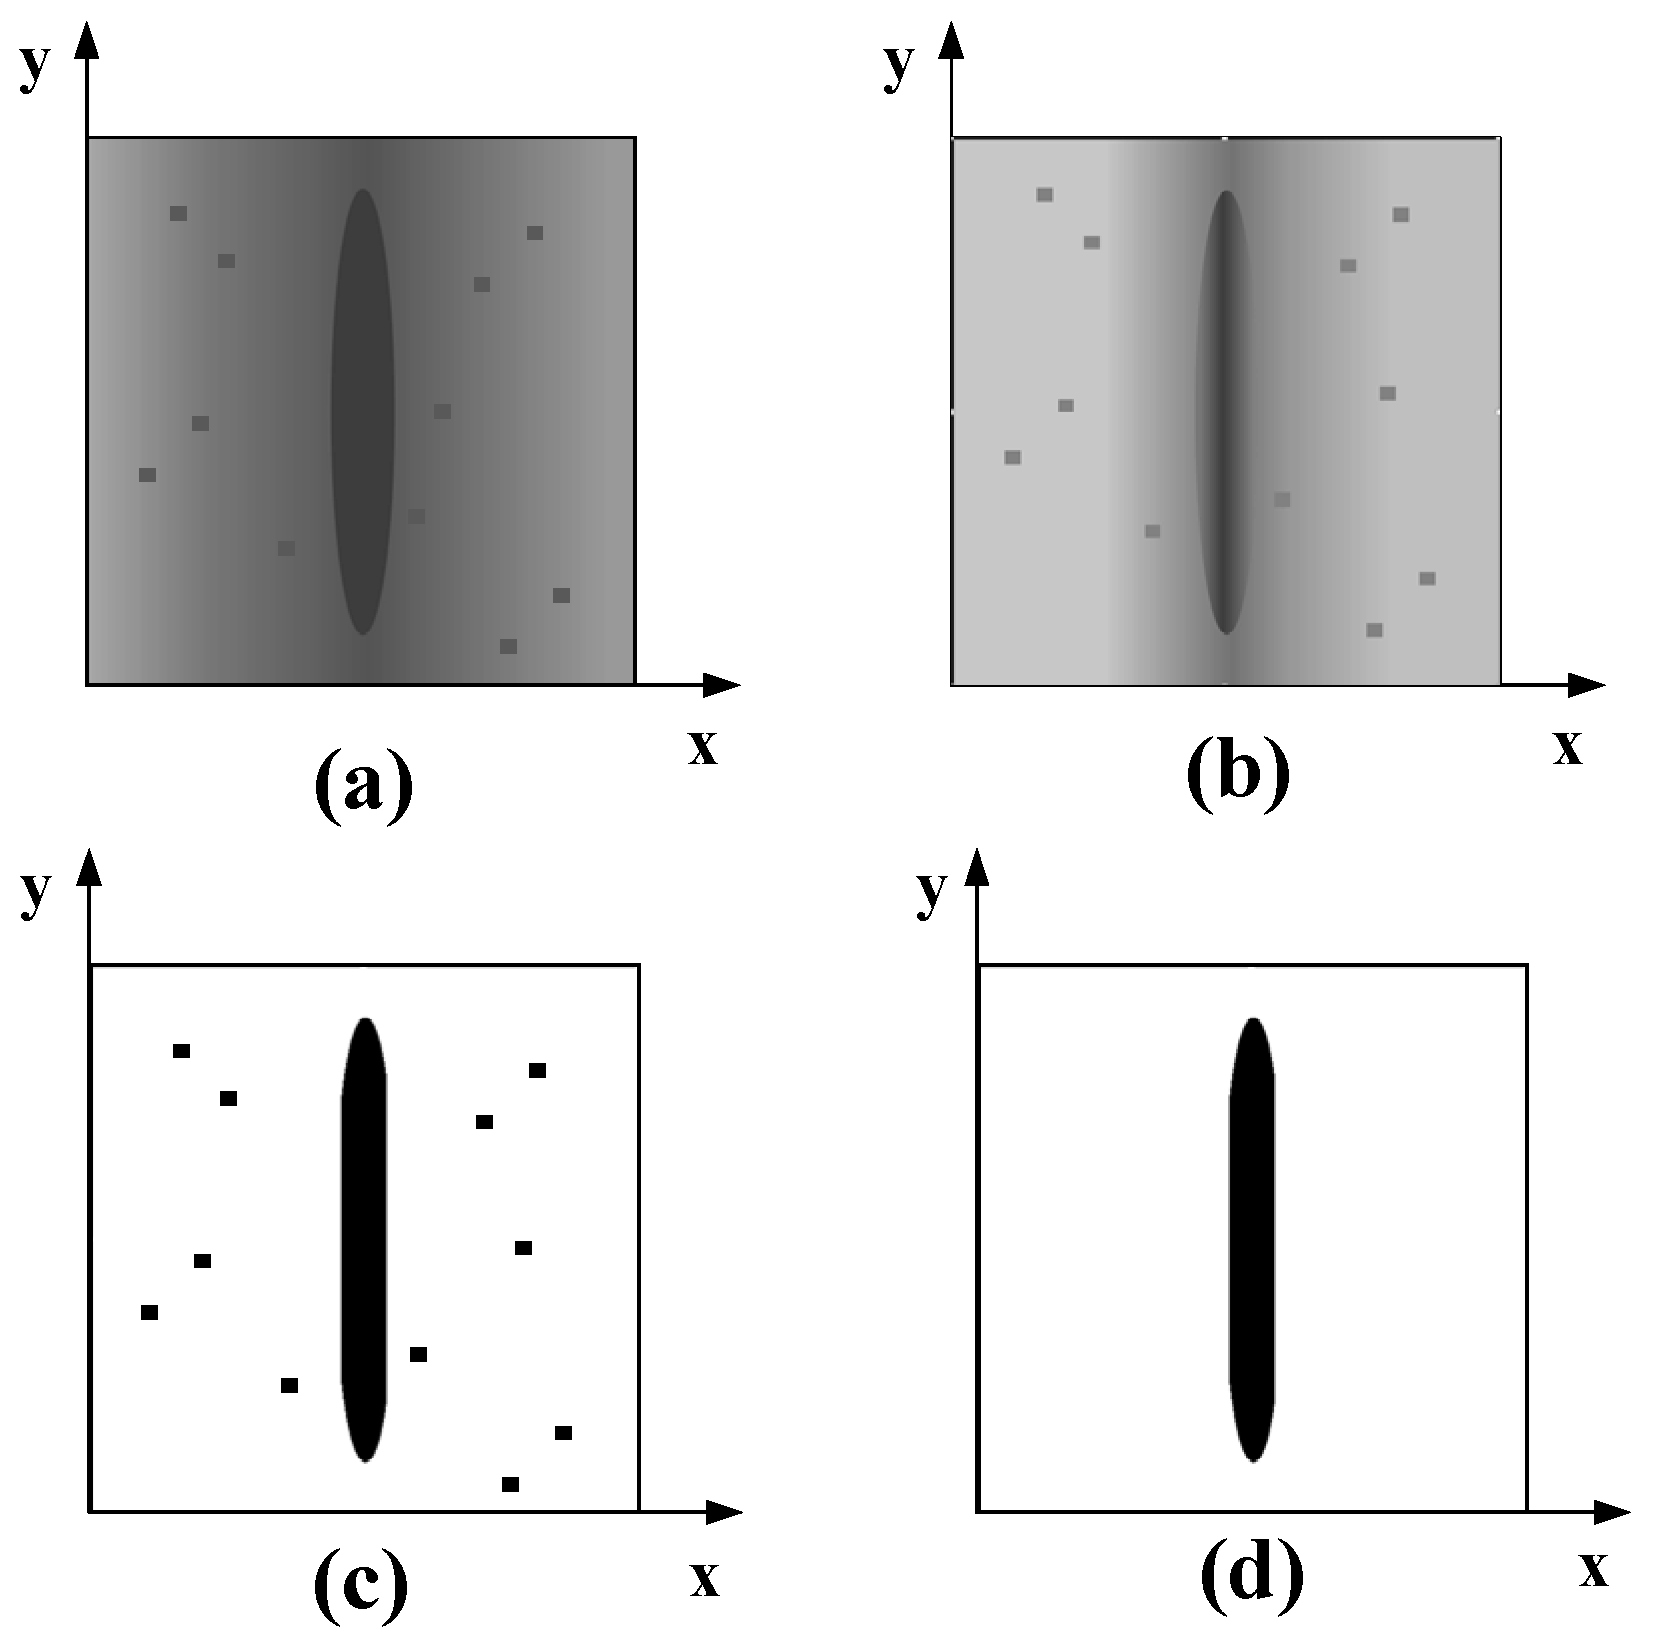
  • Collect the thermal image by using the laser thermography system. Thermal response image Ri(x, y) is captured by an infrared camera, and then (x, y) will be defined as pixel coordinate. After obtaining all thermal response images Ri(x, y) in the current time T, they are converted into grayscale image gi(x, y) = Ri(x, y).
  • Extract feature regions from the n grayscale images gi(x, y). The laser region of each image is intercepted as the feature image as Fi(x, y), and the size of Fi(x, y) is (s, w), where s = vt, v is the operation speed of the conveyor belt, and t is the time difference between two frames of images. The w is width of conveyor belt.
  • Perform further image processing of the feature image Fi(x, y). Firstly, the reference image Res(x, y) is made, that is, the thermal image without laser scanning; Then, the feature image is subtracted from the reference image Fi*(x, y) = Fi(x, y) − Res(x, y).
  • Construct the final mini-crack feature image. After all grayscale feature images Fi*(x, y) are obtained in the above steps, matrix Mosaic and fusion are carried out to construct the final mini-crack feature image M(x, y).
M ( x , y ) = [ F 1 * ( x , y ) F 2 * ( x , y ) F n * ( x , y ) ]

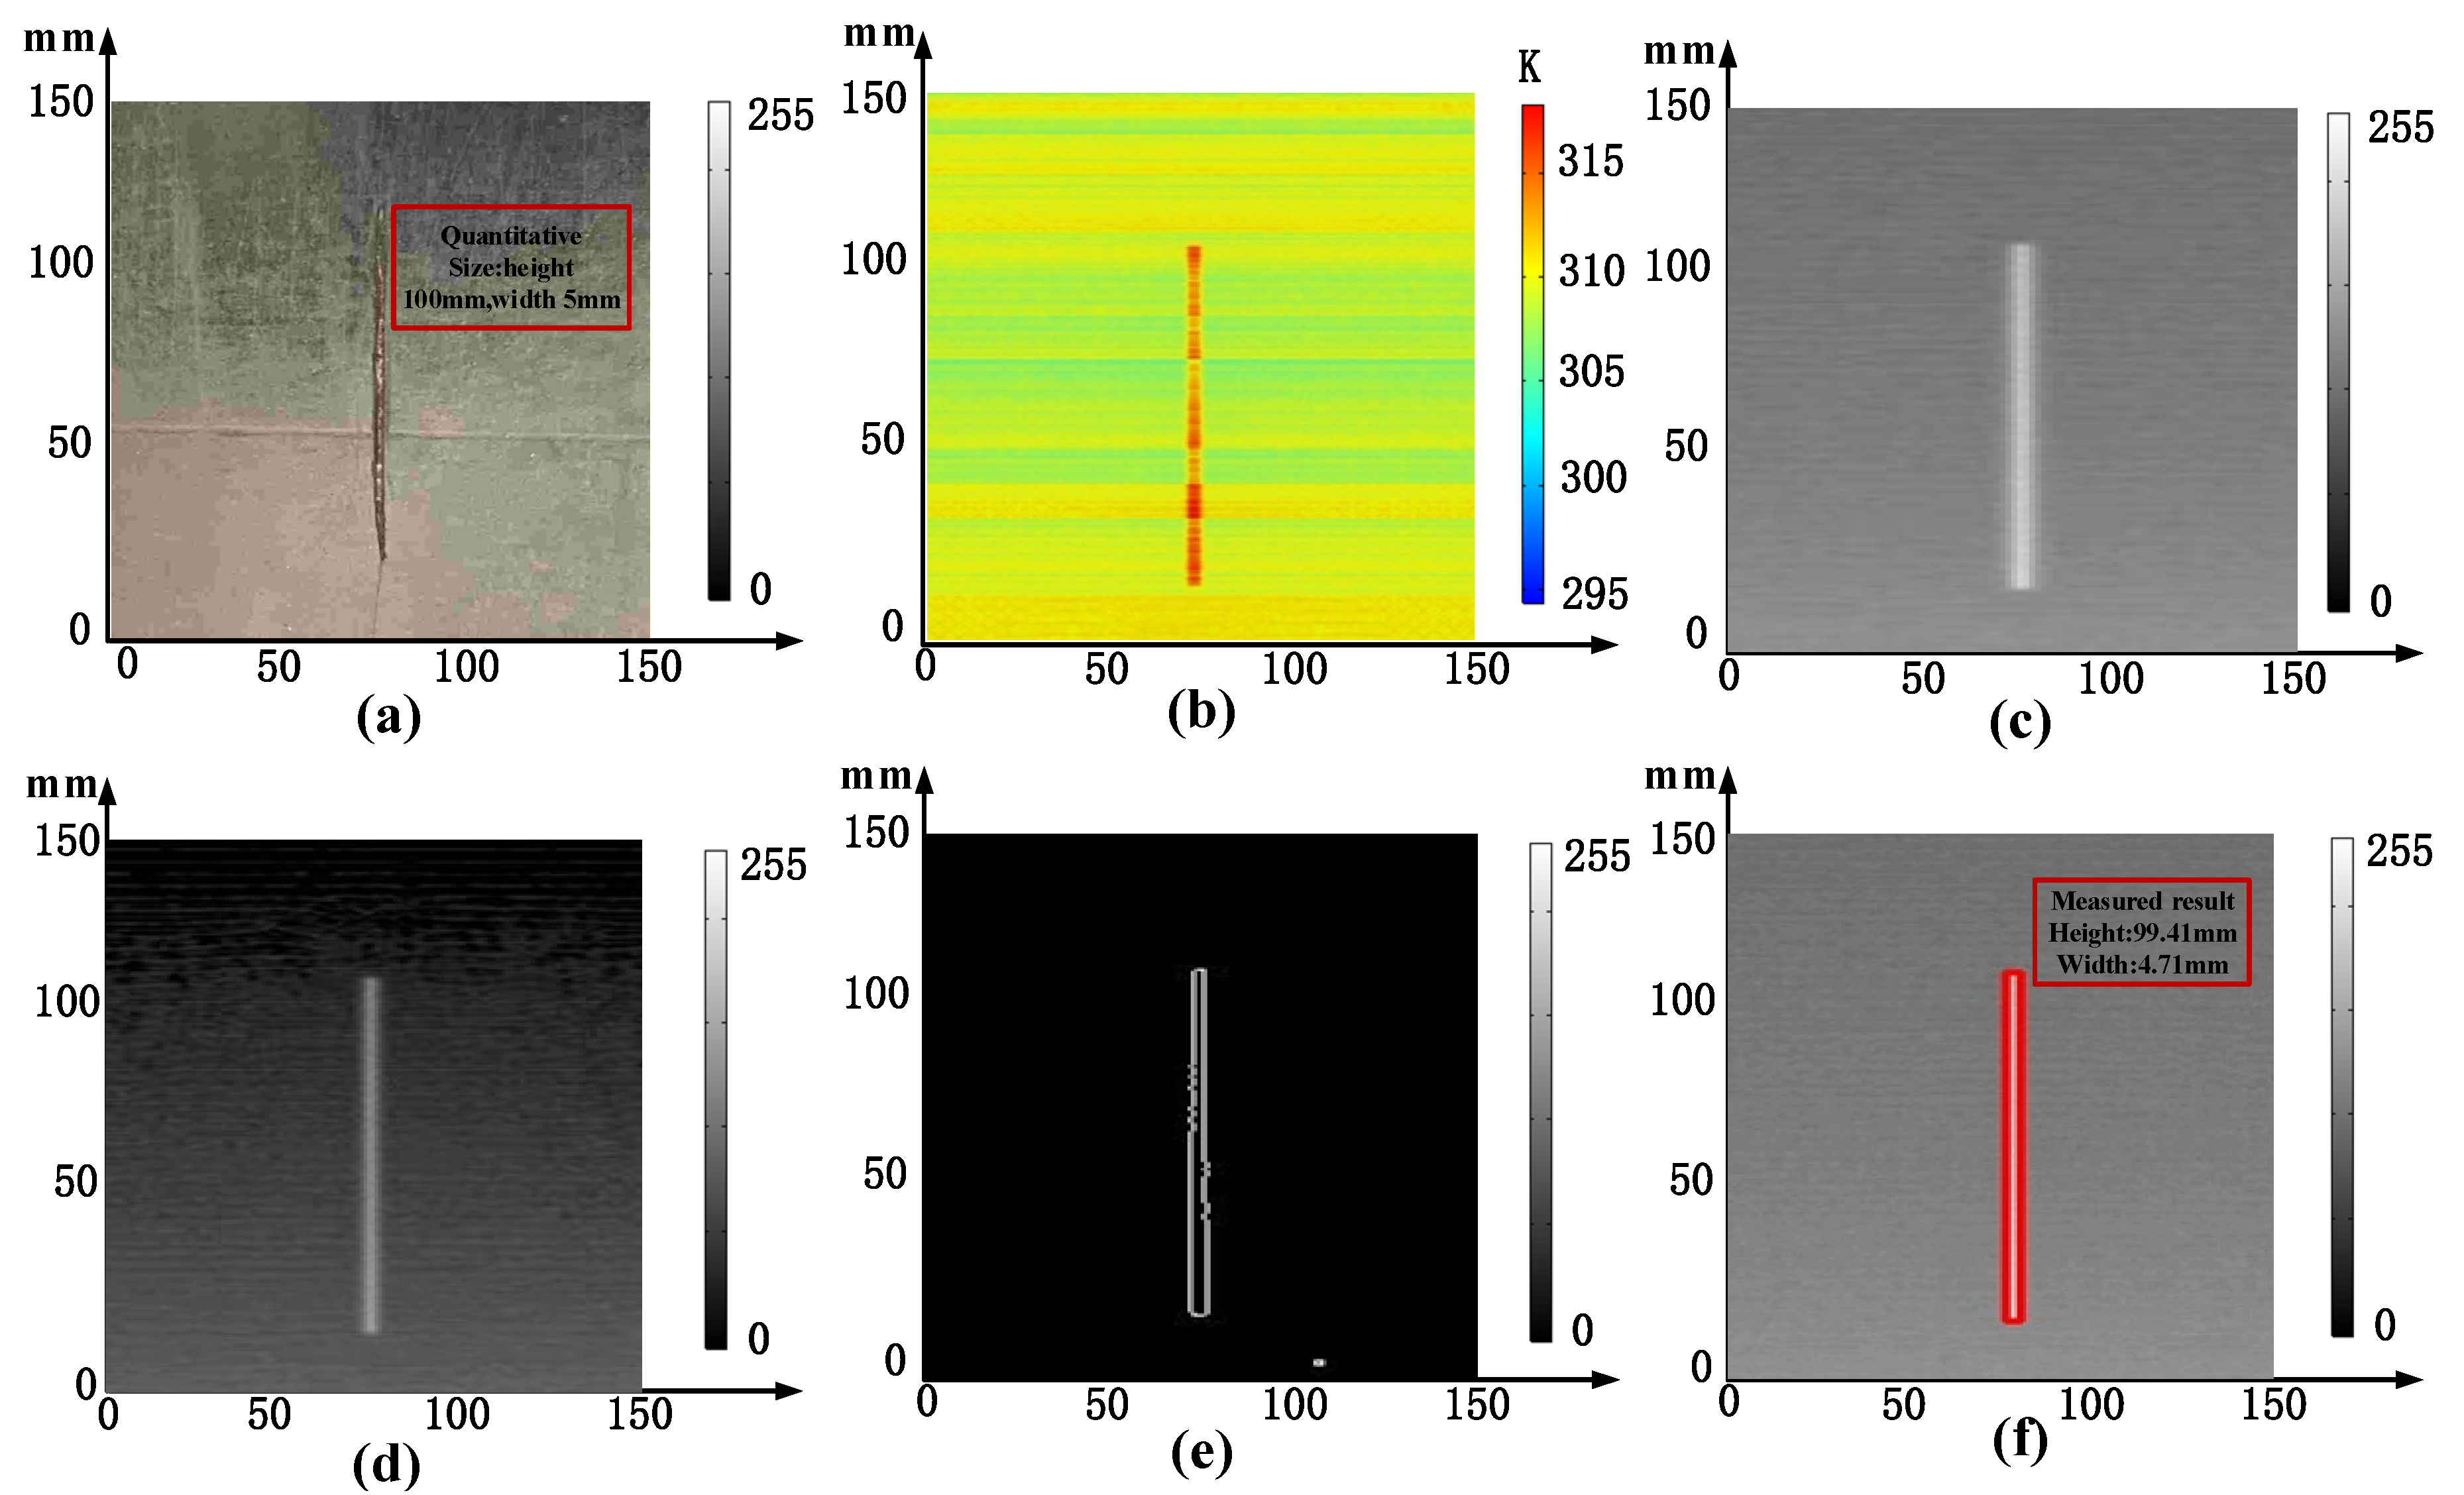
3.2. Image Enhancement Based on Heat Signal

Due to the low contrast of thermal images and the lack of detailed texture information, an improved local histogram equalization algorithm to highlight defect features is proposed. To enhance mini-crack characteristics of the mini-crack feature image M(x, y) and reduce the noise interference, a weighted template operator was defined, and a power function was used as the weighted function. The effect of the image enhancement depends on the selection of filter window and weighting function, and, the appropriate weighted function not only highlights the feature area but also avoids the noise enhancement. The steps for the image enhancement algorithm are as follows:
  • Select a 3 × 3 template operator.
  • Obtain the pixel point (i, j) with the highest gray value. The pixel point (i, j) with the highest gray value in the current line pixels of the mini-crack feature image M(x, y) is obtained, and is taken as the central reference pixel of the weighting function. The pixel in the center of the template is (i0, j0). The further the pixel in the template is from the (i, j), the smaller the weight should be assigned.
  • Calculate the weighted function by Equation (2). The weight coefficient of each pixel in the 3 × 3 template is inversely proportional to the distance from the pixel to the center of the template.
The weighted function ω(i, j) is,
ω ( i , j ) = [ 1 ρ ] α β
where ρ is the inverse proportionality coefficient that can be expressed as,
ρ = ( i i 0 ) 2 + ( j j 0 ) 2
and α is the nonlinear factor can be determined by α = k × s, where k is a constant, and s is a gray variance of image that can be determined by,
s = i = 0 M 1 j = 0 N 1 [ f ( i , j ) f ¯ ] 2 M × N
where f (i, j) is the grayscale value of the pixel (i, j), f ¯ is mean gray value of image, and M × N is the size of the image.
Additionally, in Equation (2), β is a correction factor which is used to guarantee that ω(i, j) is greater than zero. It should be satisfied by the inequality
β < 1 2 × [ 1 ρ max ] α
where
ρ max = ( 2 2 ) × N
4.
Perform the weighted balance of the power function. The schematic of weighted template operator for image enhancement is shown in Figure 5. Based on Equation (2), the weighting coefficient of each pixel is determined by the distance between the template center and the pixel point. Then the template is moved horizontally or vertically according to a certain step size, and the weighted balance of power function is performed on all pixels in the template.

3.3. Threshold Segmentation

The image processing results of threshold segmentation is shown in the Figure 6, and, with the image enhancement processing, the target contour in the mini-crack feature image is more prominent. The threshold segmentation method is adopted to extract the contour information of the damaged area in the mini-crack feature image. The threshold value is selected by the maximum category variance method [43]. Image binarization [44] is used to divide the image into two fields: target object and background. The mini-crack is separated from the background of conveyor belt by threshold segmentation. After image binarization, defects such as graphic fracture and edge burr may occur. In order to eliminate the noise influence on damage judgment, the binary image will be morphologically processed before the mini-crack interrogation.

3.4. Determine Mini-Crack

The damage of conveyor belt is divided into mini-crack and crack in this paper. A defect with a width less than 10 mm is defined as a mini-crack, and a defect with a width greater than 10 mm is defined as a crack. This paper mainly focuses on mini-crack detection. Hough line detection method [45] is used to detect mini-crack and crack. The mini-crack detection process of the conveyor belt is shown in Figure 7. With the above image processing, it can be found that the boundary of the wear area in the binarization image is continuous and parallel. Therefore, Hough transform is used to extract parallel lines as the basis for mini-crack interrogation of conveyor belt. The steps of mini-crack interrogation are developed as follows:
  • Suppose there exists a point (x, y) on the mini-crack line in Cartesian coordinate system, which can be expressed by polar coordinates as
r = x cos θ + y sin θ , tan θ = y x
where r is the distance from the origin to the line, and θ is the vector angle from the origin to the perpendicular of the line.
2.
For each group (r, θ) in polar coordinates corresponds to a line that passing through the point (x, y) in rectangular coordinates. For a given point (x, y), draw all the lines that passing through the point in polar coordinates, and obtain the sine curve;
3.
Repeat the above steps for all points in the original image. Set the threshold and calculate the number of curves corresponding to each intersection point in the image. If the number of curves that intersecting at one point exceeds the threshold, the pair of parameters (r, θ) represented by the intersection point is considered a line in the original intersection point.
4.
The equation of the line is obtained through Hough line detection, then the distance X between the two lines is calculated by the linear distance function. According to the camera calibration results, an appropriate threshold D is set to discriminate mini-crack and crack. When X = 0, the test result is normal; When X < D, the detected damage is considered as a mini-crack; When X > D, the damage is considered as crack.

4. Experimental Setup, Procedure, Results, and Analysis

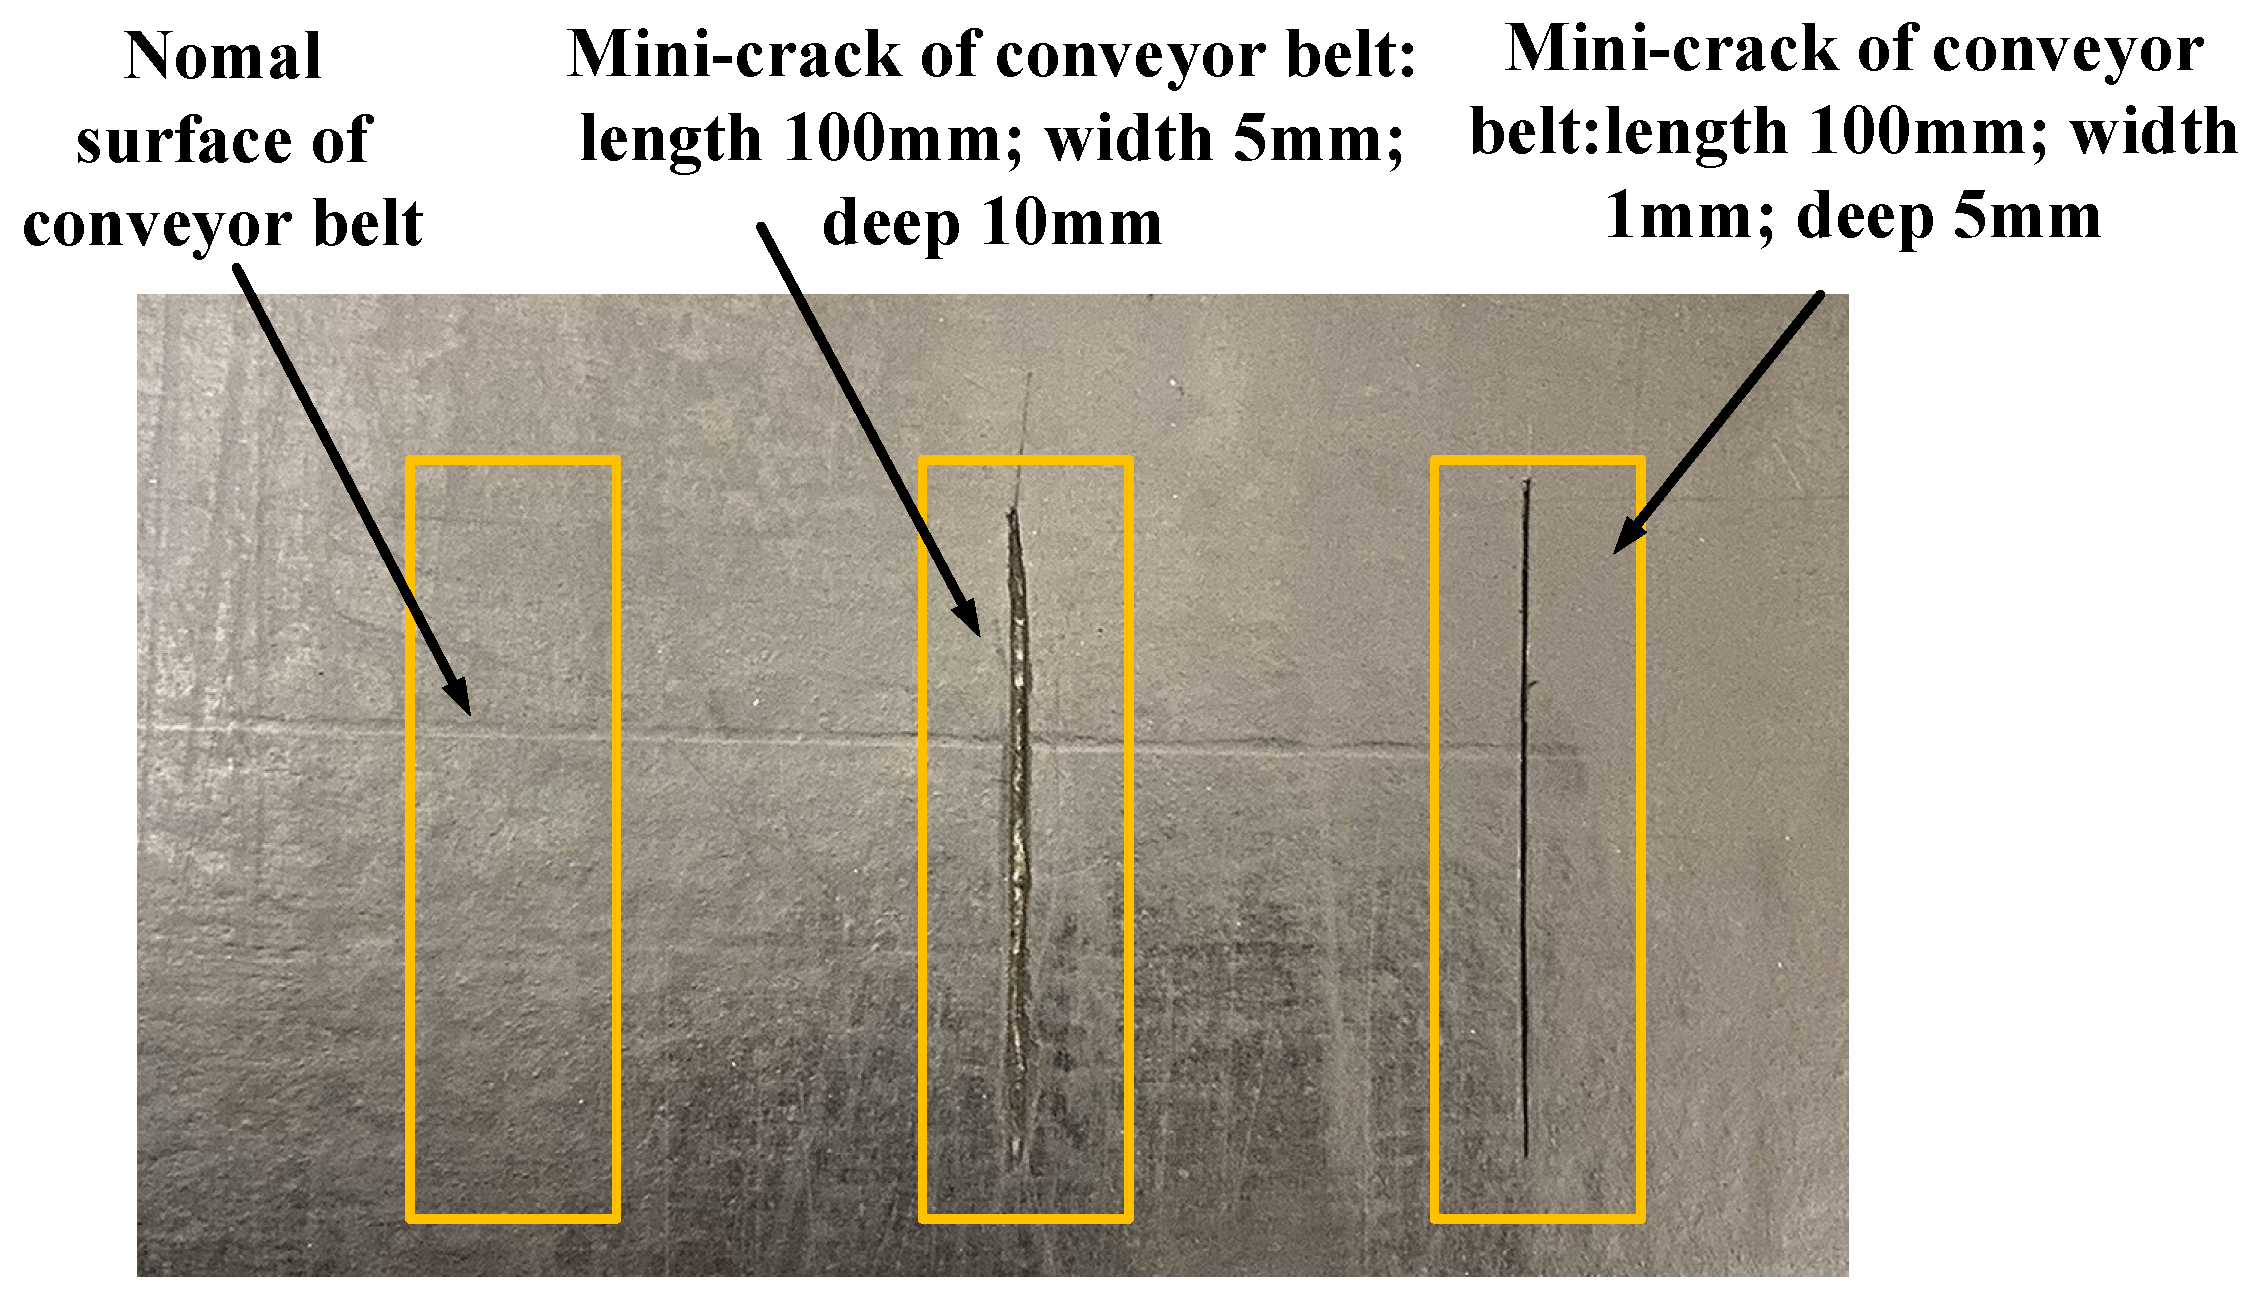
4.1. Experiment Parameter

Figure 8 shows the experimental device for mini-crack detection of conveyor belt installed in the laboratory. The conveyor belt consists of three layers, with a width of 500 mm and a thickness of 20 mm for each layer. For the rubber material, the longitudinal tensile strength is 1250 N/mm, wear rate is less than 90 mm3/(N·m), the maximum running speed is 1 m/s, the running speed of this experiment is 0.05 m/s, and the maximum operating temperature is 40 °C, which is close to the actual mining conveyor belt.
The laser thermography system mainly includes an infrared camera, a CW laser scanning device, a field programmable gate array (FPGA) embedded terminal, a wireless signal transmission device, a personal computer (PC), and monitoring software developed in the laboratory.
The local excitation is realized by a -CW laser with a wavelength of 808 nm and an effective maximum power of 15 W. The point laser is converted into line laser through the collimator and projected onto the conveyor belt. The length and radius are 500 mm and 0.3 mm respectively of line laser on conveyor belt, and the maximum power density of 50 mW/mm2. The focal length f of focusing lens is 8 mm. FPGA embedded terminal in our laser thermography system is used for image reconstruction. It could reduce great redundant information before the mini-crack feature image transmits to the personal computer. The temperature changes on the belt surface are recorded with an infrared camera (FLIR Tau 640) with 640 × 480 pixels at a frame rate of 60 Hz and a minimal temperature resolution of about 50 mK, also be expressed as NETD (Noise Equivalent Temperature Difference) and the corresponding FOV becomes 625 × 500 mm2. The computer configuration is as follows: Inter(R) Xeon(R) CPU E5620@ 2.40 GHZ 2.40 GHZ, Memory 8 GB.

4.2. Experimental Procedure

As shows in Figure 9, a standard mini-crack of the conveyor belt is used to validate the feasibility and the practicability of the proposed method. Figure 9 is an optical picture with an actual size of 250 × 150 mm2. First, a Gangue mineral, whose density is 1.8 t/m3, is fixed on the upper surface of the conveyor belt. Then, the conveyor is started, which cause friction between the gangue and conveyor belt to simulate the mini-crack generation experiment. Finally, the image acquisition device is turned on to capture the thermal image of the conveyor belt.
In order to verify the effectiveness of this method, three surface conditions of the conveyor belt, including the healthy case and the case with mini-cracks, were simulated in the experiment. The simulation experiment is based on COMSOL Multiphysics, which simulates the whole process of laser scanning conveyor belt. The length, width, and depth of the first mini-crack are 100, 1, and 5 mm, respectively; and the length, width and depth of the second mini-crack are 100, 5, and 10 mm, respectively. At the same time, we used COMSOL Multiphysics to simulate the thermal image changes of 100 mini-cracks with lengths ranging from 50 to 140 mm and widths ranging from 1 to 10 mm under laser excitation.

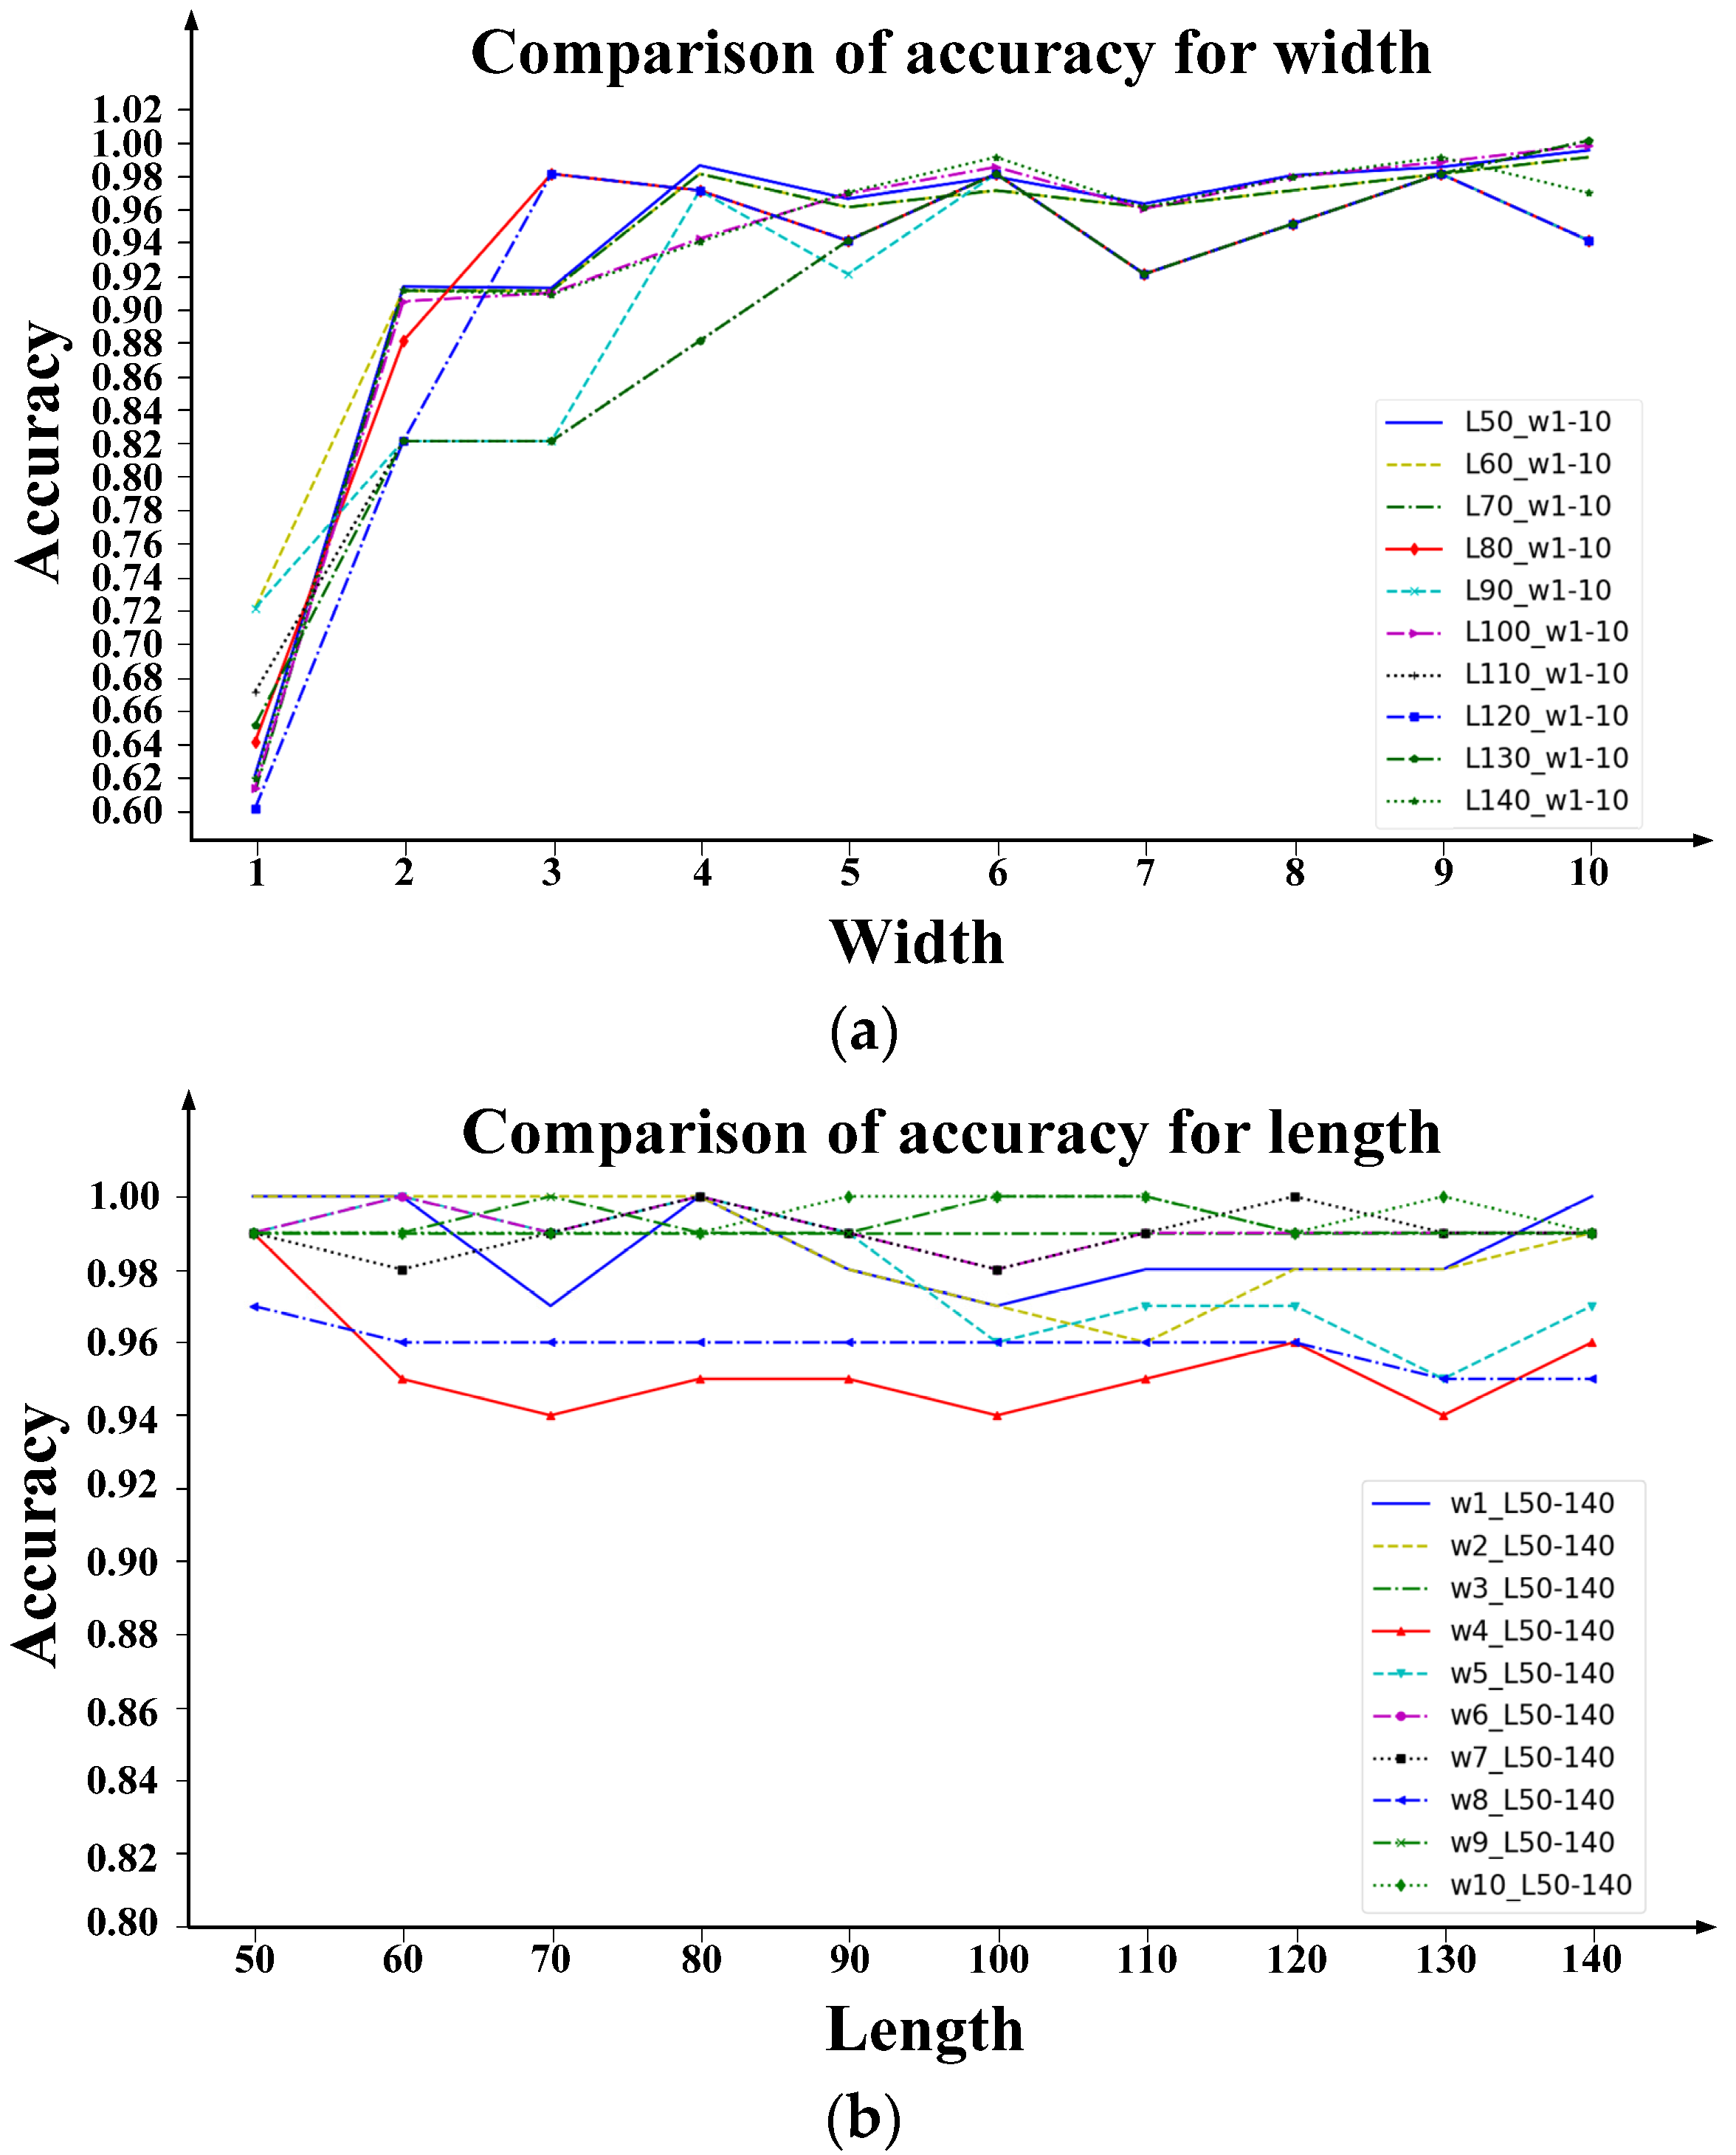
4.3. Experimental Results

Figure 10 shows a temperature images of three surface conditions of the conveyor belt, and the temperature image with a size of 150 × 150 mm2 comes from the original image with a size of 500 × 625 mm2. The first one is the healthy conveyor belt. The second one is the conveyor belt with a mini-crack with length of 100 mm and width of 1 mm, and the third one is the conveyor belt mini-crack with length of 100 mm and width of 5 mm. It takes 3 s for each conveyor belt mini-crack case with the actual size of 150 × 150 mm2 to be scanned based on the conveyor belt running speed of 0.05 m/s, and the temperature of the thermal images of four groups of mini-cracks were collected at four time points of 0 s, 1 s, 1.8 s, and 2.4 s respectively. By fusing the surface temperature thermogram of key feature regions of each frame during the whole scanning process, the mini-crack feature images can be obtained.
Figure 11a shows the original images of mini-cracks with length of 100 mm and width of 5 mm, and Figure 11b reveals the mini-crack feature image. Figure 11c shows the gray mini-crack feature image. When the surface temperature is above the threshold, the surface appears white, while other areas are shown in black. In order to identify the size of the mini-crack more quickly, the gray feature image is enhanced, as shown in Figure 11d. As shown in Figure 11e, the binary image processing is adopted to achieve feature segmentation. Finally, the mini-crack size is identified by Hough transform. The length and width of the mini-crack are measured as 99.41 mm and 4.71 mm respectively, as shown in Figure 11f. The error of mini-crack size estimation is about 3.24%.
Table 1 shows the measured results of three sizes of mini-cracks based on laser excited thermography. The accuracy of mini-crack detection results is listed, which are calculated by the equation
a c c u r a c y = 1 1 2 [ ( w i d t h o b s e r v e d w i d t h a c t u a l ) w i d t h a c t u a l + ( h e i g h t o b s e r v e d h e i g h t a c t u a l ) h e i g h t a c t u a l ]
It can be seen that the mini-crack width of 1 mm only has a correct rate of about 60%, while the mini-crack width of more than 2 mm has a correct detection rate of about 95%. In this experiment, the running speed of the conveyor belt is 0.05 m/s, which is mainly limited by the camera frequency. In fact, the displacement of the conveyor belt from frame to frame is 0.83 mm. Accordingly, when the width of the mini-crack is less than 2 mm, it is very close to the error value so that the measurement accuracy decreases. In addition, an infrared camera of faster frame rate will help improve measurement accuracy.
Figure 12 shows the precision comparison of the measurement results of 100 groups of mini-cracks. Figure 12a shows the variation trend of measurement accuracy with constant length but gradually increasing width. With the increase of the mini-crack width, the measurement accuracy of the mini-crack width 2~4 mm is between 90~95%, and the detection accuracy for the mini-crack with width larger than 4 mm is greater than 95%. Figure 12b shows the variation trend of measurement accuracy with constant width but gradually increasing length. It shows that the length measurement accuracy of all the measurement groups is stable at more than 96%. Therefore, this method has a greater detection accuracy for mini-cracks with widths larger than 1 mm.

5. Conclusions and Future Work

In this paper, a rapid mini-crack detection method of conveyor belt with laser excited thermography is proposed. An experimental platform equipped with a mini-crack vision detection system based on laser excited thermography was designed to verify the method. The active infrared imaging method is used to highlight the infrared features of the mini-crack, and the frame difference method is used to extract the image to quickly record the temperature change of the mini-crack under laser beam heating. At the same time, the power function image enhancement algorithm based on thermal signal further highlights the features of mini-crack and improves the precision of feature segmentation and recognition. Active thermography method based on laser beam heating can quickly change the temperature of the mini-crack feature and background. Real-time heating and rapid thermal image acquisition can effectively avoid the problem of large measurement results caused by temperature diffusion in low temperature environments. The experimental results show that, for a mini-crack with width than 1 mm, the measurement error of the laser active thermography method is less than 4%. In addition, the identification accuracy is higher than 96%, the damage sensitivity is higher (mini-crack detection of 1 mm diameter), and the external noise interference is reduced. The method not only realizes accurate mini-crack detection and identifies mini-cracks early on, but it also meets the requirements of different working environments. The proposed method has good application prospects. In future work, adverse factors such as changing conveyor belt rotating speed and limited thermograph resolution will be considered to further improve the mini-crack detection method. In addition, the follow-up studies will include applying the developed method in detecting other types of damage, such as surface wear and breakdown.

Author Contributions

Conceptualization, F.Z. and Q.W.; Methodology, S.Z.; Formal analysis, T.W.; Validation, S.Z. Investigation, S.Z. and F.Z.; Writing—original draft preparation, F.Z.; Writing—review and editing, T.W. and F.Z.; Funding acquisition, F.Z. All authors have read and agreed to the published version of the manuscript.

Funding

This research was funded by the National Natural Science Foundation of China under grant number 61703215, the Ministry of Transport and applied basic research project of China under grant number 2013329811340, and the National Defense Pre-Research Project of Wuhan University of Science and Technology under grant number GF201809.

Institutional Review Board Statement

Not applicable.

Informed Consent Statement

Not applicable.

Data Availability Statement

Due to the nature of this research, participants of this study did not agree for their data to be shared publicly and only available upon reasonable request.

Conflicts of Interest

The authors declare no conflict of interest.

References

  1. Jiang, L.; Wang, J.; Jiang, H.; Feng, X. Prediction model of port throughput based on game theory and multimedia Bayesian regression. Multimed. Tools Appl. 2018, 78, 4397–4416. [Google Scholar] [CrossRef]
  2. He, D.; Pang, Y.; Lodewijks, G. Green operations of belt conveyors by means of speed control. Appl. Energy 2017, 188, 330–341. [Google Scholar] [CrossRef]
  3. Braun, T.; Hennig, A.; Lottermoser, B. The need for sustainable technology diffusion in mining: Achieving the use of belt conveyor systems in the German hard-rock quarrying industry. J. Sustain. Min. 2017, 16, 24–30. [Google Scholar] [CrossRef]
  4. Huang, Y.; Cheng, W.; Tang, C.; Wang, C. Study of multi-agent-based coal mine environmental monitoring system. Ecol. Indic. 2015, 51, 79–86. [Google Scholar] [CrossRef]
  5. Hakami, F.; Pramanik, A.; Ridgway, N.; Basak, A.K. Developments of rubber material wear in conveyer belt system. Tribol. Int. 2017, 111, 148–158. [Google Scholar] [CrossRef] [Green Version]
  6. Grincova, A.; Andrejiova, M.; Marasova, D.; Khouri, S. Measurement and determination of the absorbed impact energy for conveyor belts of various structures under impact loading. Measurement 2019, 131, 362–371. [Google Scholar] [CrossRef]
  7. Peng, X. A novel image-based method for conveyor belt rip detection. In Proceedings of the 2013 IEEE International Conference on Signal Processing, Communications and Computing (ICSPCC 2013), Kunming, China, 5–8 August 2013; pp. 1–4. [Google Scholar]
  8. Molnar, V.; Fedorko, G.; Andrejiova, M.; Grincova, A.; Tomaskova, M. Analysis of influence of conveyor belt overhang and cranking on pipe conveyor operational characteristics. Measurement 2015, 63, 168–175. [Google Scholar] [CrossRef]
  9. Błażej, R.; Jurdziak, L.; Kozłowski, T.; Kirjanów, A. The use of magnetic sensors in monitoring the condition of the core in steel cord conveyor belts—Tests of the measuring probe and the design of the DiagBelt system. Measurement 2018, 123, 48–53. [Google Scholar] [CrossRef]
  10. Yang, Y.; Miao, C.; Li, X.; Mei, X. On-line conveyor belts inspection based on machine vision. Optik 2014, 125, 5803–5807. [Google Scholar] [CrossRef]
  11. Li, J.; Miao, C. The conveyor belt longitudinal tear on-line detection based on improved SSR algorithm. Optik 2016, 127, 8002–8010. [Google Scholar] [CrossRef]
  12. Hao, X.-L.; Liang, H. A multi-class support vector machine real-time detection system for surface damage of conveyor belts based on visual saliency. Measurement 2019, 146, 125–132. [Google Scholar] [CrossRef]
  13. Wang, G.; Zhang, L.; Sun, H.; Zhu, C. Longitudinal tear detection of conveyor belt under uneven light based on Haar-AdaBoost and Cascade algorithm. Measurement 2021, 168, 108341. [Google Scholar] [CrossRef]
  14. Zhang, M.; Shi, H.; Zhang, Y.; Yu, Y.; Zhou, M. Deep learning-based damage detection of mining conveyor belt. Measurement 2021, 175, 109130. [Google Scholar] [CrossRef]
  15. Qiao, T.; Li, X.; Pang, Y.; Lü, Y.; Wang, F.; Jin, B. Research on conditional characteristics vision real-time detection system for conveyor belt longitudinal tear. IET Sci. Meas. Technol. 2017, 11, 955–960. [Google Scholar] [CrossRef] [Green Version]
  16. Li, X.; Shen, L.; Ming, Z.; Zhang, C.; Jiang, H. Laser-based on-line machine vision detection for longitudinal rip of conveyor belt. Optik 2018, 168, 360–369. [Google Scholar] [CrossRef]
  17. O’Malley, R.; Jones, E.; Glavin, M. Detection of pedestrians in far-infrared automotive night vision using region-growing and clothing distortion compensation. Infrared Phys. Technol. 2010, 53, 439–449. [Google Scholar] [CrossRef]
  18. Qiao, T.; Duan, Y.; Jin, B. Infrared spectra imaging mechanism and modelling of the transport of hazard belt. Mater. Res. Innov. 2015, 19 (Suppl. 6), 92–97. [Google Scholar] [CrossRef]
  19. Yang, Y.; Hou, C.; Qiao, T.; Zhang, H.; Ma, L. Longitudinal tear early-warning method for conveyor belt based on infrared vision. Measurement 2019, 147, 106817. [Google Scholar] [CrossRef]
  20. Yang, R.; Qiao, T.; Pang, Y.; Yang, Y.; Zhang, H.; Yan, G. Infrared spectrum analysis method for detection and early warning of longitudinal tear of mine conveyor belt. Measurement 2020, 165, 107856. [Google Scholar] [CrossRef]
  21. Qiao, T.; Chen, L.; Pang, Y.; Yan, G.; Miao, C. Integrative binocular vision detection method based on infrared and visible light fusion for conveyor belts longitudinal tear. Measurement 2017, 110, 192–201. [Google Scholar] [CrossRef]
  22. Yu, B.; Qiao, T.; Zhang, H.; Yan, G. Dual band infrared detection method based on mid-infrared and long infrared vision for conveyor belts longitudinal tear. Measurement 2018, 120, 140–149. [Google Scholar] [CrossRef]
  23. Hou, C.; Qiao, T.; Zhang, H.; Pang, Y.; Xiong, X. Multispectral visual detection method for conveyor belt longitudinal tear. Measurement 2019, 143, 246–257. [Google Scholar] [CrossRef]
  24. Chang, S.; Li, Z. Single-reference-based solution for two-point nonuniformity correction of infrared focal plane arrays. Infrared Phys. Technol. 2019, 101, 96–104. [Google Scholar] [CrossRef]
  25. Xu, C.; Xie, J.; Wu, C.; Gao, L.; Chen, G.; Song, G. Enhancing the Visibility of Delamination during Pulsed Thermography of Carbon Fiber-Reinforced Plates Using a Stacked Autoencoder. Sensors 2018, 18, 2809. [Google Scholar] [CrossRef] [PubMed]
  26. Kong, Q.; Robert, R.H.; Silva, P.; Mo, Y.L. Cyclic Crack Monitoring of a Reinforced Concrete Column under Simulated Pseudo-Dynamic Loading Using Piezoceramic-Based Smart Aggregates. Appl. Sci. 2016, 6, 341. [Google Scholar] [CrossRef] [Green Version]
  27. Vavilov, V.; Burleigh, D. Infrared Thermography and Thermal Nondestructive Testing; Springer: Cham, Switzerland, 2020. [Google Scholar]
  28. Xu, C.; Xie, J.; Zhang, W.; Kong, Q.; Chen, G.; Song, G. Experimental Investigation on the Detection of Multiple Surface Cracks Using Vibrothermography with a Low-Power Piezoceramic Actuator. Sensors 2017, 17, 2705. [Google Scholar] [CrossRef] [Green Version]
  29. Xu, C.; Zhou, N.; Xie, J.; Gong, X.; Chen, G.; Song, G. Investigation on eddy current pulsed thermography to detect hidden cracks on corroded metal surface. NDT E Int. 2016, 84, 27–35. [Google Scholar] [CrossRef]
  30. Parvasi, S.M.; Xu, C.; Kong, Q.; Song, G. Detection of multiple thin surface cracks using vibrothermography with low-power piezoceramic-based ultrasonic actuator—a numerical study with experimental verification. Smart Mater. Struct. 2016, 25, 55042. [Google Scholar] [CrossRef]
  31. Wang, F.; Song, G. Bolt early looseness monitoring using modified vibro-acoustic modulation by time-reversal. Mech. Syst. Signal Process. 2019, 130, 349–360. [Google Scholar] [CrossRef]
  32. Li, N.; Wang, F.; Song, G. New entropy-based vibro-acoustic modulation method for metal fatigue crack detection: An exploratory study. Measurement 2020, 150, 107075. [Google Scholar] [CrossRef]
  33. González, J.; Mendioroz, A.; Sommier, A.; Batsale, J.; Pradere, C.; Salazar, A. Fast sizing of the width of infinite vertical cracks using constant velocity Flying-Spot thermography. NDT E Int. 2019, 103, 166–172. [Google Scholar] [CrossRef]
  34. Ishikawa, M.; Ando, M.; Koyama, M.; Nishino, H. Active thermographic inspection of carbon fiber reinforced plastic laminates using laser scanning heating. Compos. Struct. 2019, 209, 515–522. [Google Scholar] [CrossRef]
  35. James, M.; Nik, R. Remote line scan thermography for the rapid inspection of composite impact damage. Compos. Struct. 2019, 208, 442–453. [Google Scholar] [CrossRef]
  36. Montinaro, N.; Cerniglia, D.; Pitarresi, G. A Numerical Study on Interlaminar Defects Characterization in Fibre Metal Laminates with Flying Laser Spot Thermography. J. Nondestruct. Eval. 2018, 37, 41. [Google Scholar] [CrossRef]
  37. Swiderski, W. Non-destructive testing of CFRP by laser excited thermography. Compos. Struct. 2018, 209, 710–714. [Google Scholar] [CrossRef]
  38. Salazar, A.; Mendioroz, A.; Oleaga, A. Flying spot thermography: Quantitative assessment of thermal diffusivity and crack width. J. Appl. Phys. 2020, 127, 131101. [Google Scholar] [CrossRef] [Green Version]
  39. Maierhofer, C.; Myrach, P.; Reischel, M.; Steinfurth, H.; Röllig, M.; Kunert, M. Characterizing damage in CFRP structures using flash thermography in reflection and transmission configurations. Compos. Part B Eng. 2014, 57, 35–46. [Google Scholar] [CrossRef]
  40. Sun, B.; Yuan, N.; Cao, C.; Hardeberg, J.Y. Design of four-band multispectral imaging system with one single-sensor. Futur. Gener. Comput. Syst. 2018, 86, 670–679. [Google Scholar] [CrossRef]
  41. Soonkyu, H.; An, Y.K.; Hoon, S. Continuous-wave line laser thermography for monitoring of rotating wind turbine blades. Struct. Health Monit. 2018, 18, 1010–1021. [Google Scholar] [CrossRef]
  42. Schlichting, J.; Maierhofer, C.; Kreutzbruck, M. Crack sizing by laser excited thermography. NDT E Int. 2012, 45, 133–140. [Google Scholar] [CrossRef]
  43. Du, H.; Chen, X.; Xi, J. An improved background segmentation algorithm for fringe projection profilometry based on Otsu method. Opt. Commun. 2019, 453, 124206. [Google Scholar] [CrossRef]
  44. Kim, H.; Ahn, E.; Cho, S.; Shin, M.; Sim, S.-H. Comparative analysis of image binarization methods for crack identification in concrete structures. Cem. Concr. Res. 2017, 99, 53–61. [Google Scholar] [CrossRef]
  45. Torrente, M.; Beltrametti, M.; Sendra, J. Perturbation of polynomials and applications to the Hough transform. J. Algebra 2017, 486, 328–359. [Google Scholar] [CrossRef]
Figure 1. Working principle of laser excited thermography for conveyor belt mini-crack detection.
Applsci 11 10766 g001
Figure 2. Schematic diagram of longitudinal tear detection system based on laser excited thermography.
Applsci 11 10766 g002
Figure 3. Mini-crack image feature extraction based on laser excited thermography (Fi*(x, y) is the new feature image which is obtained by removing the reference image Res(x, y) from the feature image Fi(x, y)).
Applsci 11 10766 g003
Figure 4. Process of image reconstruction. (a) Thermal response image Ri(x, y) and its gray image; (b) reference image Res(x, y) and its gray image; (c) grayscale feature images Fi*(x, y) and its gray image; (d) mini-crack feature image M(x, y) and its gray image.
Applsci 11 10766 g004
Figure 5. Schematic of weighted template operator for image enhancement.
Applsci 11 10766 g005
Figure 6. The image processing results of threshold segmentation. (a) Gray mini-crack feature image; (b) Image enhancement; (c) Threshold segmentation; (d) Morphological denoising.
Applsci 11 10766 g006
Figure 7. Flow chart of mini-crack detection process of the conveyor belt.
Applsci 11 10766 g007
Figure 8. (a) Laboratory test of belt conveyor; (b) The experimental platform of mini-crack detection system based on laser thermography.
Applsci 11 10766 g008
Figure 9. Mini-crack category of conveyor belt (length = 150 mm; width = 250 mm).
Applsci 11 10766 g009
Figure 10. Surface temperature thermographs of three surface conditions of the conveyor belt.
Applsci 11 10766 g010
Figure 11. Test results of a mini-crack detection. (a) The original image is taken with the conveyor belt at rest; (b) mini-crack feature image; (c) gray mini-crack feature image; (d) image enhancement; (e) threshold segmentation; (f) mini-crack size.
Applsci 11 10766 g011
Figure 12. Comparison of accuracy for result of mini-crack measurement. (a) Width; (b) Length.
Applsci 11 10766 g012
Table 1. Measured values of three sizes of mini-cracks based on laser excited thermography.
True Value/mmMeasured Value
Lengthobserved (50)Lengthobserved (100)Lengthobserved (150)
LengthactualWidthactualAccuracy (%)LengthactualWidthactualAccuracy (%)LengthactualWidthactualAccuracy (%)
Width(1)50.001.7662.00100.501.7661.75150.591.7661.80
Width(2)50.002.3591.2598.242.3590.37150.592.3591.05
Width(3)50.003.5391.1799.413.5390.87148.823.5390.77
Width(4)50.004.1298.50100.003.5394.12150.593.5393.93
Width(5)49.414.7196.5199.414.7196.81150.595.2996.90
Width(6)48.825.8897.8298.825.8898.41150.005.8899.00
Width(7)50.006.4796.2199.416.4795.91150.596.4796.02
Width(8)49.418.2497.91100.007.6597.81150.007.6597.81
Width(9)49.418.8298.4199.418.8298.71150.008.8299.00
Width(10)49.4110.0099.4199.4110.099.71150.599.4196.85
Publisher’s Note: MDPI stays neutral with regard to jurisdictional claims in published maps and institutional affiliations.

