Abstract
Parkinson’s disease, the second most common neurodegenerative disease in the world, develops due to decreased dopamine levels in the basal ganglia. Levodopa, a dopamine precursor used in the treatment of Parkinson’s disease, can be used as a drug delivery system. This study presents an approach to the use of 3D-printed levodopa-loaded neural tissue scaffolds produced with polylactic acid (PLA) and chitosan (CS) for the treatment of Parkinson’s disease. Surface morphology and pore sizes were examined by scanning electron microscopy (SEM). Average pore sizes of 100–200 µm were found to be ideal for tissue engineering scaffolds, allowing cell penetration but not drastically altering the mechanical properties. It was observed that the swelling and weight loss behaviors of the scaffolds increased after the addition of CS to the PLA. Levodopa was released from the 3D-printed scaffolds in a controlled manner for 14 days, according to a Fickian diffusion mechanism. Mesenchymal stem cells (hAD-MSCs) derived from human adipose tissue were used in MTT analysis, fluorescence microscopy and SEM studies and confirmed adequate biocompatibility. Overall, the obtained results show that PLA/CS 3D-printed scaffolds have an alternative use for the levodopa delivery system for Parkinson’s disease in neural tissue engineering applications.
1. Introduction
Parkinson’s disease, which is one of the neurodegenerative diseases, is common all over the world. Approximately 2–3% of the population of the world is affected by Parkinson’s disease, which is mostly seen in people aged over 60 years. The reason for this disease could be caused by neural losses in the substantia nigra. Generally said, Parkinson’s disease is related to progressive dopamine deficiency in the basal ganglia [1]. The loss of these dopaminergic neurons has significantly negative motor functions [2]. Thus, Parkinson’s disease causes movement disorders, such as tremors, rigidity, bradykinesia, and postural instability. In addition, non-motor symptoms could be encountered, which are essential criteria for clinical diagnosis [3]. Diagnostic biomarkers are used for neuroimaging in research studies, while drugs are used as striatal dopamine in the treatment process [2].
Levodopa (L-3,4-dihydroxyphenylalanine) is used as a very effective drug in the treatment of Parkinson’s disease. This drug, which is a dopamine precursor, is capable of stimulating dopaminergic activities. In addition, it can prevent different types of deactivations and motor functions [4]. Therefore, levodopa treatment for Parkinson’s disease improves the daily activities and life quality of the patients. Furthermore, the survival of these patients was shown to increase after starting the levodopa treatment [5]. Levodopa is converted to dopamine after crossing the blood–brain barrier and stored in dopaminergic neurons [6]. Clinical response to levodopa treatment is defined as short-term and long-term responses. The short-term response is maintained almost throughout the disease and provides efficacy in Parkinson disease’s symptoms in advanced stages. The reduction in response time to levodopa is associated with progressive degeneration of nigral dopaminergic neurons and loss of dopamine buffering. These motor fluctuations are called dyskinesia. These motor fluctuations cause “on–off” effects in Parkinson’s disease patients. As the disease progresses, patients encounter phases of performing normal movements (ON) and compromised movement states (OFF). Research studies have proved that the “on–off” effect occurs mostly depending on the dosage and frequency of levodopa administration.
The frequency of levodopa dosage is regulated to provide the improvement of its effect for the removal of Parkinson’s disease symptoms [1,4]. Therefore, the drug development research studies for Parkinson’s disease are focused on controlled and targeted levodopa release to provide reduced dosage frequency and prolonged therapeutic effect. Controlled drug delivery systems offer some advantages, such as reduced side effects, reduced toxicity, reduced dosage frequency, improved patient compliance, and prolonged pharmacological effects in comparison to conventional methods [6,7].
In the present study, levodopa-loaded scaffolds, based on poly (lactic) acid (PLA) and chitosan (CS), were produced using 3D-printing technology as a drug delivery patch. PLA is a biodegradable synthetic material that is suitable for many tissue engineering applications. This polymer is frequently preferred in studies for 3D-printing technology, due to its properties of biocompatibility, high mechanical strength, low cost, and compatibility with drug delivery systems [8,9]. It was found that PLA-based scaffolds can induce the desired release kinetics of the active substances by eliminating the initial burst [10,11]. CS, a natural biopolymer, provides the scaffolds with improved biological properties and assists the efficient adhesion and growth of cells, due to its high biocompatibility in the case of using it to form a scaffold. It is a preferred biomaterial for many tissue engineering applications, thanks to its unique properties, such as being biodegradable, flexible, antimicrobial, non-toxic, and easy to use [12,13]. The increased absorption and prolonged release properties of the drugs are due to the mucoadhesive surface properties of CS [14]. Moreover, CS has a higher affinity for biological membranes and is a good candidate for drug delivery systems [11]. These scaffolds used for tissue engineering applications may be commonly used to mimic the microenvironment required for the improvement of the performance of the cells [15]. The 3D printing method has a high potential to produce scaffolds with the mentioned properties. It is possible to create structures that have complex geometry for mimicking the microenvironment by 3D printing, compared to mold casting and other traditional tissue engineering techniques. 3D-printing allows the modification of scaffolds’ characteristics such as thickness and pore size [16].
In this study, novel levodopa-loaded 3D-printed PLA/CS scaffolds were produced for Parkinson’s disease, and these scaffolds were found to possibly be a promising alternative drug delivery system for drug administration routes, such as intranasal or transdermal.
2. Materials and Methods
2.1. Materials
Poly (lactic acid) (PLA) 2003 D was acquired from Nature Works LLC. Chitosan (CS, MW = 50,000–190,000 Da), chloroform, and acetic acid (CH3COOH) were obtained from Sigma-Aldrich (St. Louis, MO, USA). Sodium hydroxide (NaOH) was purchased from Yasin Teknik (İstanbul, Turkey). Levodopa was obtained as a powder form from Abdi Ibrahim Pharmaceuticals (İstanbul, Turkey). Human adipose tissue–derived mesenchymal stem cells (hAD-MSCs) were purchased from ATCC (Manassas, VA, USA). DMEM, penicillin, streptomycin, and FBS were purchased from Gibco (Amarillo, TX, USA). DAPI was obtained from Thermo-Invitrogen (Waltham, MA, USA).
2.2. Methods
2.2.1. Preparation of the Polymer Solutions
Different concentrations of PLA and PLA/CS solutions were prepared in order to optimize these solutions (Table 1). Different amounts of PLA were dissolved in 10 mL chloroform at the concentration of 15, 16, 17, and 18 wt.%. The optimum polymer concentration was determined to be 17 wt.%. The 17 wt.% PLA concentration was chosen as ideal in terms of printing quality; this was determined based on the aspects of the printed scaffolds. It was stirred at room temperature for about 2 h, using a magnetic stirrer (WiseStir®, MSH-20 A, Wertheim, Germany). After that, different amounts of CS were dissolved to obtain the optimum polymer concentration before preparing the PLA/CS mixture. Different concentrations of CS, 1, 2, 3, 4, and 5 wt.%, were prepared in 10 mL distilled water and 0.2 mL acetic acid. Solutions of CS polymer were stirred for 30 min. As a result of this step, a suitable concentration was obtained at 3 wt.% for CS. After that, PLA and CS solutions were mixed at different ratios of 1:1, 2:1, 5:2, 3:1, and 3:2. Based on the printability of the mixtures, the optimum ratio was considered to be 3:1 (PLA/CS). The mixture was stirred for an hour by using a magnetic stirrer. Moreover, a vortex was used to obtain a homogeneous sample mixture for 20 min. Since chloroform and water are not easily mixed solvents, PLA/CS solution was kept in a homogenizer (Branson Digital Sonifier SFX 250, Atkinson, NH, USA) for 15 min. After that, levodopa was added to the optimum PLA/CS mixture solution at concentrations of 0.01, 0.03, and 0.05 mg/mL. The solutions were stirred well, vortexed, and prepared for printing (Table 1).

Table 1.
Compositions of the solutions.
2.2.2. Designing and Production Process of the 3D-Printed Scaffolds
A 3D draw program (Solidworks) was used to design the scaffold and it was converted to G-codes by slicing software (Simplify 3D). The scaffolds were designed as a square and their dimensions were 20 mm × 20 mm × 0.5 mm. The infill density was also arranged to be 96% and the number of the total layer was 6 for every scaffold. Moreover, the infill pattern was designed as rectilinear. Fabrication of the 3D-printed scaffolds was obtained with extrusion using a 3D printer (Hyrel 3D, SDS-5 Extruder, Norcross, GA, USA). The 30-gauge syringe needle was used to print the 3D-printed scaffolds. The printing process was performed at a flow rate of 1 mL/h. After the printing step, pure PLA scaffolds were dried in a vacuum. On the other hand, a 5% (w/v) NaOH solution was prepared with distilled water for the scaffolds containing CS. Scaffolds were immersed in NaOH solution for 2 min for crosslinking, achieving more tightly bonded molecules. Figure 1 briefly represents the printing process, fabrication of 3D printed scaffold and drug delivery system for drug administration routes, such as intranasal or transdermal.
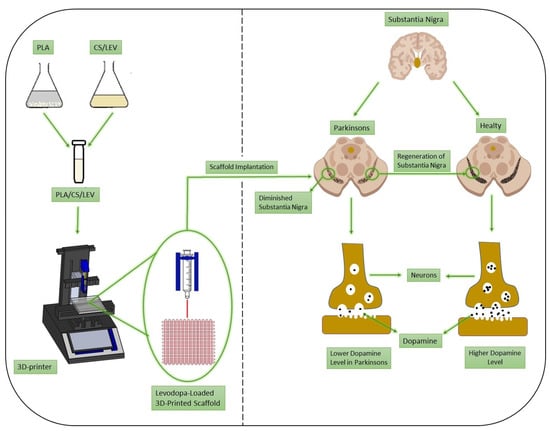
Figure 1.
Schematic presentation of the 3D-printing process and regeneration of substantia nigra in Parkinson’s disease.
2.2.3. Characterization of Rheological Properties of Solutions
Rheological properties of solutions (density, surface tension, and viscosity) were analyzed. DIN ISO 3507-Gay-Lussac (Boru Cam Inc., İstanbul, Turkey) was used to analyze the density of solutions, with a 10 mL standard density bottle. A digital viscometer (DV-E, Brookfield AMETEK, Middleborough, MA, USA) was used to measure the viscosity values of all solutions. The surface tension of the solutions was calculated using a force tensiometer (Sigma 703 D, Attention, Darmstadt, Germany). All measurements were performed at room temperature. The calibration of all equipment was done, and each test was carried out three times.
2.2.4. Fourier Transform Infrared Spectroscopy Analyses (FT-IR)
The spectroscopic evaluation was performed using a FT-IR (Jasco, FT/IR 4700, Pfungstadt, Germany) equipped with a Gladi attenuated total reflection (ATR) viewing plate (Diamond ATR crystal) and liquid-nitrogen cooled mercury cadmium telluride (MCT) detector. In transmission mode, measurements were taken between 399 cm−1 and 4001 cm−1, and the resolution was 4 cm−1.
2.2.5. Scanning Electron Microscopy (SEM)
SEM (EVA MA 10, ZEISS, Istanbul, Turkey.) was used to investigate the external morphology and pores uniformity of each scaffold. The surface of the samples was coated with gold (Au) for 120 s with a sputter coating machine (Quorum SC7620, Laughton, UK) before the imaging process. Software (Analysis5, Olympus, Tokyo, Japan) was used to measure the pore sizes of the scaffolds, and the average pore sizes were calculated.
2.2.6. Mechanical Properties of the Scaffolds
A digital micrometer (Mitutoyo MTI Corp., Aurora, CO, USA) was used to determine the thickness of the scaffolds. After that, the required parameters were put into the tensile test machine (SHIMADZU, EZ-LX, Kyoto, Japan), and the tensile strength of the scaffolds was measured. All scaffolds were completely dry before the mechanical test. The upper and lower portions of each sample were located horizontally in the respective compartment of the device. The lower and upper portions of each sample were located horizontally in the related section of the device.
2.2.7. Swelling and Weight Loss Behaviors of Scaffolds
The swelling and degradation properties of the scaffolds were evaluated for a week and a month, respectively. Phosphate buffered saline (PBS; pH 7.4)) was used to best mimic the inorganic phase of human plasma to evaluate the swelling rates and degradation behaviors. Three samples of each scaffold were immersed in 2 mL of PBS at 37 °C in a thermal shaker (BIOSAN TS-100) for the swelling and degradation test. The wet weights of the samples were weighed daily for the swelling ratio (0, 1, 2, 3, 4, 5, 6, and 7 d). The liquid absorption of each sample was calculated, according to Equation (1) to obtain the swelling rates [17]:
where WD indicates the dry weight before swelling, while WS is the weight of the swollen sample at the times specified. In the weight loss test, the constructs were immersed in PBS for a month, and measurements were recorded every five days (0, 5, 10, 15, 20, 25, and 30 d). The weight-loss rates were measured by using Equation (2) [18]:
WDS are the weights of the dried samples after the degradation test.
2.2.8. Drug Encapsulation Efficiency
Encapsulation efficiency (%EE) is the percentage of drug that is successfully loaded in the scaffolds. To measure the content of levodopa in the scaffolds, a standard procedure was performed by using a UV-visible spectrophotometer (Shimadzu UV-3600, Kyoto, Japan). In the beginning, the scaffolds were completely dissolved in their solvent mixes. Then, the amounts of levodopa in the scaffolds were measured with UV at 280 nm [19]. Levodopa-loaded scaffolds were weighed an average amount of 5 mg each and dissolved in a vial by adding 10 mL of the solvent mixture. The vials were gently mixed for an hour to completely release levodopa from the scaffolds to the solvent mixtures. A total of 1 mL of each solution was taken and detected, using a UV-visible spectrophotometer (Shimadzu UV-3600, Kyoto Japan). All measurements were repeated three times for all three solutions [20]. EE% was calculated with the following equation:
2.2.9. In Vitro Drug Release Kinetic Assay
The in vitro drug release test was performed to assess the release kinetics of the drug content from the scaffolds. To create a linear calibration curve, a levodopa solution was prepared with PBS at five different concentrations (0.2, 0.4, 0.6, 0.8, and 1 µg/mL). The scaffolds were cut approximately 5 mg in weight and then immersed in 1 mL of PBS (pH 7.4 at 37 °C). After that, they were held on a rotary shaker at 250 rpm, 37 °C until the end of the test [21]. A total of 1 mL PBS was taken from the levodopa samples at scheduled times (0, 0.25, 0.5, 1, 2, 3, 4, 6, 8, 12, 24, 48, 72, 96, 120, 144, 168, 192, 216, 240, 264, 288, 312, and 336 h) and 1 mL of fresh PBS was added to the Eppendorf vials to continue the drug release test. To analyze the release profiles of levodopa, UV spectroscopy (Shimadzu UV-3600, Japan) was used in the measurement of the amount of levodopa at 280 nm [19].
2.2.10. In Vitro Drug Release Kinetics
The Korsmeyer–Peppas, zero-order, first-order, Higuchi, and Hixson–Crowell models, which are different mathematical models, were used to evaluate and interpret the drug release kinetics from the scaffolds [22]. The equations for the Korsmeyer–Peppas (Equation (4)), zero-order (Equation (5)), first-order (Equation (6)), Higuchi (Equation (7)), and Hixson–Crowell (Equation (8)) models are as follows, respectively:
where Q is the fractional amount of drug release at time t, and K, K0, K1, Kh, and Khc are the kinetic constants for the Korsmeyer–Peppas, zero-order, first-order, Higuchi, and Hixson–Crowell models, respectively. n is the diffusion exponent, which is indicative of the drug release mechanism.
Q = Ktn
Q = K0t
In (1 − Q) = −K1t
Q = Kht1/2
Q1/3 = Khct
2.2.11. MTT Assay, DAPI Staining, and SEM Imaging
Scaffolds cut in accordance with 96-well plates were first sterilized under ultraviolet (UV) overnight. They were incubated for an hour in DMEM containing 10% FBS and 0.1 mg/mL penicillin/streptomycin in 37 °C and 5% CO2 incubator (SANYO). After the incubation, the scaffolds were collected, and the excess medium was removed. The 5 × 10³ mesenchymal stem cells (hAD-MSCs) derived from human adipose tissue were seeded into scaffolds in 96-well plates. At the same time, monolayer (2D) cell cultures were incubated with the same number of cells at 200 µL as a control. Cell-3D scaffold constructs and 2D cultures were incubated for 7 days at 37 °C, 5% CO2 in a humidified incubator. A cytotoxicity detection kit (MTT from Glentham Life Sciences (Corsham, UK)) was used to study the cytotoxic properties of the scaffolds. Absorbance values were examined in ELISA reader (Perkin Elmer (Waltham, MA, USA), Enspire, Brookline, MA, USA, ABD) at 560 nm wavelength. The assay was performed three times, and the average of the results was accepted as the final result.
DAPI staining was performed to examine the viability of MSCs attached to the scaffolds under fluorescence microscopy. The scaffolds removed from the growth medium were washed with PBS. The scaffolds exposed to 4% formaldehyde for 30 min at room temperature were washed with PBS. Next, 1 µg/mL DAPI (Invitrogen) was added to each sample and incubated for 20 min at room temperature. Scaffolds in which the DAPI solution was removed were placed between coverslips and examined in an inverted fluorescence microscope (Leica, Heerbrugg, St. Gallen, Switzerland).
The morphology of the fixed hAD-MSC on 3D-printed scaffolds was analyzed, using SEM. Growth media were removed after 1, 4, and 7 days and applied to 4% glutaraldehyde to the scaffolds. Cells were then fixed by exposure with serial dilutions of ethanol and dried in air. After the samples were sputter-coated with gold, they were examined in SEM (EVO MA-10, Zeiss, İstanbul, Turkey) at 10 kV.
2.2.12. Statistical Analysis
Statistical analyses were successfully performed using a single factor ANOVA followed by pore size measurement using Image J and the SPSS 17.0 analysis program. Statistical significance was defined as p < 0.05. All quantitative results are presented as the mean ± STD.
3. Results and Discussion
3.1. Characterization of Rheological Properties of Solutions
Rheological properties are the most important parameters that play a role in controlling the printability and shape fidelity of the 3D-printed scaffolds. Viscosity is a crucial parameter to consider for a successful 3D-printing process. Polymer solutions must be sufficiently viscous to protect their shape during printing and have a crosslinking process. Although the research studies demonstrate that low viscosity increases cell adhesion more, it is also observed that this situation causes the collapse of 3D-printed structures. The optimum viscosity range for high-quality printing was found to be between 400 mm2 s−1 and 3000 mm2 s−1 in the studies [23,24]. Surface tension is another critical parameter for producing scaffolds. It prevents the ink from ejecting smoothly in the case of being higher than 40 mN m−1. Moreover, too-low surface tension could cause the ink to leak from the printhead [25]. The surface tension of the solution closely affects the resolution, spread of printed lines, and quality of print [24]. Density directly associated with the viscosity is another significant parameter that is required to be adjusted for the polymer solutions to be used on 3D printing. Therefore, the viscosity, surface tension, and density of the prepared solutions were evaluated in this study (Table 2). The PLA/CS polymer solutions were prepared by adding CS to PLA solutions at different ratios (Table 1). The PLA and CS polymer concentrations of 17 and 3 wt.% were found to be optimum concentrations for preparing the PLA/CS solution, respectively. It was obtained an increase in the viscosity, surface tension, and density of the PLA/CS solution, compared to pure PLA and CS solutions. This increase did not cause a negative effect on the speed or quality of printing of the 3D-printing process. The rheological properties of levodopa-loaded 17 wt.% PLA/3 wt.% CS (17 PLA/3 CS) solutions were measured. The rheological properties of the levodopa added 17 PLA/3 CS solutions at the concentrations of 0.01, 0.03, and 0.05 mg/mL (17 PLA/3 CS/0.01 LEV, 17 PLA/3 CS/0.03 LEV, and 17 PLA/3 CS/0.05 LEV, respectively) were measured in this study. A slight decrease was obtained in all three values for the 17 PLA/3 CS/0.01 LEV scaffolds. Although the viscosity, surface tension, and density of the 17 PLA/3 CS/0.03 LEV scaffolds increased a little more, it did not cause a negative situation in the printing quality or the structure of scaffolds. In addition, at the 17 PLA/3 CS/0.05 LEV scaffolds, all rheological properties due to the increased because of high amount of levodopa. Clogging occurred at the needle tip because of the increased viscosity and surface tension. This situation caused unsmooth layers. The analyses have proven that changing the rheological properties has a significant effect on printing quality.
Table 2.
Rheological properties of the solutions.
3.2. Fourier Transform-Infrared Spectroscopy (FT-IR)
FTIR analysis was performed to investigate the functional groups of the scaffolds as well as the interactions between the components. The molecular structures of pure PLA, CS, and levodopa and all scaffold samples produced by 3D-printing are given in Figure 2. The main characteristic absorption bands are C=O vibration peak at 1750 cm−1, CH3 asymmetric shear at 1456 cm−1, CH3 and C–H bending vibrations 1386 and 1358 cm−1, C–O–C stretching vibration at 1265 cm−1, C–O–C stretching at 1080 cm−1, C–CH3 stretching, OH bending at 950 cm−1 and C–COO stretching at 873 cm−1 for pure PLA in Figure 2a, respectively [26]. Figure 2b shows a large peak at approximately 3283 cm−1, representing hydrogen-bonded O–H or N–H stretch in pure CS, while the peak close to 2869 cm−1 reflects the C–H vibration. C=O stretch of the primary amide is represented at 1585 cm−1, while the two peaks corresponding to the CH2 and O–H bending stress are observed at 1413 and 1375 cm−1, respectively [27,28]. The O–H stresses at 2980 cm−1, phenyl group C=C vibrations at 1455, 1404, 1352, 817, and 674 cm−1, the phenyl group C=C vibrations at 1458, 1404, 817 and 674 cm−1, and C–H at 2929 and 2982 cm−1 for pure levodopa are shown in Figure 2c. Furthermore, the NH2 stresses are observed at 1562 cm−1 and C=O stresses are observed at 1651 cm−1 [29]. Figure 2 shows that the characteristic peaks of PLA, CS, and levodopa were obtained in pure and levodopa-loaded PLA/CS scaffolds. Due to the small amount of levodopa loaded in the scaffolds, no clear peaks can be observed. Thus, it was proven that the 3D-printed scaffolds contained the polymers and drugs according to these results.
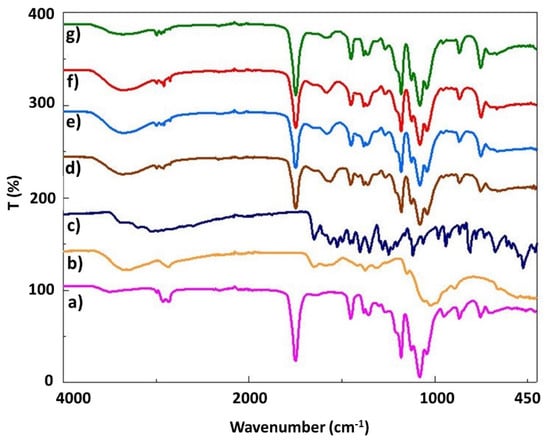
Figure 2.
FTIR spectra of the pure PLA (a), pure CS (b), pure levodopa (c), 17 PLA/3 CS (d), 17 PLA/3 CS/0.01 LEV (e), 17 PLA/3 CS/0.03 LEV (f), 17 PLA/3 CS/0.05 LEV (g) scaffolds.
3.3. SEM Morphological and Pore Size Analysis
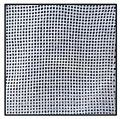
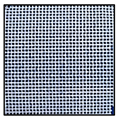
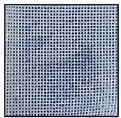
One of the most critical parameters of scaffolds produced for neural tissue engineering is pore size and structure. The open-pore and interconnected meshes provide cell penetration, adhesion, and proliferation. In addition, mechanical support, removal of toxic substances, gas permeability, and cell nutrition can be achieved by a 3D porous structure. A well-developed porous structure exhibits more efficient results in drug transport systems, due to its high surface area [30]. In addition, its pore structure provides the efficient release of drugs and various biofactors loaded on the scaffold and the formation of new tissue [31]. In the present study, the surface morphology pores uniformity and average pore sizes of scaffolds were shown, using SEM imaging and pore size histograms in Figure 3. The results of SEM image indicated that average pore size distributions of pure 17 PLA scaffold resulted in 134.86 µm. After the addition of the CS to the PLA solution, the average size of the pores decreased to 119.70 µm. Pure PLA is a material that has an entirely smooth surface morphology, while pure CS has a pore structure that is regularly interconnected and layered [32,33]. The smooth surface of pure PLA can be seen easily as mentioned in the literature. At the same time, after the addition of CS, the structure lost its smoothness and became a rough surface with microporosity. It is important to mention that this morphology can assure better cell adhesion, which is beneficial for faster integration. The average pore sizes of levodopa-loaded scaffolds at different concentrations (0.01, 0.03, and 0.05 mg/mL) were evaluated and were 195.10, 123.10, and 157.07 µm, respectively. After loading levodopa, there was no significant difference in the surface morphology compared to the pure 17 PLA/3 CS scaffold. The required optimum pore size is different for each tissue. A study of neural tissue has shown that an average of 100-micron laminin-coated cryogel scaffolds was successfully used in the regeneration of brain neurons [34]. In neural tissue research by Goldner et al., axon regeneration on the poly (dimethylsiloxane) scaffold was performed by increasing pore sizes from 50 µm to 200 µm [35]. It was observed that adequate permeability was achieved by pore sizes smaller than 300 μm, according to the study of Hutmacher et al. Consequently, it is clearly seen that the average pore sizes of each of the five scaffolds are similar to those reported in the literature as being optimal and ensure the premises to be used in neural tissue engineering applications.
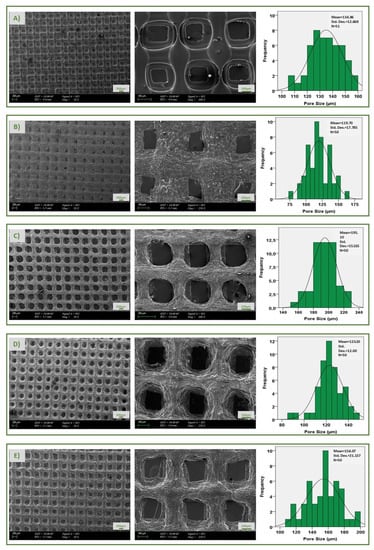
Figure 3.
SEM images and pore size histogram of pure 17 PLA (A), 17 PLA/3 CS (B), 17 PLA/3 CS/0.01 LEV (C), 17 PLA/3 CS/0.03 LEV (D), 17 PLA/3 CS/0.05 LEV (E) scaffolds, respectively.
3.4. Tensile Properties of Scaffolds
In the tensile test, elongation at break and tensile strength are important factors. The tensile properties of all scaffolds were studied as shown in Table 3. The structural properties of porous scaffolds, such as porosity, have important effects on the mechanical properties. A tensile test of the scaffolds was performed to analyze their possible effects on the mechanical properties [36]. According to the results, it was found that the tensile strength of PLA has a high tensile strength (10.71 MPa) and elongation at break (%) (2.20), compared to others. After the addition of CS to PLA solution, the tensile strength and the elongation at break (%) decreased to 1.75 MPa and 0.93, respectively. The addition of CS caused a significant decrease in elongation at break and tensile strength [37]. The reason for this decrease in tensile strength is the agglomeration because of the presence of the CS [38]. It showed that the decrease in tensile strength was due to the incompatibility between the polymeric materials of PLA and the filler, thereby creating poor filler–matrix interaction and discontinuities in the PLA matrix [39]. It was also observed a decrease in elongation at break after the addition of CS. This may be due to the hardening effect of chitosan, which prevents the chain mobility of PLA during the tensile test, reducing elongation at break [40]. Furthermore, the tensile strength and elongation at break increased after the loading of levodopa to the PLA/CS scaffolds. The drug appears to improve the strength of the scaffold, compared to the 17 PLA/3 CS scaffold [4], but it does not reach the strength of the pure 17 PLA scaffold. This may be due to the fact that the low molecular weight drug addition had a plasticizing effect on the structures [41].
Table 3.
Tensile testing results of all scaffolds.
3.5. Swelling Behaviors and Weight Loss Properties of Scaffolds
The evaluation of the swelling property of scaffolds produced for neural tissue engineering studies is important because it can offer information related to the normal behavior after implantation. Swelling of the scaffolds in aqueous media weakens some mechanical properties, while changing the pore size, allowing cells to adhere and migrate [42]. The lowest swelling rates were found to be about 40% in pure PLA scaffolds when the five scaffolds (17 PLA, 17 PLA/3 CS, 17 PLA/3 CS/0.01 LEV, 17 PLA/3 CS/0.03 LEV, and 17 PLA/3 CS/0.05 LEV) were compared with each other. In contrast, a swelling ratio noticeably increased after the addition of CS (nearly 200%) at the end of the 7th day of immersion (Figure 4A). It was observed that CS added to the PLA solutions to a certain extent increases the water absorption potential up to approximately 400% in the literature [43]. As shown in Figure 4A, although it is observed a slight decrease in the swelling potential of levodopa-loaded scaffolds, their water absorption potential is still relatively high. A degradation test evaluates the structures exposed to PBS to dissolve over time, and their mass decreases [44]. The degradable polymers used in neural tissue engineering applications are preferred, thanks to their properties that reduce the need for surgical extraction. The rate and mechanism of degradation of a polymer affect the mechanical properties of the scaffold [45]. The weight-loss rates of the produced scaffolds were examined every 5 days for a month (Figure 4B). The lowest degradation was seen in pure 17 PLA scaffold (nearly %10) at the end of a month. The degradation rates of the 17 PLA/3 CS scaffolds and levodopa-loaded scaffolds, which show maximum swelling capacity, were found to be very high (approximately 30%). It was proven that materials that absorb more water and have better swelling properties show faster weight loss, according to the literature [46].
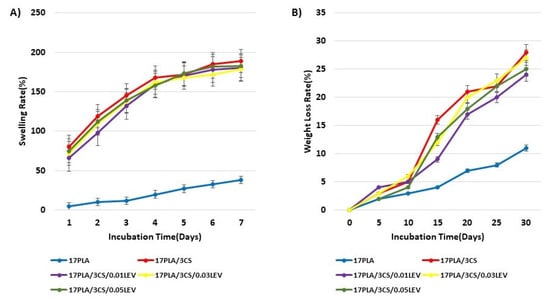
Figure 4.
Swelling behaviors (A) and weight loss (B) properties of scaffolds.
3.6. In Vitro Drug Release Test
In vitro drug release tests were carried out to investigate the releasing properties of levodopa from the scaffolds for 336 h (14 days). The test was performed in the phosphate-buffered saline (PBS) (pH 7.4, 37 °C) to simulate the physiological conditions of living organisms. Firstly, the linear standard calibration curve for levodopa was constructed by UV spectroscopy. Then, the EE of the scaffolds that were loaded with levodopa at different concentrations (0.01, 0.03, and 0.05 mg/mL) was measured to analyze the drug amount loaded in scaffolds. They were found to be 87.63, 89.77, and 91.56%, respectively.
All these scaffolds exhibited a sustained release for 14 days. Levodopa was released at a final cumulative release of 41.23 %, 36.90 %, and 27.95 % from scaffolds, where it was present in concentrations of 0.01, 0.03, and 0.05 mg/mL at the end of the 1st day, respectively. While levodopa was released over 50% on the 3rd day from scaffolds with 0.01 and 0.03 mg/mL concentrations, levodopa release reached over 50% on the 6th day for the scaffold with 0.05 mg/mL. These results proved that the drug release behavior was decelerated by increasing the drug concentration in the scaffolds [47] (Figure 5).
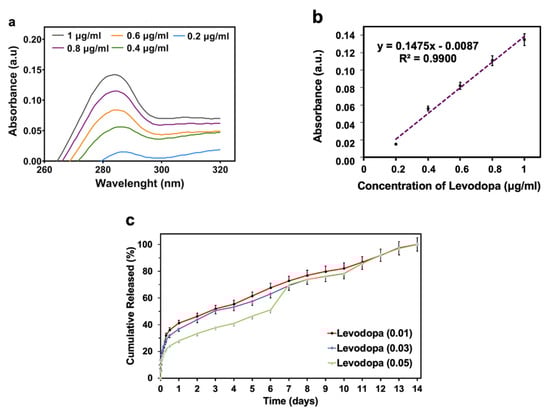
Figure 5.
In vitro drug release profiles of levodopa from the 3D-printed scaffolds: Absorption spectra of levodopa at different concentrations (a), levodopa calibration curve (b), levodopa release profiles from the scaffolds that have the concentration of levodopa at 0.01 mg/mL, 0.03 mg/mL, and 0.05 mg/mL (c). All the measurements were repeated three times and the errors were less than 5%.
3.7. In Vitro Drug Release Kinetics
The Hixson–Crowell, Korsmeyer–Peppas, Higuchi, zero-order, and first-order kinetics were used to evaluate the release kinetics of levodopa. The highest degree of correlation coefficient (R2) was determined as a suitable mathematical model. On the other hand, the values of n that correspond to different transport mechanisms were associated with the Korsmeyer–Peppas release model. The ranges of the n value are shown in Table 4 [48].
Table 4.
Transport mechanism types according to the ranges of n value.
According to the results, it was obtained that levodopa-loaded scaffolds with levodopa concentrations at 0.01 and 0.03 mg/mL showed the Higuchi kinetic model, and those at 0.05 mg/mL exhibited a zero-order kinetics model. Additionaly, all the n values of scaffold samples were under 0.45. This shows that levodopa at three different concentrations was released from scaffolds through the Fickian diffusion mechanism (Table 5) (Figure 6, Figure 7 and Figure 8).
Table 5.
Results of mathematical drug release models for all scaffolds. Levodopa (0.01): Scaffolds have levodopa at a concentration of 0.01 mg/mL. Levodopa (0.03): Scaffolds have levodopa at a concentration of 0.03 mg/mL. Levodopa (0.05): Scaffolds have levodopa at a concentration of 0.05 mg/mL.
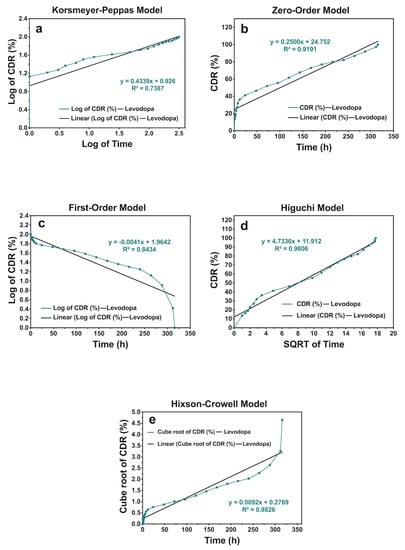
Figure 6.
The release kinetic models of levodopa release profiles from the scaffolds that have the concentration of levodopa at 0.01 mg/mL for 336 h: (a) Korsmeyer–Peppas, (b) zero-order, (c) first-order, (d) Higuchi, and (e) Hixson–Crowell models.
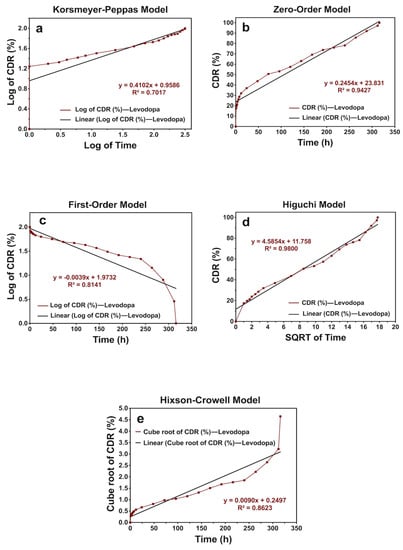
Figure 7.
The release kinetic models of levodopa release profiles from the scaffolds that have the concentration of levodopa at 0.03 mg/mL for 336 h: (a) Korsmeyer–Peppas, (b) zero-order, (c) first-order, (d) Higuchi, and (e) Hixson–Crowell models.
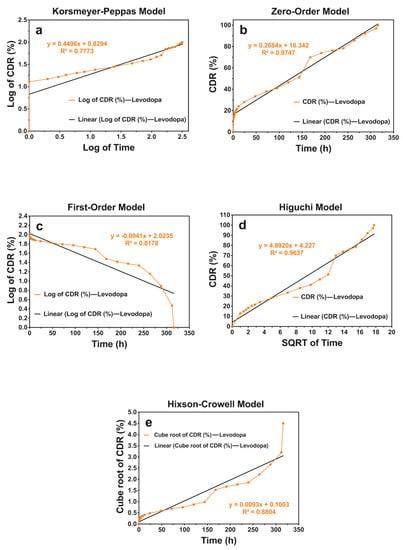
Figure 8.
The release kinetic models of levodopa release profiles from the scaffolds that have the concentration of levodopa at 0.05 mg/mL for 336 h: (a) Korsmeyer–Peppas, (b) zero-order, (c) first-order, (d) Higuchi, and (e) Hixson–Crowell models.
3.8. In-Vitro Cytotoxicity, Cell Adhesion, and Proliferation Investigation
To determine the cell viability and cell proliferation of all produced scaffolds, the number of cells was evaluated, using the MTT chromometry assay. The results of the MTT test showed that all scaffolds had increased viability and proliferation rate when cocultured with mesenchymal stem cells, in comparison with the 2D group on the 1st, 3rd, and 7th days, except for the 17 PLA/3 CS on the 1st day (Figure 9). Even in the case of 17 PLA/3 CS, the viability after day 1 was well over 80%, so it can be considered biocompatible. The MTT test results of PLA and pure 17 PLA/3 CS scaffolds presented no dramatic differences between the levels of cell viability and proliferation in both scaffold types. The percentages of cell viability of 17 PLA/3 CS scaffolds were found to be lower, compared to PLA scaffolds on the 1st and 7th days, at 96.9% and 120%, respectively. The acetic acid solvent of CS may cause lower cell viability [49,50]. Apart from this, the addition of different concentrations of levodopa does not cause any toxic effect on cell viability. However, when the literature is examined, it is observed that levodopa exhibits dose-dependent cytotoxic effects [51]. The high cell viability of the scaffolds supplemented with levodopa used in this study can be attributed to the very low amount of drug (0.01, 0.03 and 0.05 mg/mL) in the scaffolds along with the sustained release over 14 days, so, perhaps, the toxic level is not reached within the 1,3 or 7 days of evaluation.
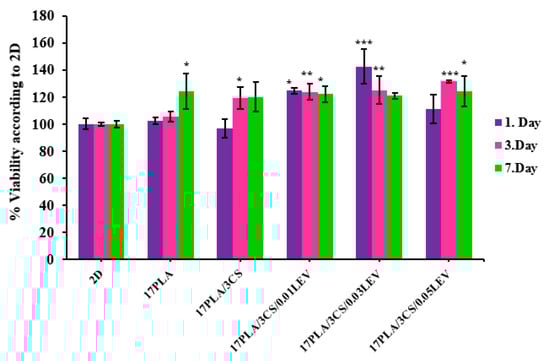
Figure 9.
Cell viability analysis of scaffolds with their standard deviations (* p < 0.05, ** p < 0.01, *** p < 0.001 compared to control).
DAPI stained 3D-printed scaffolds (Figure 10A) showed cold blue fluorescence, which depicts the nuclear DNA of cells to investigate MSC on 3D-printed scaffolds. The fluorescent microscope images taken after the 7th day prove the vitality of the cells. Figure 10A shows images of the fluorescence of 17 PLA and 17 PLA/3 CS, respectively. The examined figures indicate that MSCs show a homogeneous distribution on the scaffolds and that the density of living cells is high. In scaffolds loaded with different amounts of levodopa, the distribution of living cells is not uniform. However, the intensity of fluorescent radiation shows that the density of living cells is high. From the results obtained, it can be observed that the density of DAPI-stained cells in scaffolds is significantly higher, and therefore, MSCs can preserve their viability.
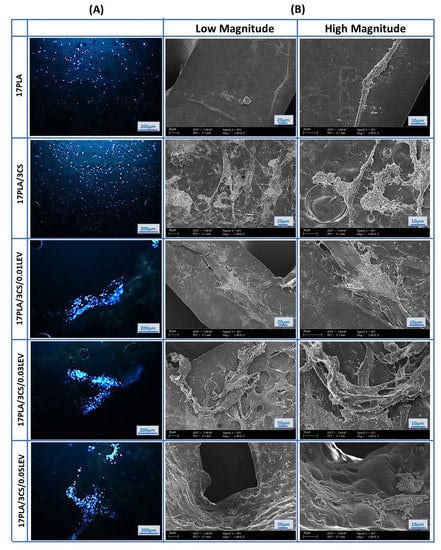
Figure 10.
Fluorescence microscopy images of human mesenchymal stem cells that nucleus stained with DAPI on scaffolds after 7 days of incubation (A), and SEM images of mesenchymal stem cells scaffolds (B).
Furthermore, cell–material interactions were determined by SEM imaging on 3D-printed scaffolds. The SEM images proved that the number of viable cells and cell proliferation on scaffolds increased after loading levodopa compared with the pure scaffolds. However, levodopa-loaded 17 PLA/3 CS scaffolds (0.03 mg/mL) have the highest cell viability effect by showing their effect as 142.4, 125.2, and 120.8% on the 1st, 3rd, and 7th days, respectively. On the other hand, the cell viability effects of 17 PLA/3 CS (0.01 mg/mL) decreased from 124.6% to 122.1% between the 1st and 7th days. Moreover, the cell viability of 111.2, 131.4, and 124.2% was obtained for 17 PLA/3 CS (0.05) scaffolds on the 1st, 3rd, and 7th days, respectively. Therefore, all produced scaffolds could be selected for other biological investigations, such as in vivo animal tests, due to having no cytotoxic effects. However, 17 PLA/3 CS scaffolds (0.03 mg/mL) could be more proper with their enhanced cell viability (Figure 10B). As a result, after 7 days of incubation, it was observed that MSCs spread on all scaffolds by forming extensions that are considered to be a sign of good biocompatibility (Figure 10B).
Overall, corroborating the data, it can be assumed that the 3D-printed scaffolds loaded with levodopa could be suitable drug delivery systems for the treatment of Parkinson’s disease. It is important to mention that these scaffolds fulfill the major requirements for being used as scaffolds for neural tissues, being biocompatible and ensuring good cell adhesion, which is essential in the integration. From the mechanical point of view, the scaffolds based on PLA and CS exhibit lower mechanical performance, compared to neat PLA, but are still suitable for such applications. However, the presence of CS ensures higher swelling and biodegradation, in vitro conferring to these drafts’ bioresorbability and the potential of supporting regeneration. These systems can be used for long-term release, for all three formulations.
4. Conclusions
In the presented study, levodopa-loaded PLA/CS scaffolds were successfully produced by the 3D-printing method. It was found that the average pore sizes of the scaffolds are in the range of 100–200 µm, which is similar to the literature. In addition, it was observed that the mechanical strength of the drug carrier scaffold is compatible with the porosity. Levodopa was released from levodopa-loaded 3D-printed scaffolds in a controlled release manner for 14 days. The results demonstrated that the levodopa-loaded scaffolds with levodopa concentration at 0.01 and 0.03 mg/mL showed the Higuchi kinetic model, and at 0.05 mg/mL, exhibited a zero-order kinetics model. Levodopa at three different concentrations released from scaffolds through the Fickian diffusion mechanism. According to the MTT analysis, the scaffolds did not have toxic effects, and it was observed that MSCs adapted easily to the scaffold. Considering the results obtained, the PLA/CS scaffolds obtained by the 3D-printing method have the potential for use as different drug carriers systems for the controlled delivery of levodopa in the treatment of Parkinson’s disease.
Author Contributions
E.S. and Y.A.; Conceptualization, investigation, methodology, E.G. and M.E.C.; validation, software, A.S.; formal analysis, N.E.; resources, E.I. and S.C.; investigation, writing—original draft preparation, visualization, writing—review and editing, D.F., A.F., O.G. and F.N.O.; supervision, project administration, funding acquisition, O.G., F.N.O., D.F. and A.F. All authors have read and agreed to the published version of the manuscript.
Funding
This research received no external funding.
Acknowledgments
This study was founded by BAPKO, Marmara University, grant no: FEN-B-121218-0614.
Conflicts of Interest
The authors declare that they have no financial interest in this paper.
References
- Goole, J.; Amighi, K. Levodopa delivery systems for the treatment of Parkinson’s disease: An overview. Int. J. Pharm. 2009, 380, 1–15. [Google Scholar] [CrossRef]
- Poewe, W.; Seppi, K.; Tanner, C.M.; Halliday, G.M.; Brundin, P.; Volkmann, J.; Schrag, A.E.; Lang, A.E. Parkinson disease. Nat. Rev. Dis. Prim. 2017, 3, 17013. [Google Scholar] [CrossRef] [PubMed]
- Tysnes, O.B.; Storstein, A. Epidemiology of Parkinson’s disease. J. Neural Transm. 2017, 124, 901–905. [Google Scholar] [CrossRef] [PubMed]
- Ansari, A.Q.; Ansari, S.J.; Khan, M.Q.; Khan, M.F.; Qureshi, U.A.; Khatri, Z.; Ahmed, F.; Kim, I.S. Electrospun Zein nanofibers as drug carriers for controlled delivery of Levodopa in Parkinson syndrome. Mater. Res. Express 2019, 6, 075405. [Google Scholar] [CrossRef]
- Pezzoli, G.; Zini, M. Levodopa in Parkinson’s disease: From the past to the future. Expert Opin. Pharmacother. 2010, 11, 627–635. [Google Scholar] [CrossRef]
- Franco, M.R.; Viana, T.F.; Biscaia, S.; Bártolo, P. Levodopa Incorporation in Alginate Membranes for Drug Delivery Studies. Adv. Mater. Res. 2013, 749, 423–428. [Google Scholar] [CrossRef]
- Cesur, S.; Cam, M.E.; Sayın, F.S.; Su, S.; Gunduz, O. Controlled Release of Metformin Loaded Polyvinyl Alcohol (PVA) Microbubble/Nanoparticles Using Microfluidic Device for the Treatment of Type 2 Diabetes Mellitus. In Bioinformatics and Biomedical Engineering, Proceedings of the 8th International Work-Conference, Granada, Spain, 6–8 May 2020; Springer: Cham, Switzerland, 2020. [Google Scholar] [CrossRef]
- Ilhan, E.; Ulag, S.; Sahin, A.; Ekren, N.; Kilic, O.; Oktar, F.N.; Gunduz, O. Production of 3D-Printed Tympanic Membrane Scaffolds as a Tissue Engineering Applicattion. In Bioinformatics and Biomedical Engineering; Springer Nature: Barcelona, Spain, 2020. [Google Scholar] [CrossRef]
- Cesur, S.; Oktar, F.N.; Ekren, N.; Kilic, O.; Alkaya, D.B.; Seyhan, S.A.; Ege, Z.R.; Lin, C.-C.; Kuruca, S.E.; Erdemir, G.; et al. Preparation and characterization of electrospun polylactic acid/sodium alginate/orange oyster shell composite nanofiber for biomedical application. J. Aust. Ceram. Soc. 2019, 56, 533–543. [Google Scholar] [CrossRef]
- Rasal, R.M.; Janorkar, A.V.; Hirt, D.E. Poly(lactic acid) modifications. Prog. Polym. Sci. 2010, 35, 338–356. [Google Scholar] [CrossRef]
- Wang, W.; Chen, S.; Zhang, L.; Wu, X.; Wang, J.; Chen, J.F.; Le, Y. Poly(lactic acid)/chitosan hybrid nanoparticles for controlled release of anticancer drug. Mater. Sci. Eng. C 2015, 46, 514–520. [Google Scholar] [CrossRef]
- Bano, I.; Arshad, M.; Yasin, T.; Ghauri, M.A.; Younus, M. Chitosan: A potential biopolymer for wound management. Int. J. Biol. Macromol. 2017, 102, 380–383. [Google Scholar] [CrossRef]
- Alenezi, H.; Cam, M.E.; Edirisinghe, M. Experimental and theoretical investigation of the fluid behavior during polymeric fiber formation with and without pressure. Appl. Phys. Rev. 2019, 6, 041401. [Google Scholar] [CrossRef]
- Ahmad, N. Rasagiline-encapsulated chitosan-coated PLGA nanoparticles targeted to the brain in the treatment of parkinson’s disease. J. Liq. Chromatogr. Relat. Technol. 2017, 40, 677–690. [Google Scholar] [CrossRef]
- Loh, Q.L.; Choong, C. Three-Dimensional Scaffolds for Tissue Engineering Applications: Role of Porosity and Pore Size. Tissue Eng. Part B Rev. 2013, 19, 485–502. [Google Scholar] [CrossRef] [Green Version]
- Aranci, K.; Uzun, M.; Su, S.; Cesur, S.; Ulag, S.; Amin, A.; Guncu, M.; Aksu, B.; Kolayli, S.; Ustundag, C.; et al. 3D Propolis-Sodium Alginate Scaffolds: Influence on Structural Parameters, Release Mechanisms, Cell Cytotoxicity and Antibacterial Activity. Molecules 2020, 25, 5082. [Google Scholar] [CrossRef] [PubMed]
- Ilhan, E.; Karahaliloglu, Z.; Kilicay, E.; Hazer, B.; Denkbas, E.B. Potent bioactive bone cements impregnated with polystyrene-g-soybean oil-AgNPs for advanced bone tissue applications. Mater. Technol. 2020, 35, 179–194. [Google Scholar] [CrossRef]
- Ulag, S.; Ilhan, E.; Sahin, A.; Yilmaz, B.K.; Kalaskar, D.M.; Ekren, N.; Kilic, O.; Oktar, F.N.; Gunduz, O. 3D printed artificial cornea for corneal stromal transplantation. Eur. Polym. J. 2020, 133, 109744. [Google Scholar] [CrossRef]
- Tan, J.M.; Foo, J.B.; Fakurazi, S.; Hussein, M.Z. Release behaviour and toxicity evaluation of levodopa from carboxylated single-walled carbon nanotubes. Beilstein J. Nanotechnol. 2015, 6, 243–253. [Google Scholar] [CrossRef] [Green Version]
- Cam, M.E.; Hazar-Yavuz, A.N.; Cesur, S.; Ozkan, O.; Alenezi, H.; Sasmazel, H.T.; Eroglu, M.S.; Brako, F.; Ahmed, J.; Kabasakal, L.; et al. A novel treatment strategy for preterm birth: Intra-vaginal progesterone-loaded fibrous patches. Int. J. Pharm. 2020, 588, 119782. [Google Scholar] [CrossRef]
- Cam, M.E.; Cesur, S.; Taskin, T.; Erdemir, G.; Kuruca, D.S.; Sahin, Y.M.; Kabasakal, L.; Gunduz, O. Fabrication, characterization and fibroblast proliferative activity of electrospun Achillea lycaonica-loaded nanofibrous mats. Eur. Polym. J. 2019, 120, 109239. [Google Scholar] [CrossRef]
- Cam, M.E.; Ertas, B.; Alenezi, H.; Hazar-Yavuz, A.N.; Cesur, S.; Ozcan, G.S.; Ekentok, C.; Guler, E.; Katsakouli, C.; Demirbas, Z.; et al. Accelerated diabetic wound healing by topical application of combination oral antidiabetic agents-loaded nanofibrous scaffolds: An in vitro and in vivo evaluation study. Mater. Sci. Eng. C 2021, 119, 111586. [Google Scholar] [CrossRef]
- Khatiwala, C.; Law, R.; Shepherd, B.; Dorfman, S.; Csete, M. 3D cell bioprinting for regenerative medicine research and therapies. Gene Ther. Regul. 2012, 7, 1230004. [Google Scholar] [CrossRef]
- Kyle, S.; Jessop, Z.M.; Al-Sabah, A.; Whitaker, I.S. ‘Printability’ of Candidate Biomaterials for Extrusion Based 3D Printing: State-of-the-Art. Adv. Heal. Mater. 2017, 6, 1700264. [Google Scholar] [CrossRef] [PubMed]
- Lukić, M.; Clarke, J.; Tuck, C.; Whittow, W.; Wells, G. Printability of elastomer latex for additive manufacturing or 3D printing. J. Appl. Polym. Sci. 2015, 133. [Google Scholar] [CrossRef] [Green Version]
- Cesur, S.; Ulag, S.; Ozak, L.; Gümüşsoy, A.; Arslan, S.; Yilmaz, B.K.; Ekren, N.; Agirbasli, M.; Kalaskar, D.M.; Gunduz, O. Production and characterization of elastomeric cardiac tissue-like patches for Myocardial Tissue Engineering. Polym. Test. 2020, 90, 106613. [Google Scholar] [CrossRef]
- Ilhan, E.; Ulag, S.; Sahin, A.; Yilmaz, B.K.; Ekren, N.; Kilic, O.; Sengor, M.; Kalaskar, D.M.; Oktar, F.N.; Gunduz, O. Fabrication of tissue-engineered tympanic membrane patches using 3D-Printing technology. J. Mech. Behav. Biomed. Mater. 2020, 114, 104219. [Google Scholar] [CrossRef] [PubMed]
- Liu, F.; Liu, Y.; Sun, Z.; Wang, D.; Wu, H.; Du, L.; Wang, D. Preparation and antibacterial properties of ε-polylysine-containing gelatin/chitosan nanofiber films. Int. J. Biol. Macromol. 2020, 164, 3376–3387. [Google Scholar] [CrossRef]
- Bukhary, H.; Williams, G.R.; Orlu, M. Fabrication of Electrospun Levodopa-Carbidopa Fixed-Dose Combinations. Adv. Fiber Mater. 2020, 2, 194–203. [Google Scholar] [CrossRef] [Green Version]
- Kim, H.-W.; Knowles, J.C.; Kim, H.-E. Hydroxyapatite/poly(ε-caprolactone) composite coatings on hydroxyapatite porous bone scaffold for drug delivery. Biomaterials 2004, 25, 1279–1287. [Google Scholar] [CrossRef]
- Ilhan, E.; Cesur, S.; Guler, E.; Topal, F.; Albayrak, D.; Guncu, M.M.; Cam, M.E.; Taskin, T.; Sasmazel, H.T.; Aksu, B.; et al. Development of Satureja cuneifolia-loaded sodium alginate/polyethylene glycol scaffolds produced by 3D-printing technology as a diabetic wound dressing material. Int. J. Biol. Macromol. 2020, 161, 1040–1054. [Google Scholar] [CrossRef]
- Jaidev, L.; Chatterjee, K. Surface functionalization of 3D printed polymer scaffolds to augment stem cell response. Mater. Des. 2019, 161, 44–54. [Google Scholar] [CrossRef]
- Bianchera, A.; Salomi, E.; Pezzanera, M.; Ruwet, E.; Bettini, R.; Elviri, L. Chitosan Hydrogels for Chondroitin Sulphate Controlled Release: An Analytical Characterization. J. Anal. Methods Chem. 2014, 2014, 808703. [Google Scholar] [CrossRef]
- Jurga, M.; Dainiak, M.B.; Sarnowska, A.; Jablonska, A.; Tripathi, A.; Plieva, F.M.; Savina, I.; Strojek, L.; Jungvid, H.; Kumar, A.; et al. The performance of laminin-containing cryogel scaffolds in neural tissue regeneration. Biomaterials 2011, 32, 3423–3434. [Google Scholar] [CrossRef]
- Goldner, J.S.; Bruder, J.M.; Li, G.; Gazzola, D.; Hoffman-Kim, D. Neurite bridging across micropatterned grooves. Biomaterials 2006, 27, 460–472. [Google Scholar] [CrossRef]
- Jian, Y.-T.; Yang, Y.; Tian, T.; Stanford, C.; Zhang, X.-P.; Zhao, K. Effect of Pore Size and Porosity on the Biomechanical Properties and Cytocompatibility of Porous NiTi Alloys. PLoS ONE 2015, 10, e0128138. [Google Scholar] [CrossRef] [PubMed]
- Singh, S.; Singh, G.; Prakash, C.; Ramakrishna, S.; Lamberti, L.; Pruncu, C.I. 3D printed biodegradable composites: An insight into mechanical properties of PLA/chitosan scaffold. Polym. Test. 2020, 89, 106722. [Google Scholar] [CrossRef]
- Singh, S.; Singh, M.; Prakash, C.; Gupta, M.K.; Mia, M.; Singh, R. Optimization and reliability analysis to improve surface quality and mechanical characteristics of heat-treated fused filament fabricated parts. Int. J. Adv. Manuf. Technol. 2019, 102, 1521–1536. [Google Scholar] [CrossRef]
- Kamaludin, N.H.I.; Ismail, H.; Rusli, A.; Sam, S.T.; Gunny, A.A.N. Processing, tensile and morphological characteristics of polylactic acid/chitosan biocomposites prepared by melt compounding technique. AIP Conf. Proc. 2020, 2267, 020002. [Google Scholar] [CrossRef]
- Nor, N.A.M.; Othman, N. Effect of Filler Loading on Curing Characteristic and Tensile Properties of Palygorskite Natural Rubber Nanocomposites. Procedia Chem. 2016, 19, 351–358. [Google Scholar] [CrossRef] [Green Version]
- Zhang, M.; Li, Z.; Liu, L.; Sun, Z.; Ma, W.; Zhang, Z.; Zhang, R.; Sun, D. Preparation and Characterization of Vancomycin-Loaded ElectrospunRana chensinensisSkin Collagen/Poly(L-lactide) Nanofibers for Drug Delivery. J. Nanomater. 2016, 2016, 1–8. [Google Scholar] [CrossRef] [Green Version]
- Felfel, R.M.; Gideon-Adeniyi, M.J.; Hossain, K.M.Z.; Roberts, G.A.; Grant, D. Structural, mechanical and swelling characteristics of 3D scaffolds from chitosan-agarose blends. Carbohydr. Polym. 2018, 204, 59–67. [Google Scholar] [CrossRef]
- Tighzert, W.; Habi, A.; Ajji, A.; Sadoun, T.; Daoud, F.B.-O. Fabrication and characterization of nanofibers based on poly(lactic acid)/chitosan blends by electrospinning and their functionalization with phospholipase A1. Fibers Polym. 2017, 18, 514–524. [Google Scholar] [CrossRef]
- Grover, C.N.; Cameron, R.; Best, S.M. Investigating the morphological, mechanical and degradation properties of scaffolds comprising collagen, gelatin and elastin for use in soft tissue engineering. J. Mech. Behav. Biomed. Mater. 2012, 10, 62–74. [Google Scholar] [CrossRef]
- Shoichet, M.S. Polymer Scaffolds for Biomaterials Applications. Macromolecules 2009, 43, 581–591. [Google Scholar] [CrossRef]
- Wang, D.; Hill, D.J.T.; Peng, H.; Symons, A.; Varanasi, S.; Whittaker, A.K.; Rasoul, F. Development of Injectable Biodegradable Multi-Arms PEG-Based Hydrogels: Swelling and Degradation Investigations. Macromol. Symp. 2010, 296, 233–237. [Google Scholar] [CrossRef]
- Gupta, K.; Kumar, M.N.V.R. Drug release behavior of beads and microgranules of chitosan. Biomaterials 2000, 21, 1115–1119. [Google Scholar] [CrossRef]
- Hayashi, T.; Kanbe, H.; Okada, M.; Suzuki, M.; Ikeda, Y.; Onuki, Y.; Kaneko, T.; Sonobe, T. Formulation study and drug release mechanism of a new theophylline sustained-release preparation. Int. J. Pharm. 2005, 304, 91–101. [Google Scholar] [CrossRef] [PubMed]
- Thomas, M.S.; Pillai, P.K.S.; Faria, M.; Cordeiro, N.; Barud, H.; Thomas, S.; Pothen, L.A. Electrospun polylactic acid-chitosan composite: A bio-based alternative for inorganic composites for advanced application. J. Mater. Sci. Mater. Med. 2018, 29, 1–12. [Google Scholar] [CrossRef] [Green Version]
- Samadi, S.; Moradkhani, M.; Beheshti, H.; Irani, M.; Aliabadi, M. Fabrication of chitosan/poly(lactic acid)/graphene oxide/TiO2 composite nanofibrous scaffolds for sustained delivery of doxorubicin and treatment of lung cancer. Int. J. Biol. Macromol. 2018, 110, 416–424. [Google Scholar] [CrossRef]
- Kura, A.U.; Al Ali, S.H.H.; Hussein, M.Z.; Fakurazi, S.; Arulselvan, P. Development of a controlled-release anti-parkinsonian nanodelivery system using levodopa as the active agent. Int. J. Nanomed. 2013, 8, 1103–1110. [Google Scholar] [CrossRef] [Green Version]
Publisher’s Note: MDPI stays neutral with regard to jurisdictional claims in published maps and institutional affiliations. |
© 2021 by the authors. Licensee MDPI, Basel, Switzerland. This article is an open access article distributed under the terms and conditions of the Creative Commons Attribution (CC BY) license (https://creativecommons.org/licenses/by/4.0/).