Abstract
Invasive tree species continue to spread, so in addition to strategies to limit this their use in the production of innovative products must be considered. This research aimed to develop and apply a model for calculating the cost price of invasive wood products considering the specificities of materials and production process, and is suitable for quickly assessing the economic feasibility of using the selected tree species for a given product. The TDABC method with the inclusion of fuzzy logic was used to incorporate the uncertainty of time and quality parameters. In the model, the imprecise values of these parameters are represented with triangular fuzzy numbers. Using a furniture product (dining table) made of black locust wood as an example, we demonstrated the applicability of the developed model. We found that the most probable cost price of a table made of black locust wood is comparable to the price of a product made of oak wood. In this way, we proved the potentially high economic value of invasive wood. The innovative products from invasive non-native wood species can achieve a high added value due to their visual characteristics and attractive appearance. Such use could increase interest in the (more efficient) management of invasive tree species, which would help to manage and use them efficiently. For further research, it would be useful to apply the proposed model to other invasive tree species as well as to other products.
1. Introduction
Invasive tree species have considerable negative impacts on the environment. These include their rapid growth and spread, completely displacing native tree species in certain environments, which can be a major environmental problem, especially in urban areas. It is also problematic from an economic point of view—the wood of invasive tree species has high variability and its economic use is questionable. The characteristics of this wood are also less understood and production processes are not adapted to them, as the wood of these tree species has many growth peculiarities that affect its processing. As the proportion of invasive alien plant species is increasing, some of the wood species have already been analysed and shown to have good relevant properties, such as visual texture, chemical, physical and mechanical properties, drying characteristics, and machinability, as well as natural durability of the wood [1,2,3,4,5,6]. Due to such properties, wood from these species can be used for wood products. In addition, wood processing residues can also be used for the production of wood-based composites from invasive species [7] or even for pellet production [8].
There are several ways to solve the problem of the proliferation of invasive tree species in Slovenia (and worldwide), especially in urban environments. As long as the plant is small, confined to a small area, and identified as invasive in time, we can try to remove it completely along with the root system. Chemical treatment is considered the most effective, but the use of chemical agents is not allowed in Slovenian forests [9], as chemicals in some cases may have strong negative effects on the remaining species and ecosystem functioning [10]. A change in policy regarding the use of herbicides on invasive species would likely be an ecologically successful approach to controlling this species. Therefore, the only option is mechanical removal. In the case of trees, this measure is not feasible, so it makes sense to use these tree species economically, as this helps to prolong carbon sequestration in products (improving the carbon footprint) and, thanks to the aforementioned good properties of wood, we can enable a longer life for the products made from it and contribute to the circular economy. Products made from some appropriate invasive species (like black locust) can achieve high added value due to their characteristics, suitable design, and processing, and are commercially attractive. They can also have a positive impact on improving the efficiency [11] and long-term performance of the Slovenian wood industry [12]. These products have their specificities in terms of design characteristics and, above all, construction (e.g., component dimensions) and production process. It is important to bear in mind that the dimensions of raw materials are limited and that it is advisable to use natural materials for both the joints and surface protection, as this emphasizes the ecological aspect of these products.
Following Eckelman [13], we considered three separately closed areas of design that must be considered in the creation of a new piece of furniture: aesthetic design, functional design, and engineering design. During the design process and preparation of production plans, the available materials and manufacturing technologies must also be considered [14]. When using wood with limited dimensions, low-quality wood, or with growth defects, it is necessary to use such constructions and connections that give the wood more “freedom” and space for dimensional changes. The use of low-grade wood can reduce the cost of materials, but it increases the number of operations (e.g., bonding) and reduces the volume yield. Designing furniture from locally available materials, conserving resources, using energy efficiently, and protecting the environment while developing the economy are the fundamentals of green design, which is also known as life cycle design and environmentally oriented design, among other names [15]. Nowadays, due to the increasing awareness of environmental and ecological issues, a growing trend of producing and purchasing “green” products and services is emerging, and the production of “eco-furniture” or “green” furniture could provide a significant competitive advantage [16]. To address the existing threats, new practices and out-of-the-box thinking are needed to renew the sector and make it more sustainable.
Knowing their cost price and comparing them to similar products made from conventional tree species is essential to determine the economic feasibility and profitability of producing wood products from invasive trees. The cost price represents the sum of all costs incurred in the production of a product. It depends on several factors that affect the cost of each factor of production. The most important factor is certainly the number of products manufactured and the size of the batch, which in the case of products from invasive trees species is usually determined by the available quantities of raw material of suitable quality. The cost price must be accurately estimated or calculated because, on the one hand, it is a very important basis for managers in deciding how to manage resources and control costs and, on the other hand, it influences decisions that depend on whether the product is profitable at all for the company. The lack of such knowledge leads to not understanding the relationship between costs and process improvements, which in our case is important for planning the manufacturing process of these products.
The cost of goods sold can be calculated using traditional/standard cost accounting methods or newer methods that eliminate most of the disadvantages of the former. Many researchers have studied the usefulness of different calculation methods for management decision making [17,18,19,20] or their application in managing certain processes [21,22]. The literature also contains many studies on cost management for individual products or product groups [23,24,25]. There are also many studies on cost calculations in the wood industry [26,27,28,29], for which all calculations are performed using the Activity-Based Costing System or Time-Driven Activity-Based Costing System. These methods overcome the main shortcomings of traditional approaches [18], and most importantly introduce a modern view of cost management in the business environment [30,31,32,33,34]. However, for certain cases, especially when it is not possible to obtain the exact values of certain input data for the calculation of cost price, a fuzzy method has been introduced for the calculation [35,36,37,38,39].
To date, no research has yet addressed the calculation of cost price for wood products made from invasive trees that have many unique characteristics and, more importantly, the valuation of the cost price of such products using the Fuzzy Time-driven ABC method. The research aims to develop and use a model/algorithm for calculating the cost price of wood products made from invasive tree species, considering the specificities of materials in terms of their characteristics, available quantities, quality variations, and peculiarities of the production process. This model should be suitable for quickly assessing the economic feasibility of using the selected tree species for a given product. Due to its many advantages and usefulness, the Fuzzy Time-driven ABC model will be used in this study. The TDABC model with the inclusion of fuzzy logic should take into account the uncertainty of some parameters (time, quality, etc.) to provide accurate information about the cost price of the products.
We set the following hypotheses:
Hypothesis 1.
There is insufficient data on the available quantities of wood from invasive tree species, which reduces the possibility of rational (efficient) and economically acceptable use of this potential.
Hypothesis 2.
Using the Fuzzy Time-driven ABC method, it is possible to develop a complex model for calculating the cost price of wood products made from invasive tree species, considering all the specific features of this material and its processing.
Hypothesis 3.
The cost price of products made from invasive wood is higher than for the same products from conventional tree species (e.g., oak).
The rest of this paper is organized as follows. It first examines the studies on the availability, properties, and utilization potential of non-native tree species, and then presents its cost price calculation focusing on the TDABC method and its extension by fuzzy logic. This is followed by a new innovative model for the cost price calculation of products made from selective non-native wood species (black locust) under conditions of uncertainty and the application of the proposed model to a case study. The last part of the paper contains concluding remarks and some recommendations for future research.
2. Literature Review
2.1. Wood of Non-Native Invasive Wood Species—Black Locust (Robinia Pseudoacacia)
Black locust is a medium-sized hardwood deciduous tree, endemic to a few areas of America, but it has been widely planted and spread in areas in Europe and Asia. It is a fast-growing species, produces valuable and resistant wood, and is suitable for amelioration and reclamation of disturbed sites, erosion control, and honey-making. Since it is very tolerant of the nature of the substrate, its propagation and spread are very fast, and it is considered an invasive species in some areas [40]. The importance of black locust wood is growing since it has been used in the European subsidy program for tree species cultivation, and the rapid spread of this species means that large quantities of wood will soon be available for harvesting [41]. It is often used as posts in agriculture/vineyards, but less commonly used in furniture, parquet, and rarely in the production of other wood-based panels, such as particleboard, fibreboard, veneer, etc., because of its high density, frequent poorly formed trunk, and difficulties in the barking procedure.
As black locust in Slovenia is a species that represents only a small percentage of the tree species in the country, few studies have been carried out on the quality of the assortment and the economic price. Economic research showed that about 40% of all black locust assortments are used for low-value technical timber (vineyard poles, piles, pit timber, etc.). Mainly these are trees with a diameter of up to 30 cm. The remaining 60% of the timber assortment (mainly diameters from 30 to 55 cm) is divided into quality classes, roughly as follows: A—5%, B—10%, C—25%, D—20% [42]. Based on the timber structure, wood defects, growth anomalies [43,44], and rotten heart [42] in black locust, we estimate that the volume utilization from logs to sawn wood is about 50%.
Before processing a particular wood species, it is important to know its technological properties. These can be divided into physical, mechanical, chemical, and aesthetic properties, as well as processing properties and resistance to biotic and abiotic factors. Only with a good knowledge of the listed relevant properties of each wood species can we assess the possibility of its use. The wood of black locust is somewhat denser and has better mechanical properties compared to oak [4,45,46,47,48]. The dimensional stability of black locust wood is slightly lower compared to oak, and shrinkage and shrinkage anisotropy are similar. The wood is very impermeable and needs to be dried under carefully mild conditions [5], which is also reflected in the slow drying of surface oil coatings [49]. Due to the large density differences between early and latewood, there are also differences in transverse shrinkage within annual rings, and the generated stresses can also cause ring shake. Mechanical processing of black locust wood is good on average, but planing can be challenging due to its high density [4]. Compared to other species, black locust is one of the most durable woods [50] which is due to the content and bioactive function of phenolic extracts [51]. From this point of view, it is also suitable for outdoor use. For a comparison of the relevant properties of some conventional and non-native invasive wood species [52], see Table 1.

Table 1.
Average values of basic physical and mechanical properties of native and some non-native hardwoods (ρ12—density of air-dried wood (u = 12–15%), βR—radial shrinkage, βT—tangential shrinkage, βV—volume shrinkage, qR—radial differential shrinkage, qT—tangential differential shrinkage, qT/qR—shrinking anisotropy, σC—compression strength, σB—bending strength, σT—tension strength, E‖—longitudinal modulus of elasticity, Aw—impact bending strength, HB┴—Brinell hardness) [1,53,54,55,56,57].
The black locust wood is relatively rarely used in furniture production, despite its good properties. The choice of wood species for a certain product also affects customer interest in it, since customers usually prefer traditional wood species to lesser-known ones [58]. To successfully integrate a new, less known wood species into saleable products, it is also necessary to raise customers’ environmental awareness. Wood and wood products store carbon, thus minimizing CO2 in the atmosphere. Moreover, long distance transportation contributes to emissions, thus locally sourced timber and products should be considered the first choice [59].
2.2. Cost Calculation Methods
Cost management has been evolving from the traditional approach mainly focused on overhead allocation and product costing to the almost complete analysis of the organization’s cost structure and strategic cost management. Activity-Based Costing (ABC) systems and more recently Time-Driven Activity-Based Costing (TDABC) systems are particularly important in this context [21]. Activity-Based Costing (ABC) is a rather new costing system that calculates the cost of services and products by linking organizational costs to the activities required to perform services or products. The ABC goal is to more precisely allocate overhead costs to products or services through cost drivers. This information helps managers to better manage resources and maximize their potential profitability by reducing costs. The most challenging issue of this method is the data collection process, which is done through numerous interviews and reviews and is very time-consuming. Another shortcoming of this method is that it is unable to identify unused capacity [38]. The TDABC method was thus developed to eliminate the problems of the standard ABC model [31]. The TDABC model, using time equations and cost drivers, can take into account complex activities and processes and provide more accurate cost information. It is also able to identify unused resources and capacities and thus enables better management of resources.
A time-driven costing process automatically reveals any differences between the total time needed to carry out all of the activities performed by a department, and the total amount of time the department’s employees have available. This makes time-driven ABC a more rigorous methodology for ABC programs in which better capacity management is an objective [21]. TDABC is based on two key parameters: the cost per time unit of capacity (capacity cost rate—CCR) and the time required to complete an activity; time is typically considered the measure of the capacity [31]. Activities are represented by time equations, which are the sum of individual activity times with time drivers. Through a simple time equation it is possible to represent all possible combinations of activities (e.g., different types of products do not necessarily require the same amount of time to be produced). Activity costs are then distributed to cost objects by multiplying the cost per time unit of the resources by the estimate of the time required to perform the activities [34]. A time equation is a mathematical expression of the time needed to perform activities as a function of several activity time drivers. It implicitly assumes that the duration of an activity is not constant, but a function of the time consumed by the k possible events of an activity and their specific characteristics (i.e., time drivers) (Equation (1)) [34]:
with:
T = The time required to perform an activity with k events
β0 = The basic time to perform the activity (independent of the characteristics of the activity)
βi = The estimated time for the incremental activity i, with i = 1, …, k
Xi = The quantity of incremental activity i (transactional data)
k = The number of time drivers taken into account
Multiple time drivers can also be used in the equation if an activity is driven by more than one driver [60]. The use of multiple variables enables the possibility of collecting more information, the simplification of the estimating process, and the production of a more accurate cost model (Equation (2)) [61].
Nevertheless, this system also has its deficiencies. The TDABC provides fairly accurate information so that it can accurately estimate the cost of activities. However, the cost and time required for some parameters in the time-equation and quality distribution are uncertain. To address this, we need an approach that includes the uncertainty in the TDABC system to accurately estimate some data. One of the most effective methods for incorporating data inaccuracy and uncertainty into the TDABC system is fuzzy logic [62]. With fuzzy logic, the TDABC system can provide more reliable results.
3. Materials and Methods
3.1. Materials
From the analytical data from Slovenian Forest Service [63,64], the total population of black locust is about 2.0 mil m3. This represents about 0.6% of the total population in Slovenian forests. Of all non-native tree species in Slovenian forests, the black locust has the largest share (almost 2/3 of the stock of all non-native tree species in our forests). According to the climate change scenarios (mean, optimistic, pessimistic) and the empirical model, the proportion of black locust in Slovenia will gradually increase, especially in the eastern, north-eastern, and south-western parts of the country. Depending on the scenario, the proportion of black locust would increase between 97% and 139% by the end of the century. This means that the average population of the black locust could at least double compared to the current state [63].
Production of products from black locust wood was performed in a normally equipped workshop with classic woodworking machines including CNC and hand tools. During the design process, the emphasis was put on rational use of available material as well as thinking about financial profitability and product added value. We grouped potential products into three categories: (1) simple products: smaller dimensions, with fewer assembly elements, simple mitre joints, less edgewise bonding, fewer dowel joints (for example photo frames, stools, moulds, and deckle sets for paper making kits…); (2) complex products: bigger dimensions, more assembly elements, more edgewise bonding and dowel jointing (such as dining tables, office tables, bookshelves, wardrobes, stands…); (3) special products: items that do not fit completely into previous groups, like composters, that are simple products with simple joints, but with bigger dimensions and a greater number of parts.
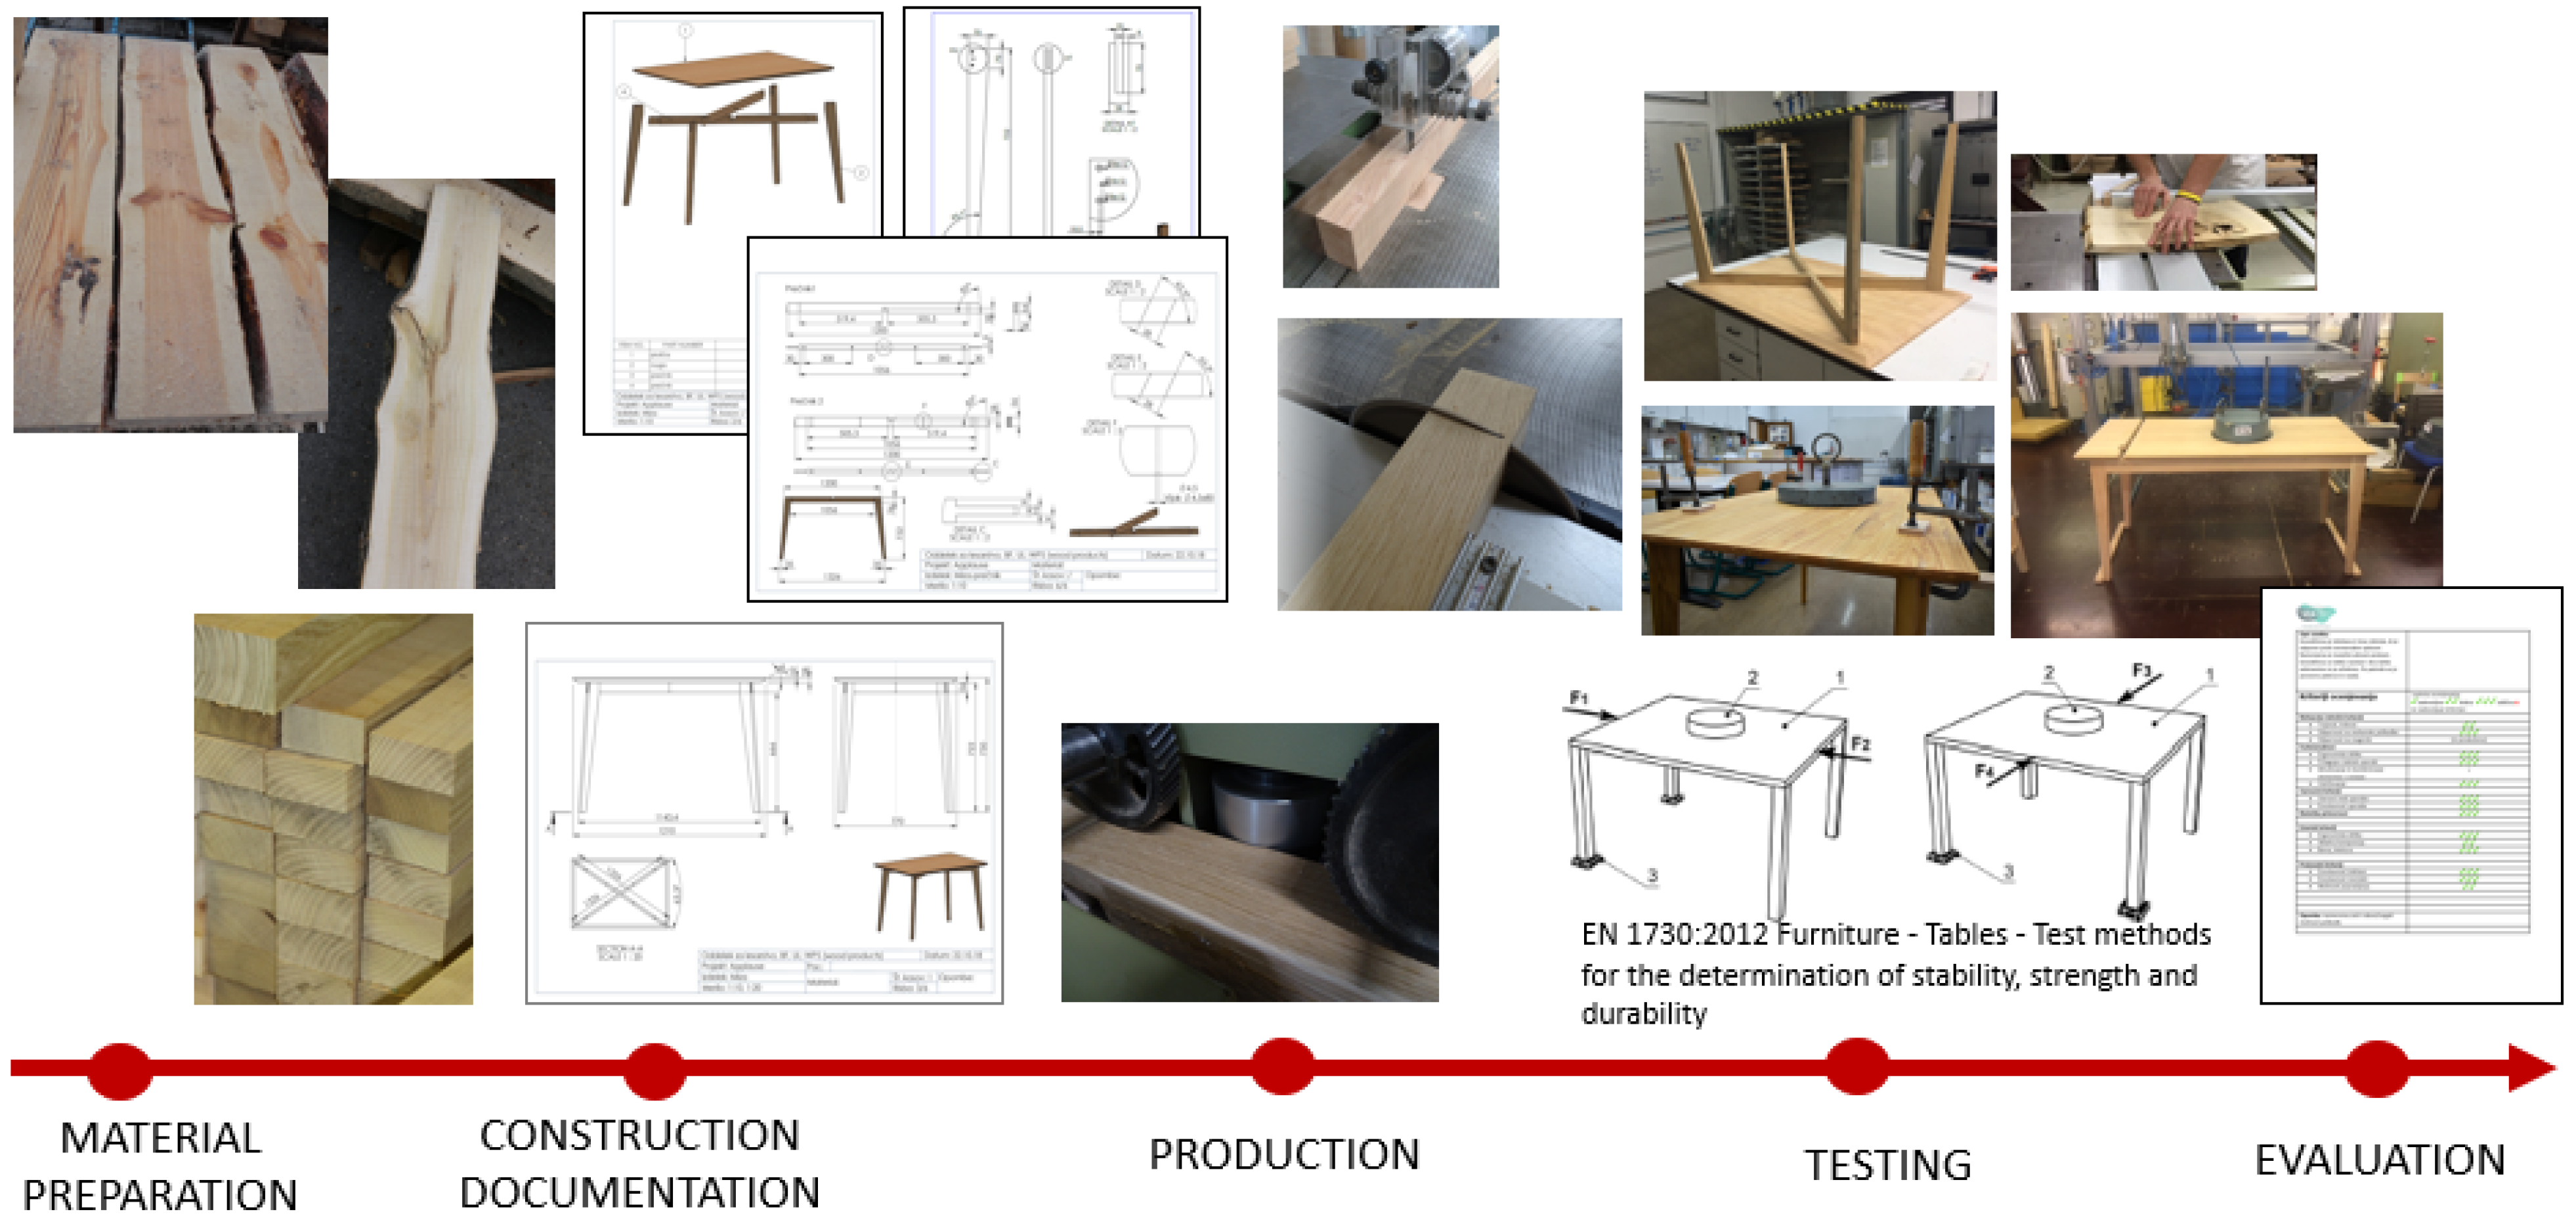
A dining table with the tabletop dimensions of 1210 × 770 mm was used for testing the model of the cost price calculation. The tabletop was made from edgewise bonded lamellas. Open slot mortise and tenon joints were used in the connection between table legs and table frame/base. Table frame rails were crossed in an X-shaped half lap joint in the middle, and the tabletop was connected to the table frame/base rails with screws through rails.
Due to using wood with growth defects, special care is needed with edgewise bonding, especially with the selection of lamellas (radial/tangential cut) and their position (alternating grain direction) in a panel. Without careful positioning we get cupped/crooked/twisted panels, which is important to avoid, especially for larger panels like tabletops. Figure 1 shows the development process of the dining table.
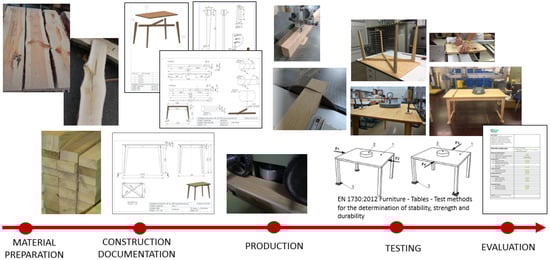
Figure 1.
Development process of the table.
We found that even if we are working with a type of wood for which we do not have wide boards available, we can achieve relatively good volume efficiency if we make products whose components are glued from narrower lamellas. Therefore, the production process for all products is similar, differing mainly in complexity in terms of the number of elements in the product, the operations used, and the design features. Activities and pools of activities in the production of invasive wood products for simple and complex products are shown in Table 2.
Table 2.
Activities and pools of activities in the production of invasive wood products for simple and complex products.
3.2. Development and Implementation of a Model for Calculating the Cost Price of Products Made from Invasive Non-Native Wood Species
The model for calculating the cost price of products made from invasive non-native wood species was designed based on the fuzzy time-driven activity-based costing (FTDABC) method, which was chosen because it is based on how long an activity takes and the consumption of available resources during the activity, while the exact values for some parameters were uncertain. The method allows dividing resource costs by activities through resource and capacity cost drivers, and through activity cost drivers and time equations to attribute activity costs to a cost object or product, whereby it is not necessary to determine exact values for certain parameters.
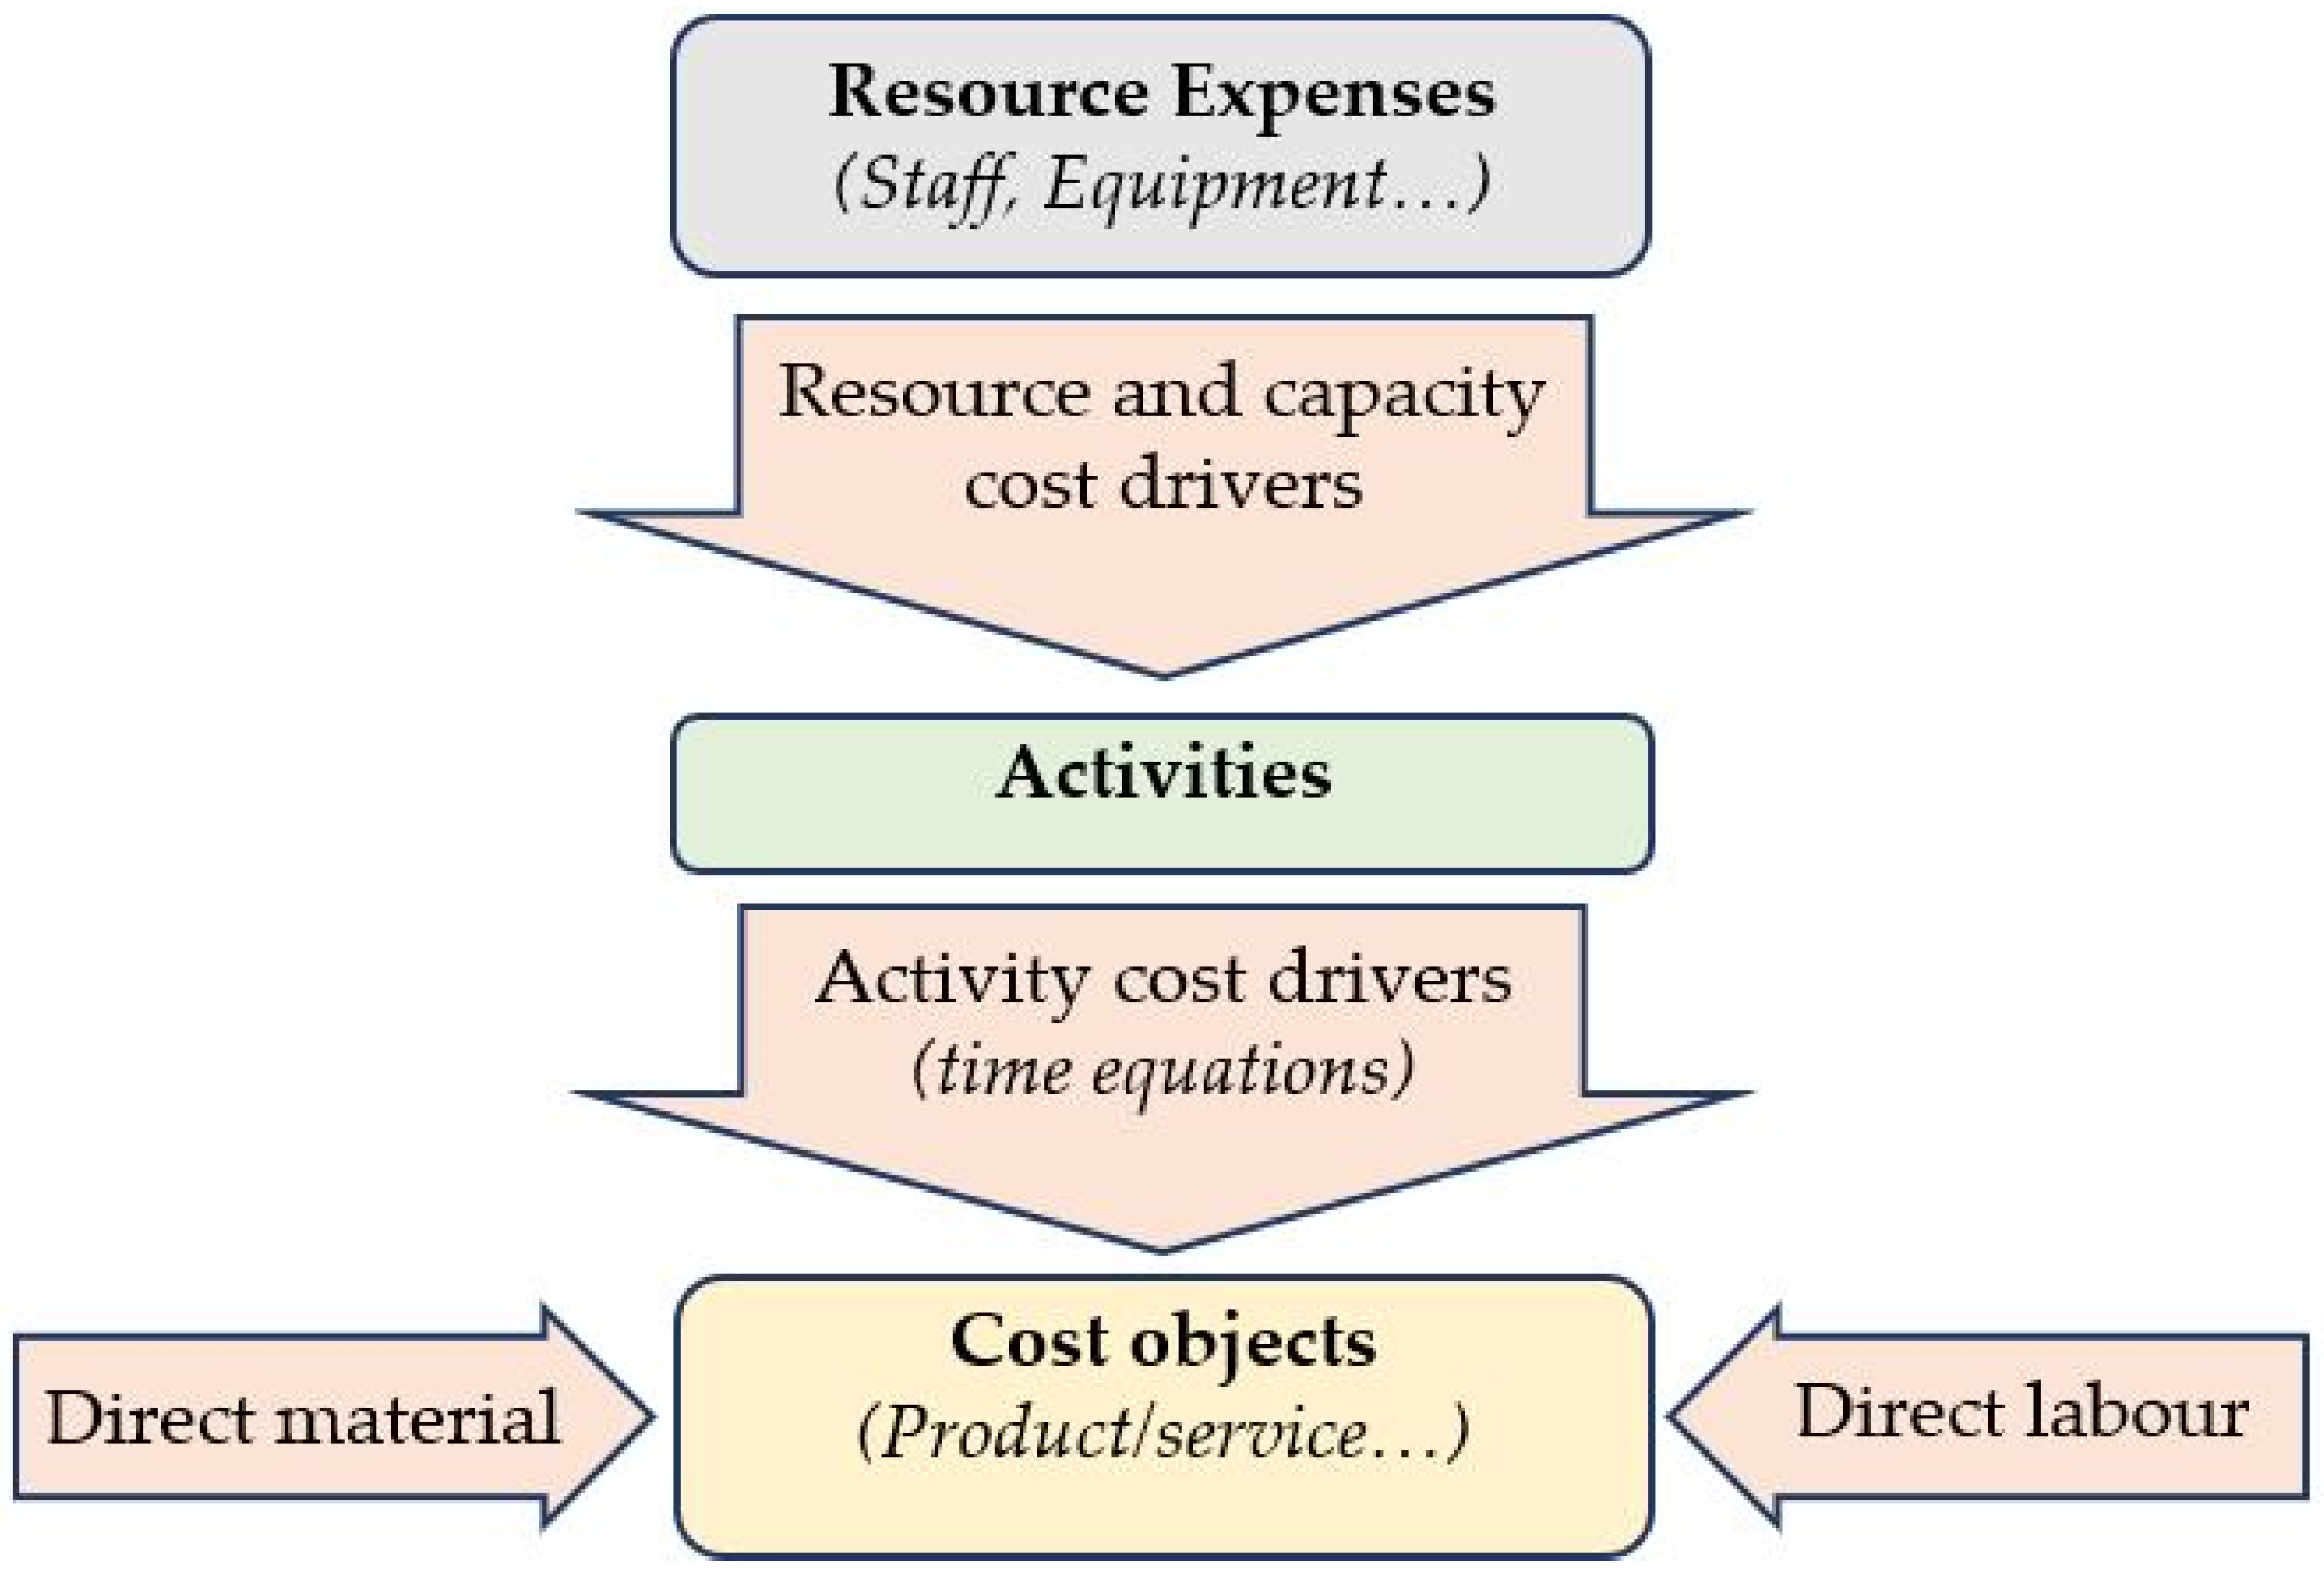
Time-Driven Activity-based Costing algorithm [38] (Figure 2):
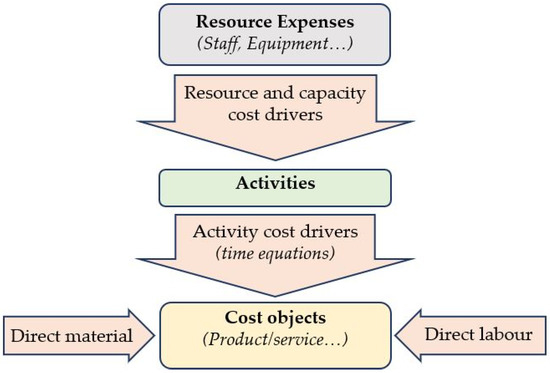
Figure 2.
TDABC model.
- Identify the various resource expenses.
- Estimate the total cost of each resource group.
- Estimate the practical capacity of each resource group (e.g., available working hours).
- Calculate the resource and capacity cost drivers; find the capacity cost rate (CCR) for each resource group by dividing the total cost of the resource group by the practical capacity;
- Calculate the activity cost drivers; determine the time required for each event of an activity using a time equation.
- Multiply the Capacity Cost Rate (CCR) of each resource group by the time required to perform the activity.
- Calculate the total cost per unit, including all costs of all activities and overhead costs for activities’ execution.
- Estimate the direct material and labour costs with regard to the cost objects (products, services…).
- Calculate the cost price of a cost object.
Since we cannot determine exact values for certain parameters, we expressed them by triangular fuzzy numbers (TFNs), thus extending the model to fuzzy TDABC (fuzzy values of some parameters in time equation, fuzzy values of price, yield, etc., for estimation of the direct material and labour costs; calculation of the (fuzzy) cost price of a cost object at the end). The calculations in the model were performed considering the rules of fuzzy arithmetic operations (Equation (5)). Fuzzy set theory is a powerful method for representing uncertain data in various contexts [62]. A fuzzy set A is characterized by a membership function μA(x) that represents the degree to which an element x belongs to A and ranges from 0 to 1:
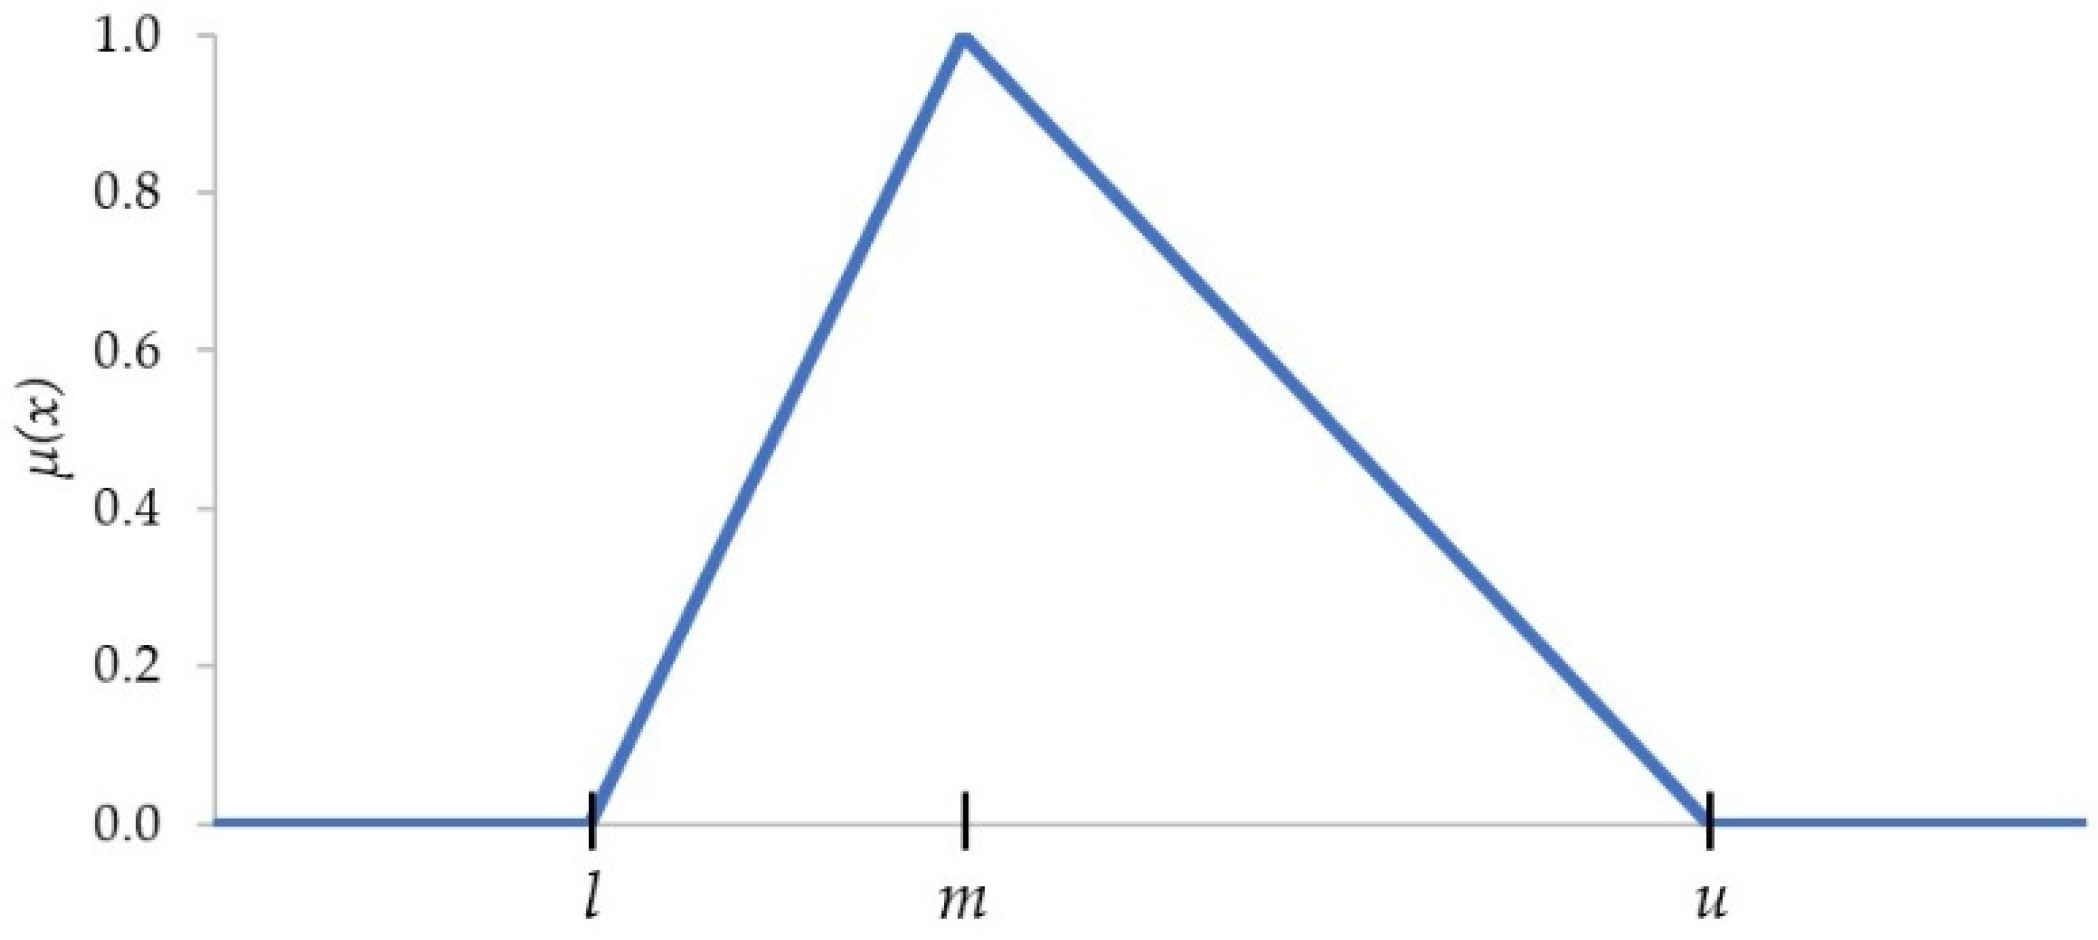
Different types of membership functions can be used, but the triangular shaped (Figure 3) is one of the most commonly used in applications with fuzzy numbers, since linear membership functions are easy to use and provide good performance [65]. TFNs are defined by a triple (l,m,u), where m represents the core of the fuzzy number or the most promising value. Interval [l,u] is the support of TFN, while l and u represent the lower and upper bounds of support or the smallest and the largest possible values, respectively. The TFN membership function is defined as:

Figure 3.
Membership function of a triangular fuzzy number (TFN) (l,m,u).
The arithmetic of fuzzy numbers is based on the principles presented by Zadeh [66]. In practice, simplified fuzzy arithmetic is used, where the results of the basic mathematical operations of TFNs are TFNs. Let and be two TFNs. Then:
To represent the TFN with the best possible scalar value, one of the most commonly used defuzzification methods is the centre of gravity [67]:
which simplifies to for TFN (l,m,u).
4. Results
4.1. The Model for Evaluating the Cost Price of Wood Products
4.1.1. Resource and Capacity Cost Drivers
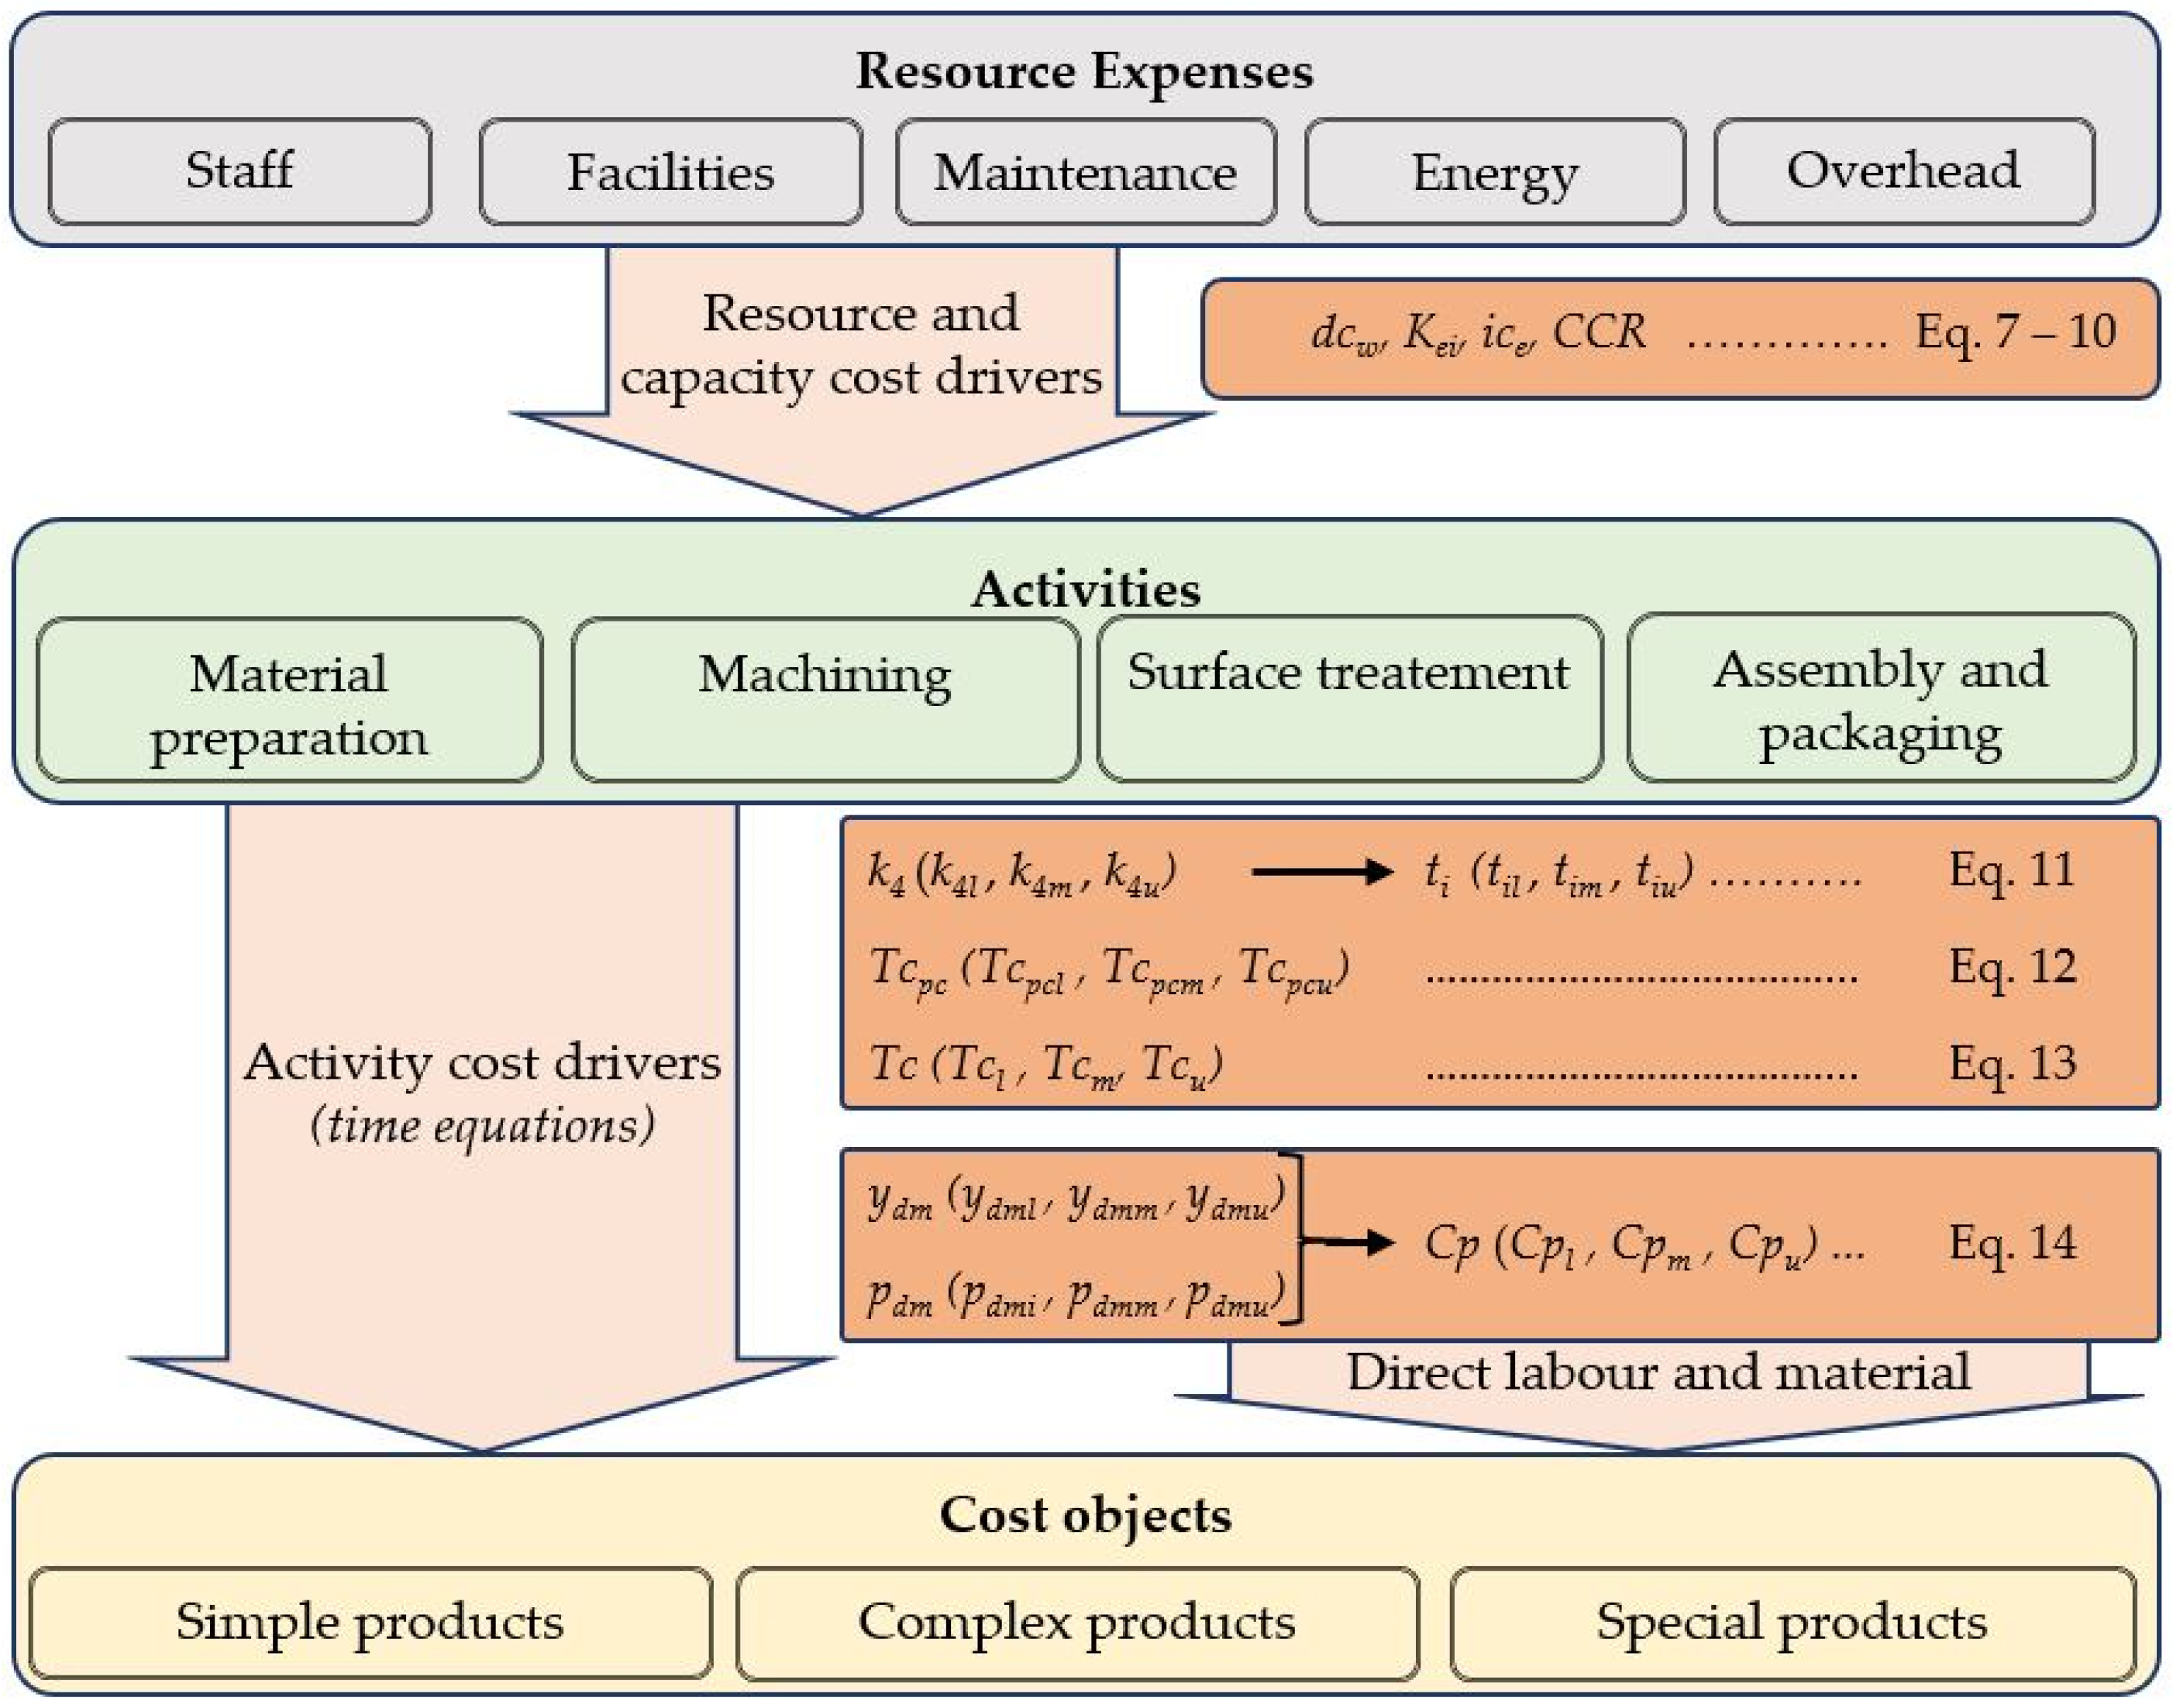
The most important resources for producing wood products from invasive non-native species are labour, equipment with maintenance and energy resources, and overhead costs (Figure 4). To determine the cost of these resources, we use the formulas described below. For overhead costs, we consider all internal transportation costs, other non-productive labour costs (purchase, development, sales, management, etc.), and costs related to the business premises (depreciation, insurance, heating, lighting, etc.), recommending about 2.5% for depreciation and 1.5% for other costs. The overhead costs refer to 80% of the longest activity time ti. For each activity, we calculate the capacity cost rate, total costs of the resources, and the total costs per unit.

Figure 4.
FTDABC model for wood products. Legend: ydm (ydml, ydmm, ydmu) and pdm (pdmi, pdmm, pdmu) are fuzzy values of yield (ydm) and price (pdm) of direct material; all other parameters in described in Equations (7)–(14).
After identifying the resources and activities, the estimation of total costs of each activity needs to be done, e.g., for staff costs, costs of equipment, and so on. For the staff costs per activity, the following equation was used (Equation (7))
with:
dcw … direct labour costs per activity (€/day)
wb … gross wage of an employee (€/month/employee)
pb … gross wage contributions (1 + %) (for Slovenia: 1.161)
m … number of paying months per year
wR … annual vacation allowance (€)
wt … reimbursement for transport and meals (€/day)
tw … number of working days per year (day/year) (for Slovenia: 220)
n … number of employees per activity
For an accurate calculation of the capacities for a single activity, we also need information about the available (time) capacity (of the worker) per day, calculated according to the following formula (Equation (8)):
with:
Kei … effective capacity (min/day)
ne … effective time per day (min/day) (for Slovenia: 450 min/day)
ω … time usage rate per day (breaks, etc.) (in our case: 90%)
The calculation of the cost of production equipment is based on the purchase value (PV) of the machine, estimated according to the given market conditions, plus the indirect operating costs of the machine (electricity, insurance, blades, sharpening, etc.). For the depreciation rate (DER) we have assumed 15%, for the other costs (koth) we have added 20%, and for the number of effective working days (te) of the machine operation we have assumed 250 days (Equation (9)):
with:
ice … indirect production cost (equipment) (€/day)
PV … purchase value of the equipment (€)
DER … depreciation rate for the equipment (%)
koth … coefficient of other costs (blades, sharpening, rent, electricity)
te … number of effective working days of the machine (days/year)
Then the calculation of the capacity cost rates (CCR) to evaluate the costs of using capacity per time unit should be done. This is calculated by adding the direct labour cost and the indirect production cost and dividing by the effective capacity (Equation (10)):
4.1.2. Activity Cost Drivers (Time Equations)
As we are interested in activity time drivers, time equations were used (see Equations (1) and (2)). There are many activities in the production of a product, and for easier processing we need to combine them into pools of activities that represent the production phase. Activities should also be grouped within the pool according to which machine the processing of individual product elements is running on (see Table 2). Production and other specifics of the wood product are reflected in time drivers and in the time equations. For each activity, the technology (means of work) and estimated number of workers are determined for the implementation of the activity. The required time, which is determined by the time equation, is influenced by many factors, which are determined by the size of the batch or number of identical elements, length of elements, and complexity of processed elements in these activities. Another important factor influencing the extension of time spent on activities is the variability of the material, which has a different impact on the implementation of an individual activity. The factors for individual activities may be different, while the variability of the material itself is conditioned by the quality of the wood: the higher the quality, the lower the variability. As wood of different quality, which cannot be explicitly determined, enters production, the variability is expressed by TFNs. Lastly, involving the factor of processing (machining) in relation to the wood species to the equation extends the applicability of this equation to other wood species. For each activity of the production cycle, the total activity time is calculated according to the following time equation (Equation (11)):
with:
ti … total activity time for the production cycle (min)
ßi0 … preparatory and final time for activity i (min)
βi1 … (base) unit time for activity i (min/unit)
Xi1 … number of processes for activity i
ki2 … coefficient of length for activity i
Xi2 … number of processes of longer elements for activity i
ki3 … coefficient of the complexity of processing for activity i
Xi3 … number of processes of complex elements for activity i
k4 … coefficient of material variability
ki5 … importance of the influence of material variability for activity i
ki6 … machinability coefficient according to the wood species for activity i
The preparatory and final time for a certain activity i (ßi0) is the time required to prepare the selected device to perform the activity and depends on the technological equipment level of the machine or working device, and on the organizational conditions of the work process. The preparatory and final time is independent of wood species and the size of the batch, assuming that the batch is done in one shift; otherwise, this must be taken into account. This has to be considered in activities that require additional preparation (e.g., preparation of glue, cleaning of application rollers). The time required for the production of an individual element (ßi1) is tied exclusively to the used technology or working tool and general processing (machining) standards for the production of simple elements up to 1 m in length. The specifics of the processed element in terms of dimensions, wood species, quality, and processing take into account the coefficient of length ki2, the coefficient of the complexity of processing ki3, the coefficient of material variability k4, and the importance of the influence of material variability ki5 and machinability coefficient ki6. All coefficients represent the addition to the base unit time ßi1. By introducing an additional length factor (ki2), the model can be used for different dimensions of products or elements, because larger (longer) elements may also require slightly longer manipulation, fastening, and processing times. The factor largely depends on the technological equipment and organizational arrangement of the plant. The coefficient can have values from 0 onwards, where 0 means that the length of the element does not exceed the assumed length. Factor 2 means that the processing time of the element is extended by two times. With the introduction of the coefficient ki3, a longer required time of an individual operation is enabled in the case of greater complexity, a larger number of operations, or setting additional aggregates or tools for processing a particular element. The coefficient ki3 can have values from 0 onwards, where 0 means that the processing is undemanding. Value 2 means that the processing time of the element is extended by two times due to the complexity. Material variability (k4 = (k4l, k4m, k4u)) represents variability in the quality of the input raw material. The coefficient values are represented by TFNs in the interval between 0 and 1. The value 0 is the best-assumed quality of the input raw material, and the affiliation is defined by taking into account the quantity of raw material used for each quality. The values of ki5 are between 0 and 1, where the value 0 means that for a certain activity the variability of the material does not affect the duration of this activity. A value of 1, however, means that variability in material quality has a large impact on the duration of the activity. Coefficient 6 (ki6) gives the complexity of machining according to the wood species for an individual operation or an individual method of processing (sawing, planing, milling, drilling, grinding…). The reference value of ki6, which is 1, refers to the processing of beech wood, which is the most commonly represented hardwood species in Slovenian forests. In case the wood species is more demanding for a certain machining activity, the factor increases accordingly (the maximum value is 1.5), or in the case of easier processing it decreases. The least demanding processing has a factor of 0.5.
Once the time for the activity is estimated and the unit cost of each resource is calculated, the cost of an individual event of an activity performed by the resource pool is calculated. Additionally, the total cost per unit is computed, including all costs of all activities and overhead costs for activities’ execution (Equations (12) and (13)).
with:
Tcpc… total activity time for the production cycle for activity i (€/production cycle)
CCRi… capacity cost rate for activity i (€/min)
ti… time consumed by activity i
n … number of activities for product production
OH … overhead costs of all activities (€)
with:
Tc… total cost per unit (€/product, unit)
Q … quantity of products per production cycle (unit/cycle)
4.1.3. Direct Material and Labour Costs
In calculating the material cost per product, we took into account the different yields of the different material grades and the uncertainty of the material price per m3. Therefore, yield and price were expressed by TFNs. Net material consumption was calculated based on the material list (wood and other materials). In the case of wood, we considered the yield from dry sawn wood to product. The yield was defined as TFNs, which was determined based on the difference in utilization rate due to differences in the quality of the input raw material. From this, we calculate the gross material consumption. As materials of different quality enter the production process, the price of the raw material is also different (TFNs). From the difference between gross and net wood consumption, we get the amount of residues. These residues are further divided into bulky residues (70%) and sawdust (30%). We assume that by selling these residues we reduce the material cost of the product and thus our cost price. For other materials, we have used the net quantities to calculate the cost.
4.1.4. Cost Price
Finally, the cost price is calculated by adding total costs per unit and the direct material and labour costs per product (Equation (14))
with:
Cp … cost price (€/product)
dcm … direct material and labour costs per product (€)
4.2. The Use of the Model for Calculating Cost Price in the Case of Dining Table
The model for calculating the cost price was used in the case of making a table (Figure 1) made of black locust wood, and for comparison the model was used for exactly the same product made of oak. By this comparison, we want to show the usability (universality) of the model, as it allows us to take into account all the specifics of the tree species used, as well as related technological features in the manufacture of simple or complex products.
Dried sawn wood of black locust of selected quality with an average width of 20 cm, thickness of 38 mm, and length of 4 m was used as the input raw material. The table is made with the technology used in the manufacture of similar complex products in wood processing plants. Stages of production or sub-activities are listed in Table 2.
In the research, the batch size was limited to 30 tables, which were made during one shift with the set production parameters. The batch size was determined by the quantity of black locust material available on the market of appropriate quality. Table 3 shows the CCR values, the values of the individual coefficients of the time equation (Equation (9)), and quantities of Xi1, Xi2, and Xi3 (depending on the batch size) for making black locust wood dining tables for this batch size for each sub-activity.
Table 3.
Values of CCR and other coefficients of the time equation for the production of dining tables from black locust wood.
In the model, the preparatory and final time ßi0 were estimated based on expert assessment, taking into account the technological parameters of the selected technology. For the sake of model simplicity, we combined activities on an individual machine for different elements in our case; e.g., CNC machine: plate, leg, and diameter processing activities (three different elements), and multiple preparations of the machine are given in the joint preparatory and final time. The time required for the production of one element (ßi1) was determined (calculated) taking into account the feed and machining parameters. The coefficient ki2 was taken into account only for elements longer than one meter (Xi2)), and the factors range from 0 to 2. The coefficient ki3 was evaluated for more complex operations/activities for elements that have more complex processing (Xi3)). Thus, ki3 amounts to machining on a CNC machine, where due to the machining of very different elements and consequently different machining (milling, drilling, bonding, etc.) there is an extension due to activation of additional aggregates, reattaching, etc., so the time of this activity is extended by a factor of 2 (expert assessment). The same factor also extends the surface treatment of the tabletop (oiling) [49], while the most demanding activity is repairing the surface defects (cracks, holes, …), which is extended by a factor of 3.
The variability of the input raw material, which indicates the presence of cramps, cracks, stains, reaction wood, or differences in density and humidity, can be considerable, which is taken into account by the coefficient k4. This variability varies between wood species but also varies according to the structure of the raw material inputs in terms of quality, so the values of this coefficient can vary greatly. Uncertainty is represented by TFN (0.1, 0.24, 0.48); this means that the lower bound is 0.1, the upper bound is 0.48 and the most promising value is 0.24. The variability of the material has different influences on different activities; it has a very large influence on some activities (the value of the coefficient is ki5 = 1) and does not affect others (ki5 = 0).
During the production of the dining table, we performed various types of mechanical processing in individual activities, which was influenced by both the tree species and the variability of the material. The value of the coefficient ki6, which refers to the complexity of processing in relation to the wood type, was determined for each type of mechanical process (sawing, milling, planing, drilling, grinding, surface treatment) based on data from the literature [4,49,56] and expert assessments.
As a result of the time equation and CCR value, we calculated a TC in which we took into account all costs of all activities, including overhead costs (other non-production costs, space and transport costs), in which we took 80% of the longest activity rounded up to 10 min. The value of TC expressed as TFN is EUR (47.11, 50.42, 55.68).
To calculate the cost price of the product, we also need dcm, which we calculated directly per product. We took into account the net material consumption based on the material list, processing yield, and the price of the input raw material. The final value also took into account the value of residues that reduce the product’s cost price. The quantitative yield has an extremely large impact on the product’s cost price, and it depends on many factors, primarily on the quality of the input raw material. Given that the input raw material (both price as well as availability and quality) is directly dependent on market conditions, i.e., supply and demand, and is therefore uncertain, its expression with TFN is meaningful and has a fuzzy value EUR (290, 650, 1100)/m3.
The yield from input raw material (in our case it is dried sawn wood) to the product largely depends on the quality of raw material, the required quality of the final product, and the selected technological process. Variability in the quality of the input raw material is high, as we do not have enough high-quality black locust wood available (see Section 3.1). Our product (dining table) can be made from different qualities of input raw materials, which further increases this variability, and at the same time has a strong impact on yield. The value of yield expressed as TFN is (12.0, 28.9, 53.5)%.
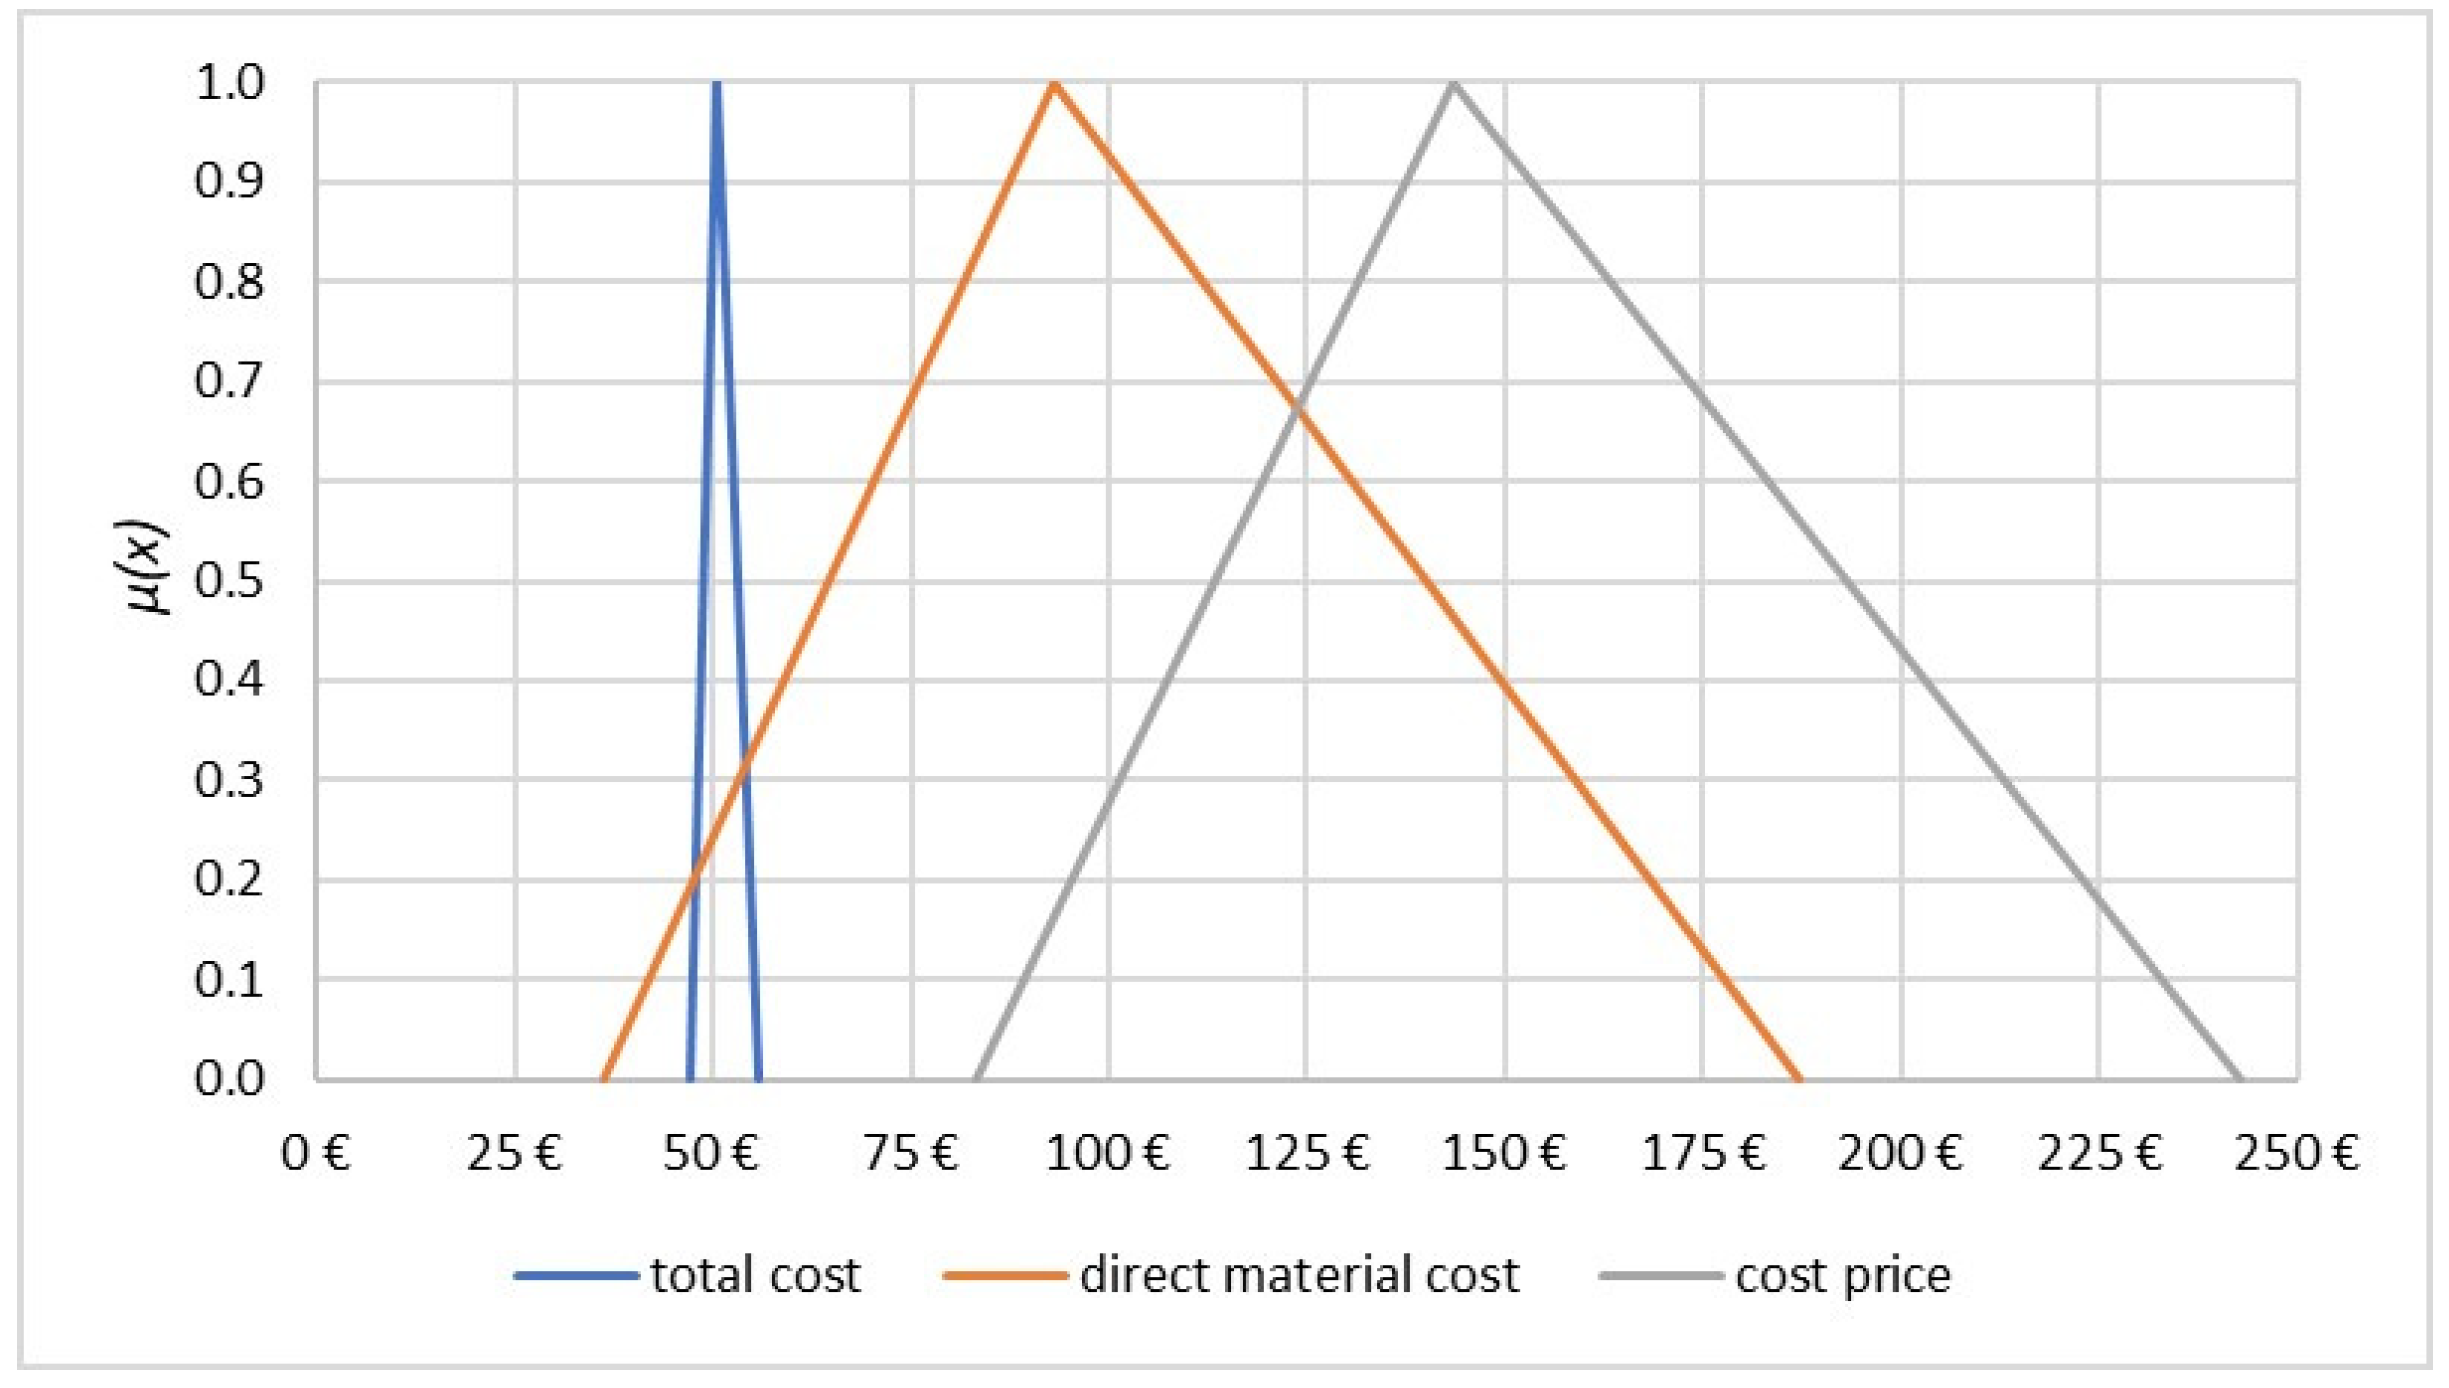
The cost price of a table made of black locust wood, which includes all unit costs of the product, is EUR (83.45, 143.64, 242.93) and is, as with some of the input parameters in these calculations, also shown as a TFN. This TFN can be expressed as a defuzzified scalar value of EUR 156.68 (Equation (6)). As can be seen from the figure below (Figure 5), the direct material cost has the greatest impact on the cost price, which is most dependent on the price of the input raw material and the achieved yield. Both parameters show great variability. In the structure of the cost price, the material cost represents 67.4% and the total cost 32.6%.
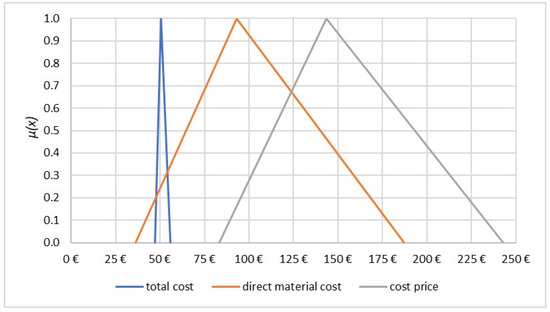
Figure 5.
Membership functions of TFNs of cost price, total cost, and direct material cost of a dining table made of black locust wood.
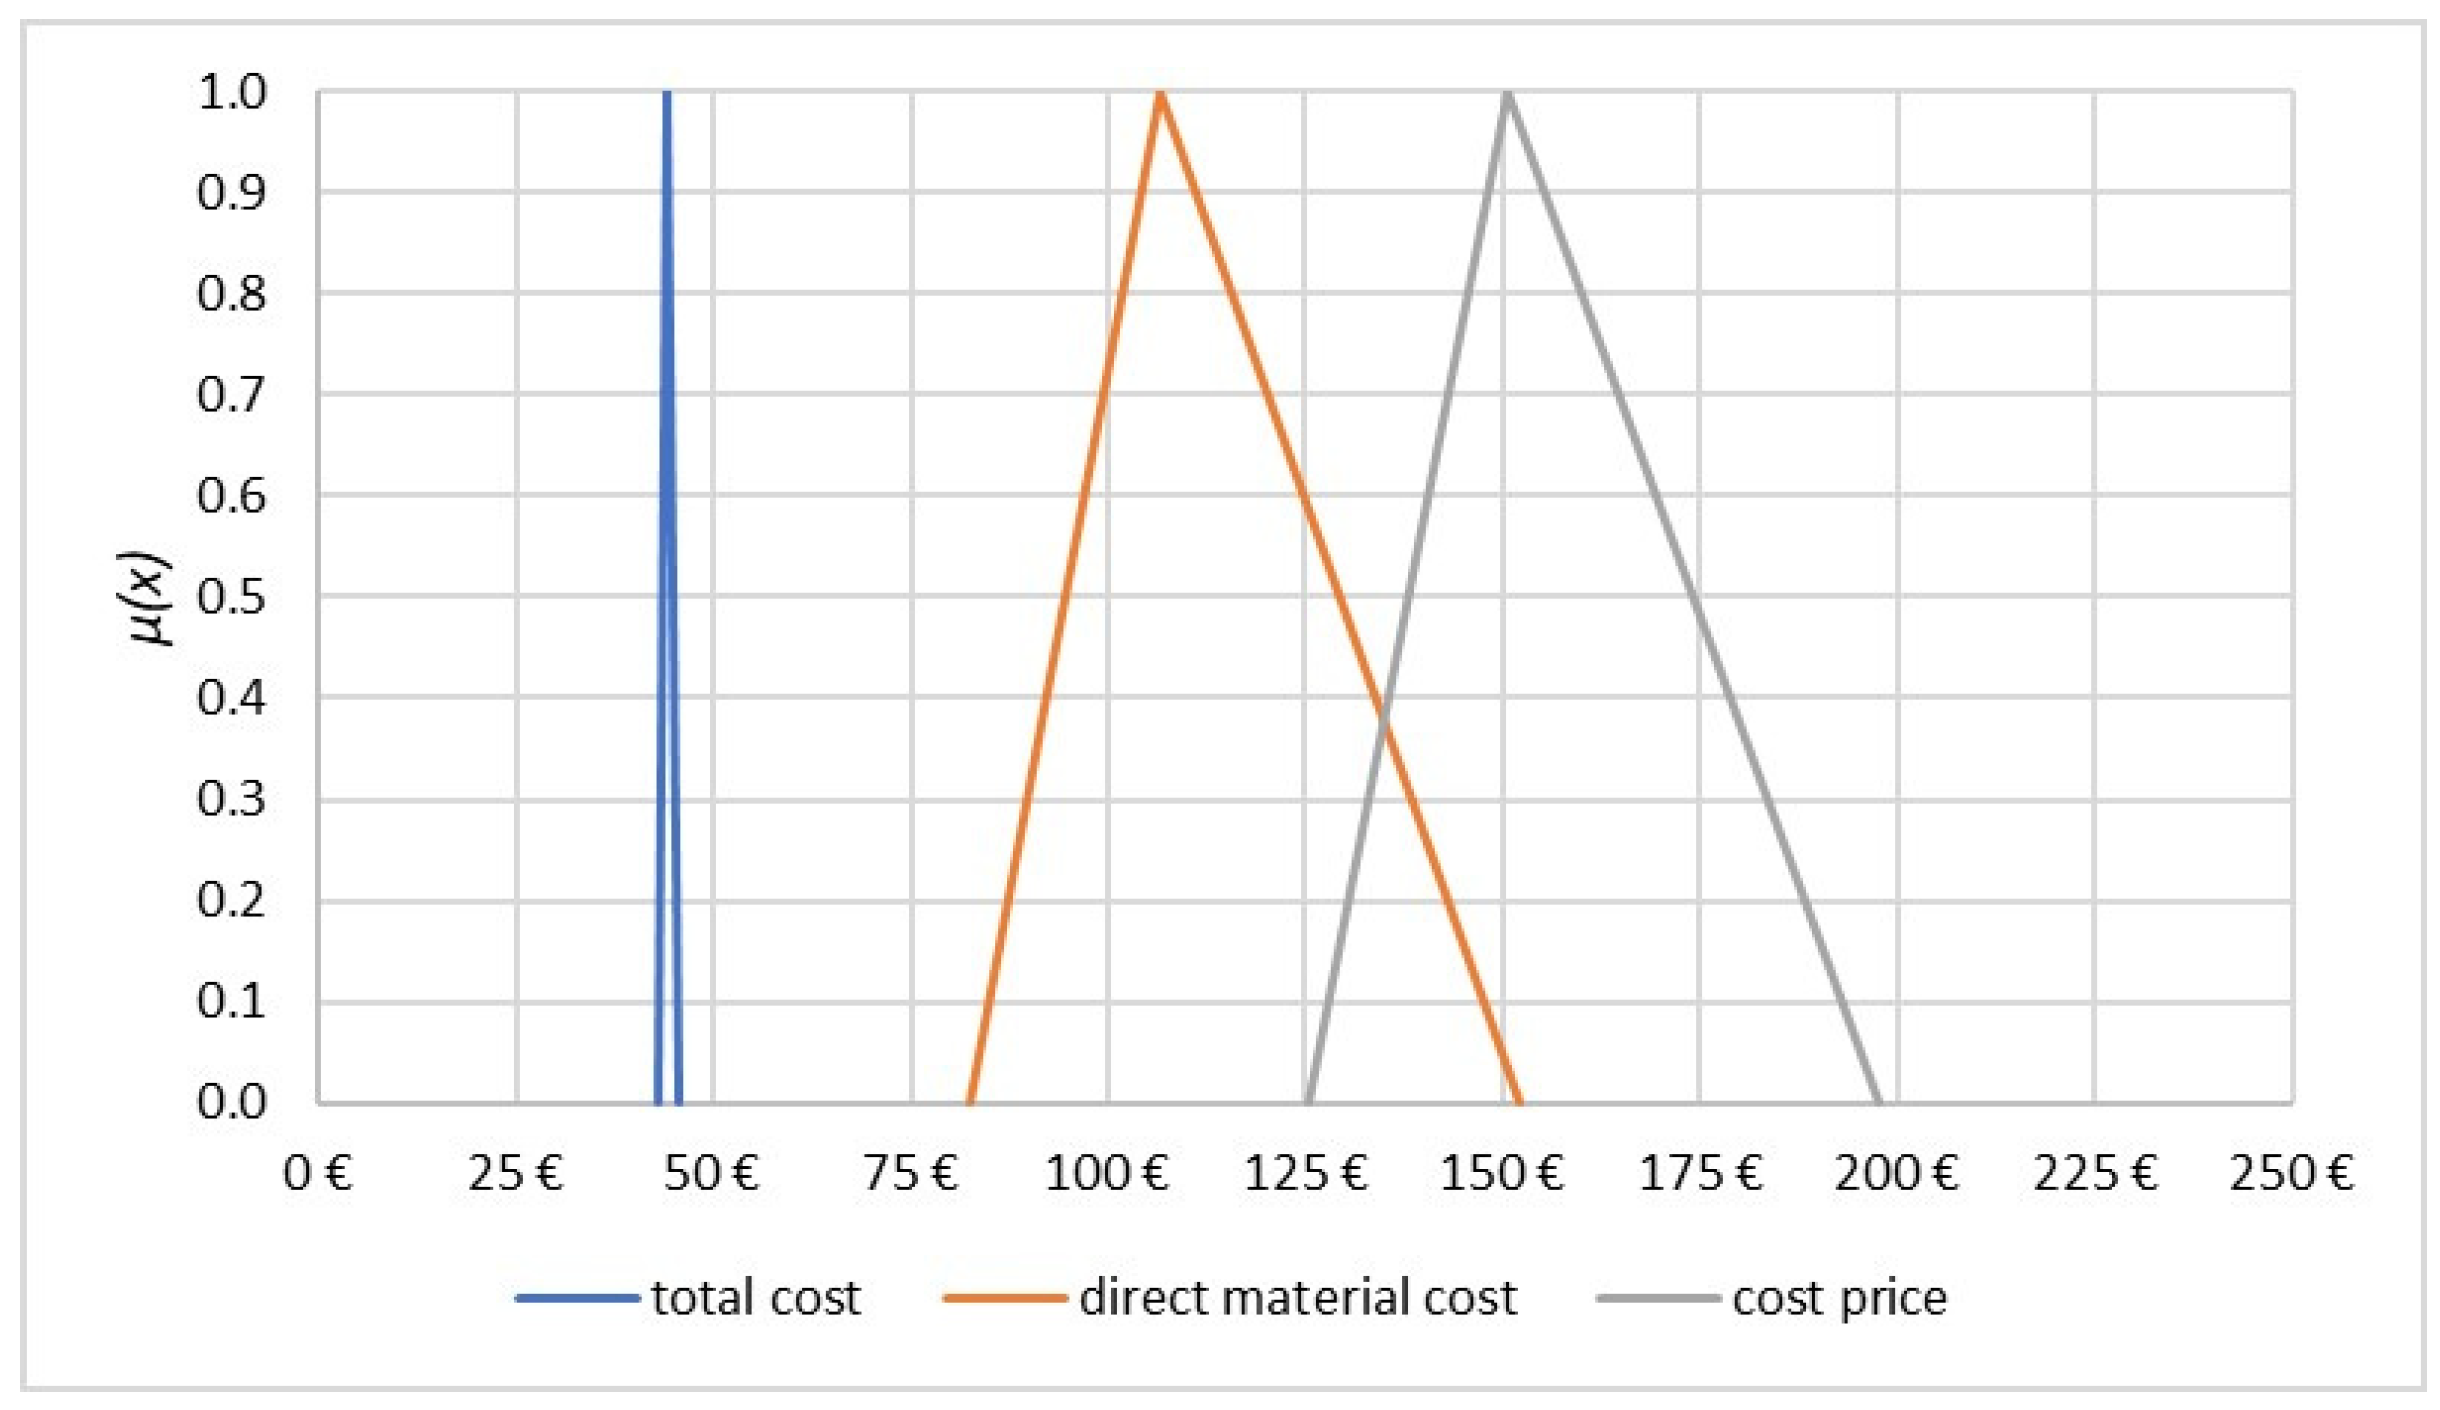
For comparison, cost prices for the same products (tables) made of oak were also calculated. Since the availability of dried oak wood on the market is unproblematic, it was assumed that the table is made of the average quality sawn wood. In this case, the variability of the material is lower k4 = (0.05, 0.10, 0.18). In both tree species, the qualities of workability are quite comparable [45], but there are differences in the complexity of mechanical processing. In the structure of the cost price of a table made of oak, the cost of material (where the highest cost is the input raw material) is 72.0%, while the cost of labour is 28.0%. The calculated cost price expressed with TFN is EUR (125.37, 150.45, 197.65) and its defuzzified scalar value is EUR 157.83 (Figure 6).
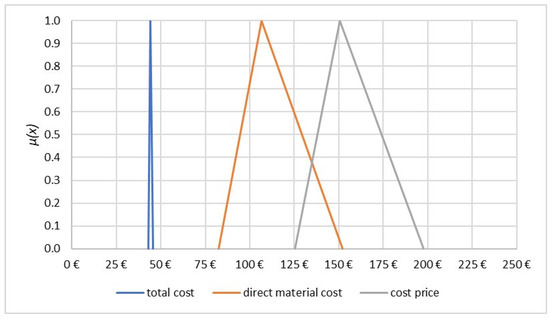
Figure 6.
Membership functions of TFNs of cost price, total cost, and direct material cost of dining table made of oak wood.
In the case of a poorer (but cheaper) raw material being used for this product, a larger amount of input raw material would be required due to lower quantity yield. This would lead to increased labour volume and thus labour costs, which would negatively affect the product’s cost price. In the case of using oak of poor quality the cost price would be expressed with TFN EUR (136.69, 182.47, 240.86), and its defuzzified scalar value is EUR 186.68.
5. Discussion
The available timber volumes of invasive tree species are virtually unknown because, unlike traditional native tree species, their prevalence is not systematically monitored [64]. The lack of data on the available quantities of wood from invasive tree species limits the possibility of exploiting this potential resource in an efficient and economically viable manner, as the possible unavailability of the raw material certainly represents a certain business risk for the producer. For these reasons, the producer will not decide to use wood from invasive tree species, especially if he has a sufficient amount of suitable wood from traditional wood species. This supports hypothesis 1.
In recent years, the problem of the occurrence of invasive tree species has been addressed by several projects (e.g., Applause [68], LIFE ARTEMIS [69], etc.), that have investigated potential areas of use. The quantities of invasive tree species suitable for (industrial) use are limited, which is also reflected in the market, as the supply is very limited in terms of quality and dimensions. In the production of the selected product (dining table), we took into account the fact that the quantity of black locust sawn wood is limited, so there were no requirements for the selected quality class. Taking into account the “Grading rules for unedged sawn timber EOS-Standard” [70], we divided the available sawn timber by quality into A-Quality (good), B-Quality (average), C-Quality (poor). The availability proportions of the sawn timber classes were estimated based on the results of the survey conducted by Marenče [70] for beech. We took into account that in beech the presence of red heartwood has a great influence on the classification of the lumber quality class, while in black lotus heartwood sapwood and decay may be present to a similar extent [42], which lowers the quality. For these reasons, we did not change the quantitative relationships between quality classes. Thus, we assumed that the proportions of black locust wood available for production are: C-quality is 70%, B-quality is 22% and A-quality is 8%. With such quality of input raw material, we obtain lower volume yield, but since the price of input material is lower, it affects the cost price of the product. When the quality of the input raw material is lower, more care is required in the production process and the production time is longer which is reflected in the labour cost. Due to the availability of sawn oak, we selected dry-sawn boards of average quality (classes Q-S 1 and Q-S2 [71]). Prices were obtained from local suppliers of sawn timber. As can be seen from the results, when oak is used the variability of its cost price is lower due to the better predictability of raw material quality and price, confirming the hypothesis that knowledge of raw material quantities and qualities would allow an easier and more reliable decision on the profitability of the product.
In developing a model for calculating the cost price of wood products from invasive tree species, we looked for a method that would take into account all the specifics of the input raw material in terms of its characteristics, available quantities, and the specifics of the technological processing process, while allowing the model to be flexible for different products, tree species, and market conditions. Standard calculation methods have many disadvantages, which are eliminated by the ABC method, which introduces an allocation of indirect costs to cost drivers, i.e., activities. However, since the production capacity will not be fully utilized in this production, we have chosen the Time-driven ABC method, whose main driver is a time-equation. It is time that has a decisive influence on the final values of the cost of the activity carried out for a given product. By changing the time, we can greatly influence the cost of the activity and also the cost price. Therefore, in the time- equation we have considered six different coefficients that cover all the important factors that affect the cost of carrying out each activity and take into account all the specificities that arise from the characteristics of wood as input material. We took into account the factor of the length of the elements, the complexity and intricacy of the production, the variability of the material, and the workability depending on the tree species used. In this way, the usefulness of the model for evaluating the cost price of a wide variety of wood products was achieved. However, since the values of all parameters used to calculate the cost price are not precisely determined for various reasons, we also introduced fuzzy logic into the model, i.e., the Fuzzy Time-driven ABC method. This introduced the possibility of determining an interval of values for certain parameters whose values are not precisely known or change rapidly and depend on external causes (e.g., market conditions). Apart from the cost of carrying out the activities, the cost of materials has the greatest impact on the cost of these products, as they are highly variable, especially in the case of non-native wood species. This variability is reflected on the one hand in the performance of certain production activities and, on the other hand in the yield rates and the price of the input material. All these parameters are represented in the model with fuzzy values. Our results thus support hypothesis 2, that using the Fuzzy Time-driven ABC method makes it possible to develop a complex model for calculating the cost prices of products from invasive species, which takes into account all the peculiarities of this material and its processing.
We have found that the cost price of a table made of black locust wood is almost the same as that of a table made of oak wood (less than 1% difference), which rejects hypothesis 3. The selected tree species have some comparable mechanical and physical properties (Table 1) and machining properties [4,46]. This proves the usefulness of the model for comparisons as well as the potentially high economic value of using wood from invasive tree species in innovative products. Since this solves the environmental problem of invasive tree species, this model can also demonstrate the high economic value of this wood. The differences lie in the width of the supports of the TFNs, which express the variability and uncertainty of the cost price. In particular we would like to point out the aesthetic value of products made from non-native wood species. Aesthetics is the aspect of design and technology most closely related to art, and colour, shape, texture, contrast, form, balance, cultural references, and emotional response are common to both areas [72]. Beauty does not come from the shape alone, but from the multiplicity of impressions, sensations, and emotions that the shape leads us to discover [73,74]. When wood from invasive species is used to make products, the use of these harmful species adds value to these products by directly contributing to the care of the environment and the conservation of biodiversity. Promoting the use of black locust wood for products will increase interest in the (more efficient) management of invasive tree species, which would help to manage and use them efficiently and consequently have a positive impact on containing their spread in forests.
6. Conclusions
Given the fact that invasive tree species are present on an increasing scale, in addition to the strategy of limiting their spread it is also necessary to develop a strategy of economically feasible use of wood of these tree species. In recent years, we have been aware of this problem and are looking for various possibilities of its use in the wood processing industry as well as in other industries (paper, chemical, etc.). The wood of invasive tree species represents economic potential, and the added value can be very high given the high aesthetic value of such wood. By using non-native wood species with the support of our knowledge and artistic vision we can create aesthetically designed, innovative products that people enjoy using. The use of invasive tree species instead of traditional wood species (e.g., oak) for certain products can have positive effects not only from the point of view of preserving traditional tree species, but can also encourage more efficient management of invasive tree species, which further contributes to their effective handling and use.
For this purpose, a model for calculating the cost price of invasive wood products has been developed, which enables a relatively quick assessment of the economic feasibility of the use of a certain invasive tree species for a certain product. The model is complex and allows adaptation for a wide variety of products that require different (production) activities to produce them. In addition, it makes it possible to take into account the availability of the input raw material and its mechanical, physical, and processing properties, as well as all variable parameters that affect the product’s cost price, and thus the economic feasibility of such use. These variable parameters include (variable) characteristics of the input of raw material, which affect the processing characteristics and the impact of the current market situation, which is mainly reflected in the price and quality of the input raw material. The model includes fuzzy logic that allows these variabilities to be considered. The model was developed and used to make a dining table from black locus wood, an invasive tree species that is comparable to oak in certain (mechanical, physical, and processing) properties. We found that the most promising cost price of the selected product (dining table) made from the estimated (potentially) available black locust raw material of average quality is comparable to the cost price of the same product made with the same technology and using average quality oak wood. This means that products from invasive tree species can be an alternative to products from conventional tree species, with products from invasive tree species having an attractive appearance due to the visual properties of this wood, and therefore able to be sold even at a higher price, thus achieving higher added value. At the same time, this would help solve the environmental problem of invasive tree species.
The conclusions of this study are as follows:
- The proposed model for calculating the cost price of invasive wood products enables the consideration of all variable factors (price of input raw material, variability in quality and related efficiencies, and processing procedures). However, the variability of input raw material parameters has a large impact on the product’s cost price.
- The model can be used for any tree species with known properties and for any simple/complex product and/or technology, and any size of series. The model allows a quick assessment of the economic feasibility for the use of a particular (invasive) tree species for a particular product.
- Invasive wood has high economic potential.
For further research, it would be interesting to use the model for other invasive tree species, mostly found in parks (e.g., Gleditsia triacanthos, etc.), whose physical and mechanical properties are known (Table 1), but which are mostly used on a very small scale. In addition, it would be interesting to extend the model by calculating the added value in the product, which is crucial for business decisions and can be very high in the case of using wood from invasive tree species due to the aesthetic effect.
Author Contributions
Conceptualization, J.K., M.J. and D.G.B.; investigation, J.K., M.J., M.M. and D.G.B.; methodology, J.K., P.G., and M.J.; validation, J.K., M.J., P.G. and D.G.B.; formal analysis, J.K., M.J., P.G. and D.G.B.; resources, J.K., M.J., P.G., M.K. and M.M.; data curation, J.K., M.J., P.G. and D.G.B.; writing—original draft preparation, J.K.; writing—review and editing, J.K., M.J., P.G., M.K.K., M.K., M.M. and D.G.B.; visualization, M.J., M.K.K. and M.K. All authors have read and agreed to the published version of the manuscript.
Funding
The research was supported by the Programs P4-0015 and P4-0059, co-financed by the Slovenian Research Agency, LesGoBio V4-2016 project financed by the Slovenian Research Agency addressing and the Ministry of Agriculture, Forestry and Food and APPLAUSE (UIA02-228) project, co-financed by the European Regional Development Fund through the Urban Innovative Actions Initiative [68].
Institutional Review Board Statement
Not applicable.
Informed Consent Statement
Not applicable.
Data Availability Statement
The entire set of raw data presented in this study is available on request from the corresponding author.
Acknowledgments
Many thanks to Luka Goropečnik for many useful tips and Paul Steed for linguistic support and proofreading.
Conflicts of Interest
The authors declare no conflict of interest.
References
- Gorišek, Ž.; Plavčak, D.; Straže, A.; Merela, M. Tehnološke lastnosti in uporabnost lesa velikega pajesena v primerjavi z lesom velikega jesena. Les/Wood 2018, 67, 29–44. [Google Scholar] [CrossRef] [Green Version]
- Horvat, M.; Iskra, J.; Pavlič, M.; Žigon, J.; Merela, M. Barvila za les iz tujerodnih invazivnih rastlin. Les/Wood 2020, 69, 37–48. [Google Scholar] [CrossRef]
- Merela, M.; Thaler, N.; Balzano, A.; Plavčak, D. Optimal Surface Preparation for Wood Anatomy Research of Invasive Species by Scanning Electron Microscopy. Drv. Ind. 2020, 71, 117–127. [Google Scholar] [CrossRef]
- Merhar, M.; Gornik Bučar, D.; Merela, M. Machinability Research of the Most Common Invasive Tree Species in Slovenia. Forests 2020, 11, 752. [Google Scholar] [CrossRef]
- Plavčak, D.; Gorišek, Ž.; Straže, A.; Merela, M. Drying characteristics of wood of invasive tree species growing in an urban environment. Les/Wood 2019, 68, 31–43. [Google Scholar] [CrossRef] [Green Version]
- Vek, V.; Vivod, B.; Poljanšek, I.; Oven, P. Vsebnost ekstraktivov v skorji in lesu robinije (Robinia pseudoacacia L.). Acta Silvae Ligni 2019, 119, 13–25. [Google Scholar] [CrossRef] [Green Version]
- Medved, S.; Tomec, D.K.; Balzano, A.; Merela, M. Alien Wood Species as a Resource for Wood-Plastic Composites. Appl. Sci. 2020, 11, 44. [Google Scholar] [CrossRef]
- Gornik Bučar, D.; Prislan, P.; Smolnikar, P.; Stare, D.; Krajnc, N.; Gospodarič, B. Uporabnost lesnih ostankov tujerodnih invazivnih drevesnih vrst za proizvodnjo peletov. Les/Wood 2021, 70, 45–58. [Google Scholar] [CrossRef]
- RoAenbergar, D.; Nagel, T.A.; Urbas, B.; Marion, L.; Brus, R. Nekateri ukrepi za omejevanje širjenja visokega pajesena (Ailanthus altissima (Mill.) Swingle) in smernice za gozdnogojitveno ukrepanje ob vdoru potencialno invazivnih tujerodnih drevesnih vrst v ohranjene gozdove v Sloveniji. Gozdarski Vestn. 2017, 1, 3–20. [Google Scholar]
- Weidenhamer, J.D.; Callaway, R.M. Direct and Indirect Effects of Invasive Plants on Soil Chemistry and Ecosystem Function. J. Chem. Ecol. 2010, 36, 59–69. [Google Scholar] [CrossRef]
- Kropvšek, J.; Jost, M.; Grošelj, P.; Motik, D.; Pirc Barčić, A.; Perić, I. A comparative evaluation of operational efficiency of wood industry using data envelopment analysis and Malmquist productivity index. Drv. Ind. 2019, 70, 287–298. [Google Scholar] [CrossRef] [Green Version]
- Kropvšek, J.; Grošelj, P. Long-term Financial Analysis of the Slovenian Wood Industry Using DEA. Drv. Ind. 2019, 70, 61–70. [Google Scholar] [CrossRef] [Green Version]
- Eckelman, C.A. Textbook of Product Engineering and Strength Design of Furniture; Purdue University: West Lafayette, IN, USA, 2003; pp. 65–67. [Google Scholar]
- Smardzewski, J. Furniture Design; Springer: Berlin/Heidelberg, Germany, 2015; pp. 1–649. [Google Scholar] [CrossRef]
- Sun, W.; Zhang, L. Innovative Research on the Design Concept of Green Furniture Products. In Proceedings of the 2019 International Conference on Management, Education Technology and Economics (ICMETE 2019), Kyoto, Japan, 26–28 December 2019; Volume 82, pp. 113–116. [Google Scholar]
- Papadopoulos, I.; Karagouni, G.; Trigkas, M.; Beltsiou, Z. Mainstreaming green product strategies why and how furniture companies integrate environmental sustainability? EuroMed J. Bus. 2014, 9, 293–317. [Google Scholar] [CrossRef]
- McGowan, A.S.; Holmes, S.A.; Martin, M. The Association between Activity-Based Costing System Adoption and Hospital Performance. SSRN Electron. J. 2006. [Google Scholar] [CrossRef]
- Hanid, M.; Koskela, L.; Siriwardena, M. Traditional Cost Management vs. Lean Cost Management. In Proceedings of the 18th CIB World Building Congress, Salford, UK, 14 May 2010. [Google Scholar]
- Tsai, W.-H.; Lai, S.-Y. Green Production Planning and Control Model with ABC under Industry 4.0 for the Paper Industry. Sustainability 2018, 10, 2932. [Google Scholar] [CrossRef] [Green Version]
- Wedowati, E.R.; Singgih, M.L.; Gunarta, I.K. Product value analysis on customized product based on pleasurable design and time-driven activity-based costing in food industry. Cogent Bus. Manag. 2020, 7, 1823581. [Google Scholar] [CrossRef]
- Afonso, P.S.L.P.; Santana, A. Application of the TDABC model in the logistics process using different capacity cost rates. J. Ind. Eng. Manag. 2016, 9, 1003. [Google Scholar] [CrossRef] [Green Version]
- Ganorkar, A.B.; Lakhe, R.R.; Agrawal, K.N. Implementation of TDABC in SME: A Case Study. J. Corp. Account. Financ. 2018, 29, 87–113. [Google Scholar] [CrossRef]
- Adigüzel, H.; Floros, M. Capacity utilization analysis through time-driven ABC in a small-sized manufacturing company. Int. J. Prod. Perform. Manag. 2019, 69, 192–216. [Google Scholar] [CrossRef]
- Andersch, A.; Buehlmann, U.; Palmer, J.; Wiedenbeck, J.K.; Lawser, S. Product costing program for wood component manu-facturers. For. Prod. J. 2013, 63, 247–256. [Google Scholar]
- Mohsin, N.M.R.; Al-Bayati, H.A.M.; Oleiwi, Z.H. Product-Mix Decision Using Lean Production and Activity-Based Costing: An Integrated Model. J. Asian Financ. Econ. Bus. 2021, 8, 517–527. [Google Scholar] [CrossRef]
- Korpunen, H.; Mochan, S.; Uusitalo, J. An Activity-Based Costing Method for Sawmilling. For. Prod. J. 2010, 60, 420–431. [Google Scholar] [CrossRef]
- Pongwasit, R.; Chompu-Inwai, R. Analysis of Wooden Toy Manufacturing Costs through the Application of a Time-Driven Activity-Based Costing System. Muroran Inst. Technol. Acad. Resour. Arch. 2015, 65, 7–14. [Google Scholar]
- Rajnoha, R.; Chromjakova, F. Activity based costing and efficiency of its application in the wooden houses production. Drew.-Wood 2009, 52, 105–127. [Google Scholar]
- Rappold, P.M. Activity-Based Product Costing in a Hardwood Sawmill through the Use of Discrete-Event Simulation; Virginia Tech: Blacksburg, VA, USA, 2006. [Google Scholar]
- Kaplan, R.S.; Anderson, S.R. Time-Driven Activity-Based Costing. SSRN Electron. J. 2003. [Google Scholar] [CrossRef]
- Kaplan, S.R.; Anderson, R.S. Time-Driven Activity-Based Costing: A Simpler and More Powerful Path to Higher Profits; Harvard Business School Press: Boston, MA, USA, 2007; ISBN 9781422101711. [Google Scholar]
- Maiga, A.S.; Jacobs, F.A. Extent of ABC Use and Its Consequences. Contemp. Account. Res. 2008, 25, 533–566. [Google Scholar] [CrossRef]
- Namazi, M. Time Driven Activity Based Costing: Theory, Applications and Limitations. Iran. J. Manag. Stud 2016, 9, 457–482. [Google Scholar]
- Siguenza-Guzman, L.; Van den Abbeele, A.; Vandewalle, J.; Verhaaren, H.; Cattrysse, D. Recent Evolutions in Costing Systems: A Literature Review of Time-Driven Activity-Based Costing. Rev. Bus. Econ. Lit. 2013, 58, 34–64. [Google Scholar]
- Chansaad, A.; Rattanamanee, W.; Chaiprapat, A.; Yenradee, P. A fuzzy time-driven activity-based costing model in an un-certain manufacturing environment. In Proceedings of the Asia Pacific Industrial Engineering and Management Systems Conference, Phuket, Thailand, 2–5 December 2012; pp. 1949–1959. [Google Scholar]
- Esmalifalak, H.; Albin, M.S.; Behzadpoor, M. A comparative study on the activity based costing systems: Traditional, fuzzy and Monte Carlo approaches. Health Policy Technol. 2015, 4, 58–67. [Google Scholar] [CrossRef]
- Mwaikambo, E.; Rajabifard, A.; Hagai, M. Modelling cost estimation for accessing spatial data using fuzzy logic and time-driven activity based costing in the context of an NSDI. J. Spat. Sci. 2014, 60, 137–151. [Google Scholar] [CrossRef]
- Ostadi, B.; Daloie, R.M.; Sepehri, M.M. A combined modelling of fuzzy logic and Time-Driven Activity-based Costing (TDABC) for hospital services costing under uncertainty. J. Biomed. Inform. 2019, 89, 11–28. [Google Scholar] [CrossRef]
- Mortaji, S.T.H.; Bagherpour, M.; Mazdeh, M.M. Fuzzy Time-Driven Activity-Based Costing. Eng. Manag. J. 2013, 25, 63–73. [Google Scholar] [CrossRef]
- Vítková, M.; Müllerová, J.; Sádlo, J.; Pergl, J.; Pyšek, P. Black locust (Robinia pseudoacacia) beloved and despised: A story of an invasive tree in Central Europe. For. Ecol. Manag. 2017, 384, 287–302. [Google Scholar] [CrossRef]
- Vasiliki, K.; Ioannis, B. Bondability of Black locust (Robinia pseudoacacia) and Beech wood (Fagus sylvatica) with polyvinyl acetate and polyurethane adhesives. Maderas. Cienc. Y Tecnol. 2017, 19, 87–94. [Google Scholar] [CrossRef] [Green Version]
- Kadunc, A. Growth and Yield Characteristics of Black Locust (Robinia pseudoacacia L.) in Slovenia. Gozdarski Vestn. 2016, 2, 73–87. [Google Scholar]
- Dünisch, O.; Richter, H.-G.; Koch, G. Wood properties of juvenile and mature heartwood in Robinia pseudoacacia L. Wood Sci. Technol. 2010, 44, 301–313. [Google Scholar] [CrossRef]
- Roswel, D.; Sonderman, L.; Everette, D. Defects in Hardwood Timber; US Department of Agriculture, Forest Service: Honolulu, HI, USA, 1989; Volume 678, p. 93.
- Boleslaw, P.; Andrej, D.; Grzegorz, W. Cutting Force during the Turning of Wood from Black Locust |Porankiewicz| BioResources. Available online: https://ojs.cnr.ncsu.edu/index.php/BioRes/article/view/BioRes_03_3_0745_Porankiewicz_DW_TuringForce_CuttingBlackLocust/219 (accessed on 16 September 2021).
- Usta, I.; Demirci, S.; Kiliç, Y. Comparison of surface roughness of Locust acacia (Robinia pseudoacacia L.) and European oak (Quercus petraea (Mattu.) Lieble.) in terms of the preparative process by planing. Build. Environ. 2007, 42, 2988–2992. [Google Scholar] [CrossRef]
- Merela, M. 3D Model of Quercus. Available online: https://sketchfab.com/3d-models/quercus-sp-oak-hrast-1fba20f5307e471a80def6483af30a50 (accessed on 28 September 2021).
- Merela, M. 3D Model of Robinia Pseudoacacia. Available online: https://sketchfab.com/3d-models/robinia-pseudoacacia-black-locust-1-8e830010316b4d8093fb53b048cd8667 (accessed on 28 September 2021).
- Pavlič, M.; Žigon, J.; Petrič, M. Wood Surface Finishing of Selected Invasive Tree Species. Drv. Ind. 2020, 71, 271–280. [Google Scholar] [CrossRef]
- Magel, E.A.; Drouet, A.; Claudot, A.C.; Ziegler, H. Formation of heartwood substances in the stem of Robinia pseudoacacia L. Trees 1991, 5, 203–207. [Google Scholar] [CrossRef]
- Vek, V.; Poljanšek, I.; Oven, P. Efficiency of three conventional methods for extraction of dihydrorobinetin and robinetin from wood of black locust. Eur. J. Wood Wood Prod. 2019, 77, 891–901. [Google Scholar] [CrossRef]
- Straže, A.; Novak, K.; Gorišek, Ž.; Čufar, K.; Merela, M. Tehnološke lastnosti lesa izbranih tujerodnih drevesnih vrst in njihov pomen. In Tujerodne Drevesne Vrste V Slovenskih Gozdovih; Jarni, K., Ed.; Univerza v Ljubljani: Ljubljana, Slovenija, 2021; pp. 9–18. [Google Scholar]
- Gorišek, Ž.; Plavčak, D.; Gornik Bučar, D.; Merela, M.; Čufar, K.; Straže, A. Fizikalne in mehanske lastnosti svežega in osušenega lesa v bukovih deblih, izruvanih med žledolomom. Acta Silvae Ligni 2017, 112, 7–20. [Google Scholar] [CrossRef] [Green Version]
- Kovryga, A.; Gamarra, J.O.C.; Van De Kuilen, J.W.G. Strength and stiffness predictions with focus on different acoustic measurement methods. Eur. J. Wood Wood Prod. 2020, 78, 941–949. [Google Scholar] [CrossRef]
- Sonderegger, W.; Martienssen, A.; Nitsche, C.; Ozyhar, T.; Kaliske, M.; Niemz, P. Investigations on the physical and mechanical behaviour of sycamore maple (Acer pseudoplatanus L.). Eur. J. Wood Wood Prod. 2013, 71, 91–99. [Google Scholar] [CrossRef] [Green Version]
- Wagenführ, R.H. München: Fachbuchverlag Leipzig im Carl Hanser Verlag. 2007. Available online: https://plus.si.cobiss.net/opac7/bib/142779#full (accessed on 29 October 2021).
- Zhu, J.; Shi, Y.; Fang, L.; Liu, X.; Ji, C. Patterns and determinants of wood physical and mechanical properties across major tree species in China. Sci. China Life Sci. 2015, 58, 602–612. [Google Scholar] [CrossRef] [PubMed]
- Ewudzie, J.; Gemadzie, J.; Adjarko, H. Exploring the Utilization of Lesser-Known Species for Furniture Production—A Case Study in the Western Region, Ghana. OALib 2018, 05, 88468. [Google Scholar] [CrossRef]
- Ramage, M.H.; Burridge, H.; Busse-Wicher, M.; Fereday, G.; Reynolds, T.; Shah, D.; Wu, G.; Yu, L.; Fleming, P.; Densley-Tingley, D.; et al. The wood from the trees: The use of timber in construction. Renew. Sustain. Energy Rev. 2017, 68, 333–359. [Google Scholar] [CrossRef]
- Dalci, I.; Tanis, V.; Kosan, L. Customer profitability analysis with time-driven activity-based costing: A case study in a hotel. Int. J. Contemp. Hosp. Manag. 2010, 22, 609–637. [Google Scholar] [CrossRef]
- Varila, M.; Seppänen, M.; Suomala, P. Detailed cost modelling: A case study in warehouse logistics. Int. J. Phys. Distrib. Logist. Manag. 2007, 37, 184–200. [Google Scholar] [CrossRef]
- Zadeh, L. Fuzzy sets. Inf. Control. 1965, 8, 338–353. [Google Scholar] [CrossRef] [Green Version]
- Kutnar, L.; Kobler, A. The current distribution of black locust (Robinia pseudoacacia L.) in Slovenia and predictions for the future. Acta Silvae Ligni 2013, 102, 21–30. [Google Scholar] [CrossRef] [Green Version]
- Brus, R. Tujerodne drevesne vrste v evropski in slovenski perspektivi. In Tujerodne Drevesne Vrste V Slovenskih Gozdovih; Jarni, K., Ed.; Univerza v Ljubljani: Ljubljana, Slovenija, 2021; pp. 9–18. [Google Scholar]
- Hernández, J.J.C.; Fernández, L.P.S.; Carrasco-Ochoa, J.A.; Martinez-Trinidad, J.F. Immediate water quality assessment in shrimp culture using fuzzy inference systems. Expert Syst. Appl. 2012, 39, 10571–10582. [Google Scholar] [CrossRef]
- Zadeh, L.A. The concept of a linguistic variable and its application to approximate reasoning-III. Inf. Sci. 1975, 9, 43–80. [Google Scholar] [CrossRef]
- Ross, T.J. Fuzzy Logic with Engineering Applications, 4th ed.; John Wiley & Sons: Hoboken, NJ, USA, 2010. [Google Scholar]
- Mestna občina Ljubljana Project APPLAUSE. Available online: https://www.ljubljana.si/sl/moja-ljubljana/applause/ (accessed on 29 September 2021).
- Slovenian Forestry Institute Project LIFE ARTEMIS. Available online: https://www.tujerodne-vrste.info/en/project-life-artemis/ (accessed on 29 September 2021).
- Marenče, J.; Šega, B.; Bučar, D.G. Monitoring the Quality and Quantity of Beechwood from Tree to Sawmill Product. Croat. J. For. Eng. 2019, 41, 119–128. [Google Scholar] [CrossRef]
- EN 975-1:2009 Sawn Timber—Appearance Grading of Hardwoods—Part 1: Oak and Beech. Available online: https://standards.iteh.ai/catalog/standards/cen/0a583195-68ed-49b7-a710-adcbbd60477c/en-975-1-2009 (accessed on 29 October 2021).
- Sandak, A.; Sandak, J. Prediction of service life—Does aesthetic matter? In Proceedings of the International Research Group on Wood Protection. Section 2. Test Methodology and Assessment, Ghent, Belgium, 4–8 June 2017. [Google Scholar]
- Burnard, M.D.; Nyrud, A.Q.; Bysheim, K.; Kutnar, A.; Vahtikari, K.; Hughes, M. Building material naturalness: Perceptions from Finland, Norway and Slovenia. Indoor Built Environ. 2016, 26, 92–107. [Google Scholar] [CrossRef]
- Høibø, O.; Nyrud, A.Q. Consumer perception of wood surfaces: The relationship between stated preferences and visual homogeneity. J. Wood Sci. 2010, 56, 276–283. [Google Scholar] [CrossRef]
Publisher’s Note: MDPI stays neutral with regard to jurisdictional claims in published maps and institutional affiliations. |
© 2021 by the authors. Licensee MDPI, Basel, Switzerland. This article is an open access article distributed under the terms and conditions of the Creative Commons Attribution (CC BY) license (https://creativecommons.org/licenses/by/4.0/).