
Modeling the Bending Strength of MDF Faced, Polyurethane Foam-Cored Sandwich Panels Using Response Surface Methodology (RSM) and Artificial Neural Network (ANN)

 , ,
, ,  and
and
Abstract
:1. Introduction
2. Materials and Methods
2.1. Preparing the Protein Adhesive
2.2. Making Melamine-Urea-Formaldehyde (MUF) Resin
2.3. Making the Core Foam
2.4. Making the Sandwich Panel
2.5. Experimental Set Up
2.5.1. Response Surface Methodology
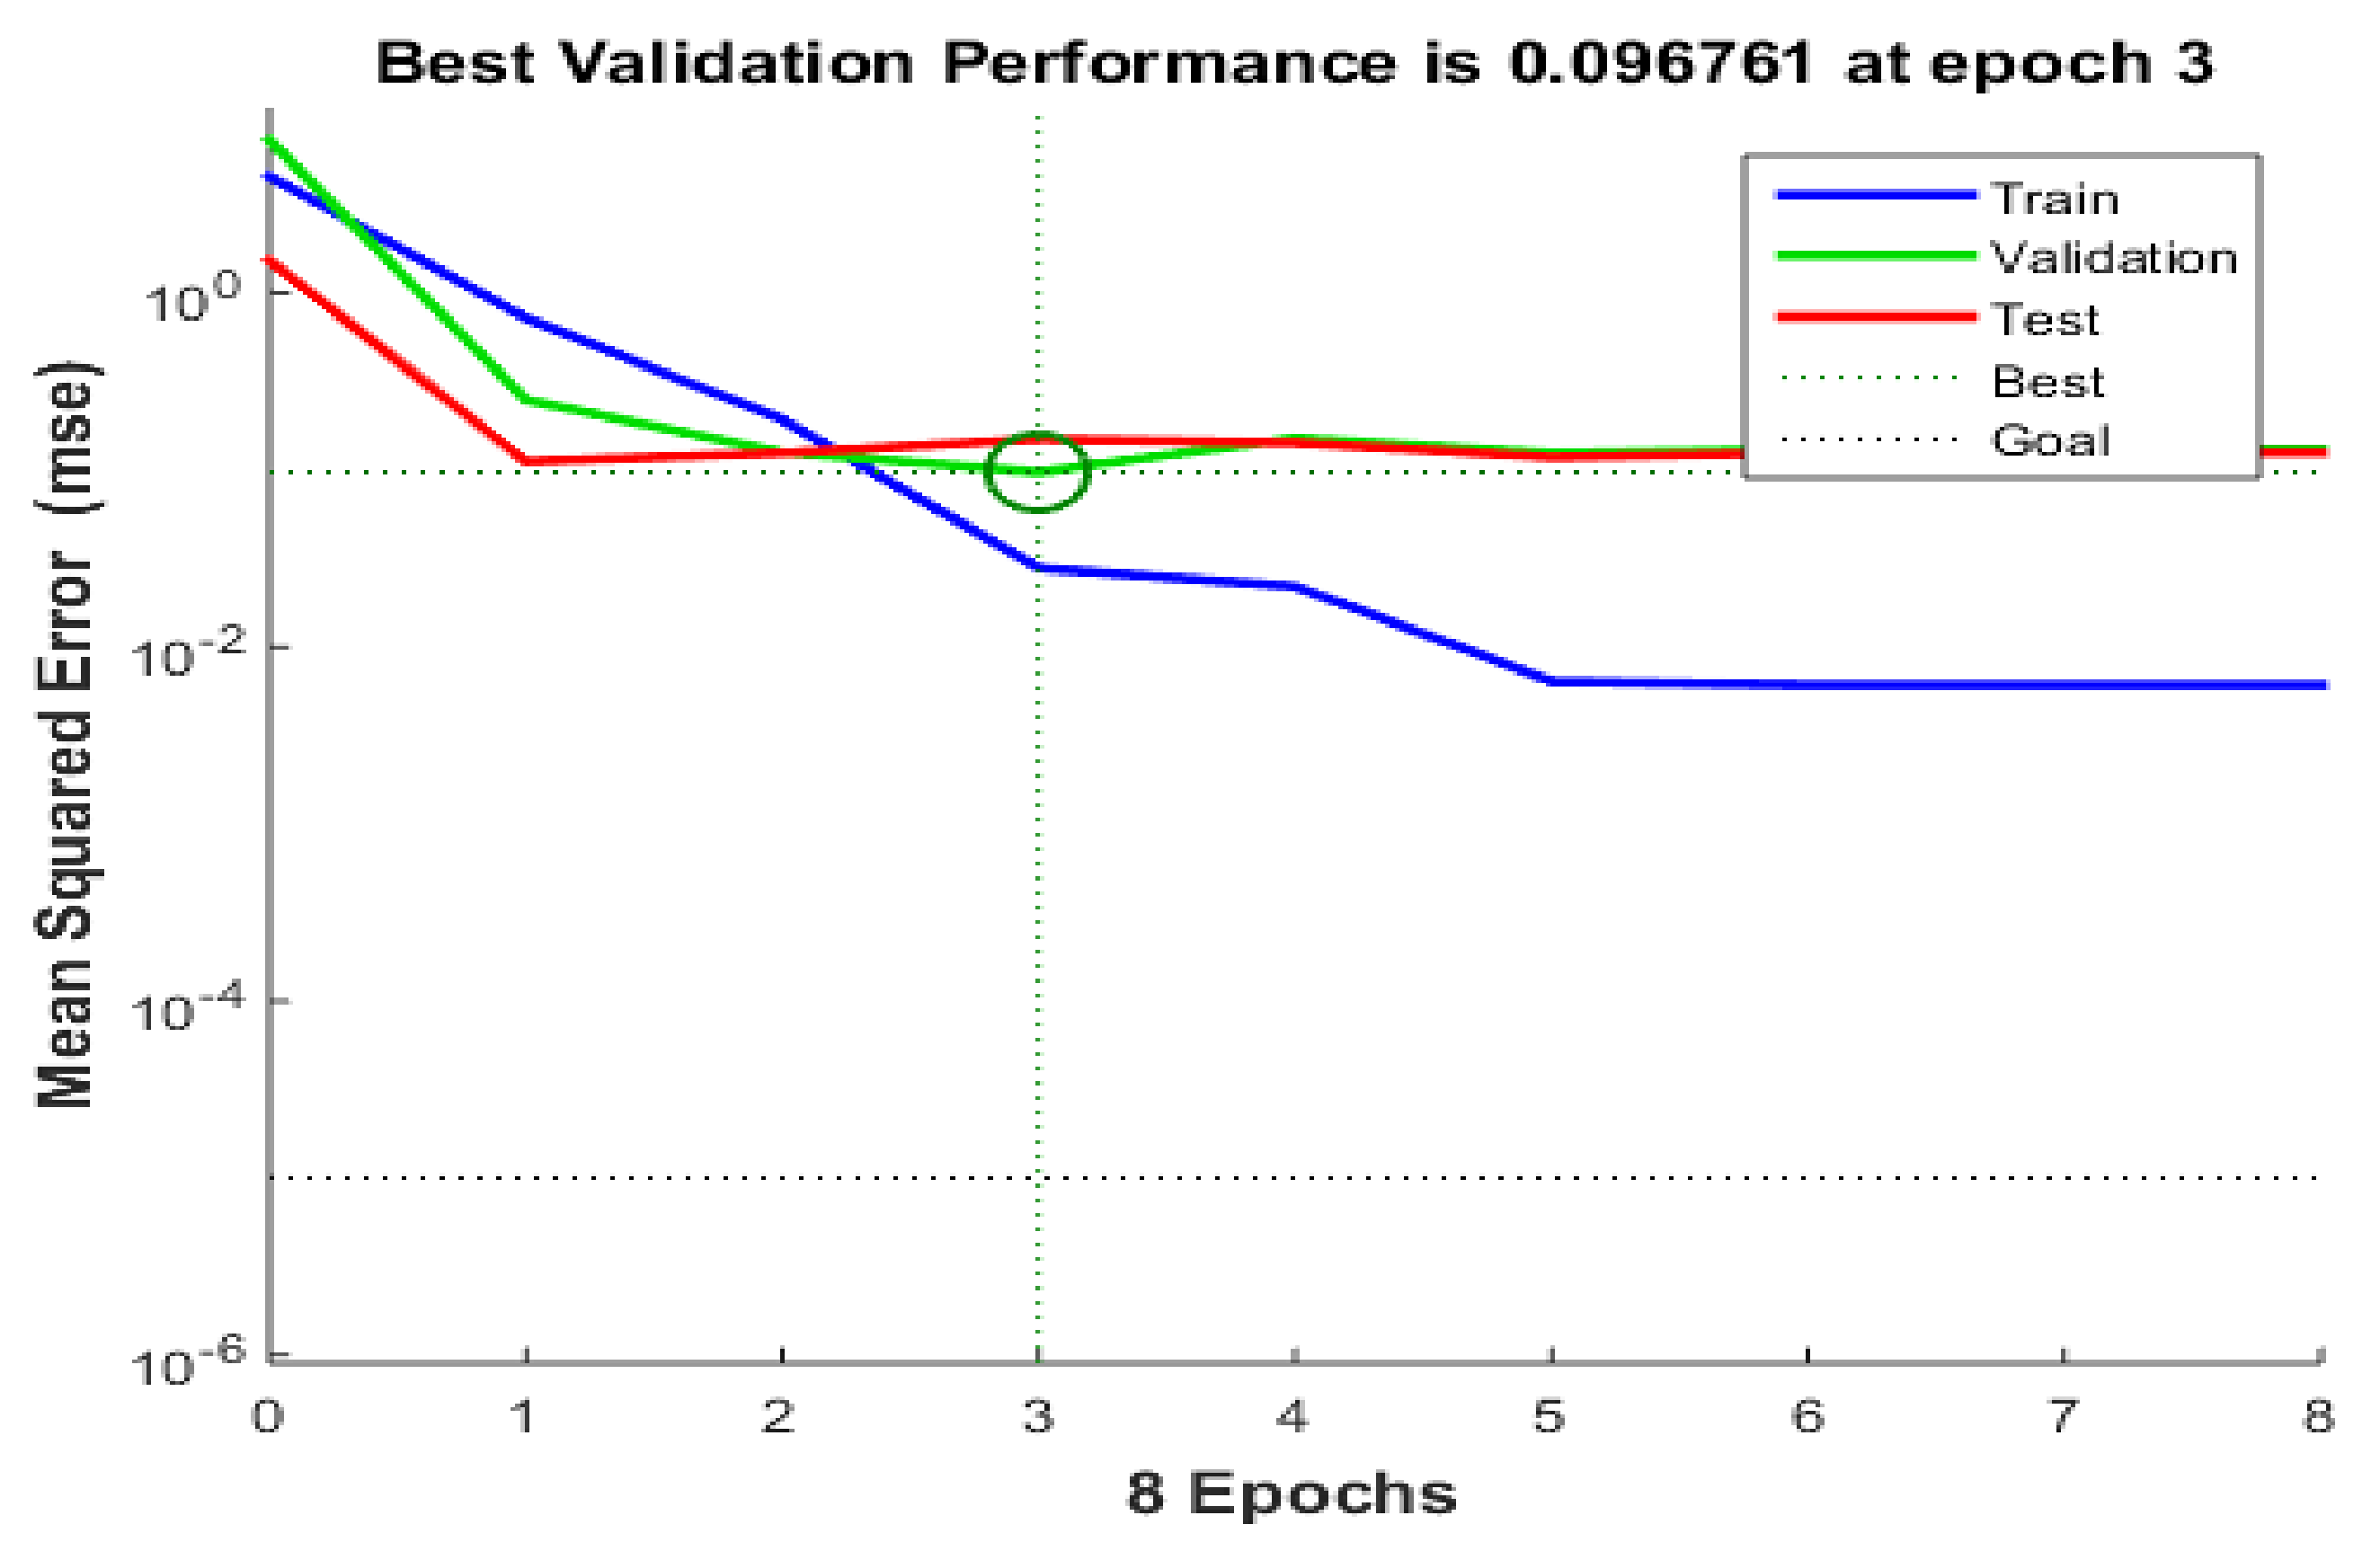
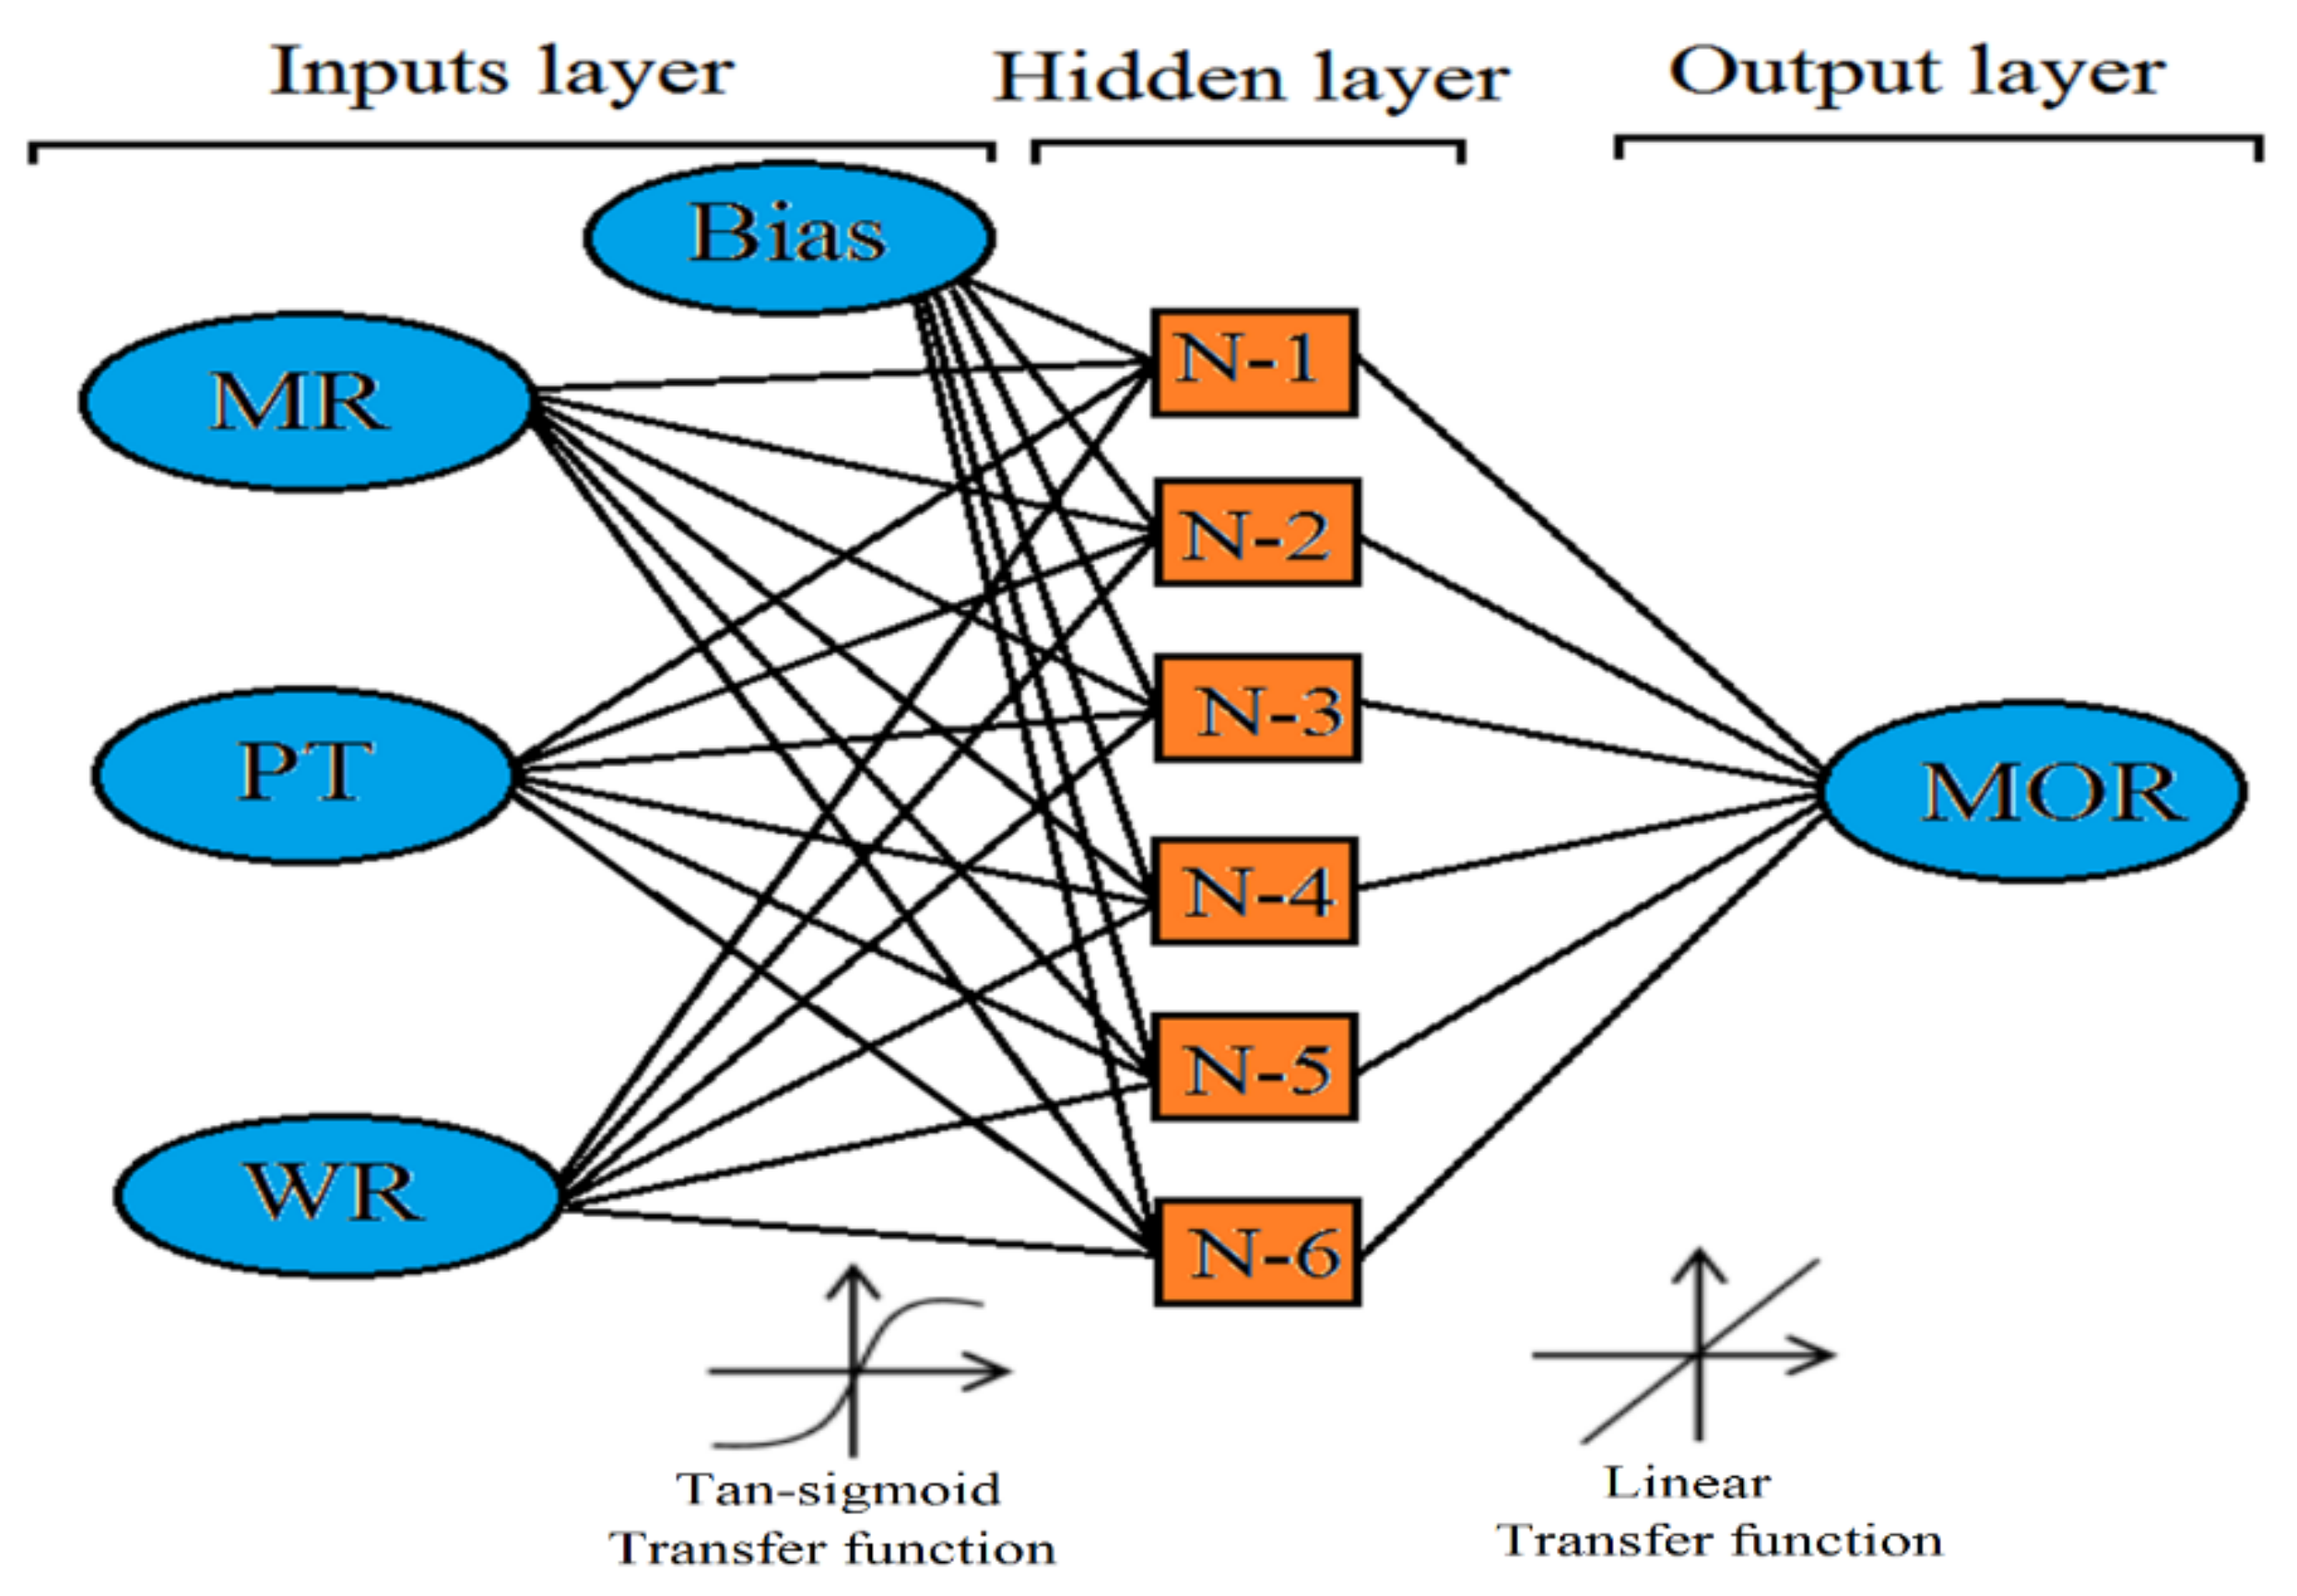
2.5.2. ANN Modeling
2.6. Characterization
3. Discussion and Results
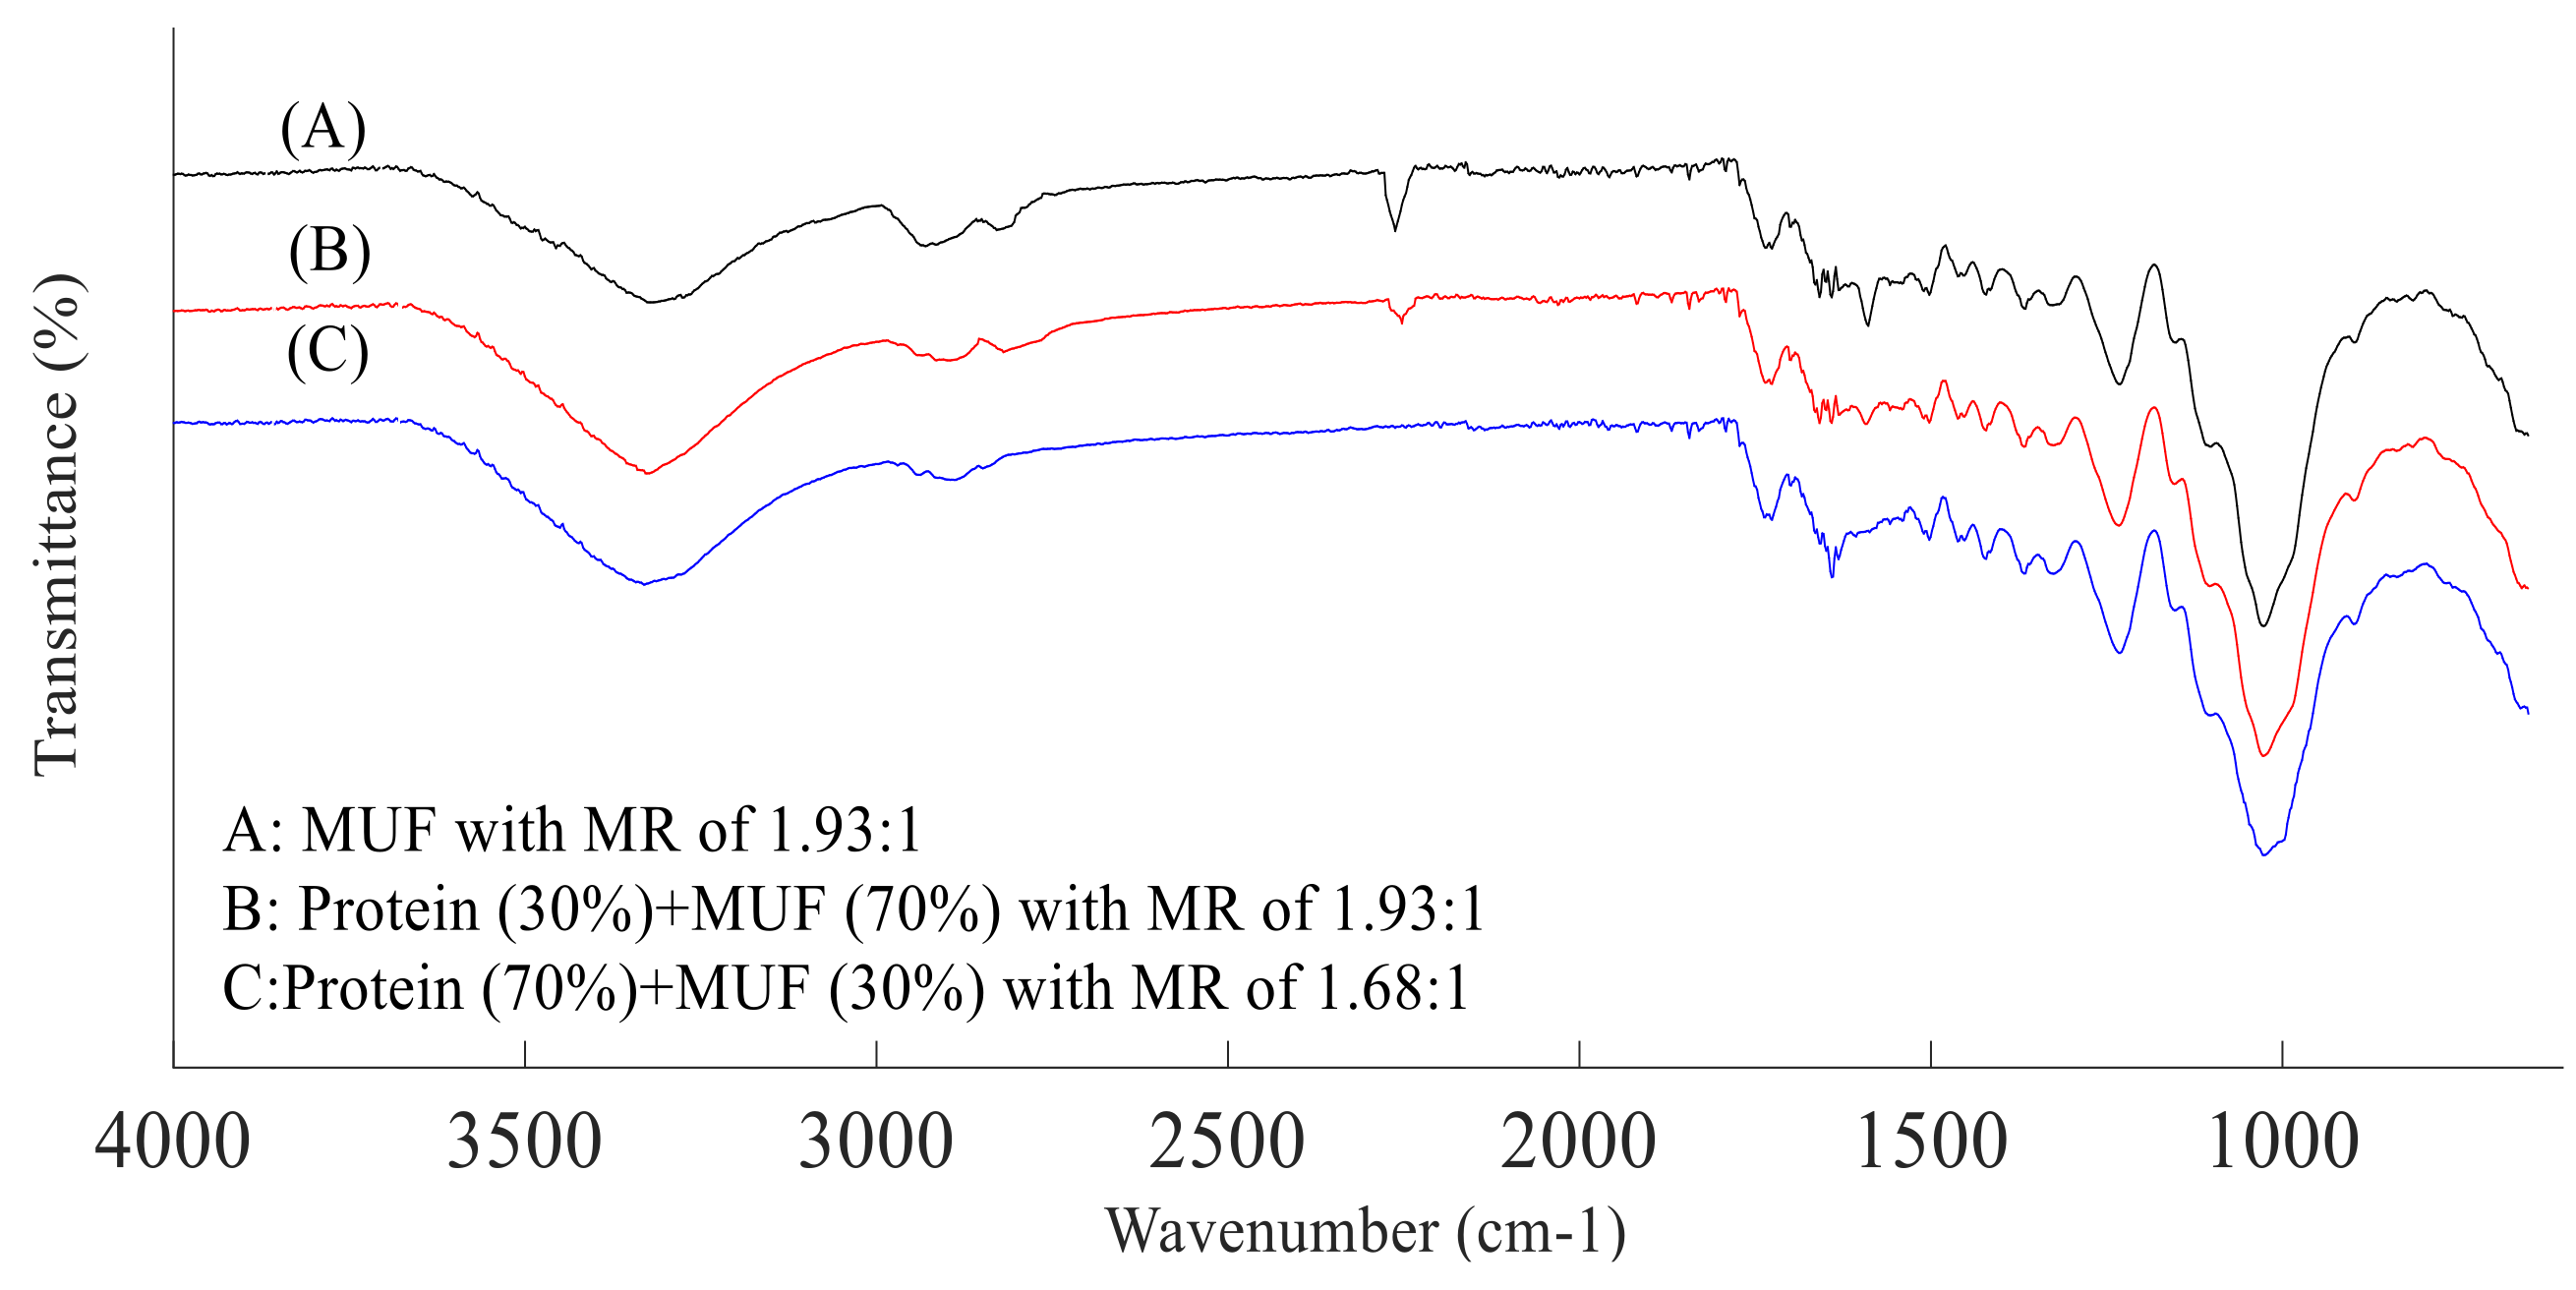
3.1. FTIR Analysis
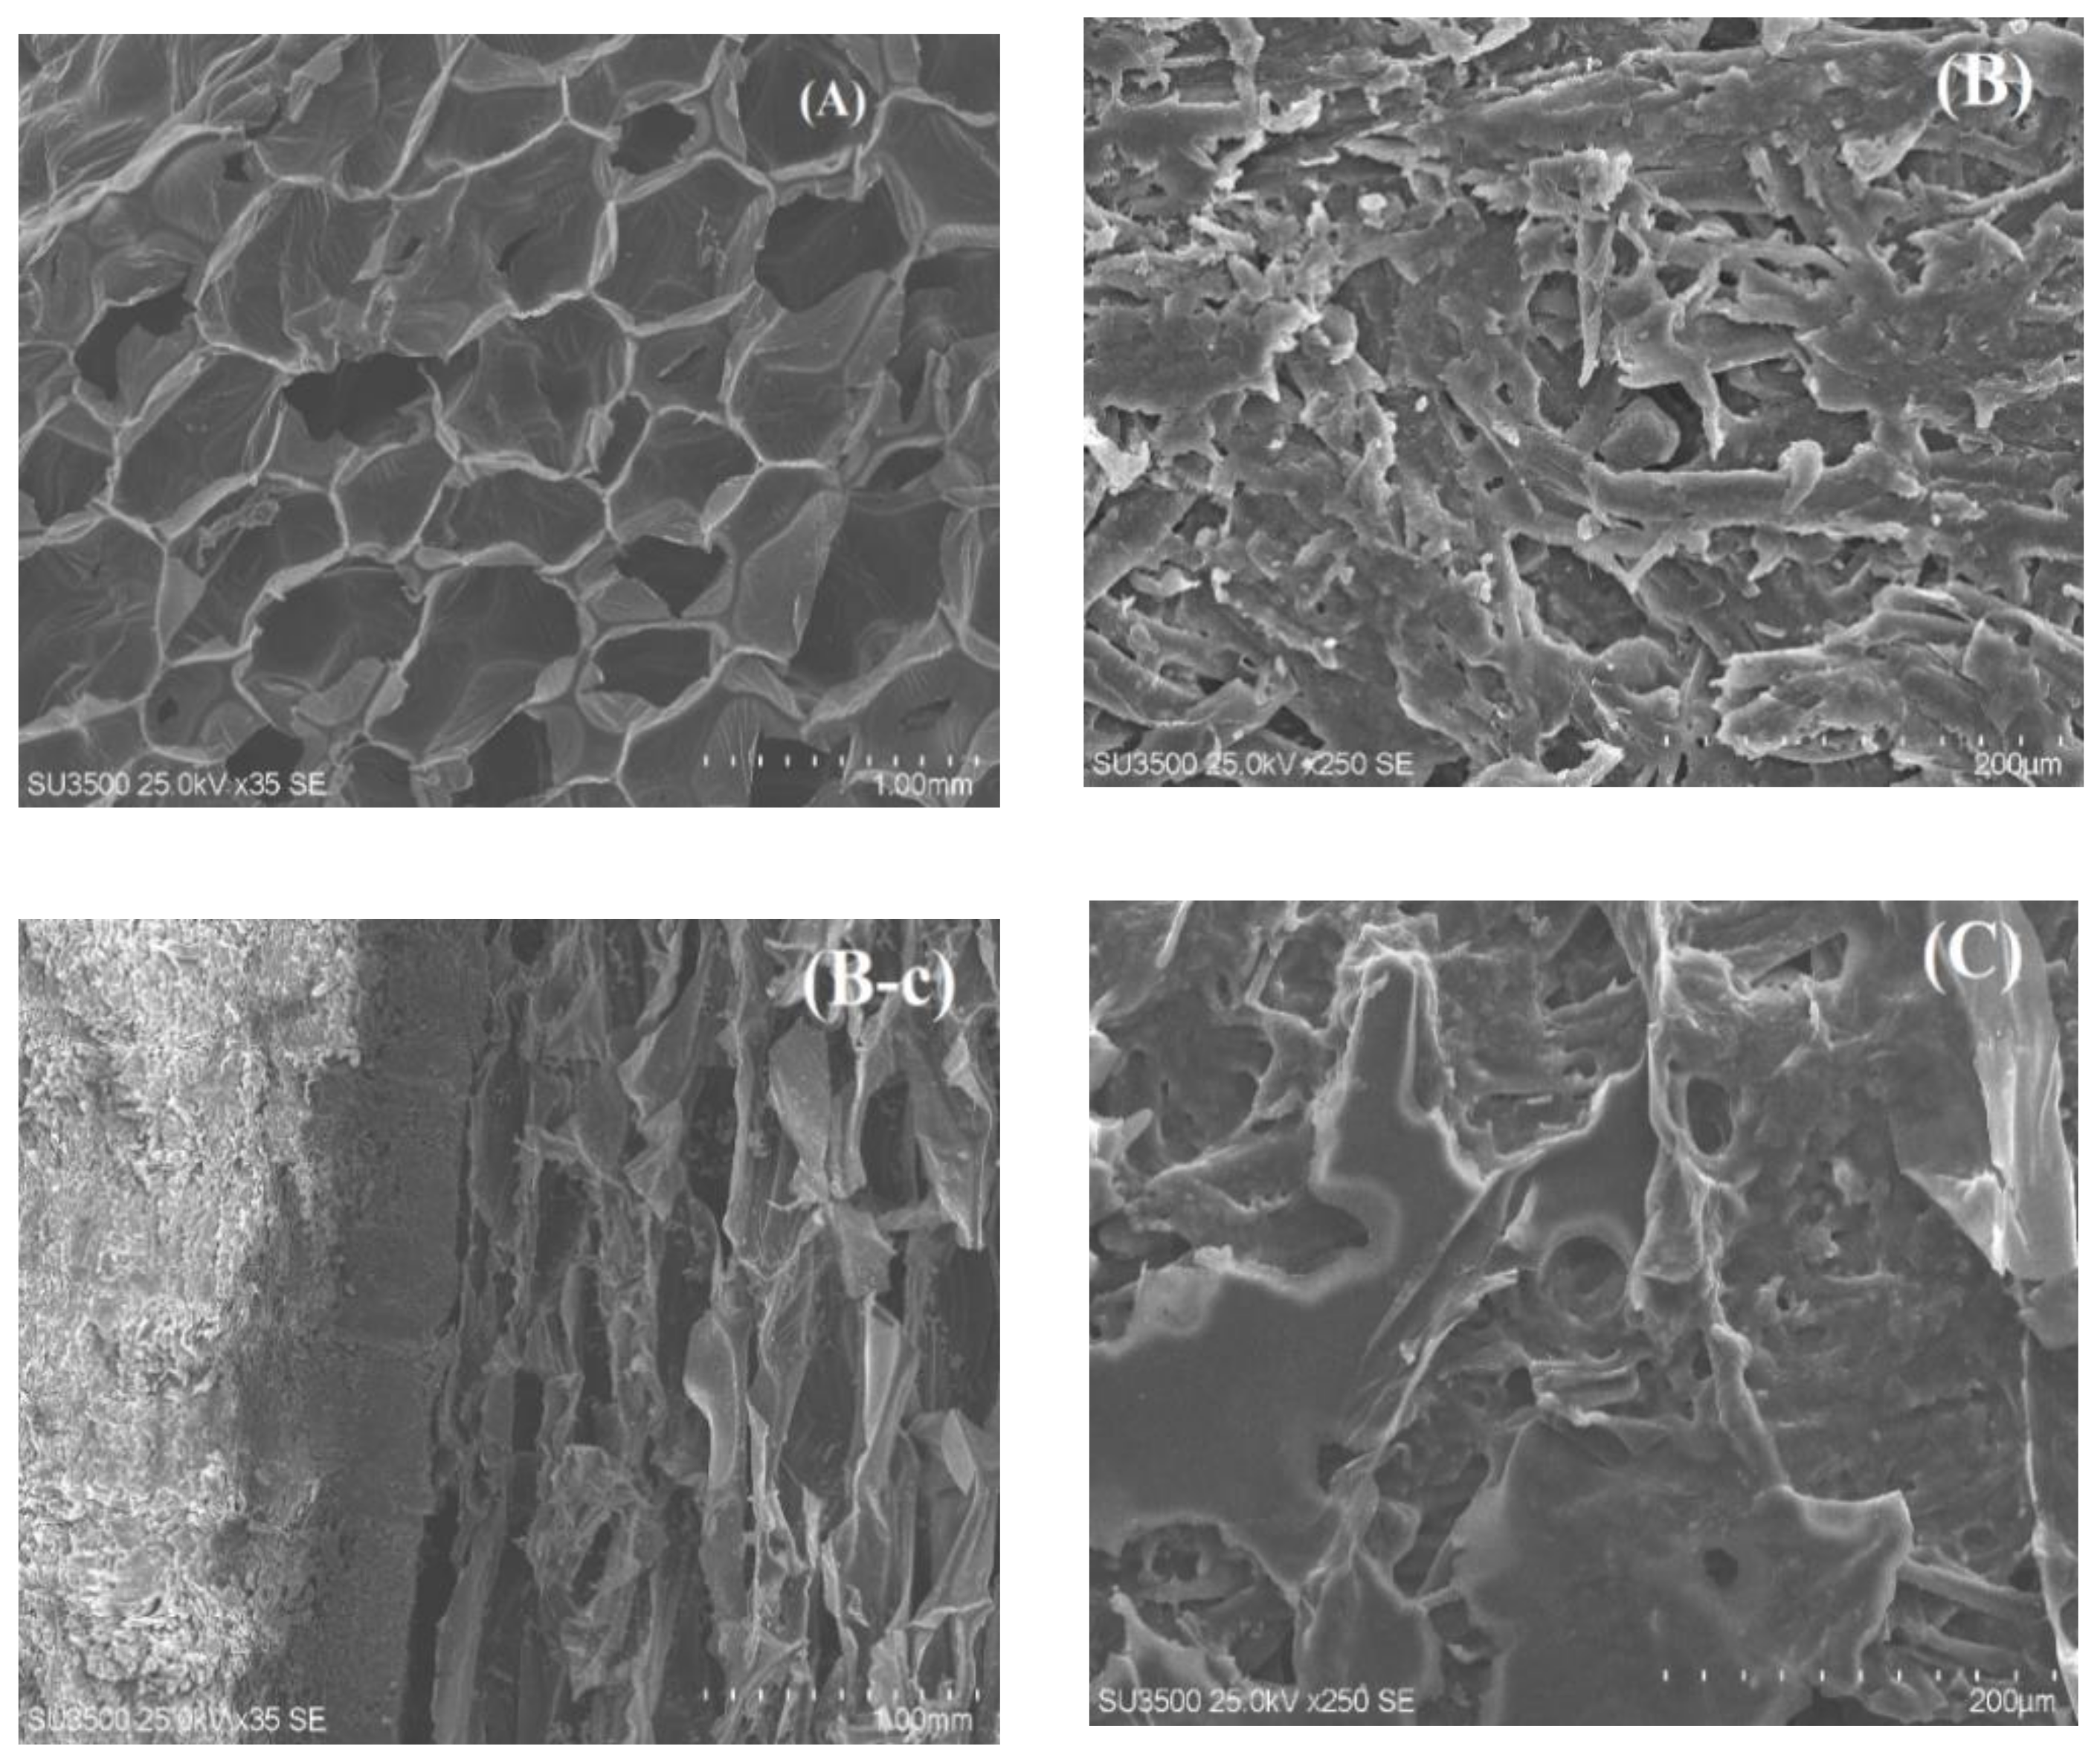
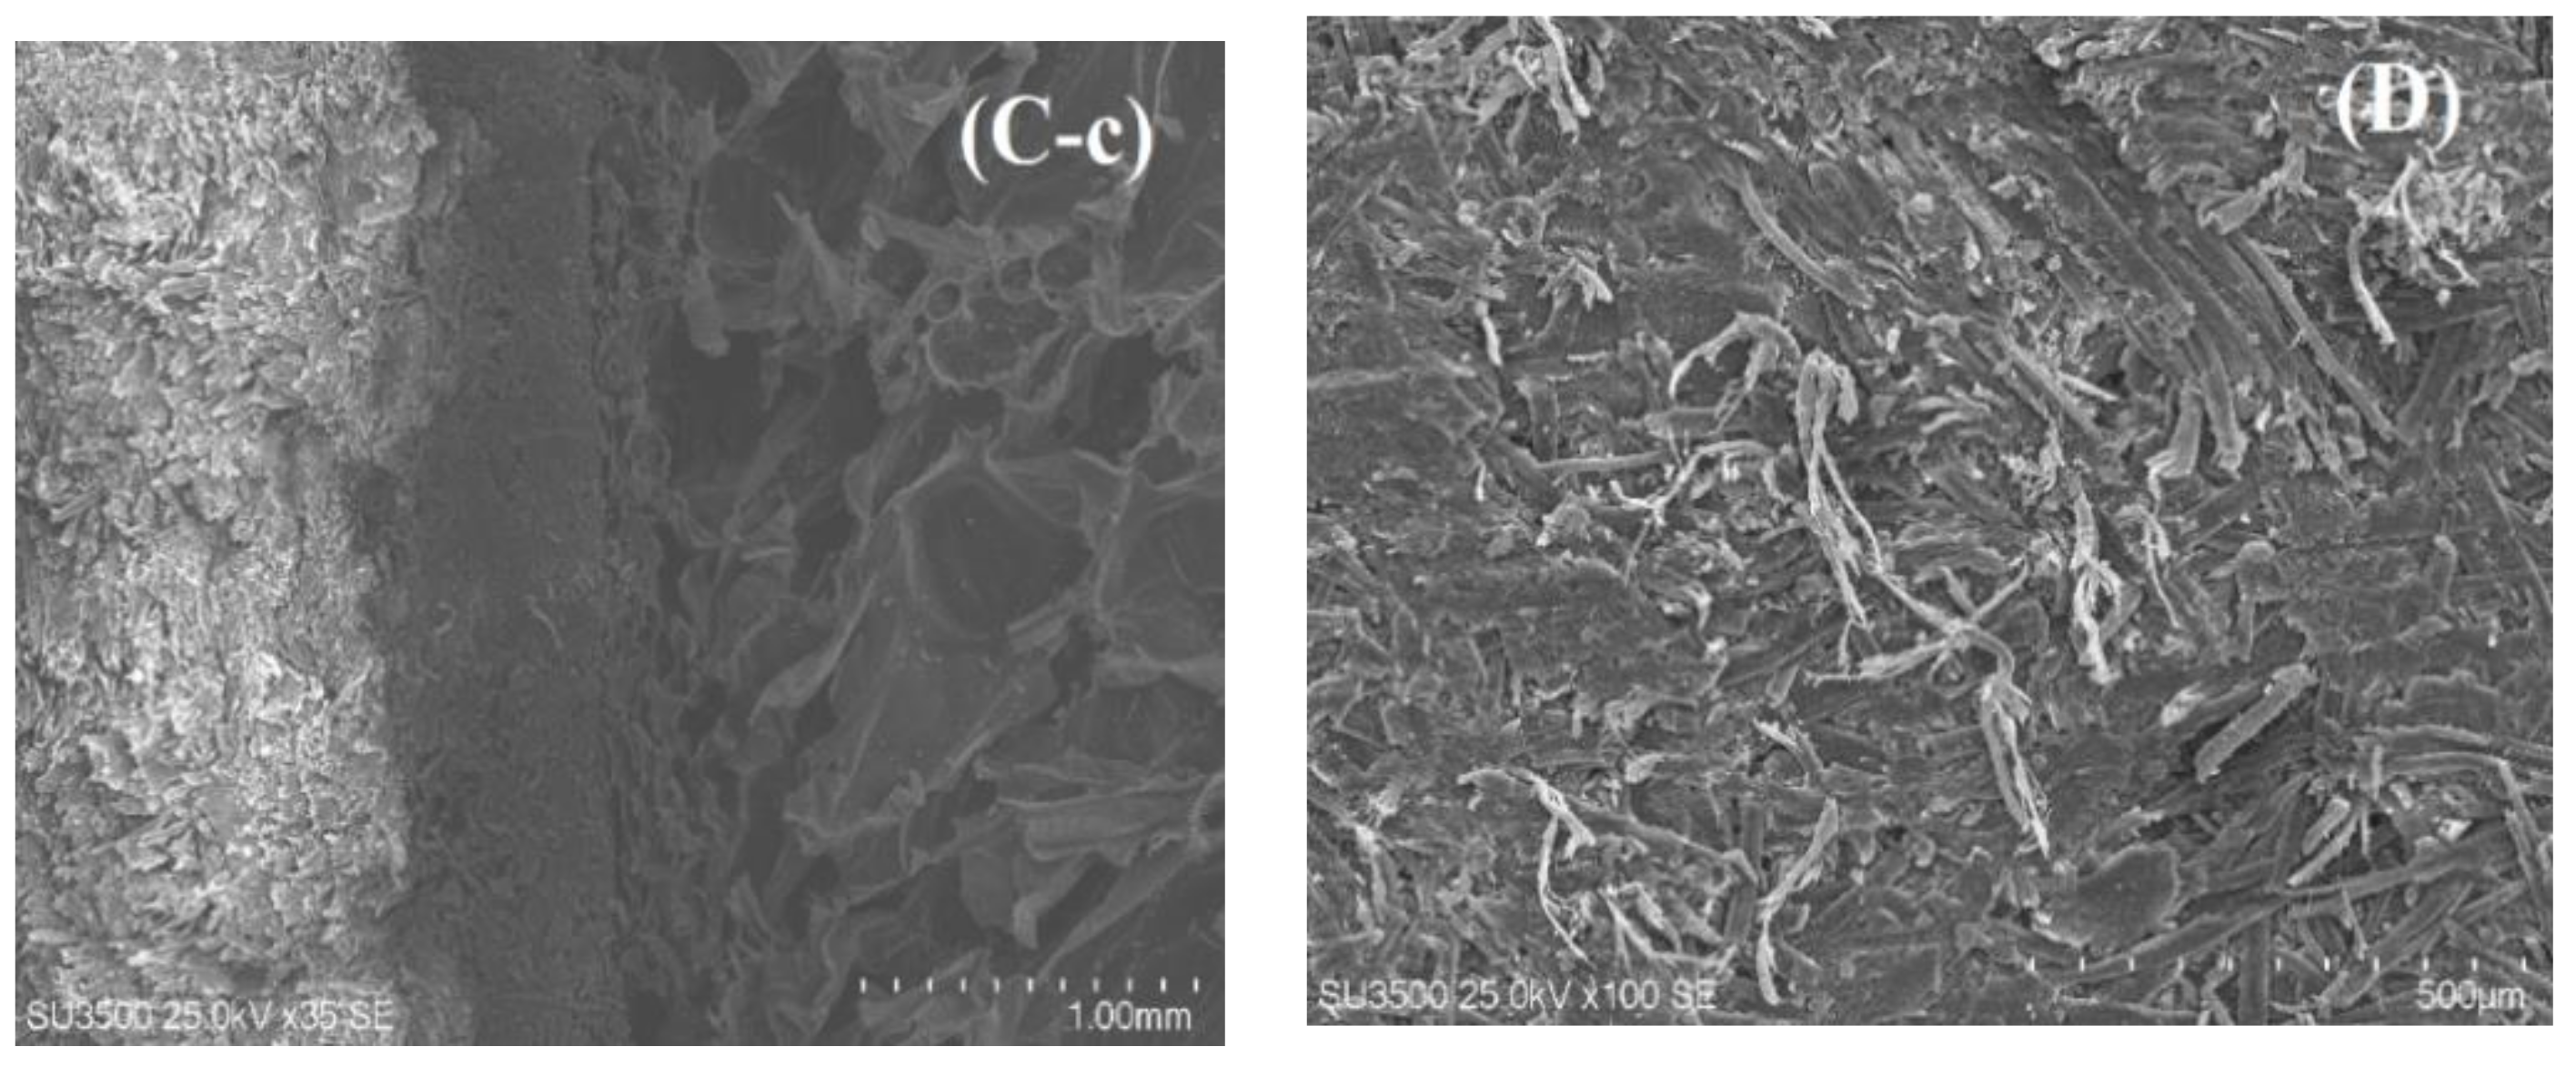
3.2. SEM Analysis
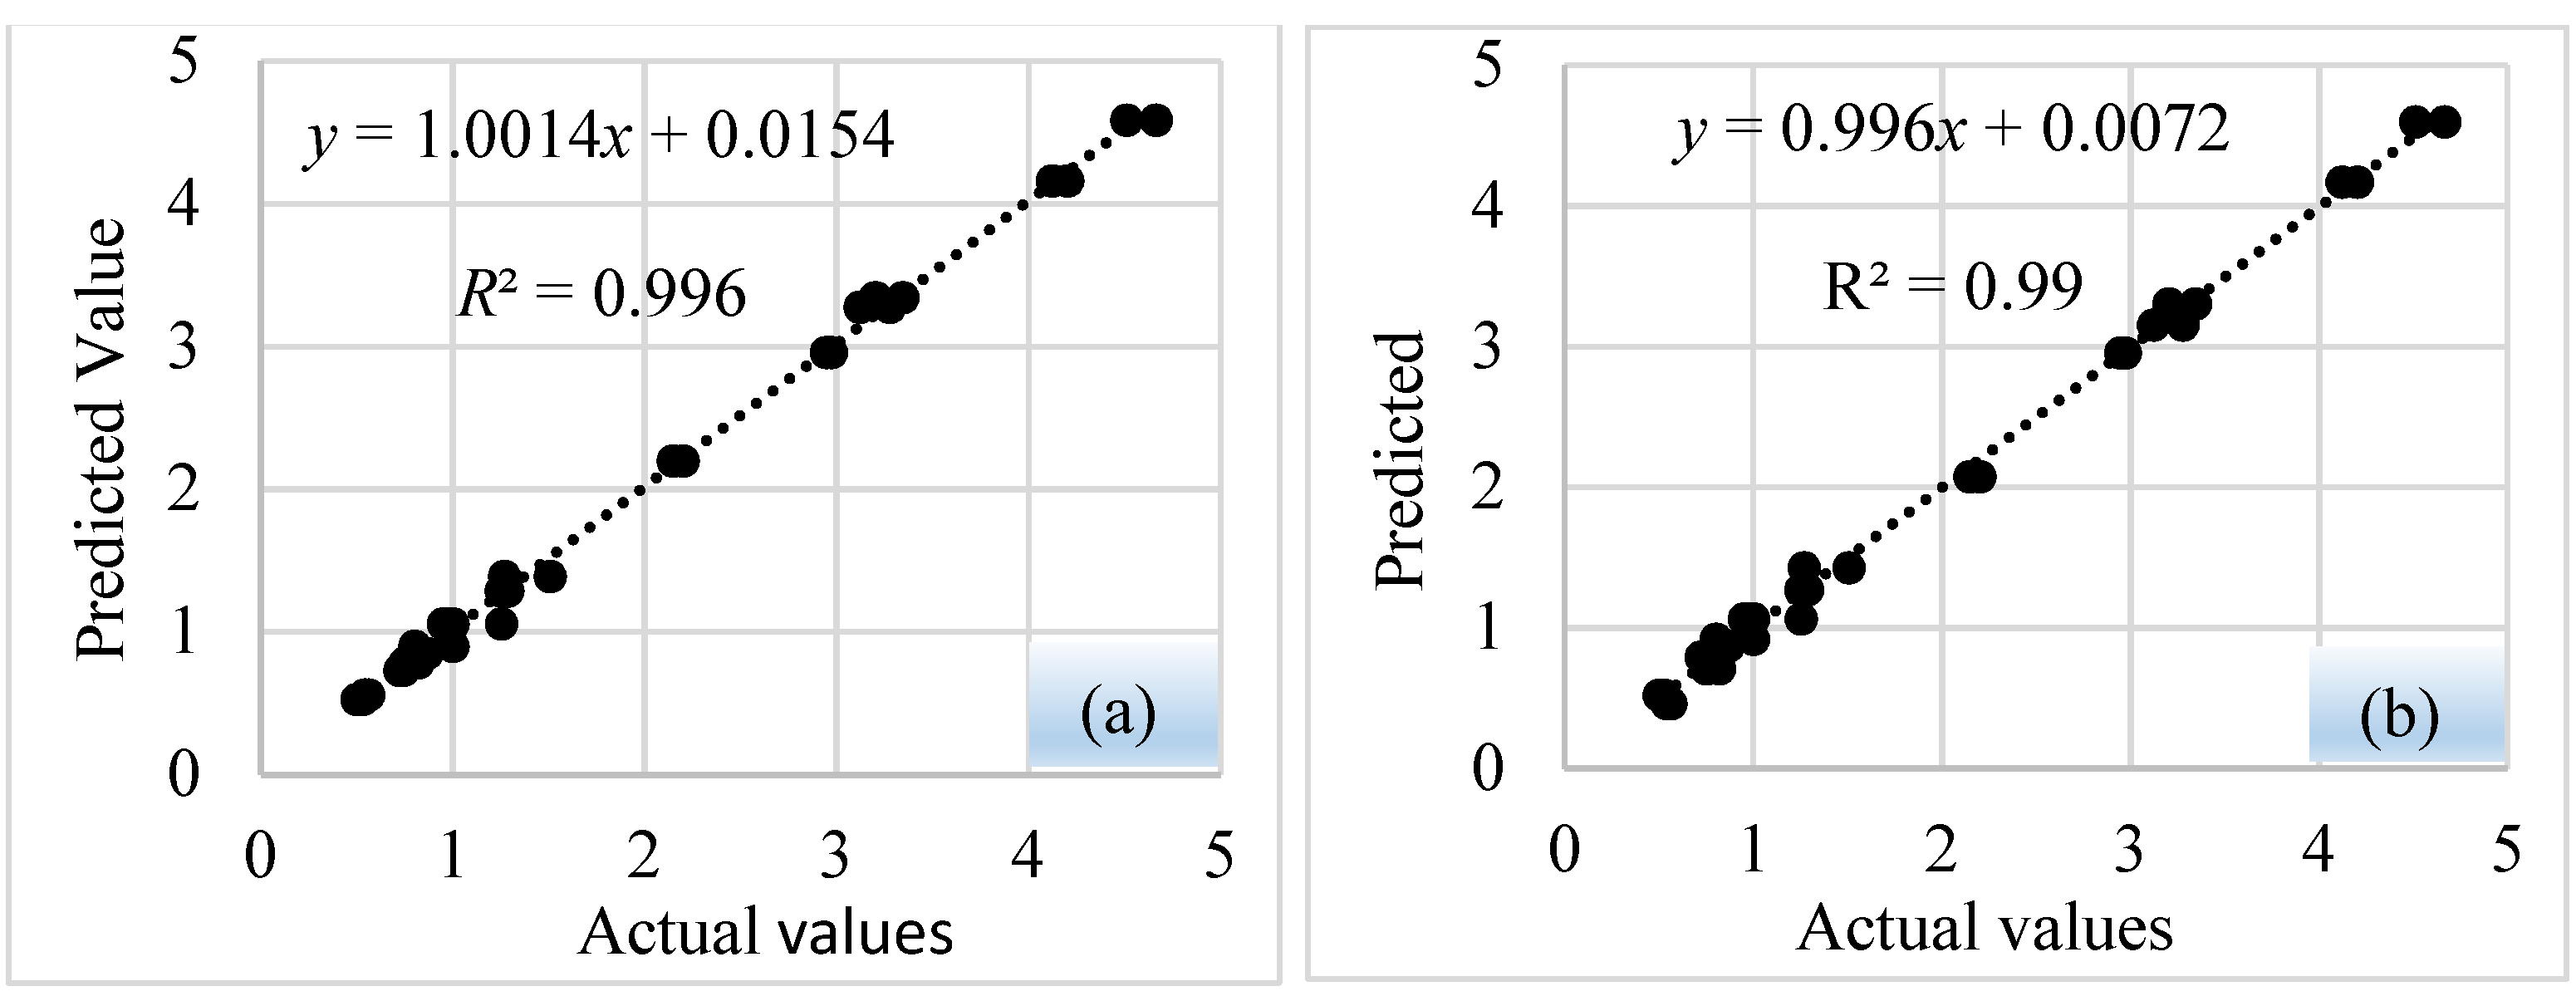
3.3. RSM Modeling
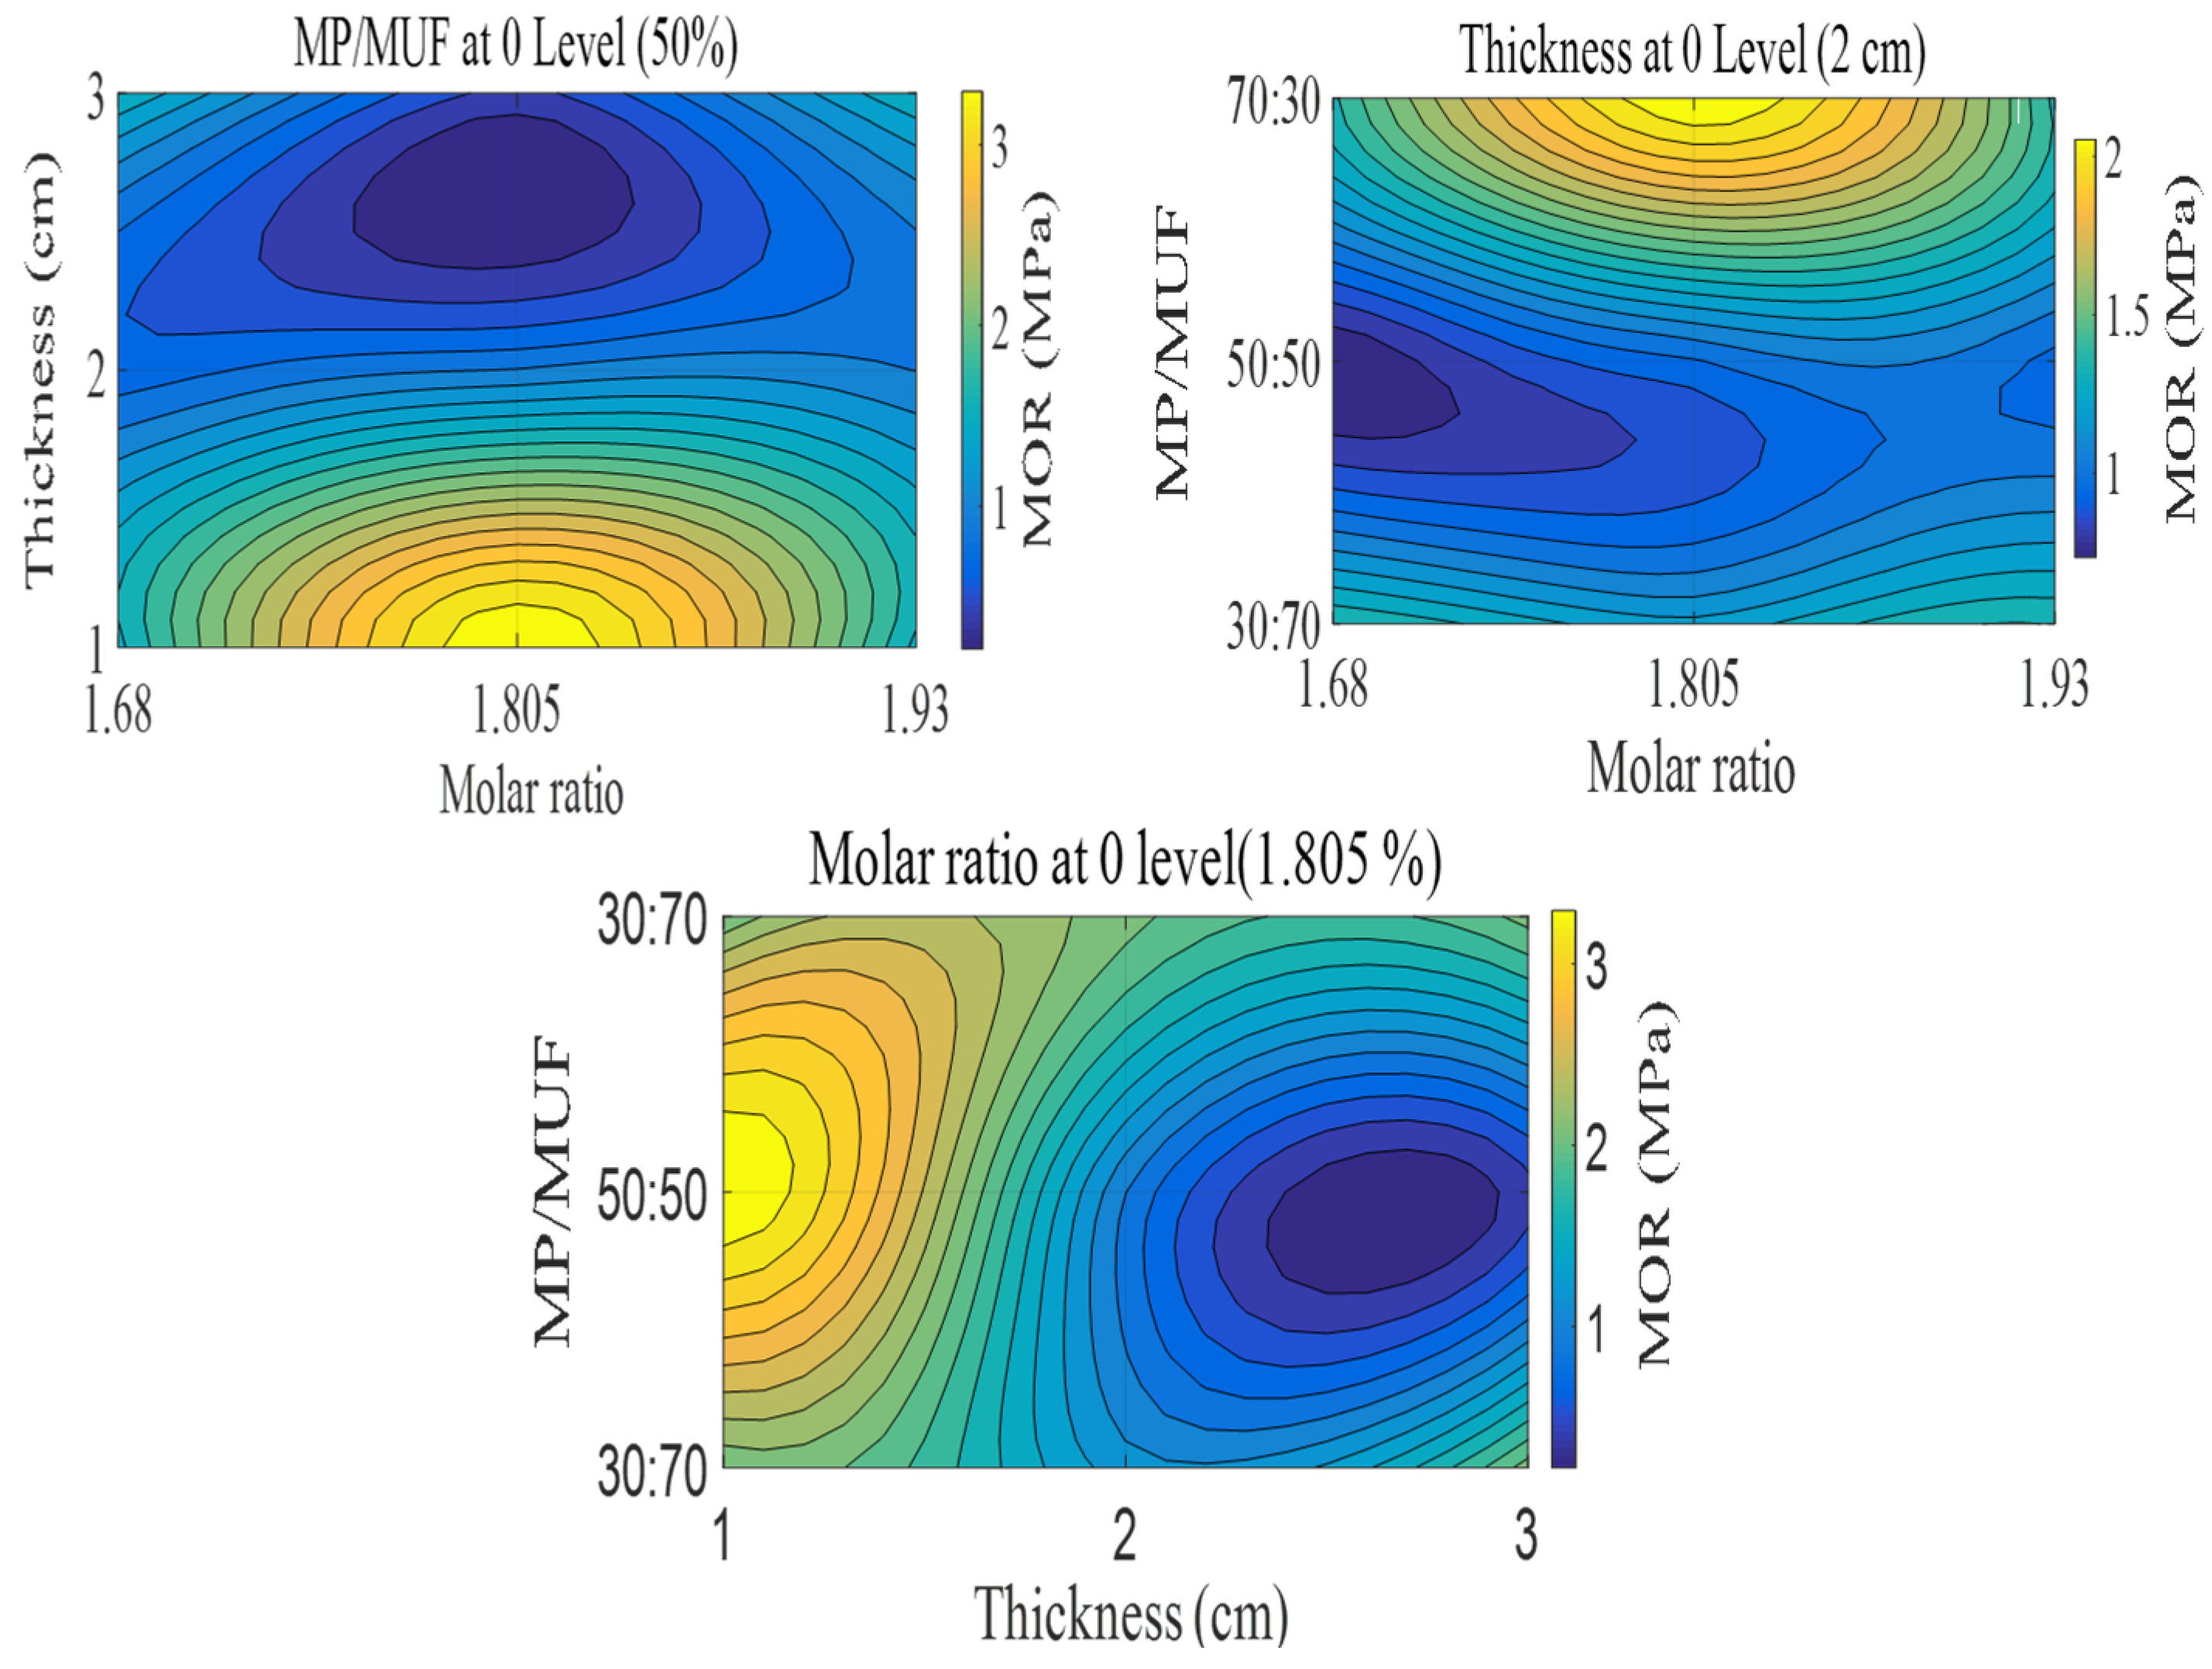
3.4. The Interaction between the Independent Variables in the RSM Approach
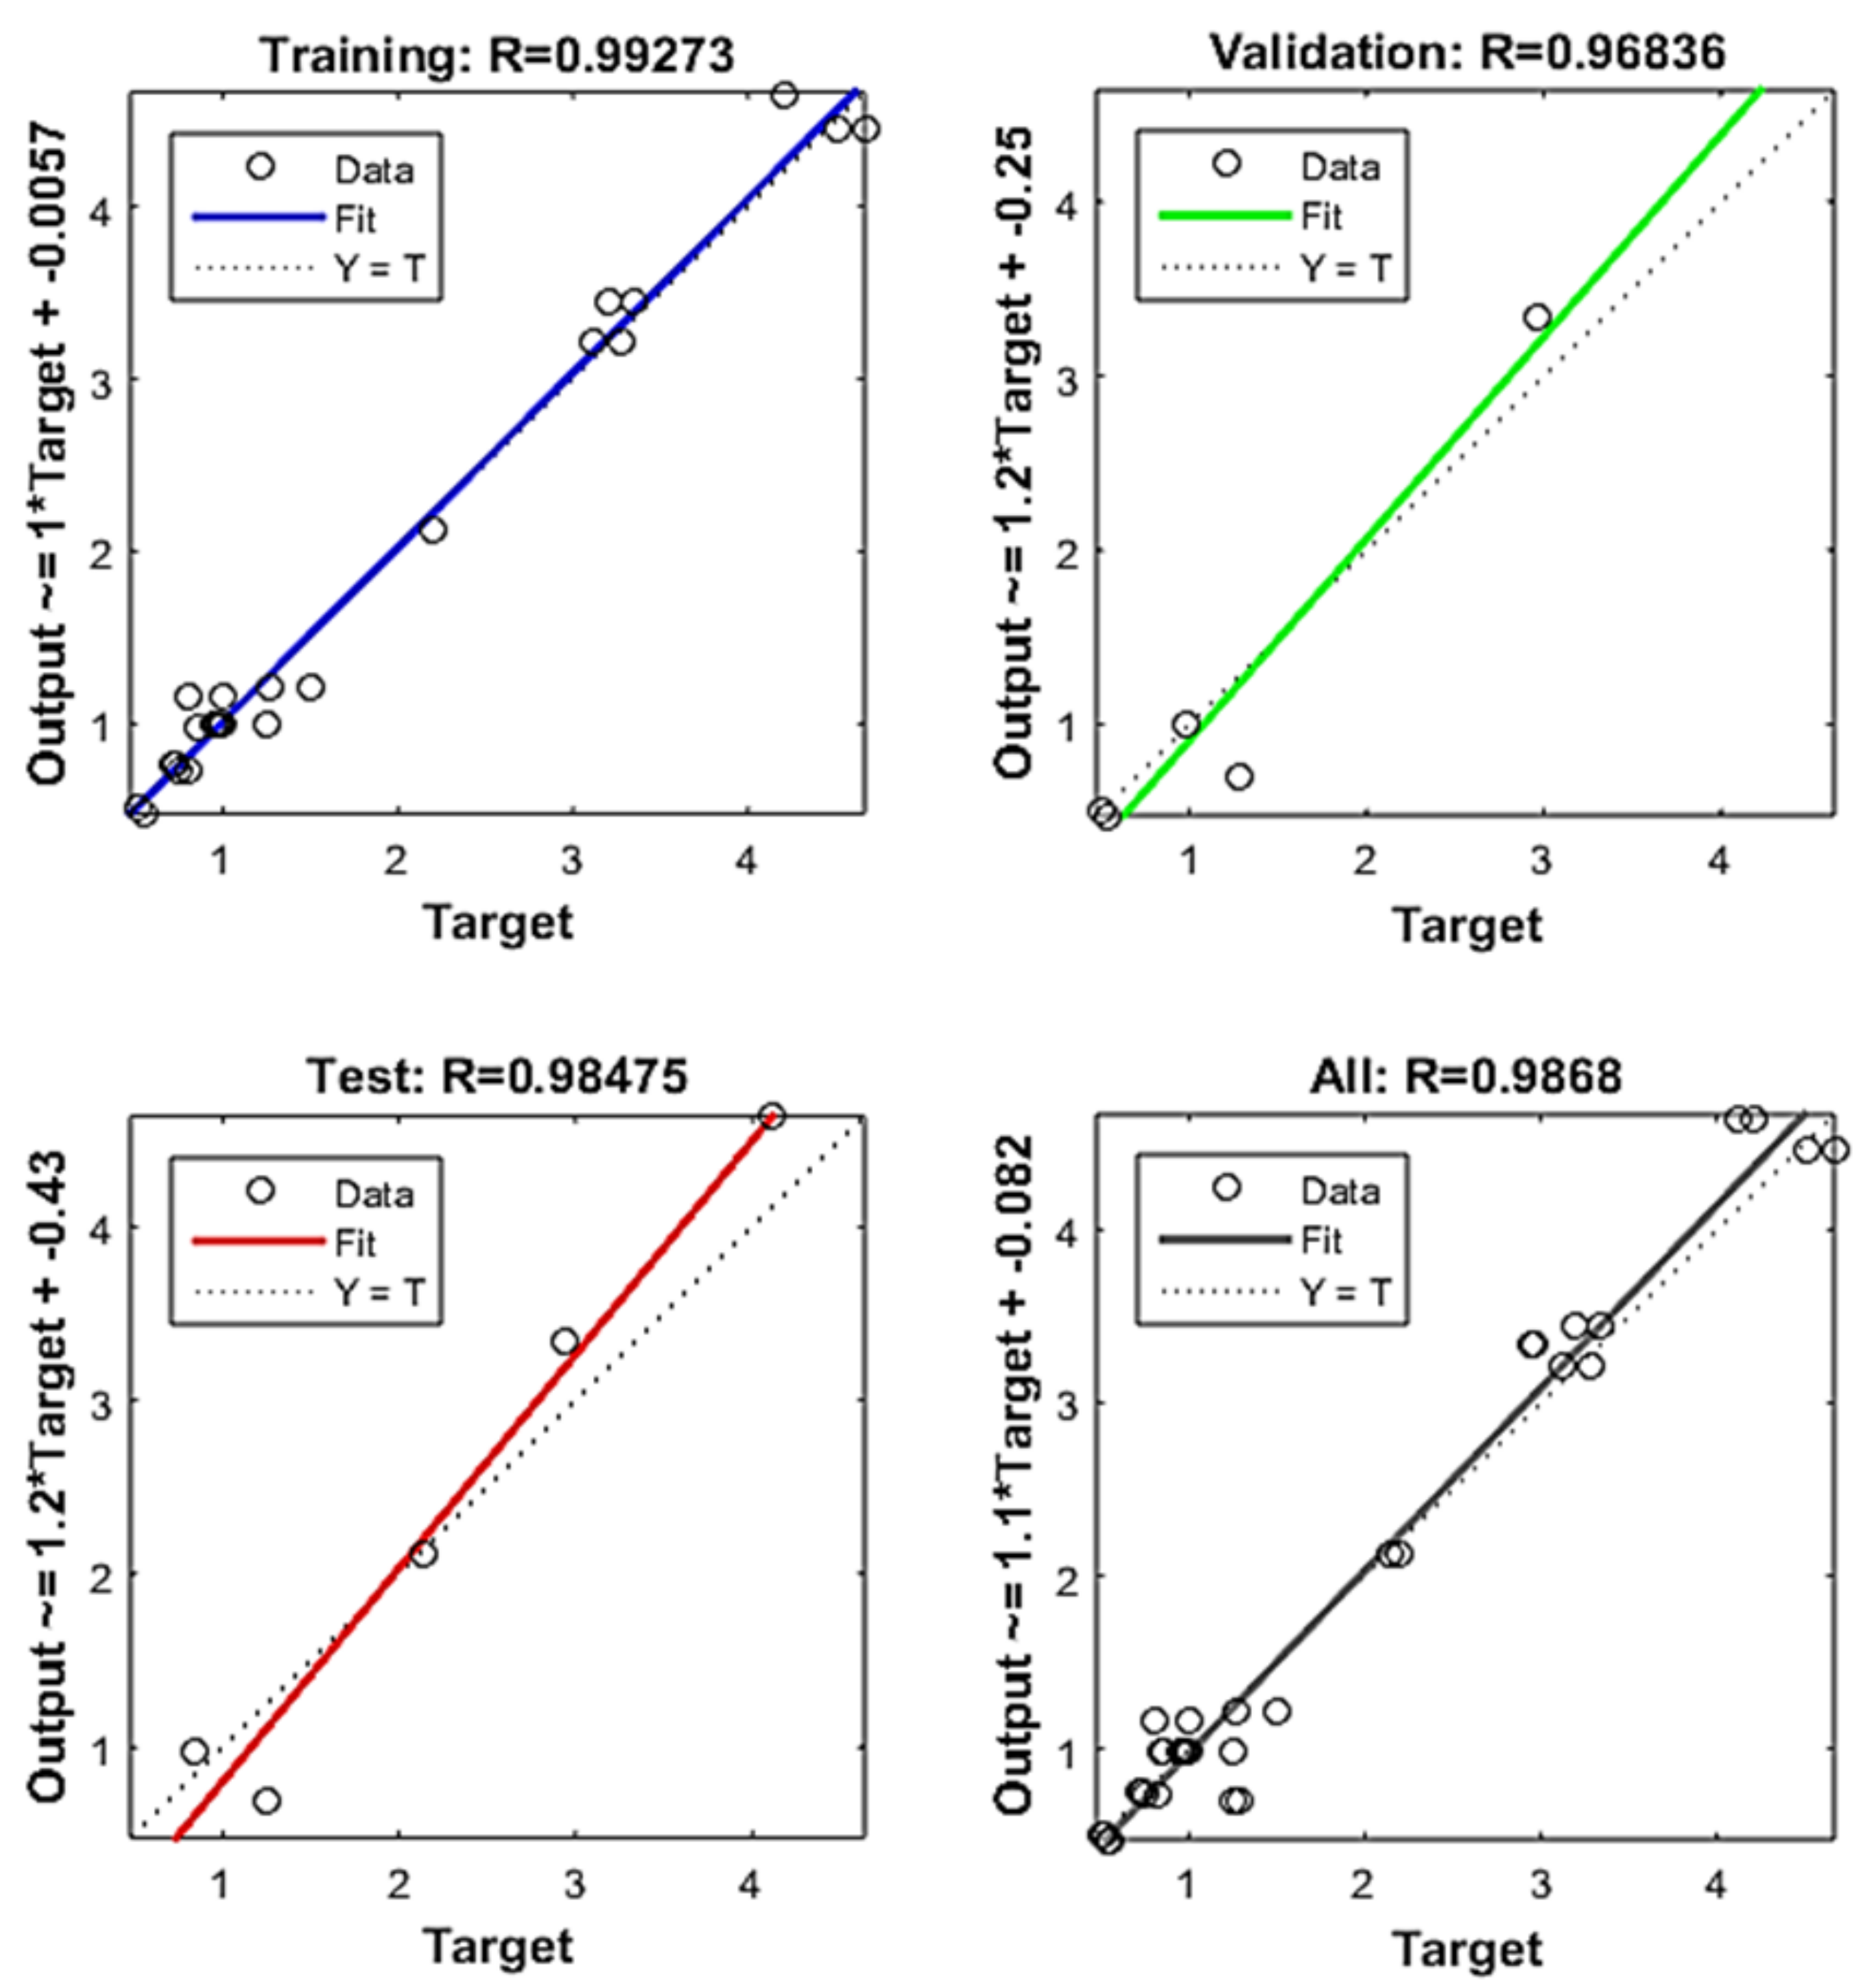
3.5. The Accuracy of ANN in the Output Prediction
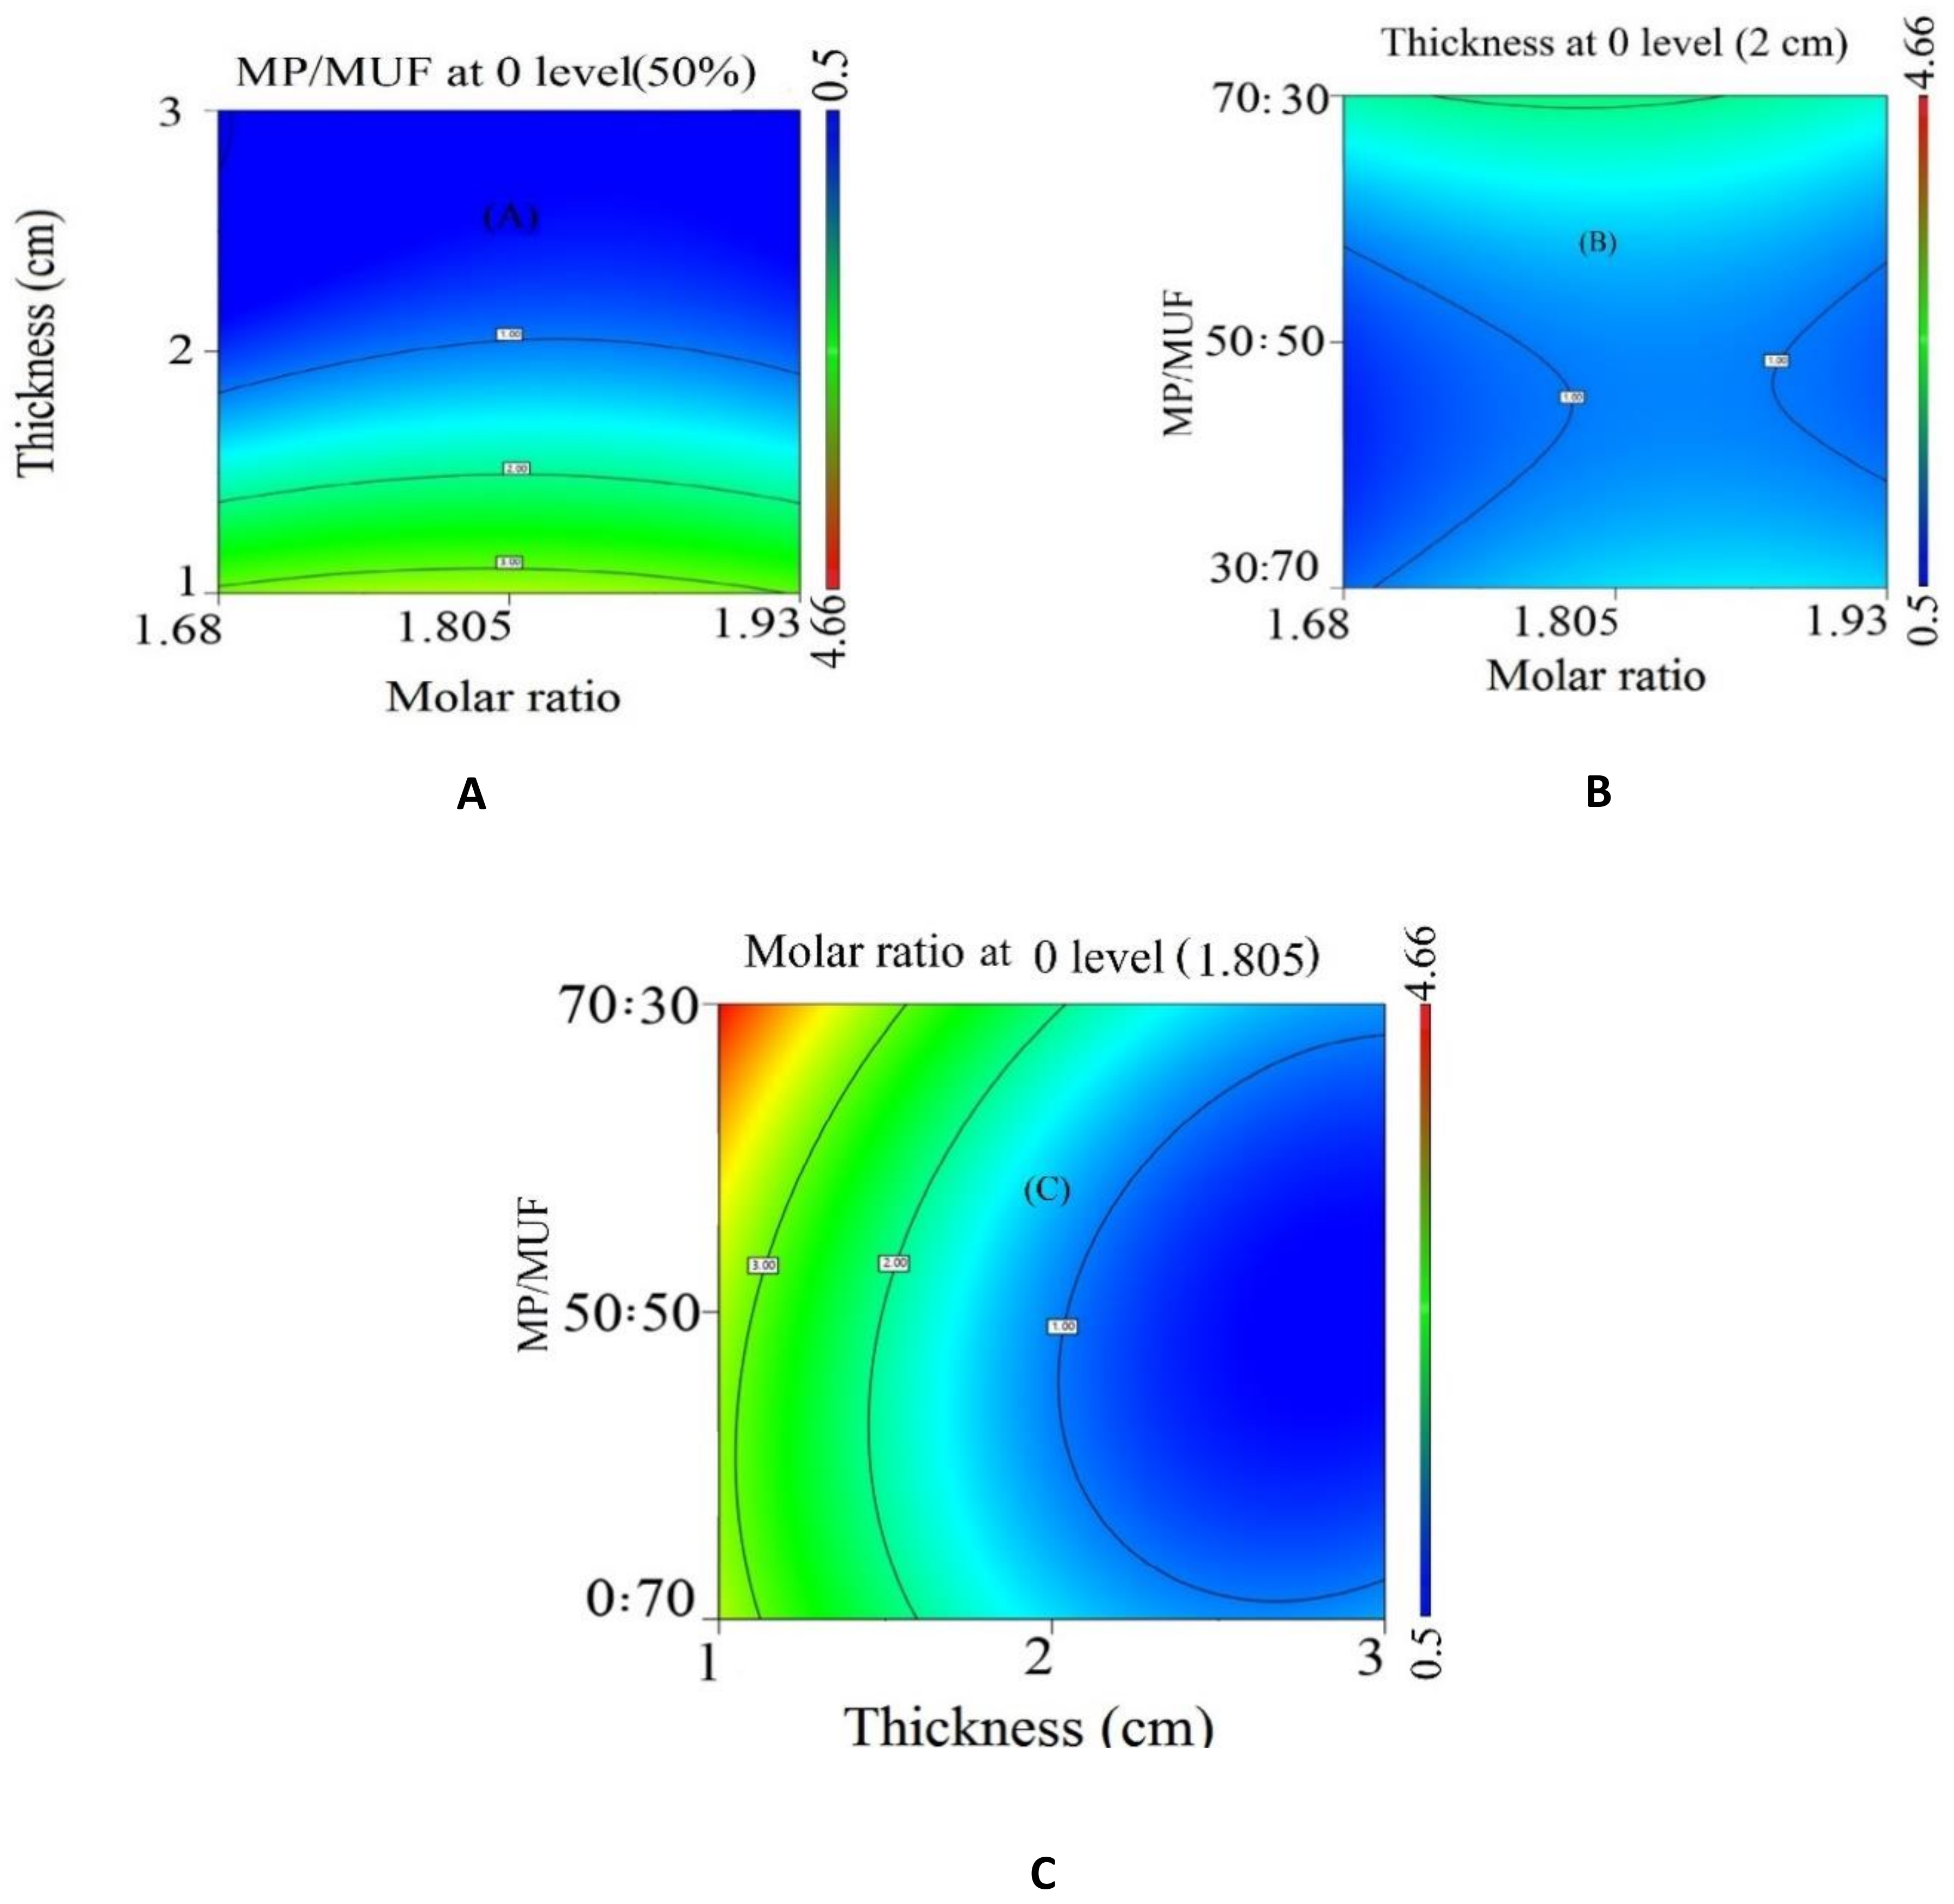
3.6. The Interaction between the Independent Variables in the ANN Model Approach
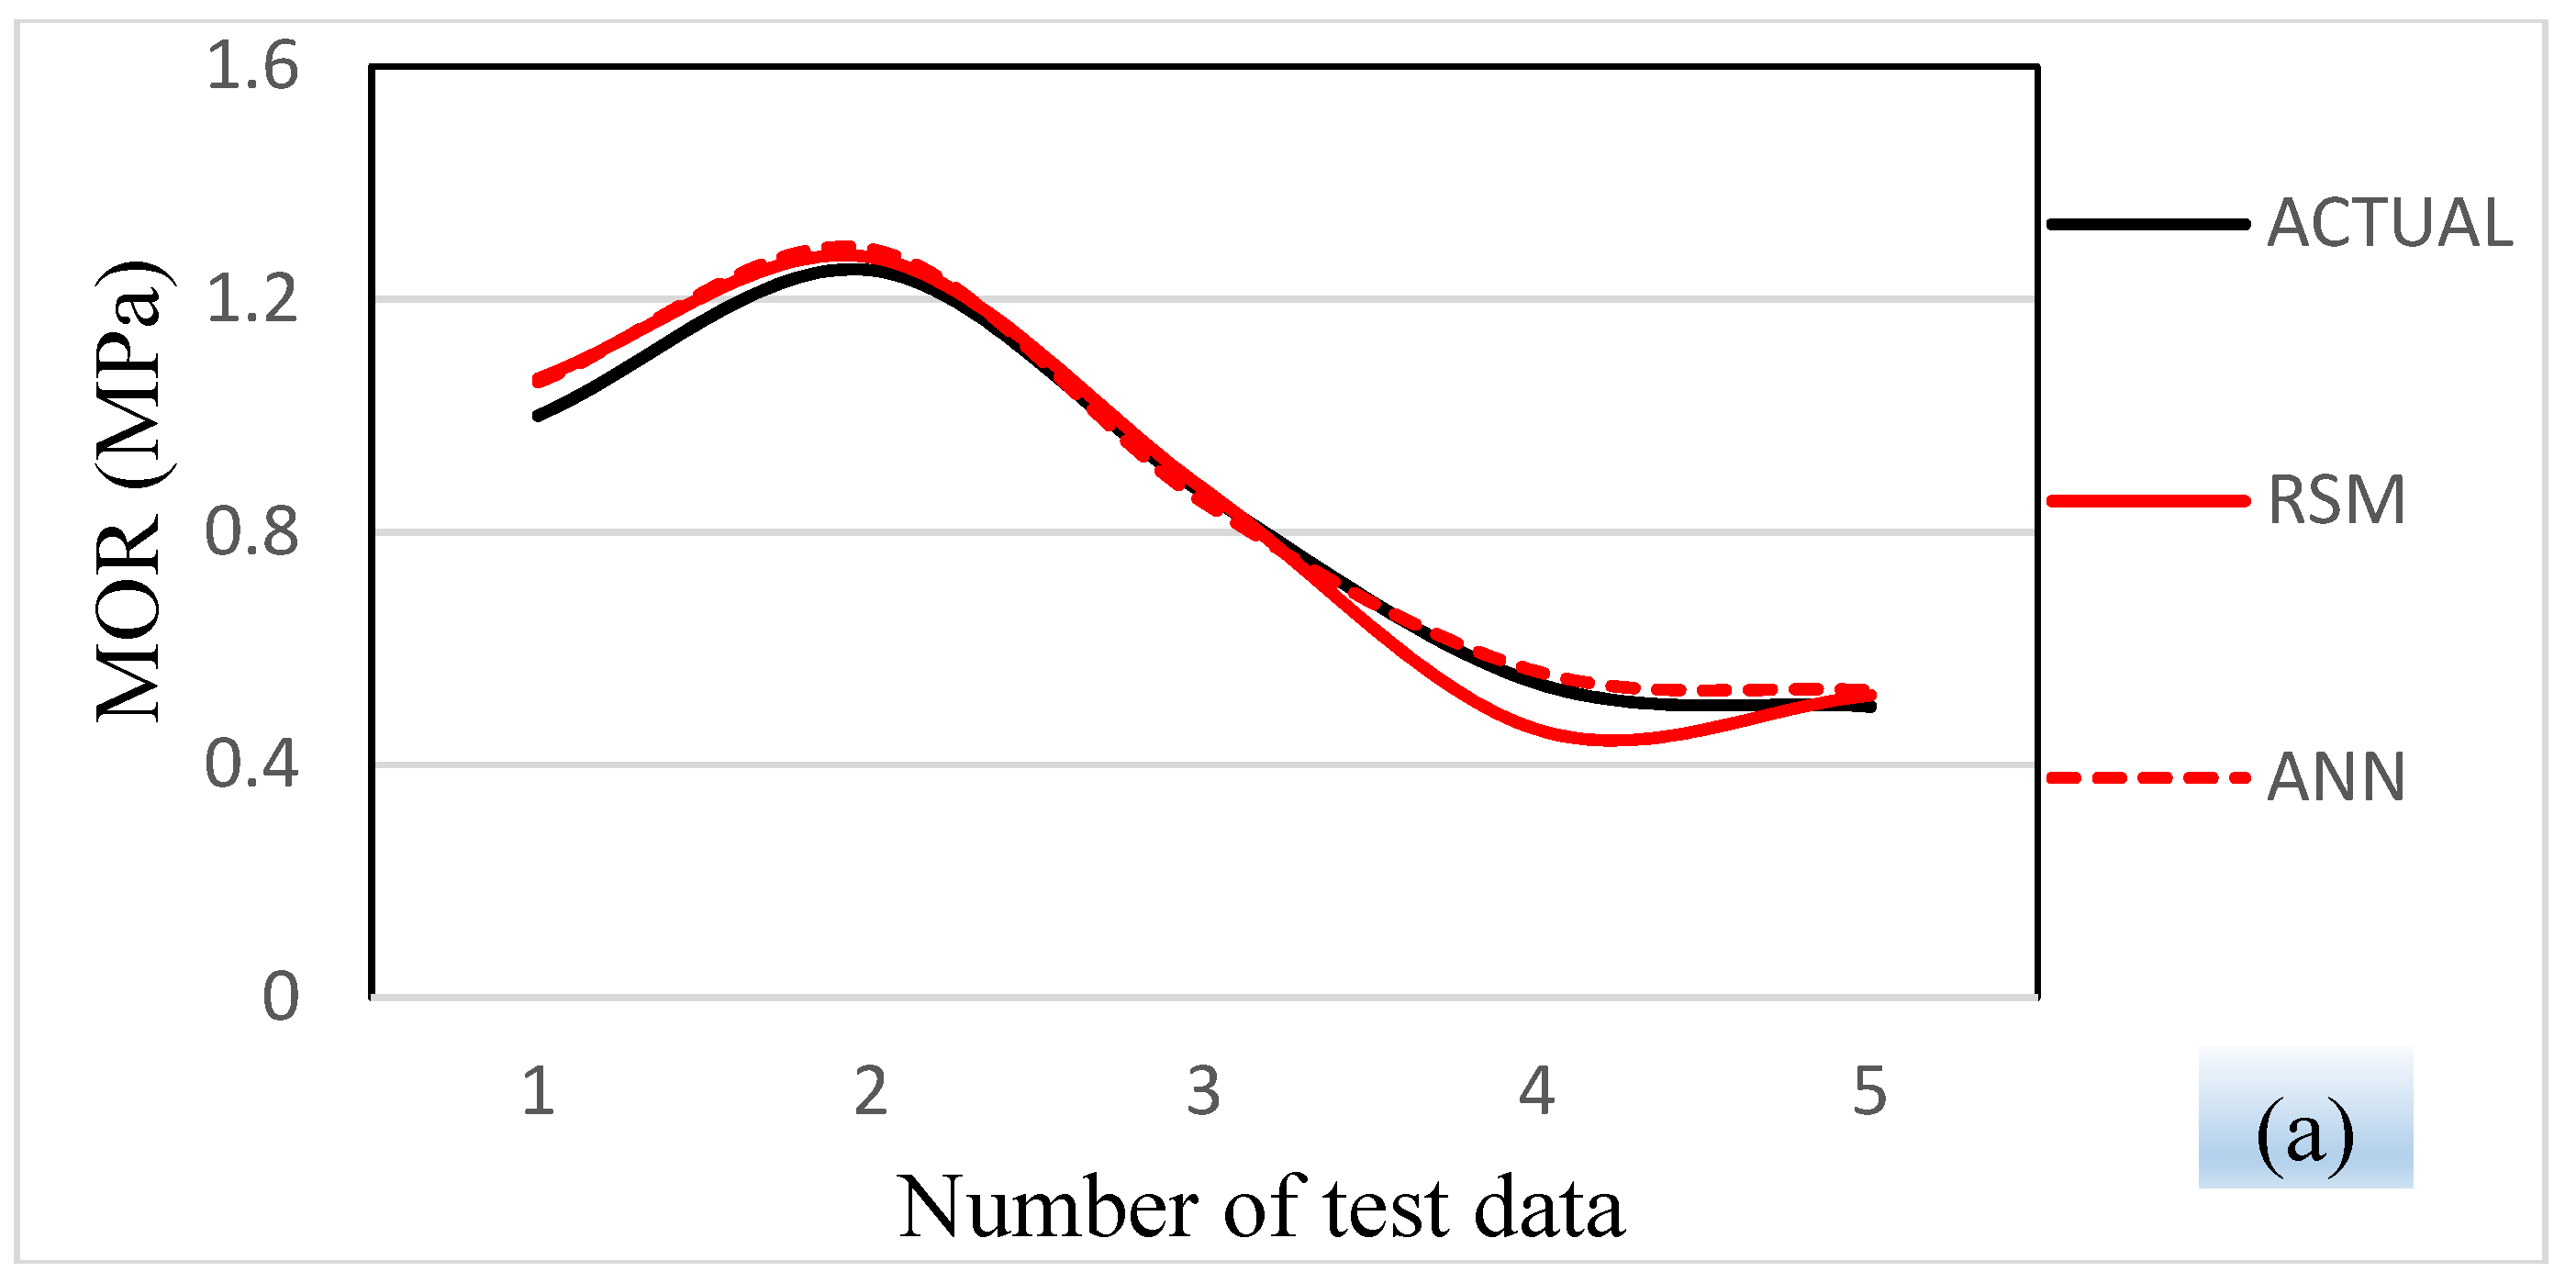
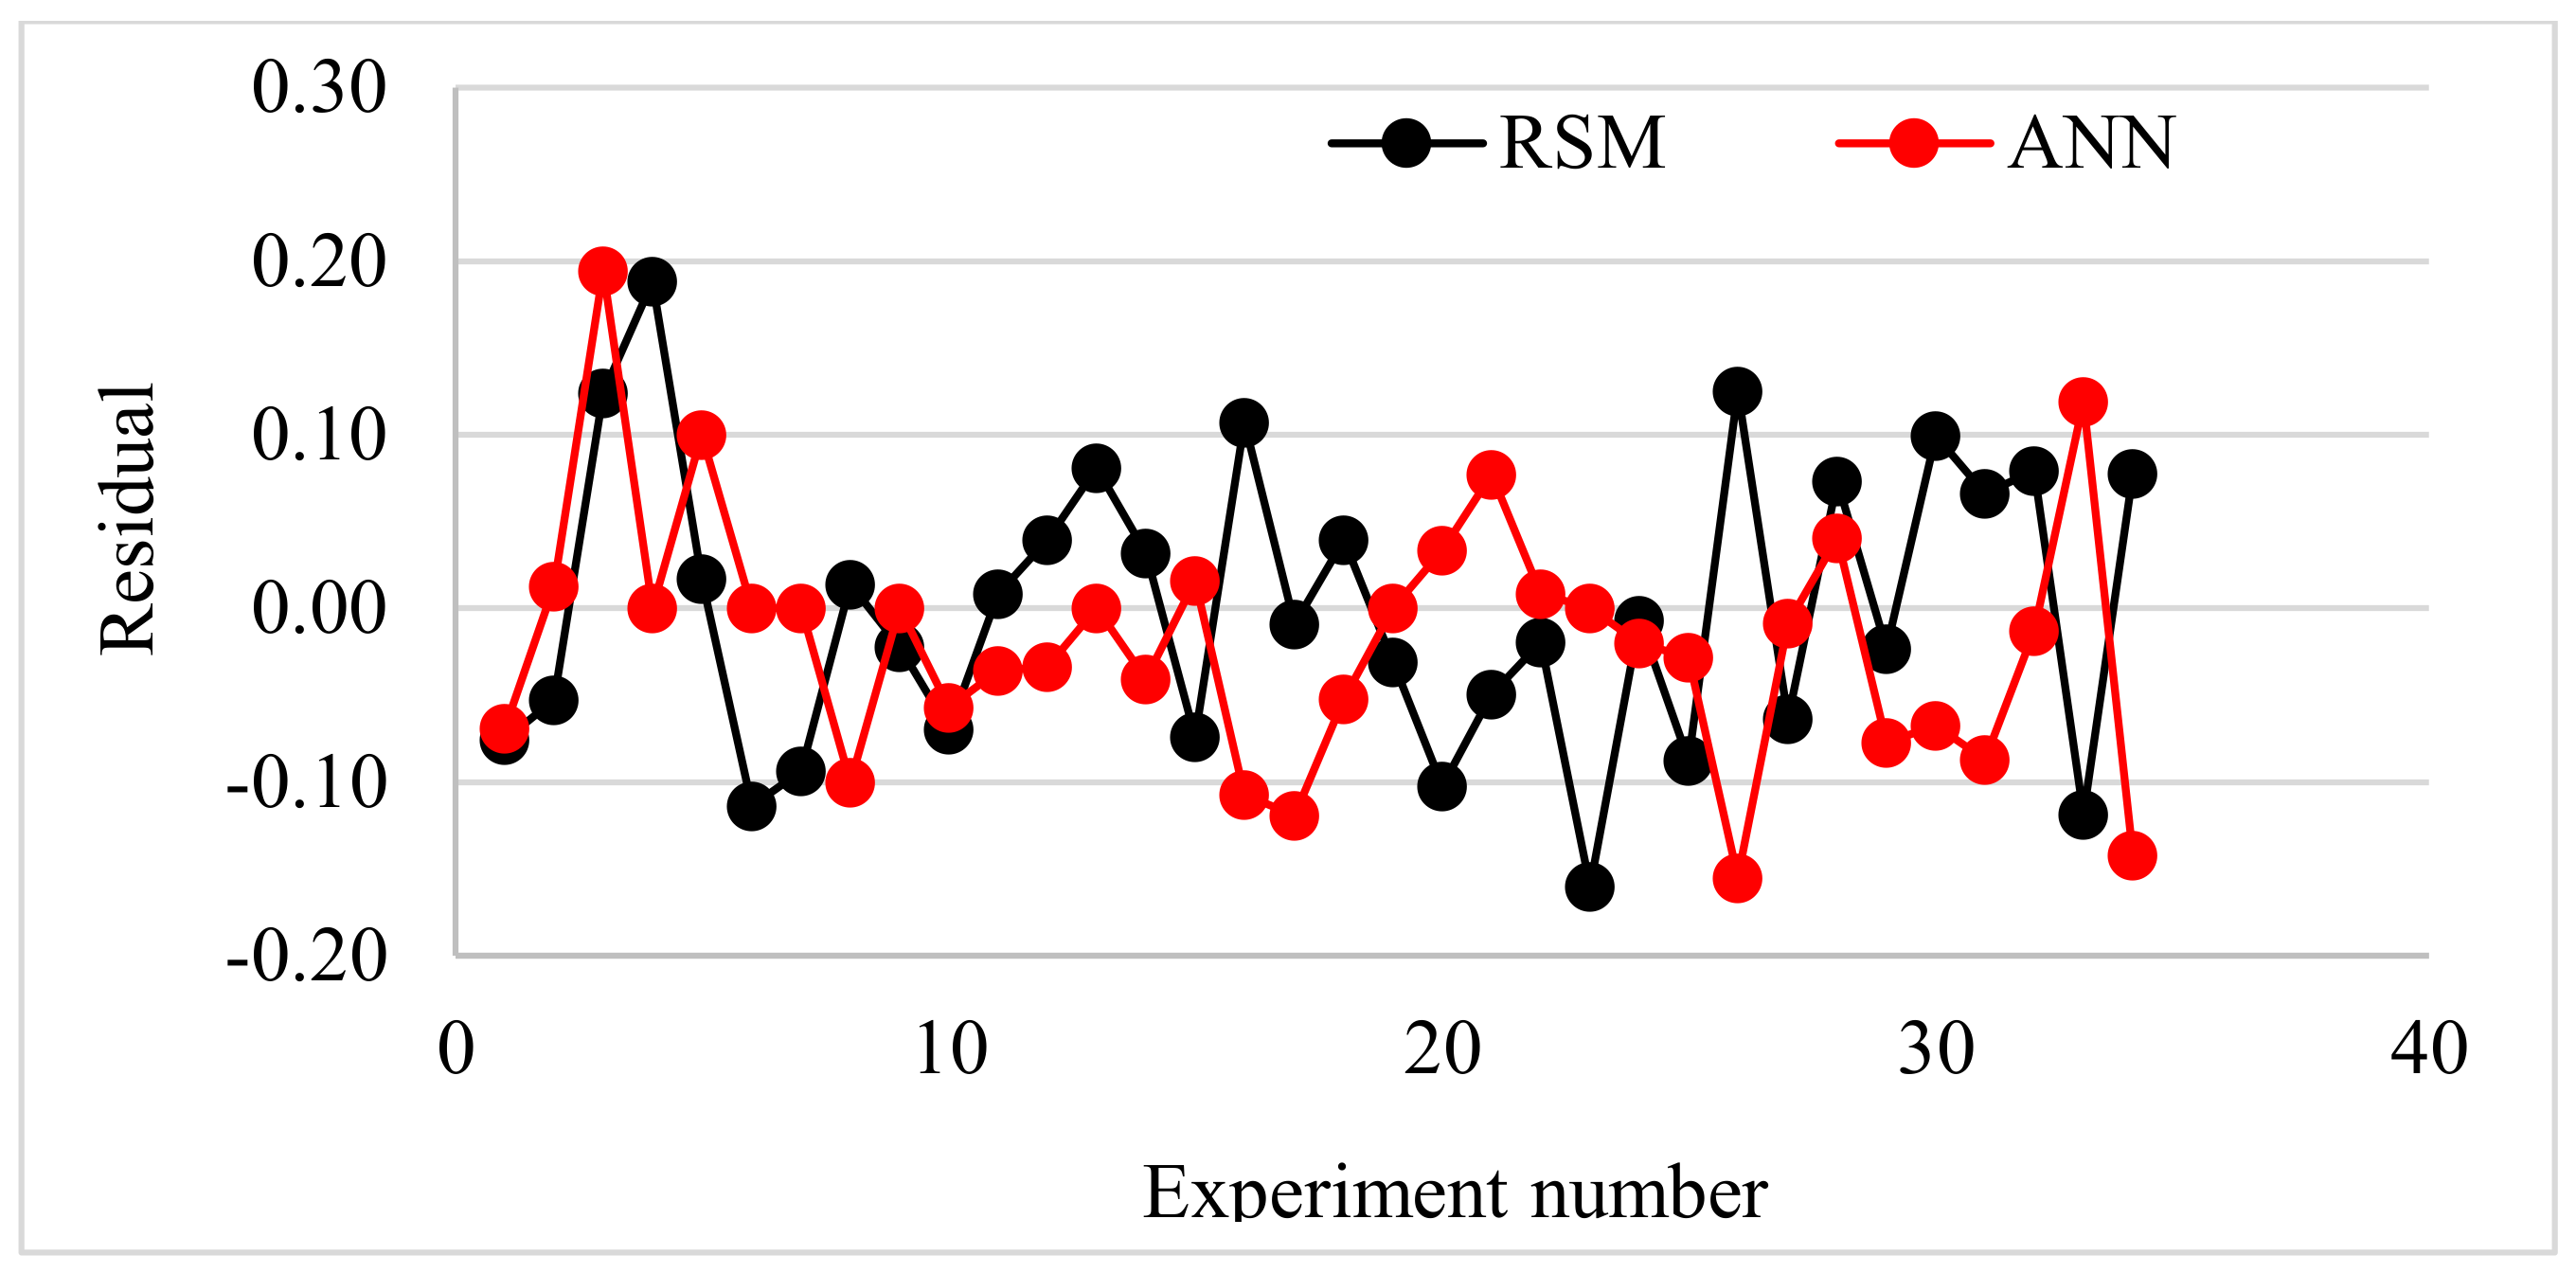
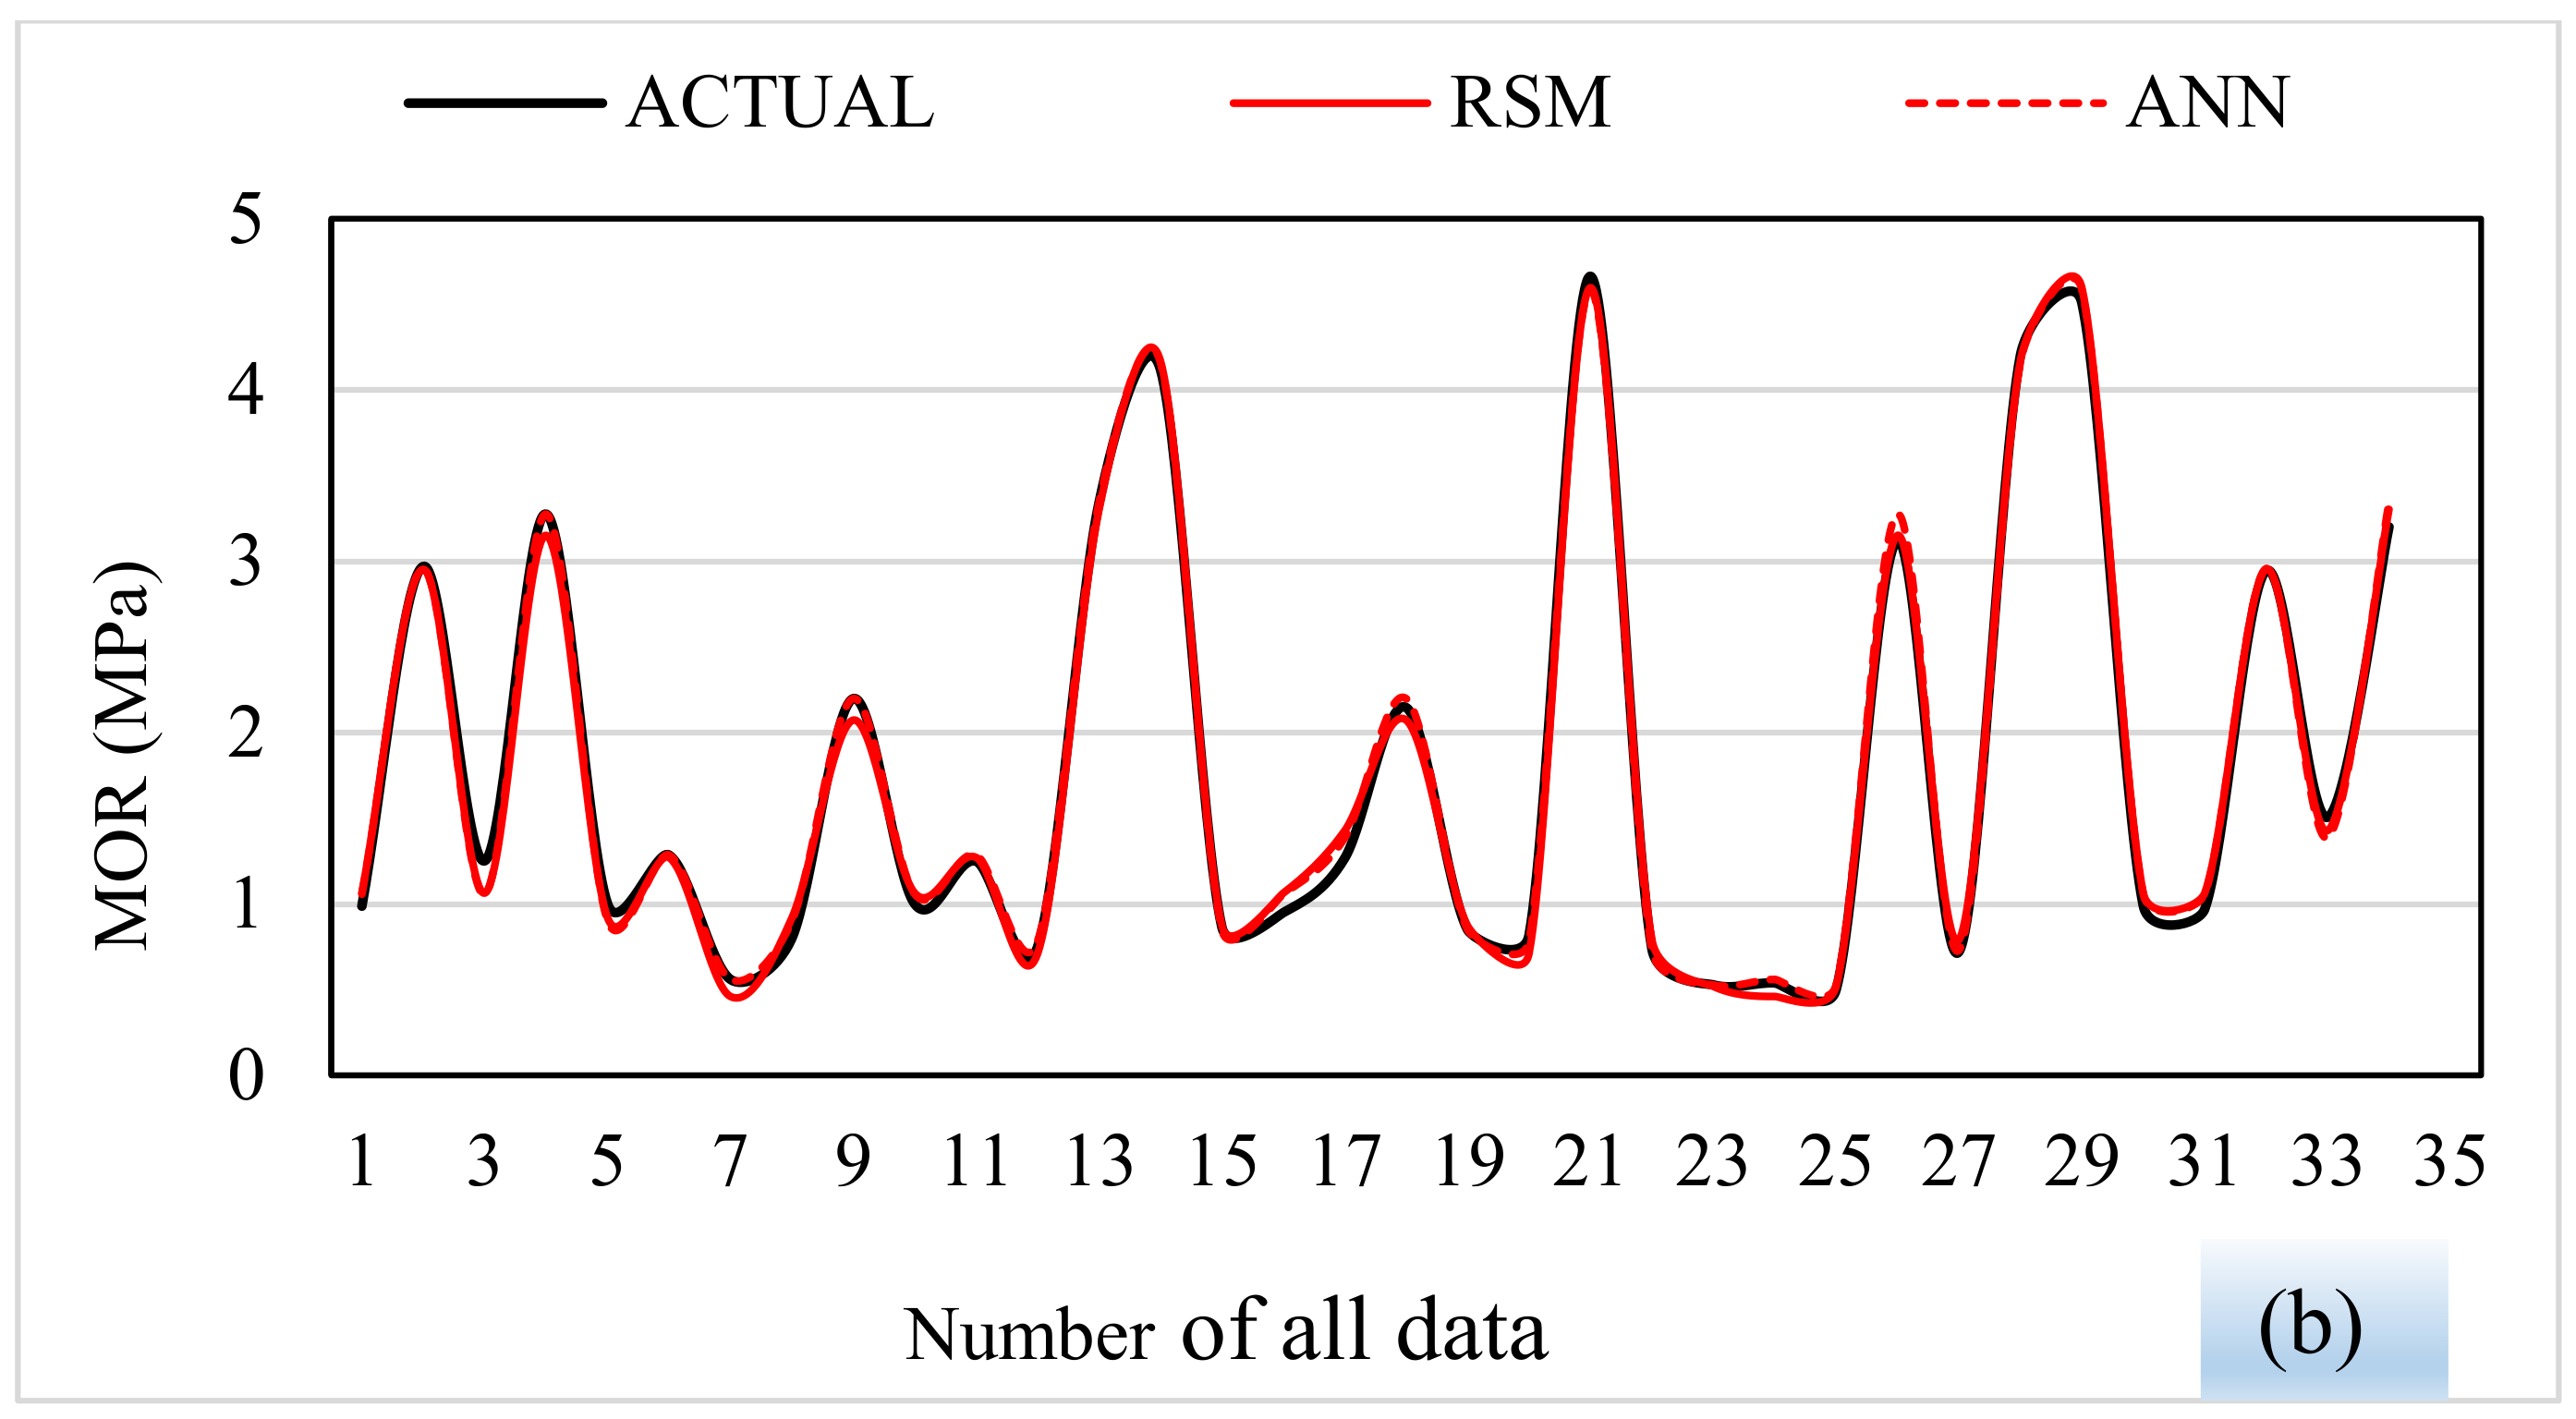
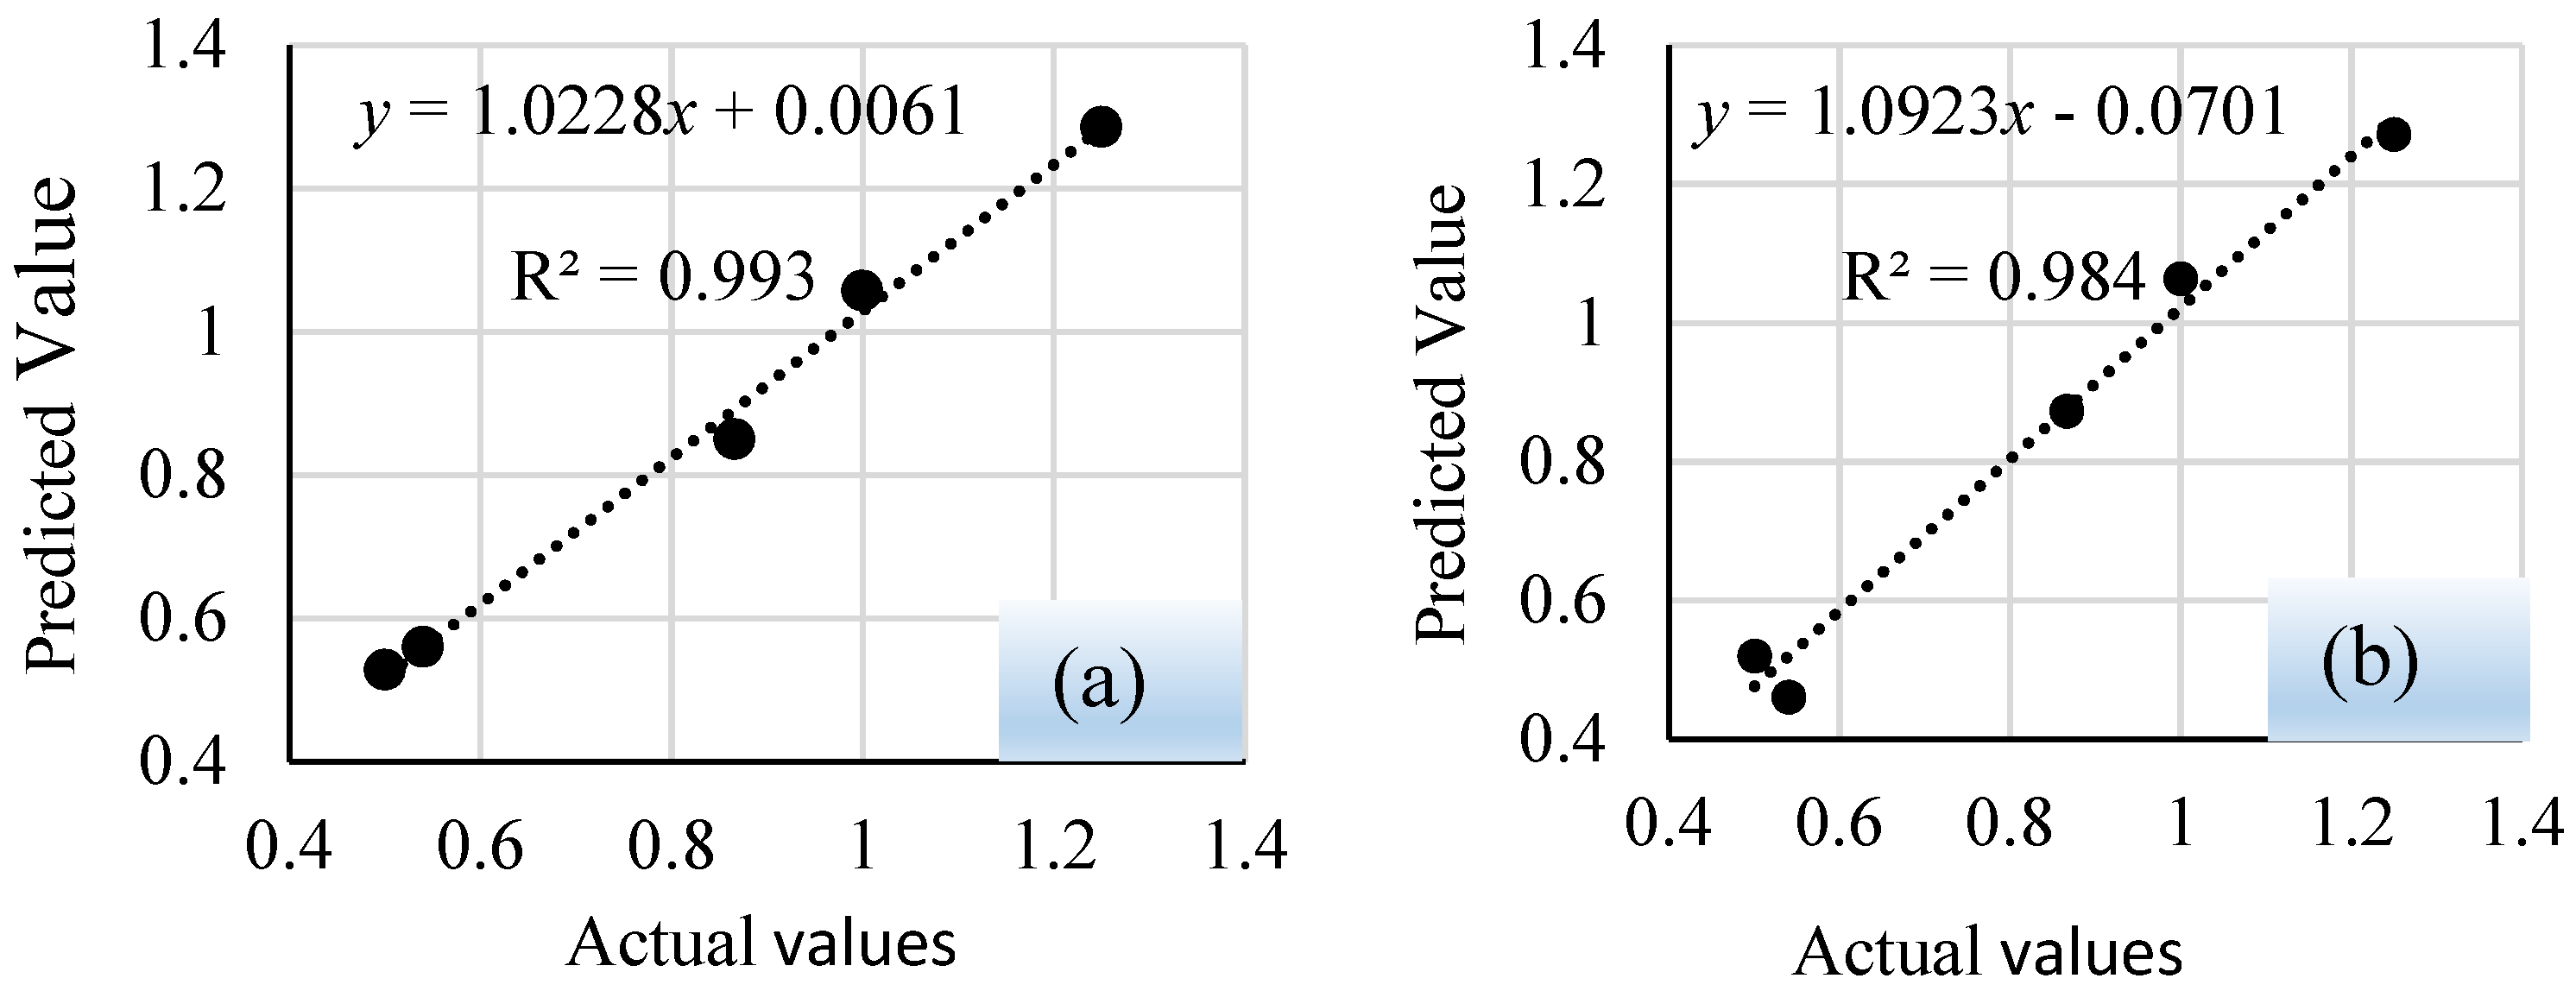
3.7. Comparison of the RSM and ANN Models
4. Conclusions
Author Contributions
Funding
Conflicts of Interest
References
- Qiu, K.; Zhanga, W.H.; Zhu, J.H. Bending and dynamic analyses of sandwich panels considering the size effect of sandwich core. Int. J. Sim. Multi. Des. Optimiz. 2009, 3, 370–383. [Google Scholar] [CrossRef] [Green Version]
- Styles, M.; Compston, P.; Kalyanasundaram, S. The effect of core thickness on the flexural behavior of aluminum foam sandwich structures. Compos. Struct. 2007, 80, 532–538. [Google Scholar] [CrossRef]
- Studzinski, R.; Pozorski, A. Experimental and numerical analysis of sandwich panels with hybrid core. J. Sandw. Struct. Mater. 2018, 20, 271–286. [Google Scholar] [CrossRef]
- Campbell, F.C. Structural Composite Material; ASM International: Novelty, OH, USA, 2010. [Google Scholar]
- Petras, A.; Sutclie, M.P.F. Indentation failure analysis of sandwich beams. Compos. Struct. 2000, 50, 311–318. [Google Scholar] [CrossRef]
- Dhaliwal, G.S.; Newaz, G.M. Flexural response of degraded polyurethane foam core sandwich beam with initial crack between facesheet and core. Materials 2020, 13, 5399. [Google Scholar] [CrossRef] [PubMed]
- Aviles, F.; Carlsson, L.A. Experimental study of debonded sandwich panels under compressive loading. J. Sandw. Struct. Mater. 2006, 8, 7–31. [Google Scholar] [CrossRef]
- Hao, J.; Wu, X.; Oporto-Velasquez, G.; Wang, J.; Dahle, G. Wood-based sandwich panels with a novel Taiji honeycomb core. Forests 2020, 11, 886. [Google Scholar] [CrossRef]
- Manaia, J.P.; Manaia, A.T.; Rodriges, L. Industrial hemp fibers: An overview. Fibers 2019, 7, 106. [Google Scholar] [CrossRef] [Green Version]
- Mohammadabadi, M.; Yadama, V.; Dolan, J.D. Evaluation of wood composite sandwich panels as a promising renewable building material. Materials 2021, 14, 2083. [Google Scholar] [CrossRef] [PubMed]
- Abdellah, M.Y.; Fahmy, H.S.; Abdel-Jaber, G.T.; Hashem, A.M. Characteristic properties of glass fiber reinforced sugarcane bagasse medium density fiber board. Cienc. E Tecnol. Dos Mater. 2017, 29, 97–105. [Google Scholar] [CrossRef]
- Hussain, M.; Abbas, N.; Zahra, N.; Sajjad, U.; Awan, M.B. Investigating the performance of GFRP/wood-based honeycomb sandwich panels for sustainable prefab building construction. SN Appl. Sci. 2019, 1, 875. [Google Scholar] [CrossRef] [Green Version]
- Hassan, M.K. Characterization of face sheet/core debonding strength in sandwiched medium density fiberboard. Mater. Sci. Appl. 2017, 8, 673–684. [Google Scholar] [CrossRef] [Green Version]
- Li, H.; Li, C.; Gao, Q.; Zhang, S.; Li, J. Properties of soybean-flour-based adhesives enhanced by attapulgite and glycerol polyglycidyl ether. Ind. Crops. Prod. 2014, 59, 35–40. [Google Scholar] [CrossRef]
- Lei, H.; Wu, Z.; Cao, M.; Du, G. Study on the soy protein-based wood adhesive modified by hydroxymethyl phenol. Polymers 2016, 8, 256. [Google Scholar] [CrossRef] [PubMed] [Green Version]
- Min, J.; Sun, X. Correlation between physical properties and shear adhesion strength of enzymatically modified soy protein-based adhesives. J. Am. Oil. Chem. Soc. 2015, 92, 1689–1700. [Google Scholar]
- Liu, C.; Zhang, Y.; Li, X.; Luo, J.; Gao, Q.; Li, J. Green” bio-thermoset resins derived from soy protein isolate and condensed tannins. Ind. Crops. Prod. 2017, 108, 363–370. [Google Scholar] [CrossRef]
- Qi, G.; Li, N.; Wang, D.; Sun, X. Physicochemical properties of soy protein adhesives modified by 2-octen-1-ylsuccinic anhydride. Ind. Crops. Prod. 2013, 46, 165–172. [Google Scholar] [CrossRef]
- Li, J.; Zhang, B.; Li, X.; Yi, Y.; Shi, F.; Guo, J.; Gao, Z. Effects of typical soybean meal type on the properties of soybean-based adhesive. Int. J. Adhes. Adhes. 2019, 90, 15–21. [Google Scholar] [CrossRef]
- Fakhri, A. Adsorption characteristics of graphene oxide as a solid adsorbent for aniline removal from aqueous solutions: Kinetics, thermodynamics and mechanism studies. J. Saudi Chem. Soc. 2017, 21, S52–S57. [Google Scholar] [CrossRef] [Green Version]
- Kalil, S.; Maugeri, F.; Rodrigues, M. Response surface analysis and simulation as a tool for bioprocess design and optimization. Process. Biochem. 2000, 35, 539–550. [Google Scholar] [CrossRef]
- Nazerian, M.; Razavi, S.A.; Partovinia, A.; Vatankhah, E.; Razmpour, Z. Prediction of the bending strength of a laminated veneer lumber (LVL) using an artificial neural network. Mech. Compos. Mater. 2020, 56, 649–664. [Google Scholar] [CrossRef]
- Shyam, A.; Kaul, S.; Kalsara, N.; Babu, T.N. Mechanical behavior and microscopic analysis of epoxy and E-glass reinforced banyan fibre composites with the application of artificial neural network and deep neural network for the automatic prediction of orientation. J. Compos. Mater. 2021, 55, 213–234. [Google Scholar] [CrossRef]
- Atoyebi, O.D.; Awolusi, T.F.; Davies, I.E.E. Artificial neural network evaluation of cement-bonded particle board produced from red iron wood (Lophira alata) sawdust and palm kernel shell residues. Case Stud. Constr. Mater. 2018, 9, e00185. [Google Scholar] [CrossRef]
- Awolusi, T.F.; Oke, O.L.; Akinkurolere, O.O.; Atoyebi, O.D. Comparison of response surface methodology and hybrid-training approach of artificial neural network in modelling the properties of concrete containing steel fibre extracted from waste tires. Cogent. Eng. 2019, 6, 1649852. [Google Scholar] [CrossRef]
- Qu, P.; Huang, H.; Wu, G.; Sun, E.; Chang, Z. The effect of hydrolyzed soy protein isolate on the structure and biodegradability of urea–formaldehyde adhesives. J. Adhes. Sci. Technol. 2015, 29, 502–517. [Google Scholar] [CrossRef]
- Luo, J.; Luo, J.; Bai, Y.; Gao, Q.; Li, J. A high performance soy protein-based bio-adhesive enhanced with a melamine/epichlorohydrin prepolymer and its application on plywood. RSC Adv. 2016, 6, 67669–67676. [Google Scholar] [CrossRef]
- Papadopoulous, E.; Kountouras, S.; Nikolaidou, Z.; Chrissafis, K.; Michailof, C.; Kalogiannis, K.; Lappas, A.A. Ureaformaldehyde (UF) resins prepared by means of the aqueous phase of the catalytic pyrolysis of European beech wood. COST Action FP1105. Holzforschung 2016, 70, 1139–1145. [Google Scholar] [CrossRef]
- Sing, M.; Kumar, M. Preparation and characterization of melamine-formaldehyde- polyvinylpyrrolidone polymer resin for better industrial uses over melamine resin. J. Appl. Poly. Sci. 2009, 114, 1870–1878. [Google Scholar] [CrossRef]
- Nishinari, K.; Fang, Y.; Guo, S.; Phillips, G. Soy proteins: A review on composition, aggregation and emulsification. Food Hydrocoll. 2014, 39, 301–318. [Google Scholar] [CrossRef]
- Luo, J.; Luo, J.; Zhang, J.; Bai, Y.; Gao, Q.; Li, J.; Li, L. A new flexible soy-based adhesive enhanced with neopentyl glycol diglycidyl ether: Properties and application. Polymers 2016, 8, 346. [Google Scholar] [CrossRef] [PubMed] [Green Version]
- Park, B.D.; Kim, Y.S.; Singh, A.P.; Lim, K.P. Reactivity, chemical structure, and molecular mobility of urea-formaldehyde adhesives synthesized under different conditions using FTIR and solidstate13C CP/MAS NMR spectroscopy. J. Appl. Polym. Sci. 2003, 88, 2677–2687. [Google Scholar] [CrossRef]
- Bacigalupe, A.; Molinari, F.; Eisenberg, P.; Escobar, M.M. Adhesive properties of urea-formaldehyde resins blended with soy protein concentrate. Adv. Compos. Hybrid Mater. 2020, 3, 213–221. [Google Scholar] [CrossRef]
- Zhang, W.; Sun, H.; Zhu, C.; Wan, K.; Zhang, Y.; Fang, Z.; Ai, Z. Mechanical and water-resistant properties of rice straw fiberboard bonded with chemically-modified soy protein adhesive. RSC Adv. 2018, 8, 15188–15195. [Google Scholar] [CrossRef] [Green Version]
- Leardi, R. Experimental design in chemistry: A tutorial. Anal. Chim. Acta 2009, 652, 161–172. [Google Scholar] [CrossRef]
- Ciric, A.; Krajnc, B.; Heath, D.; Ogrinc, N. Response surface methodology and artificial neural network approach for the optimization of ultrasound-assisted extraction of polyphenols from garlic. Food. Chem. Toxicol. 2020, 135, 110976. [Google Scholar] [CrossRef] [PubMed]
- Beg, Q.K.; Sahai, V.; Gupta, R. Statistical media optimization and alkaline protease production from Bacillus mojavensis in a bioreactor. Process. Biochem. 2003, 39, 203–209. [Google Scholar] [CrossRef]
- Koker, R.; Altinkok, N.; Demir, A. Neural network based prediction of mechanical properties of particulate reinforced metal matrix composites using various training algorithms. Mater. Des. 2007, 28, 616–627. [Google Scholar] [CrossRef]
- Ozdemir, O.; Karakuzu, R.; Al-Shamary, A.K.J. Core-thickness effect on the impact response of sandwich composites with poly (vinyl chloride) and poly (ethylene terephthalate) foam cores. J. Compos. Mater. 2014, 49, 1315–1329. [Google Scholar] [CrossRef]
- Hegde, S.R.; Hojjati, M. Effect of core and face sheet thickness on mechanical property of composite sandwich structures subjected to thermal fatigue. Int. J. Fatigue 2019, 127, 16–24. [Google Scholar] [CrossRef]
- Leckie, F.A.; Dal Bello, D.J. Strength and Stiffness of Engineering Systems; Mechanical Engineering Series; Springer Science & Business Media: Berlin/Heidelberg, Germany, 2009; p. 696. [Google Scholar]
- Jiang, K.; Zhang, J.; Xia, S.; Ou, C.; Fu, C.; Yi, M.; Li, W.; Jing, M.; Lv, W.; Xiao, H. Improve performance of soy protein adhesives with a low molar ratio melamine-urea-formaldehyde resin. J. Phys. Conf. Ser. 2020, 1549, 032083. [Google Scholar] [CrossRef]
- Haynes, C.A.; Norde, W. Structure and stabilities of adsorbed protein. J. Colloid Interf. Sci. 1995, 169, 313–328. [Google Scholar] [CrossRef]
- Wang, W.; Zhao, Z.; Gao, Z.; Guo, M. Whey protein-based water –resistant and environmentally safe adhesive for plywood. BioResources 2012, 6, 3339–3351. [Google Scholar]
- Nordqvist, P. Exploring the Wood Adhesive Performance of Wheat Gluten. Ph.D. Thesis, KTH Chemical Science and Engineering, KTH Royal Institute of Technology, Stockholm, Sweden, 2012. [Google Scholar]
- Somord, K.; Tawichai, N.; Soykeabkaew, N. Bio-based adhesive from wheat gluten. In Proceedings of the 26th Annual Meeting of the Thai Society for Biotechnology and International Conference, Chiang Rai, Thailand, 26–29 November 2014; pp. 92–100. [Google Scholar]
- Lorenz, L.; Frihart, C.R.; Wescott, J.M. Chromatographic analysis of the reaction of soy flour with formaldehyde and phenol for wood adhesives. J. Amer. Oil. Chem. Soc. 2007, 84, 769–776. [Google Scholar] [CrossRef]
- Qu, P.; Huang, H.; Wu, G.; Sun, E.; Chang, Z. Effects of hydrolysis degree of soy protein isolate on the structure and performance of hydrolyzed soy protein isolate/urea/formaldehyde copolymer resin. J. Appl. Polym. Sci. 2015, 132, 41469. [Google Scholar] [CrossRef]
- Gao, Q.; Qin, Z.; Li, C.; Zhang, S.; Li, J. Preparation of wood adhesive based on soybean meal modified with PEGDA as a crosslinker and viscosity reducer. BioResources 2013, 8, 5380–5391. [Google Scholar] [CrossRef] [Green Version]
- Williams, P.C. Implementation of near-infrared technology. In Near-Infrared Technology in the Agricultural and Food Industries, and Edition, 2nd ed.; Williams, P.C., Norris, K., Eds.; Journal of Agricultural & Food Industrial Organization: St. Paul, MN, USA, 2001; pp. 145–169. [Google Scholar]
- Fernandez, F.G.; de Palacios, P.; Esteban, L.G.; Garcia-Iruela, A.; Rodrigo, B.G.; Menasalvas, E. Prediction of MOR and MOE of structural plywood board using an artificial neural network and comparison with a multivariate regression model. Compos. B Eng. 2012, 43, 3528–3533. [Google Scholar] [CrossRef]
- Bardak, S.; Tiryaki, S.; Nemli, G.; Aydın, A. Investigation and neural network prediction of wood bonding quality based on pressing conditions. Int. J. Adhes. Adhes. 2016, 68, 115–123. [Google Scholar] [CrossRef]
- Bardak, S.; Tiryaki, S.; Bardak, T.; Aydin, A. Predictive performance of artificial neural network and multiple linear regression models in predicting adhesive bonding strength of wood. Strength Mater. 2016, 48, 811–824. [Google Scholar] [CrossRef]
- Demirkir, C.; Ozsahin, S.; Aydin, I.; Colakoglu, G. Optimization of some panel manufacturing parameters for the best bonding strength of plywood. Int. J. Adhes. Adhes. 2013, 46, 14–20. [Google Scholar] [CrossRef]
- Sarve, A.; Sonawane, S.S.; Varma, M.N. Ultrasound assisted biodiesel production from sesame (Sesamum indicum L.) oil using barium hydroxide as a heterogeneous catalyst: Comparative assessment of prediction abilities between response surface methodology (RSM) and artificial neural network (ANN). Ultrason. Sonochemistry 2015, 26, 218–228. [Google Scholar] [CrossRef]


| Appearance Characterization | Thick and Yellowish |
|---|---|
| Viscosity at 25 °C | 1200–1600 mPa.s |
| Specific gravity | 1.1 g/cm3 |
| Consumption time | 6 months after producing |
| Appearance Characterization | Thin and Brownish |
|---|---|
| Viscosity at 25 °C | 180–270 mPa.s |
| Specific gravity | 1.23 g/cm3 |
| Consumption time | 6 months after producing |
| Coded Values | Actual Values | MOR (MPa) | |||||
|---|---|---|---|---|---|---|---|
| X1 | X2 | X3 | MR | TP | WR | ||
| Factorial points | −1 | 1 | 1 | 1.68 | 30 | 70 | 0.739 |
| 1 | −1 | −1 | 1.93 | 10 | 30 | 3.276 | |
| −1 | −1 | −1 | 1.68 | 10 | 30 | 2.971 | |
| 1 | 1 | −1 | 1.93 | 30 | 30 | 1.286 | |
| 1 | 1 | −1 | 1.93 | 30 | 30 | 1.25 | |
| −1 | 1 | 1 | 1.68 | 30 | 70 | 0.725 | |
| −1 | 1 | −1 | 1.68 | 30 | 30 | 0.528 | |
| 1 | 1 | 1 | 1.93 | 30 | 70 | 1 | |
| 1 | −1 | 1 | 1.93 | 10 | 70 | 4.202 | |
| −1 | −1 | −1 | 1.68 | 10 | 30 | 2.945 | |
| 1 | −1 | −1 | 1.93 | 10 | 30 | 3.121 | |
| 1 | −1 | 1 | 1.93 | 10 | 70 | 4.121 | |
| −1 | 1 | −1 | 1.63 | 30 | 30 | 0.5 | |
| −1 | −1 | 1 | 1.63 | 10 | 70 | 4.51 | |
| −1 | −1 | 1 | 1.63 | 10 | 70 | 4.664 | |
| 1 | 1 | 1 | 1.93 | 30 | 70 | 0.8 | |
| Axial points | −1 | 0 | 0 | 1.63 | 20 | 50 | 0.75 |
| −1 | 0 | 0 | 1.63 | 20 | 50 | 0.8173 | |
| 0 | −1 | 0 | 1.8 | 10 | 50 | 3.343 | |
| 0 | −1 | 0 | 1.8 | 10 | 50 | 3.202 | |
| 0 | 0 | −1 | 1.8 | 20 | 30 | 1.268 | |
| 1 | 0 | 0 | 1.93 | 20 | 50 | 0.866 | |
| 0 | 0 | 1 | 1.8 | 20 | 70 | 2.199 | |
| 0 | 0 | 1 | 1.8 | 20 | 70 | 2.147 | |
| 1 | 0 | 0 | 1.93 | 20 | 50 | 0.85 | |
| 0 | 1 | 0 | 1.8 | 30 | 50 | 0.56 | |
| 0 | 1 | 0 | 1.8 | 30 | 50 | 0.54 | |
| 0 | 0 | −1 | 1.8 | 20 | 30 | 1.506 | |
| Center points | 0 | 0 | 0 | 1.8 | 20 | 50 | 0.988 |
| 0 | 0 | 0 | 1.8 | 20 | 50 | 1.252 | |
| 0 | 0 | 0 | 1.8 | 20 | 50 | 0.95 | |
| 0 | 0 | 0 | 1.8 | 20 | 50 | 0.97 | |
| 0 | 0 | 0 | 1.8 | 20 | 50 | 0.99 | |
| 0 | 0 | 0 | 1.8 | 20 | 50 | 1 | |
| Source | Sum of Squares | DF | Mean Square | F Value | p-Value Prob > F | ||
|---|---|---|---|---|---|---|---|
| Regression | 108.84 | 1 | 108.84 | ||||
| Linear | 42.62 | 3 | 14.21 | 30.21 | <0.0001 | ||
| Square | 2.58 | 3 | 0.86 | 2.01 | 0.1357 | ||
| Quadratic | 11.3 | 3 | 3.77 | 395.09 | <0.0001 | ||
| Cubic | 0.054 | 4 | 0.014 | 1.56 | 0.2237 | ||
| Lack of Fit Tests | |||||||
| Linear | 2FI | Quadratic | Cubic | ||||
| <0.0001 | <0.0001 | 0.1546 (suggested) | 0.1329 | ||||
| Response | Regression Model | Model p-Value | c.v. (%) | Adequate Precision | R2 |
|---|---|---|---|---|---|
| Adj. R2 | |||||
| Y (MOR) | 1.06 + 0.0813 × 1 − 1.42 × 2 + 0.3226 × 3 + 0.1386 × 1 × 2 − 0.1563 × 1 × 3 − 0.3429 × 2 × 3 − 0.2721 × 12 + 0.8181 × 22 + 0.6871 × 32 | <0.0001 | 5.46 | 78.117 | 0.9960 |
| 0.9673 |
| Indices | Model | |
|---|---|---|
| RSM | ANN | |
| R2 | 0.9960 | 0.9969 |
| Adjusted R2 | 0.9673 | 0.9945 |
| AAD | 1.28 | 0.43 |
| RMSE | 1.98 | 0.56 |
| MAPE | 3.45 | 1.04 |
Publisher’s Note: MDPI stays neutral with regard to jurisdictional claims in published maps and institutional affiliations. |
© 2021 by the authors. Licensee MDPI, Basel, Switzerland. This article is an open access article distributed under the terms and conditions of the Creative Commons Attribution (CC BY) license (https://creativecommons.org/licenses/by/4.0/).
Share and Cite
Nazerian, M.; Naderi, F.; Partovinia, A.; Papadopoulos, A.N.; Younesi-Kordkheili, H. Modeling the Bending Strength of MDF Faced, Polyurethane Foam-Cored Sandwich Panels Using Response Surface Methodology (RSM) and Artificial Neural Network (ANN). Forests 2021, 12, 1514. https://doi.org/10.3390/f12111514
Nazerian M, Naderi F, Partovinia A, Papadopoulos AN, Younesi-Kordkheili H. Modeling the Bending Strength of MDF Faced, Polyurethane Foam-Cored Sandwich Panels Using Response Surface Methodology (RSM) and Artificial Neural Network (ANN). Forests. 2021; 12(11):1514. https://doi.org/10.3390/f12111514
Chicago/Turabian StyleNazerian, Morteza, Fateme Naderi, Ali Partovinia, Antonios N. Papadopoulos, and Hamed Younesi-Kordkheili. 2021. "Modeling the Bending Strength of MDF Faced, Polyurethane Foam-Cored Sandwich Panels Using Response Surface Methodology (RSM) and Artificial Neural Network (ANN)" Forests 12, no. 11: 1514. https://doi.org/10.3390/f12111514
APA StyleNazerian, M., Naderi, F., Partovinia, A., Papadopoulos, A. N., & Younesi-Kordkheili, H. (2021). Modeling the Bending Strength of MDF Faced, Polyurethane Foam-Cored Sandwich Panels Using Response Surface Methodology (RSM) and Artificial Neural Network (ANN). Forests, 12(11), 1514. https://doi.org/10.3390/f12111514