Abstract
The present study documents a positive market reaction to mergers and acquisition (M&A) deals involving renewable energy companies. Acquirers record positive post-deal cumulative risk-adjusted returns upon taking over a renewable energy target, especially if the former also operates in the renewable energy sector. Such deals often involve purchases of majority equity stakes financed with acquirers’ stock rather than cash. Acquirers of renewable energy firms tend to be more profitable and cash-rich than their industry peers, yet they are less likely to be serial acquirers and channel cash reserves towards M&As. We evidence that the quality of corporate governance in the energy sector may play a substantial role in shaping the choice of targets; a director’s outside affiliations increase the likelihood of takeovers of non-energy firms, while the presence of outsiders on board appears to incentivize diversification into renewable energy. While acquisitions of renewable energy firms feature lower-than-average acquisition premia and generate positive short-term stock returns, they are found to exercise an overall negative short- and medium-term impact on the combined entities’ operating performance. Overall, capital markets appear to attach a sizeable premium to risky deals involving renewable energy firms, possibly in expectation of wealth accrual in the long term.
1. Introduction
With the energy sector seeking to diversify away from fossil fuels under increasing regulatory pressure, renewable energy has seen a remarkable influx of long-term capital. Following a rapid organic expansion of the past decade, the industry is now gradually entering the phase of consolidations aimed at increasing business efficiency and maximizing the benefits of scale [1,2]. The complexity and capital intensity of advanced energy generation technologies require the mobilization of ever-increasing amounts of capital to bring energy projects to fruition and ensure satisfactory internal investment return. It is, therefore, in line with expectations that the value and number of corporate acquisitions in the renewable energy sector have been increasing at a double-digit pace over the last decade [3].
The logical question that accompanies the rapid growth of mergers and acquisitions (M&A) activities of energy firms is whether consolidations increase shareholder value, improve operational efficiency, and strengthen the combined entities’ competitive edge. The performance records of M&As in other sectors are controversial [4]. The extant literature frequently reports failures of M&As at delivering persistent long-term gains in operating outcomes and shareholder value [5]. The present study reveals a comprehensive assessment of the historical record of M&A deals completed by European energy companies featuring targets from the renewable energy sector.
First, the study seeks to identify the key characteristics of transactions involving renewable energy targets, which distinguish them from other sectors. We analyse the determinants of target choice, the transaction parameters, and the attributes of acquirers increasing their propensity to venture into the renewable energy sector. Secondly, we attempt to quantify the short-term shareholder wealth effects of deal completion from the standpoint of acquirers’ shareholders. To that end, we calculate cumulative risk-adjusted returns on acquirers’ stocks over event windows encompassing deal completion [6,7,8]. Thereby, we try to establish the direction and magnitude of market reaction to corporate consolidations in the energy sector. Finally, we quantify the short- and medium-term impact of renewable energy targets’ takeovers on acquirers’ operational performance, which is one of the key metrics for assessing deal outcomes [9,10].
The paper relies on a representative sample of 1088 M&A transactions completed by 255 public energy companies domiciled across 22 E.U. countries between 1990 and 2020. Of these, 108 deals involve targets from the renewable energy sector and are, hence, the focus of the present study.
The problems explored in the study are of significant practical relevance for managers in the energy sector since the overwhelming majority of energy firms envisage inorganic expansion through M&As at some point in the future or contemplate serial acquisitions as a strategy complementing and, in some cases, even substituting for internal growth. Diversification also represents one of the pressing priorities on the agenda of energy executives due to systemic transformations in the fossil fuel industry [11]. Conventional hydrocarbons are more and more frequently perceived as raw materials for the petrochemical industry [12] rather than a source of energy. Thus, shifts in the value chain in the energy sector prompt firms to re-combine their resources and re-formulate their long-term strategies.
The findings presented in the paper point to an overwhelmingly bullish market reaction to M&A deals involving renewable energy targets. By far, the highest cumulative returns are recorded for transactions whereby renewable energy firms consolidate among themselves. However, energy firms reliant on fossil fuel and taking over renewable energy companies also experience a short-term boost to their market value. We find evidence that takeovers of renewable energy companies are concentrated among the sector’s most profitable and cash-rich firms, which may inflate targets’ valuations and acquisition premia. Our findings corroborate this conjecture. We find that renewable energy targets enjoy significantly above-average acquisition premia and valuation multiples. Interestingly, the positive market reaction to M&As persists despite the fact that such deals put a medium-term drag on acquirers’ operating performance. Our findings suggest that the overall business profitability of combined entities declines significantly within the first two years following transaction completion.
Finally, delving into the governance mechanisms, which may shape the choice of renewable energy targets by acquirers, we document the following two patterns. First, supervisory board members’ external affiliations (i.e., directorships within other companies) increase the likelihood of takeovers of non-energy companies by energy conglomerates. Whether such acquisitions produce long-term shareholder gains remains to be investigated. However, we show that the short-term wealth effects of such deals is neutral at best. Secondly, our findings suggest that firms with a higher percentage of outside directors on boards are more likely to acquire renewable energy targets. Thus, we unveil one of the possible transmission channels between board structure and diversification in the energy sector [13].
The remainder of the paper is structured as follows. First, we present an overview of extant empirical literature exploring the shareholder wealth effects of M&As in the energy sector. Section 3 presents our research design and introduces the dataset. Section 4 summarizes the principal empirical findings obtained through econometric and statistical analysis. Finally, a discussion of critical econometric findings and policy implications concludes.
2. Literature Review and Research Questions
The consolidation processes in the energy sector appear to be driven by three primary factors: commodity cycles, technological changes, and top-down regulatory pressure. The first two have preconditioned several major consolidation waves in the energy sector in the past. A good example would be a decline in the number of fracking companies [14] following a drop in oil prices in the second half of the 2010s. The process was fuelled by the search for cost optimization and value recovery in the capital-intensive industry. The fracking itself was brought about by technological advances and prompted a significant overhaul in the industry [15], which had to face a rapid supply influx.
The third factor—regulatory action—has recently gained prominence with the promulgation of new regulations seeking to accelerate the energy sector’s transition towards environmentally sustainable operations [16]. In addition, the market mechanisms shaping economic incentives in the industry have been modified [17] to make renewable energy more competitive. Some industry leaders placed risky long-term bets on the rapid growth of renewable generation and earmarked significant reserves for increasing renewable energy generating capacity. Executives are still pondering the strategies of entering the renewable energy market, with two possible solutions being on the table. The first one consists in channelling internally generated resources towards in-house technology development and deployment. The second, and possibly, more frequently opted for, is an acquisition of an already operating renewable energy company and its subsequent integration [18,19] into the core business.
The benefits of M&As involving renewable energy companies materialize through two primordial channels. The first one is the economy of scale. Creating larger business entities through corporate consolidation allows for the optimization of administrative overheads, reduction of procurement costs, and improvement of managerial processes [20]. The costs of servicing energy infrastructure may also be slashed thanks to the latter’s density increase. The second effect ensuing from consolidations is an increase in market power [21]. The resulting economic benefits include greater pricing power, better ability to prepare long-term cost-volume-profit analysis, and more robust market control. Larger companies also wield greater influence over regulatory bodies through lobbing and senior officers’ external affiliations. Re-combining entities operating at different stages of the value chain (vertically and horizontally) may also allow for sizeable synergies by diversifying the combined entities’ offers and creating lower-cost bundles of commoditized services. The latter factor is the most crucial consolidation engine [22] within industries offering standardized products and services.
For fossil-fuel businesses, acquisitions of renewable energy companies also represent interesting diversification opportunities. The increasing top-down pressure to move away from hydrocarbons increases fundamental risks inherent in the energy sector. The result is an increase in the cost of capital for firms remaining highly dependent on fossil fuel, a reduction in the availability of external financing [23], and a significant discount attached to polluters’ stocks. Purchases of renewable energy firms by vertically integrated oil and gas companies, therefore, allow the latter to accomplish two important tasks. The first is the diversification of revenue sources. The second is creating a renewable energy division, which would drive the long-term growth of the energy firms’ value.
The perceived economic benefits of corporate consolidations have contributed to a rapid increase in the number of deals concluded over the last decade. The outcomes of those deals in terms of shareholder value accrual and customer surplus have, however, been mixed [24].
The literature on the metrics and determinants of success and failure in M&A is rich in terms of both methodology and empirical material. The majority of studies are based on an event study toolkit [25]. Research concerning the energy sector points to several key empirically observable patterns. First, the short-term shareholder wealth effects of such deals are frequently neutral and even negative [26]. This is possibly due to the fact that the anticipated synergies are significantly more difficult to extract, especially in case of horizontal acquisitions (for example, involving only downstream or retail companies) [27,28]. Another possible explanation for the lack of positive short-term stock price shifts is overpayment for targets. Historically, the energy sector was perceived as a prime example for demonstration of agency problems [29]. Highly cyclical in nature and frequently experiencing influxes of cash, the energy sector has long exhibited a high propensity to channel internally generated cash flows towards inorganic growth, costly infrastructure projects with uncertain payoff profiles, and vertical diversification motivated by risk management considerations. At the same time, energy sector consolidations have conventionally been regarded with suspicion by competition regulators [30,31,32]. Thus, a combination of fundamental factors and regulatory hurdles make M&As in the energy sector challenging to implement throughout all stages—negotiation, regulatory approval, completion, and integration.
Despite the relative abundance of studies investigating the effects of M&As involving conventional energy firms, relatively few focus on deals involving renewable energy companies. Such relative scarcity of topic-specific research, particularly on the European market, appears to stem from the insufficiency of empirical data. The number of M&As featuring renewable energy companies as either acquirers or targets remains relatively low: the share of deals with such targets in the population of transactions completed by all vertically integrated energy companies persistently remains below 10%. The small sample size creates substantial methodological problems, particularly in the context of application of event study methodology. Aimed at addressing the said research gap, the present study attempts to answer the following research questions:
RQ1. What are the short-term shareholder wealth effects of acquisitions involving renewable energy companies?
By exploring these questions, we try to establish whether taking over renewable energy firms might generate positive value gains for acquirers’ shareholders. Along the way, we also check whether the market reaction to M&As is contingent upon the type of acquirers, i.e., whether the acquirer is a renewable energy or fossil fuel company.
In line with the extant literature, we also formulate a number of testable hypotheses, which derive from the research questions and allow to better convey the principal goal of the study. The first one concerns the short-term shareholder wealth effects of M&A deals involving renewable energy companies:
Hypothesis 1 (H1).
M&A deals involving renewable energy targets generate a positive short-term market reaction.
RQ2. What are the structural characteristics of firms acquiring renewable energy companies?
Since the renewable energy sector entered the phase of active consolidation relatively recently, it remains unclear which companies are leading the wave and which factors pre-determine their decision to acquire renewable energy targets. Therefore, we analyse several distinct sets of factors, which may underlie similar strategic decisions: (1) acquirer financials; (2) terms of deal settlements; (3) acquirers’ corporate governance settings.
The principal research question (RQ2) may be broken down into the following testable hypotheses:
Hypothesis 2 (H2).
Leaders in the energy sector (based on market share) exhibit a higher propensity to participate in M&A transactions involving renewable energy companies.
Hypothesis 3 (H3).
Acquirers’ cash reserves and debt capacity increase their propensity to engage in M&A activities involving renewable energy targets.
RQ3. What are the terms of M&As involving renewable energy companies compared to other deals completed by vertically integrated energy companies?
Answers for the first two research questions logically lead to the third. Post-deal shareholder wealth effects, operational performance of the combined entities, and the ultimate approval of deal completion are all contingent upon the financial terms of transactions. We compare deals involving renewable energy targets against the remainder of M&As completed by energy companies along the following three dimensions: (1) terms of payment (stock vs. cash); (2) valuation multiples at which deals are finalized; (3) average acquisition premia for publicly listed renewable energy targets. The inference relying on all metrics should be consistent to provide generalizable evidence.
RQ3 may be broken down into the following testable hypotheses:
Hypothesis 4 (H4).
M&As involving renewable energy targets take a shorter period of time to complete.
Hypothesis 5 (H5).
Deals involving publicly listed renewable energy companies are finalized at higher acquisition premia.
Ultimately, providing answers to the enumerated research questions allows us to comprehensively characterize corporate consolidations on the renewable energy market from the financial standpoint. Industry reports stress the dangers of possible overpayment for renewable energy firms as well as subsequent post-transaction integration challenges. At this point, it is worth underlining the principal hurdles which may be encountered by acquirers contemplating inorganic entrance into the renewable energy sector.
To start with, despite immense progress in cost optimization in the renewable energy industry [33], many companies, particularly those at early stages of the lifecycle, remain loss-making. The heroic assumptions regarding the sector’s long-term prospects coupled with contemporaneous operational difficulties within young renewable energy companies create immense valuation uncertainty [34], which in turn increases the likelihood of acquisition overpricing. Since most targets are significantly smaller than their acquirers, the latter tend to underestimate integration costs and overestimate future synergies from the sector-wide growth. Hoping to take over the target, while it remains small and opaque to the broad capital markets, acquirers may be likely to reduce the scope of due diligence and negotiate as quickly as possible. Under such settings, the targets’ shareholders enjoy significant bargaining power [35] and an advantage in accessing material non-public information [36]. Both increase the likelihood of overpayment by acquirers. The fact that most renewable energy companies remain private adds to the complexity of target valuation.
Secondly, for most acquirers, renewable energy generation represents an entirely new line of business, which has technological and organizational intricacies absent from conventional energy production. Acquirers, particularly those operating in the fossil fuel industry, may lack relevant expertise [37] and the managerial capabilities to ensure smooth post-deal integration. Prior studies [38] have demonstrated that dissimilarity of business lines of acquirers and targets may undermine short- and medium-term outcomes precisely because of lack of acquaintance with new business specificity on the part of acquirers. Managers without the relevant background may be reluctant to slash excess overheads or venture into unfamiliar areas, thus dragging the organic growth of targets’ core operations. Managers also tend to underestimate the scale of necessary R&D expenses accompanying the integration of renewable energy businesses into core operations.
Recombination of entities with distinct business profiles may cause acquirers to overestimate prospective synergies: acquirers’ and targets’ core operations may turn out to be incompatible or require substantial resources to navigate integration. The problem of synergy overestimation [39] is likely to occur if targets are opaque and generate most of their value in the residual period, i.e., in the distant future. Valuation uncertainty tends to favour targets’ shareholders, who may be more likely to window-dress corporate reports [40] and offer excessively optimistic cash flow projections. In this respect, renewable energy acquirers have a distinct advantage over conventional energy firms in performing the valuation of renewable energy targets, as the degree of acquirer-target information asymmetry is substantially lower [41].
Even though diversification into the renewable energy sector appears to be a safe bet for most conventional energy companies due to the relatively small transaction size and the imminence of sector-wide transition towards clean energy generation, the ultimate transaction outcomes are highly uncertain. The first reason is the rapid commoditization and cost race [42] in the renewable energy industry, reducing profit margins, and making smaller firms price takers (a problem that consolidations are supposed to alleviate). Secondly, there is a significant timing mismatch between deal-related investment outlays and economic benefits from the organic development of renewable energy businesses. The result is a reduction in return on capital and an increase in business risks. Thirdly, the deals’ financial success is preconditioned upon shifts in the regulatory environment, which should confer significant financial advantages to renewable energy generation. Delays or uncertainties in enacting relevant regulations [43] may disrupt the continuity of post-deal integration.
Finally, the terms and outcomes of every deal depend on acquirers’ governance and managerial capabilities. Prior studies have demonstrated [44] that acquisitions by firms with overconfident executives, deficient corporate governance, or insufficient industry-specific expertise tend to generate inferior outcomes. The reasons for failures include overpayment, poor synergy estimates, lack of technological compatibility between acquirers and targets. Therefore, any analysis of deal characteristics and effects should be accompanied by an investigation of the concomitant role of governance mechanisms.
To our best knowledge, there are no comprehensive studies analysing the characteristics and shareholder wealth effects of M&As involving renewable energy targets. This is due to the fact that the consolidation wave in the industry started relatively recently [45] and gained speed during the last decade. The current study attempts to fill the discovered research gap by collecting comprehensive empirical material related to this phenomenon.
3. Database and Methodology
3.1. Methodology
The study is conducted in three consecutive stages. At stage one, we attempt to establish the profile of a typical acquirer of renewable energy companies in terms of fundamentals, business profile, and operating performance. To that end, we apply univariate cross-sectional tests for differences in means by comparing deals involving renewable energy targets against other transactions completed by sampled acquirers. To cross-check our initial results, we use logit regression modelling to identify factors associated with the choice of renewable energy firms as acquisition targets. The baseline model specification used for this purpose is as follows:
where —a set of independent variables controlling for acquirers’ financials (ROA, cash reserves, indebtedness etc.), —a set of corporate governance controls measuring board characteristics; —independent variable approximating acquirers’ prior acquisition experience (prior completed transactions). We use a number of dependent variables in order to explore different scenarios of acquisitions. In particular, we interact RENEW with A.FOSSIL in order to conduct a separate analysis of deals, whereby a fossil fuel company acquires renewable energy firms. We also study the determinants of cross-industry deals, whereby energy firms buy stakes in non-energy companies (CROSS.IND) in order to contrast the effects of vertical and horizontal integration in the energy sector.
Stage two of the study is focused on the short-term market reaction to acquisitions in the energy sector. We start by estimating short-term cumulative returns on acquirers’ stocks around deal completion dates. To that end, we selected two event windows: (1) [−1; 1] days around deal completion; (2) [−1; 3] days around deal completion. Using standard event study methodology, we separately estimated cumulative returns around each transaction and aggregated the results into a cross-sectional database. We started by verifying whether post-deal returns are significantly different from zero and whether the value of returns is associated with the type of acquirer and target. A similar univariate analysis is performed for acquisition premia. The latter are estimated as a percentage difference between acquisition price and target’s stock price on a date preceding the deal announcement. Importantly, acquisition premia were estimated only for publicly traded targets, while post-deal returns were calculated for the entire sample (public and closely held targets). Subsequently, we performed a multivariate cross-sectional analysis to establish which deal characteristics are associated with a higher likelihood of positive short-term returns. The baseline regression model used at this point is as follows:
where —binary variable encoding transactions, where acquirers experienced positive cumulative returns around deal completion, —a set of deal control variables (e.g., deal size, shares purchased, acquirer-target complementarity), —interaction term encoding instances whereby a renewable energy company is taken over by another renewable energy company.
The final stage of our empirical analysis aims at quantifying the impact of acquisitions (including those of renewable energy targets) on acquirers’ medium-term operating performance measured by return on assets (ROA). To that end, we used static panel regression modelling with fixed country and industry effects with the following specification:
To account for the intertemporal nature of the studied empirical relationships, we introduced lags of the first and second order of the key independent variables.
3.2. Dataset and Data Collection Process
The present study relies on a comprehensive multiannual sample of 1088 mergers and acquisitions completed by 255 energy companies (acquirers) domiciled across 22 E.U. countries between 1990 and 2020. The transaction data were obtained from the Thomson Reuters Eikon M&A database. Firm-level financial data were downloaded from Thomson Reuters Eikon.
The selection of empirical material for analysis was dictated by concerns regarding data availability and sample size. To start with, no single European jurisdiction provides a sufficient amount of empirical data to allow for the application of a robust quantitative research toolkit (e.g., dynamic panel regression modelling). The largest subsample of transactions—224 or ca. 20% of the entire sample—features acquirers domiciled in France. Other jurisdiction subsamples are substantially smaller. Deals involving renewable energy targets constitute a minority of sampled transactions (108). Constraining the study to a single jurisdiction also prevents the possibility of generalization of empirical results. All firms participating in the studied transactions are domiciled in the European Union. This mitigates methodological concerns regarding the sample’s geographic heterogeneity. We also control for country-specific fixed effects in all regression models to allow for valid econometric inference.
To qualify for sample inclusion, an acquisition should feature an acquirer operating in the conventional energy sector, which englobes the following industry classification positions: (1) power generation (regardless of the type of energy generation); (2) oil and gas (vertically integrated); (3) alternative energy sources; (4) other energy and power. Many firms operate across multiple business segments; we did not impose any quantitative criteria regarding the share of any particular business segment in acquirers’ total sales. All acquirers participating in the sampled transactions are publicly listed. This choice is dictated by methodological concerns: as part of the study, we quantified the short-term shareholder wealth effects of corporate takeovers relying on stock price data. Naturally, the imposition of this selection criterion contributed to substantially curtailing the sample size. We also removed any firms for which incomplete financial records were available or zero assets/revenues were reported during any financial year. No limits on acquirers’ market cap or asset value were imposed.
Along with requirements for the type of acquirer, we also applied several transaction-related selection criteria. In particular, we analyse only deals involving a sale of at least a 10% equity stake in the acquiree. Secondly, inclusion into the sample is preconditioned by the availability of experimental data: deal size, dates of announcement and completion, settlement method, acquirer, and target business descriptions. We imposed no requirements with regards to the type of target (closely held company, joint venture, minority interest etc.), targets’ ownership structure (state and privately owned are included), nor targets’ public status (private and publicly listed targets are included). As a result, we analyse all deals completed by acquirers from the energy sector and contrast those involving renewable energy targets with the remainder. Importantly, targets may be classified into three distinct groups, which are of interest from the standpoint of the study’s goals: (1) firms operating in the renewable energy sector (solar, wind, biomass, geothermal, hydropower); (2) firms with conventional energy generation; (3) non-energy firms (e.g., machinery, petrochemicals, financial services, professional services, information technologies), which constitute ca. 33.4% of sampled acquirees (364 deals) spanning 51 Global Industry Classification Standard (GICS) codes.
The empirical data assembled for the present study may be broadly classified into four categories: (1) acquirer characteristics; (2) deal details and settings; (3) short-term post-deal shareholder wealth effects; (4) acquisition premia. The first category contains acquirer financials collected from yearly financial reports, acquirers’ prior acquisition experience, including the number of prior completed deals (regardless of the type of target), and corporate governance settings (board independence, board member affiliations, tenure, executive presence on board, etc.). The second category of variables includes deal-specific details: amount paid, equity share being purchased, acquirer and target industry descriptions, settlement mode (cash vs. stock).
One of the critical variables describing the degree of acquirer-target similarity is COMPLEMENTARITY, which is a novel measure based on textual analysis [46] of business descriptions of entities participating in the deal. Having extracted business descriptions of acquirers and targets from deal synopses, we estimated the cosine similarity of the two texts. The resulting measure, oscillating between 0 and 1, gives an idea of the degree of divergence between acquirers and acquirees regarding operational activities and product/services portfolios.
The third and fourth categories of variables are explained further. The complete list of variables used in the study and their definitions is presented in Table 1. In Table 2, we show descriptive statistics for the entire research sample. All nominal variables have been scaled using relevant deflators; outliers have been removed using 1% and 99% winsorization.

Table 1.
Definitions of variables.
Table 2.
Descriptive statistics.
4. Principal Empirical Findings
The initial analysis of cross-sectional differences between acquisitions involving renewable energy and those with other types of targets reveals the following key patterns (Table 3). To start with, an average deal involving a renewable energy target is significantly smaller than the remainder of the sample (USD 338.79 million vs. USD 1097.49 million). Secondly, acquirers buying renewable energy companies are substantially younger than their peers (18.93 years against 25.24 for peers). Thirdly, such deals are much likelier to be the first on record for a given acquirer (19.3% of deals are the first on record compared with ca. 11.7% for acquisitions involving non-renewable energy firms). In contrast, serial acquirers exhibit a higher propensity to acquire non-renewable-energy companies and engage in serial acquisitions. Renewable energy firms tend to be majority-acquired with an average transaction involving a transfer of a controlling 71.68% equity stake (vs. ca. 54.32% of equity for other deals). Transactions are closed a third faster compared to sector average (average TIME.TAKEN: 0.22 years), which points to the validity of H4. State-controlled acquirers are documented to exhibit a significantly lower likelihood of engaging in renewable energy firm acquisitions (29.4% of deals are closed by state-owned entities against 44% of deals involving other types of targets). The latter pattern contrasts with the sector-wide pre-dominance of government-owned entities. Renewable energy acquirers are by far the youngest in the sample (average age of 8.16 years) and are all privately held.
Table 3.
Acquirer characteristics and deal details: cross-sectional comparison depending on the target type.
Contrast the above with deals involving acquirers operating in the fossil energy business and renewable energy targets (Panel C in Table 3). The analyzed deals tend to involve the transfer of an average of 81.86% equity stake with a relatively short deal completion time (0.26 years). Importantly, fossil fuel companies are substantially likelier to choose domestic targets (CROSS.BORDER: 28.5% against sample average of 51.1%) and less likely than average to settle a transaction in cash (0%). Overall, conventional energy firms appear to be wary of impending risks of venturing into the sector, in which they hitherto possessed no expertise (acquirer-target complementarity stands at 8.9% against a sample average of 19.6%). To mitigate information asymmetry and reduce the risks related to valuation uncertainty, they choose to acquire controlling stakes in domestic firms, preferring to settle deals in stocks. Because of the inherent risks of horizontal diversification, their choices appear to be perfectly justifiable and reasonable.
The analysis of acquirer financials (Table 4) points to the important distinction between acquirers of renewable energy firms and their peers. To start with, firms acquiring renewable energy divisions are substantially more profitable at an operational level (the average normalized EBITDA margin stands at 18.1%. They also have significantly higher cash reserves as a proportion of total assets (11.5% against 8.3% for peers) and better access to long-term external financing, evidenced by a higher average level of indebtedness (31.3% vs. 28.6%). The difference is much starker when we focus only on acquirers operating in the renewable energy sector: these firms exhibit by far the highest operational profitability and liquidity (average cash reserves equal 15.9% of assets). Interestingly, a similar pattern is observed among fossil fuel companies engaging in acquisitions of renewable energy targets (Panel C, Table 5). Overall, our initial findings strongly suggest that better-performing incumbents rather than outsiders lead corporate consolidations in the renewable energy sector. This pattern may have two plausible explanations. Empirical evidence speaks in favour of H2 showing that industry leaders exhibit a higher likelihood of engaging in M&A deals in the renewable energy sector than industry outsiders. Similarly, we fail to reject H4; acquirers’ cash reserves and debt capacity are found to exhibit a strong positive link with the likelihood of engaging in M&A deals in the renewable energy sector. First, in order to effectively participate in the bidding process involving renewable energy targets, a firm should have robust financials and substantial financial reserves. This implicit requirement leads to self-selection among acquirers. Second, better-performing companies may be at the forefront of the ongoing energy sector’s transition towards sustainable energy generation. This inference also has important implications. Possible bidding contests involving cash-rich and profitable companies and attractive promising targets may drive up the valuations causing acquirers to overpay and potentially overestimate future synergies. The fact that the consolidation process is led by market leaders may also create long-term threats for competition. Rather than performing the role of a mechanism cleaning the market of outsiders, acquisitions may strengthen the market position of the most successful incumbents, thus, pushing the market towards monopolism.
Table 4.
Acquirer characteristics and deal details: cross-sectional comparison depending on the target type.
Table 5.
Acquirer characteristics and deal details: cross-sectional comparison depending on target type.
In Table 5, we explore the determinants of acquirers’ proclivity to buy stakes in renewable energy companies. The explained variable in the model (1) is RENEW, which binary-codes instances of renewable energy company acquisitions regardless of the type of acquirer. The multivariate analysis points to only one strong predictor of such deals, acquirers’ board tenure; longer serving supervisory boards are associated with a significantly lower likelihood of energy firms’ diversification into renewable energy (Odds ratio (OR): 0.78; sig.: 5%). Stronger board capture by executives (CEO.BOARD.MEM) is associated with a higher likelihood of acquisitions of renewable energy firms. The described relationships tend to hold regardless of whether acquirers are renewable or non-renewable energy companies. In model (2), the explained variable is TGT.NON.ENERGY, which binary-codes instances of non-energy target acquisitions by energy companies. Such non-core horizontal diversification appears to be strongly associated with the average number of supervisory board members’ external affiliations (OR: 1.24; sig.: 1%) (e.g., supervisory or executive positions within other companies). A similarly positive, but much weaker impact is exercised by board independence (OR: 1.007; sig.: 5%). Overall, a director’s outside experience and non-energy expertise appear to increase energy firms’ proclivity to buy a stake outside of the sector.
Overall, our findings suggest that acquirers’ resources i.e., cash reserves and operating cash flows rather than corporate governance settings, play the predominant role in incentivizing energy firms towards inorganic diversification into the renewable energy sector.
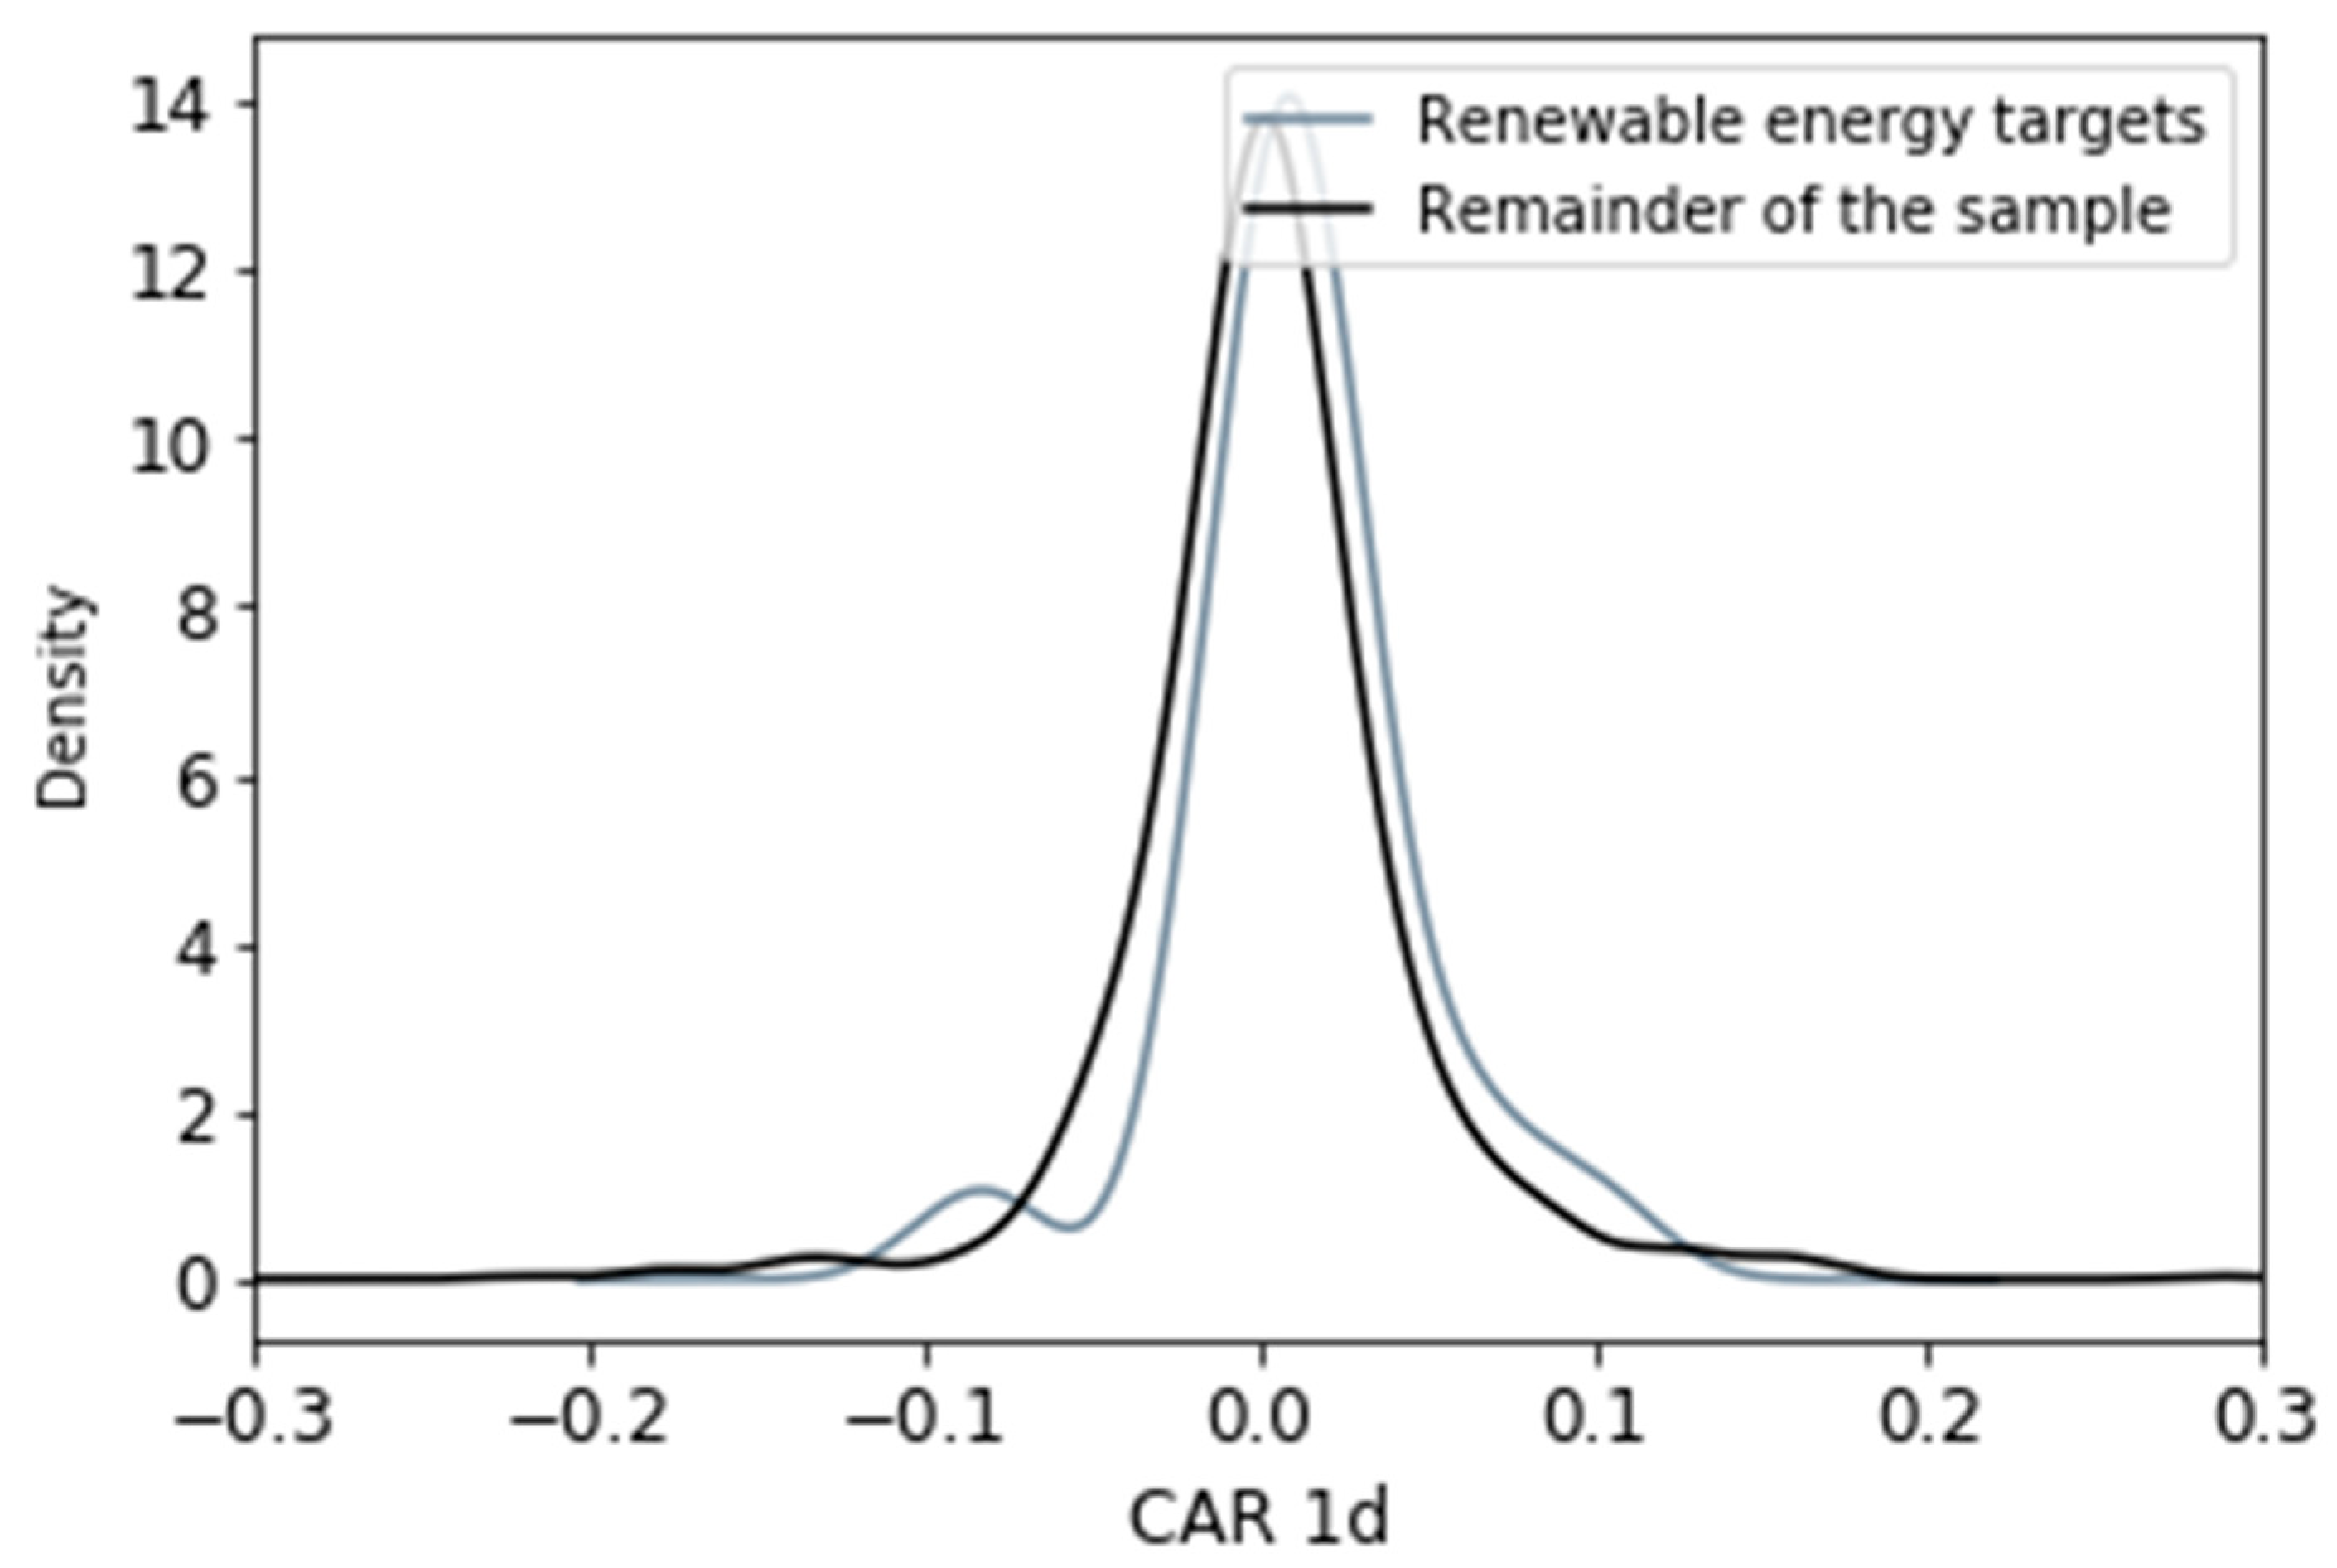
Our analysis of cumulative returns around deal completion begins with univariate tests of sample means (Table 6). The average estimated cumulative returns over the observation window [−1; 1] around the transaction finalization date equals 0.6% for the entire sample of acquisitions completed by the studied energy companies. At [−1; 3] days window, the average return drops to 0.5%. On both observation intervals, cumulative returns are significantly different from zero (sig.: 1%). We document an overwhelmingly positive short-term capital market reaction to energy firms’ acquisitions (Figure 1) comparable to that reported for other industries [46].
Table 6.
AR around transaction finalization for energy firms’ acquisitions.
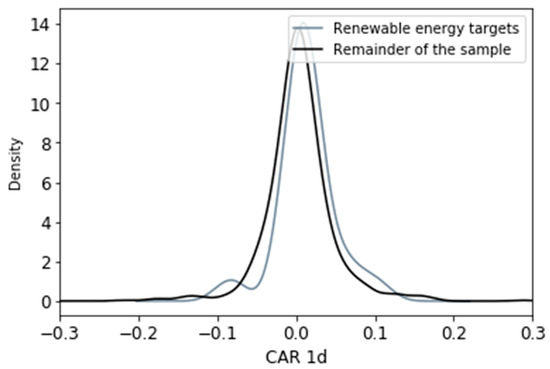
Figure 1.
Comparison of cumulative post-deal returns (renewable energy targets vs. non-renewable energy targets).
We subsequently compare post-deal returns among different types of acquirers and targets (Table 7). Panel A shows that acquisitions of renewable energy companies exhibit the highest deal-related returns at 1.3% ([−1; 1] days window)/1.2% ([−1; 3] days window), which is more than double the sample average. Thus, we fail to reject H1 and demonstrate that M&A transactions involving renewable energy companies generate positive short-term market reaction. Intriguingly, similar high returns are observed in case of acquisitions made by fossil fuel companies. Somewhat lower returns are documented in case of takeovers of renewable energy firms by their peers from the renewable energy sector (ca. 1%).
Table 7.
Acquisition premia and post-completion returns—cross-sectional univariate comparison.
To summarize, our findings show that the highest cumulative returns are observed when renewable energy companies are acquired by renewable energy industry incumbents, which may be explained by high business complementarity and lower target-acquirer information asymmetry, and by fossil fuel companies, which may be perceived as a positive reaction to the deployment of energy transition by the latter.
In addition to post-deal returns, we also estimate the average acquisition premia paid for publicly listed renewable energy targets (Table 7). Overall, the average acquisition premium paid on the European market oscillates around 24.5–33% on top of the non-renewable-energy target’s market value on the date one month/one week/one day before the deal announcement. Interestingly, the acquisition premia for renewable energy targets are significantly lower: (1) the average one-week premium is ca. −0.65%; (2) the average one-month premium is ca. 9.8%. This pattern is persistent regardless of acquirer–acquiree industry relatedness. Our findings allow for the rejection of H5, stating that transactions involving publicly listed renewable energy companies are finalized at higher valuation premia. The opposite appears to be the case.
Our findings regarding the acquisition premia may have two possible explanations. To start with, in view of the hot M&A market and active participation of industry leaders in sector consolidation, renewable energy firms’ market valuation may be regarded as inflated relative to their fundamental value. The difference may explain the observed cross-sectional differences in acquisition premia. Secondly, since renewable energy firms tend to be significantly younger and smaller than other sampled targets, they may be regarded as much riskier by acquirers. The latter may prompt a reduction in offer prices.
In order to empirically corroborate our prior findings, we run an additional set of multivariate regressions, in which the explained variable is POS.RET, a binary variable encoding deals, which produced positive (significantly different from zero) short-term post-deal returns. The results are presented in Table 8. To start with, we document a substantially higher likelihood of positive returns in deals involving renewable energy targets (OR: 2.06; sig.: 5%). The maximum relative likelihood is ascribed to deals, where both acquirer and target are renewable energy companies (OR: 4.14; sig.: 5%). Deal size is found to be negatively associated with the likelihood of positive cumulative returns. Only cash reserves appear to be substantially associated with deals’ short-term shareholder wealth effects among acquirers’ financials. Thus, in line with our prior findings, we demonstrate that capital markets exhibit an overwhelmingly positive reaction to acquisitions of renewable energy companies.
Table 8.
The likelihood of positive post-transaction returns.
Finally, we quantified the impact of acquisitions on acquirers’ medium-term operating performance measured by ROA. To that end, we assembled a firm-year panel dataset for all sampled energy firms comprising their yearly financial data. The dataset features 5946 firm-year observations. Static panel regression modelling with firm-level controls and country fixed effect was applied. The results are summarized in Table 9. We note a significant negative effect of renewable energy firm acquisitions on the combined entities’ bottom line. One year after deal finalization, acquirers’ ROA is one average 2.33 percentage points lower than prior to deal initialization (sig.: 10%). Within two years, the drag on performance deteriorates and reaches ca. 2.74 percentage points. Importantly, we find no heterogeneity of the said patterns depending on the type of target (renewable energy vs. non-energy companies) or the type of acquirer (renewable energy vs. fossil fuel companies).
Table 9.
Acquisitions of renewable energy companies and acquirers’ post-deal operating performance.
Our findings point to a stark dissonance between the overwhelmingly positive short-term market reaction to renewable energy firms’ acquisitions and their observed negative impact on the combined entities’ performance scorecard lasting years after deal completion. Public capital markets appear to attach a significant positive premium to such deals, possibly, in expectation of value accrual in the long term. We also demonstrate that post-deal integration in the energy sector is costly and may pose serious challenges, particularly to firms with no prior acquisition experience or those operating in the non-renewable-energy sector.
5. Conclusions
The present study attempts to present a comprehensive assessment of the M&A deals involving renewable energy companies from the European market. More specifically, it focuses on the characteristics of typical acquirers and targets, deals’ short-term shareholder wealth effects, and the post-transaction operating performance of participating entities.
Several important conclusions emerge. First, corporate consolidations in the renewable energy sector are conducted mainly by sector leaders—firms with the highest relative profitability, cash reserves, and debt capacity. Secondly, renewable energy acquirees tend to exhibit significant opacity coupled with possible overvaluation, fuelled by competitive bidding on the part of much larger acquirers. Thirdly, the stock markets attach significant positive premia to such targets; transactions overwhelmingly result in positive short-term shareholder gains. Finally, despite the perceived long-term attractiveness of diversification into the renewable energy business, acquisitions cause a substantial deterioration in the acquirers’ medium-term operating performance. Executives of energy firms pondering acquisitions should be wary of the enumerated market characteristics and account for them in strategic planning of inorganic growth.
Author Contributions
Conceptualization, M.W. and D.O.; methodology, S.Z.; software, D.O.; validation, M.W. and S.Z.; formal analysis, D.O. and S.Z.; investigation, S.Z.; resources, M.W.; data curation, D.O.; writing—original draft preparation, D.O. and S.Z.; writing—review and editing, S.Z.; visualization, D.O.; supervision, M.W.; project administration, M.W.; funding acquisition, M.W. and S.Z. All authors have read and agreed to the published version of the manuscript.
Funding
This research received no external funding.
Data Availability Statement
Data used in the study are available from the corresponding author upon request.
Conflicts of Interest
The authors declare no conflict of interest.
References
- Cowie, J. Acquisition, efficiency and scale economies: An analysis of the British bus industry. Transp. Rev. 2002, 22, 137–157. [Google Scholar] [CrossRef]
- Dung, T.; Bonney, L.; Adhikari, R.; Miles, M. Entrepreneurial orientation and vertical knowledge acquisition by smallholder agricultural firms in transitional economies: The role of interfirm collaboration in value-chains. J. Bus. Res. 2021, 137, 327–335. [Google Scholar] [CrossRef]
- Andriuškevicius, K.; Štreimikiene, D. Developments and trends of mergers and acquisitions in the energy industry. Energies 2021, 14, 2158. [Google Scholar] [CrossRef]
- Renneboog, L.; Vansteenkiste, S. Post-M&A performance and failure: Implications of time until deal completion. Sustainability 2020, 58, 650–699. [Google Scholar]
- Koi-Akrofi, G. Mergers and Acquisitions failure rates and perspectives on why they fail. Int. J. Innov. Appl. Stud. 2016, 17, 150–158. [Google Scholar]
- Akhigbe, A.; Martin, A.; Whyte, A. Partial acquisitions, the acquisition probability hypothesis, and the abnormal returns to partial tar-gets. J. Bank. Financ. 2007, 31, 3080–3101. [Google Scholar] [CrossRef]
- Higgins, H.; Beckman, J. Abnormal returns of Japanese acquisition bidders—Impact of pro-M&A legislation in the 1990s. Pac.-Basin Financ. J. 2006, 14, 250–268. [Google Scholar]
- Kolari, J.; Pynnonen, S.; Tuncez, A. Further evidence on long-run abnormal returns after corporate events. Q. Rev. Econ. Financ. 2021, 81, 421–439. [Google Scholar] [CrossRef]
- Daniliuc, S.; Li, L.; Wee, M. Busy directors and firm performance: Evidence from Australian mergers. Pac.-Basin Financ. J. 2020, 64, 101434. [Google Scholar] [CrossRef]
- Meng, B.; Vijh, A. Stock merger activity and industry performance. J. Bank. Financ. 2021, 129, 106160. [Google Scholar] [CrossRef]
- Gielen, D.; Boshell, F.; Saygin, D.; Bazilian, M.; Wagner, N.; Gorini, R. The role of renewable energy in the global energy transformation. Energy Strategy Rev. 2019, 24, 38–50. [Google Scholar] [CrossRef]
- Keim, W. Petrochemicals: Raw material change from fossil to biomass? Pet. Chem. 2010, 50, 298–304. [Google Scholar] [CrossRef]
- Osiichuk, D.; Wasilewski, M.; Zabolotnyy, S. The impact of independent supervisory boards on transformations in the energy sector: Results of an international longitudinal study. Energies 2021, 14, 5293. [Google Scholar] [CrossRef]
- Counts, G.; Block, W. Fracking: A creature of government. Energy Environ. 2016, 27, 933–941. [Google Scholar] [CrossRef]
- Baka, J.; Neville, K.; Weinthal, E.; Bakker, K. Agenda-setting at the energy-water nexus: Constructing and maintaining a policy monopoly in U.S. hydraulic fracturing regulation. Rev. Policy Res. 2018, 35, 439–465. [Google Scholar] [CrossRef]
- Qadir, S.; Al-Motairi, H.; Tahir, F.; El-Fagih, L. Incentives and strategies for financing the renewable energy transition: A review. Energy Rep. 2021, 7, 3590–3606. [Google Scholar] [CrossRef]
- Aquila, G.; Pamplona, E.; De Queiroz, A.; Rotela, P.; Fonseca, M. An overview of incentive policies for the expansion of renewable energy generation in electricity power systems and the Brazilian experience. Renew. Sustain. Energy Rev. 2017, 70, 1090–1098. [Google Scholar] [CrossRef]
- Pickl, M. The renewable energy strategies of oil majors–From oil to energy? Energy Strategy Rev. 2019, 26, 100370. [Google Scholar] [CrossRef]
- Chondrakis, G. Unique synergies in technology acquisitions. Res. Policy 2016, 45, 1873–1889. [Google Scholar] [CrossRef]
- Chui, A.; Ip, W. Improving merger and acquisition decision-making using fuzzy logic and simulation. Int. J. Eng. Bus. Manag. 2017, 9, 18–47. [Google Scholar] [CrossRef]
- Fraunhoffer, R.; Freytag, A.; Schiereck, D. Market power consolidation and M&A success: A study of US-American and German utility takeovers. J. Econ. Financ. Stud. 2013, 29, 29–43. [Google Scholar]
- Pesendorfer, M. Horizontal mergers in the paper industry. RAND J. Econ. 2003, 34, 495–515. [Google Scholar] [CrossRef]
- Polzin, F.; Sanders, M.; Steffen, B. The effect of differentiating costs of capital by country and technology on the European energy transition. Clim. Chang. 2021, 167, 1–34. [Google Scholar] [CrossRef]
- Boyson, N.; Gantchev, N.; Shivdasani, A. Activism mergers. J. Financ. Econ. 2017, 126, 54–73. [Google Scholar] [CrossRef]
- Kolari, J.; Pynnonen, S. Event study testing with cross-sectional correlation of abnormal returns. Rev. Financ. Stud. 2010, 23, 3996–4025. [Google Scholar] [CrossRef]
- Li, D.; Taylor, L.; Wang, W. Inefficiencies and externalities from opportunistic acquirers. J. Financ. Econ. 2018, 130, 265–290. [Google Scholar] [CrossRef]
- Dutordoir, M.; Roosenboom, P.; Vasconcelos, M. Synergy disclosures in mergers and acquisitions. Int. Rev. Financ. Anal. 2014, 31, 88–100. [Google Scholar] [CrossRef]
- Özgür, S.; Wirl, F. Cross-border mergers and acquisitions in the oil and gas industry: An overview. Energies. 2020, 13, 5580. [Google Scholar] [CrossRef]
- Jensen, M. Agency costs of free cash flow, corporate finance, and takeovers. Am. Econ. Rev. 1986, 76, 323–329. [Google Scholar]
- Du, W.; Mengjie, L.; Wang, F. Role of rent-seeking or technological progress in maintaining the monopoly power of energy enterprises: An empirical analysis based on micro-data from China. Energy 2020, 202, 117763. [Google Scholar] [CrossRef]
- Branger, N.; Flacke, R.; Graber, N. Monopoly power in the oil market and the macroeconomy. Energy Econ. 2020, 85, 104597. [Google Scholar] [CrossRef]
- Thijssen, J. Optimal and strategic timing of mergers and acquisitions motivated by synergies and risk diversification. J. Econ. Dyn. Control 2008, 32, 1701–1720. [Google Scholar] [CrossRef]
- He, G.; Lin, J.; Sifuentes, F.; Liu, X.; Abhyankar, N.; Phadke, A. Rapid cost decrease of renewables and storage accelerates the decarbonization of China’s power system. Nat. Commun. 2020, 11, 2486. [Google Scholar] [CrossRef] [PubMed]
- Thorne, C. Valuation uncertainty—When and why this is important. J. Prop. Invest. Financ. 2020, 39, 500–508. [Google Scholar] [CrossRef]
- Bayar, O.; Chemmanur, T. IPOs versus acquisitions and the valuation premium puzzle: A theory of exit choice by entrepreneurs and venture capitalists. J. Financ. Quant. Anal. 2011, 46, 1755–1793. [Google Scholar] [CrossRef]
- Bhaumik, S.; Owolabi, O.; Pal, S. Private information, institutional distance, and the failure of cross-border acquisitions: Evidence from the banking sector in Central and Eastern Europe. J. World Bus. 2018, 53, 504–513. [Google Scholar] [CrossRef]
- Yildiz, H. “Us vs. them” or “us over them”? On the roles of similarity and status in M&As. Int. Bus. Rev. 2016, 25, 51–65. [Google Scholar]
- Groote, J.; Kleindienst, I.; Hoegl, M.; Schweizer, D.; Laamanen, T. Similarity perceptions in investor reactions to acquisition announcements. Long Range Plan. 2021, 54, 101946. [Google Scholar] [CrossRef]
- Holmstrom, J.; Anderson, H. Exploring and extending the synergy concept—A study of three acquisitions. J. Bus. Ind. Mark. 2021, 36, 28–41. [Google Scholar] [CrossRef]
- Jeon, J.; Cheolwoo, L. Effective post-signing market check or window dressing? The role of go-shop provisions in M&A transactions. J. Bus. Financ. Account. 2014, 41, 210–241. [Google Scholar]
- Thompson, E.; Kim, C. Failure and success in mergers and acquisitions. J. Corp. Financ. 2019, 12, 2999. [Google Scholar]
- Heshmati, A.; Shahrouz, A. Market design for trading commoditized renewable energy. IZA Discuss. Pap. 2014, 8375, 1–18. [Google Scholar]
- Wang, P.; Yang, M.; Mamaril, K.; Shi, X.; Cheng, B.; Zhao, D. Explaining the slow progress of coal phase-out: The case of Guangdong-Hong Kong-Macao Greater Bay Region. Energy Policy 2021, 155, 112331. [Google Scholar] [CrossRef]
- Malmendier, U.; Tate, G.E. Who makes acquisitions? CEO overconfidence and market’s reaction. J. Financ. Econ. 2008, 89, 20–43. [Google Scholar] [CrossRef] [Green Version]
- Eisenbach, S.; Ettenhuber, C.; Schiereck, D.; Von Flotow, P. Beginning consolidation in the renewable energy industry and Bidders’ M&A-success. Technol. Invest. 2011, 2, 81–91. [Google Scholar]
- Thompson, E.; Kim, C. Information asymmetry, time until deal completion and post-M&A performance. J. Deriv. Quant. Stud. 2020, 28, 123–140. [Google Scholar]
Publisher’s Note: MDPI stays neutral with regard to jurisdictional claims in published maps and institutional affiliations. |
© 2021 by the authors. Licensee MDPI, Basel, Switzerland. This article is an open access article distributed under the terms and conditions of the Creative Commons Attribution (CC BY) license (https://creativecommons.org/licenses/by/4.0/).