
Preparation and Characterization of Thermally Stable Collagens from the Scales of Lizardfish (Synodus macrops)


Abstract
:
1. Introduction
2. Results
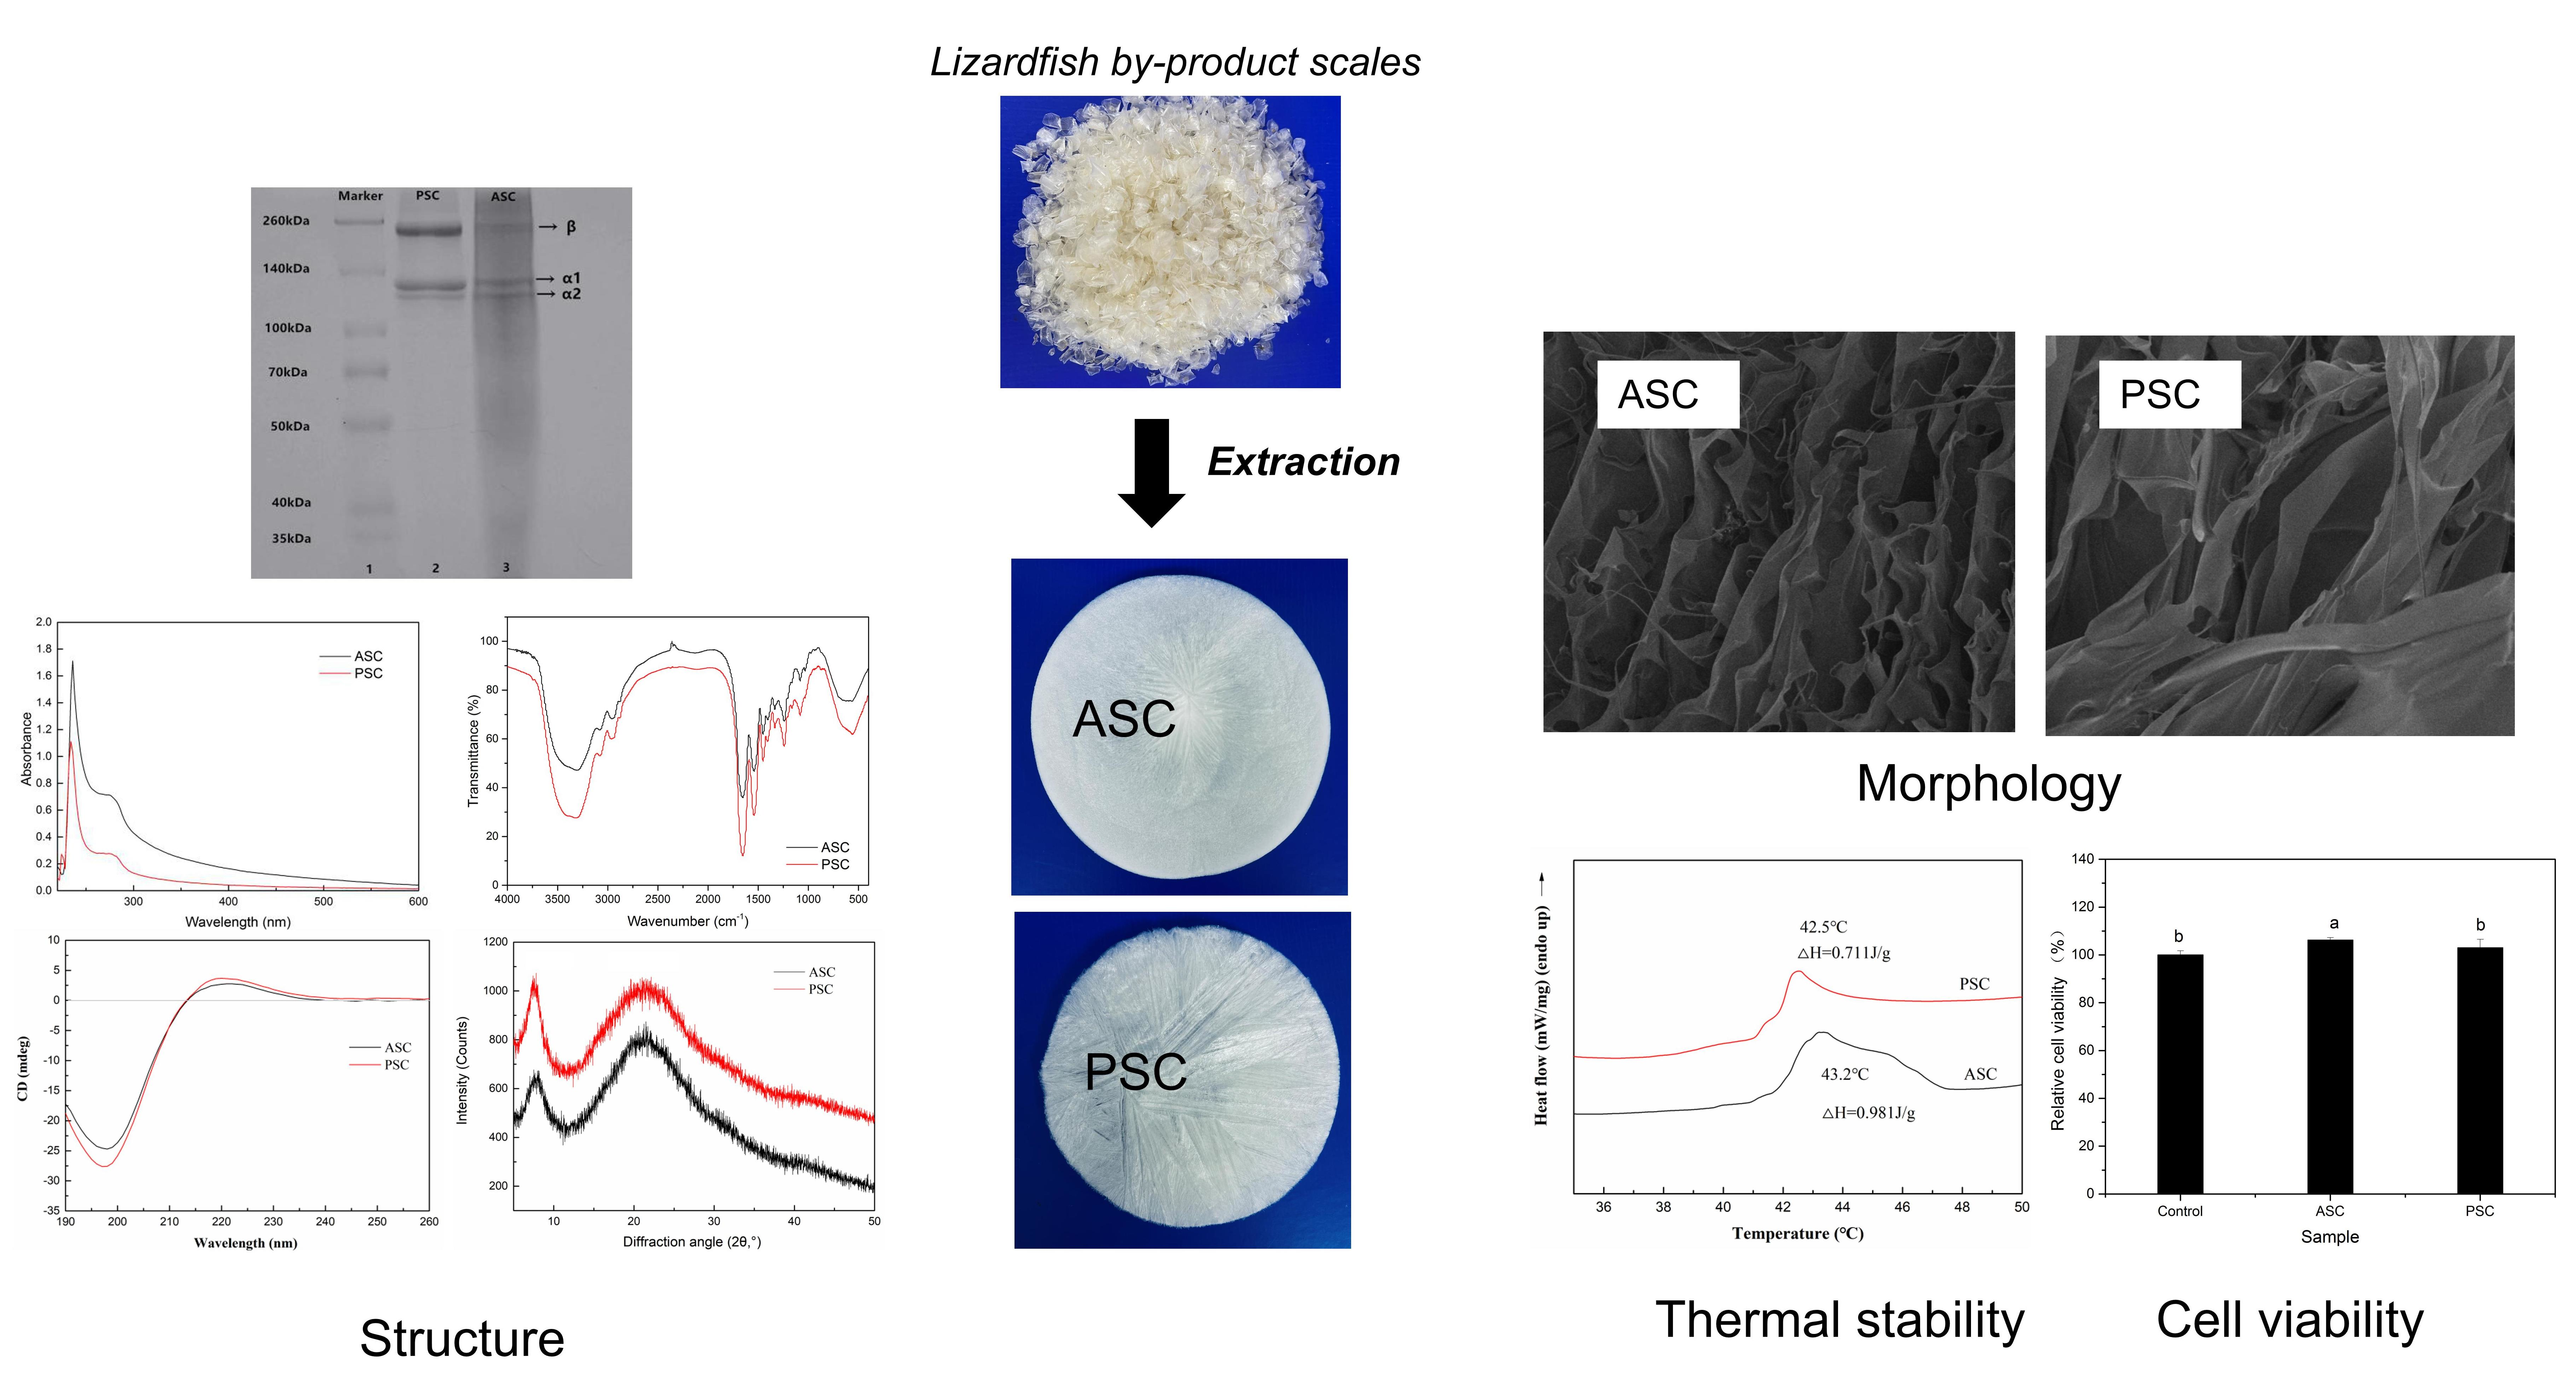
2.1. Collagen Yield
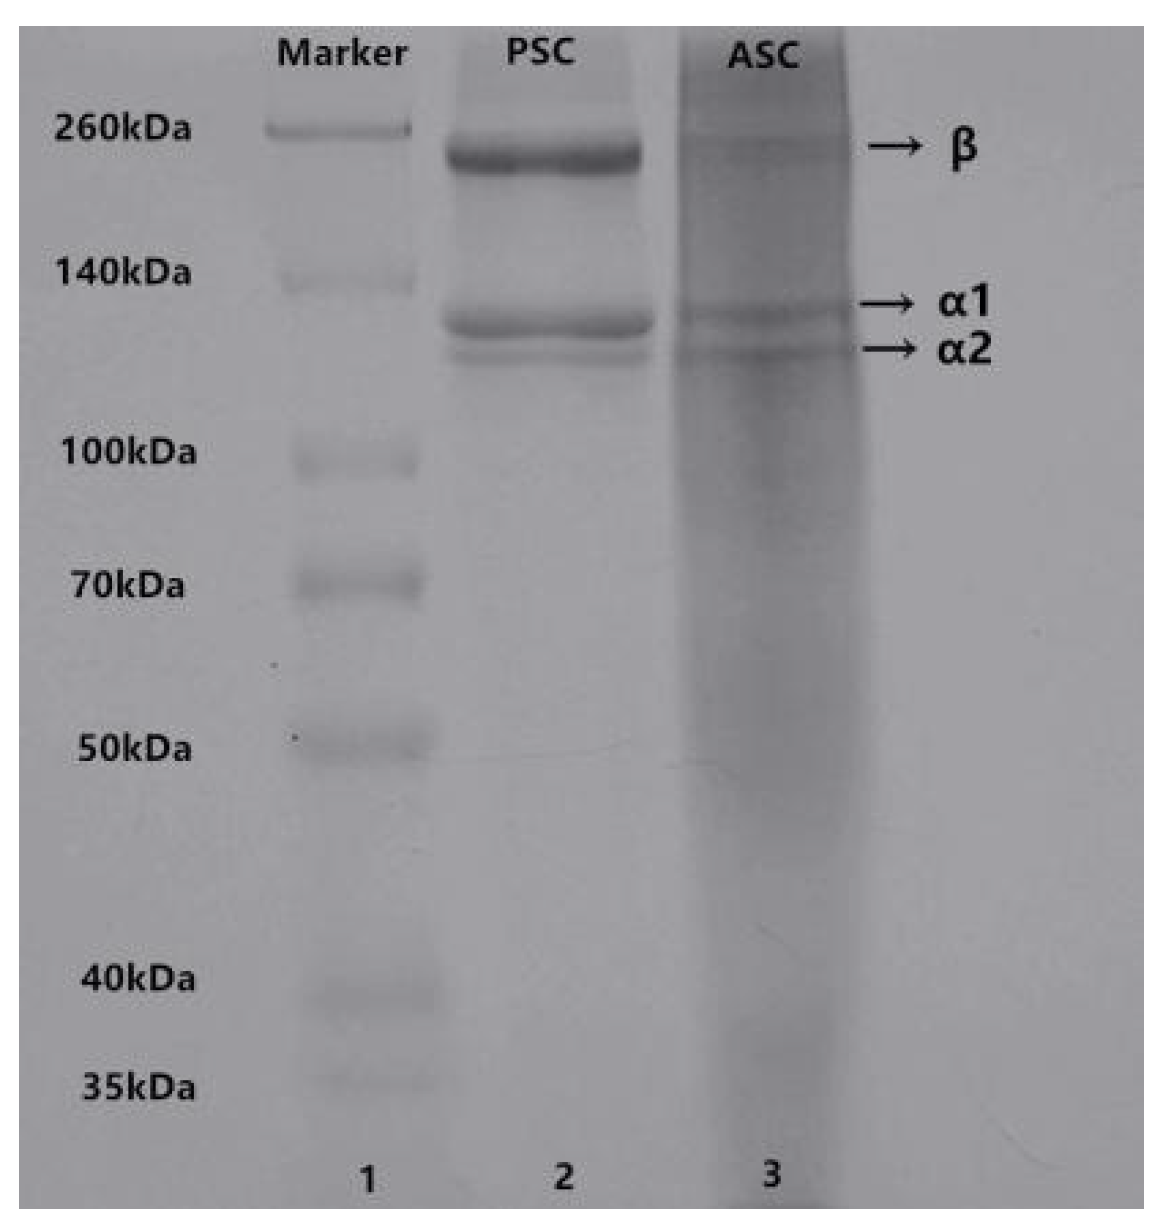
2.2. Sodium Dodecyl Sulfate-Polyacrylamide Gel Electrophoresis (SDS-PAGE)
2.3. Spectroscopy Characterization
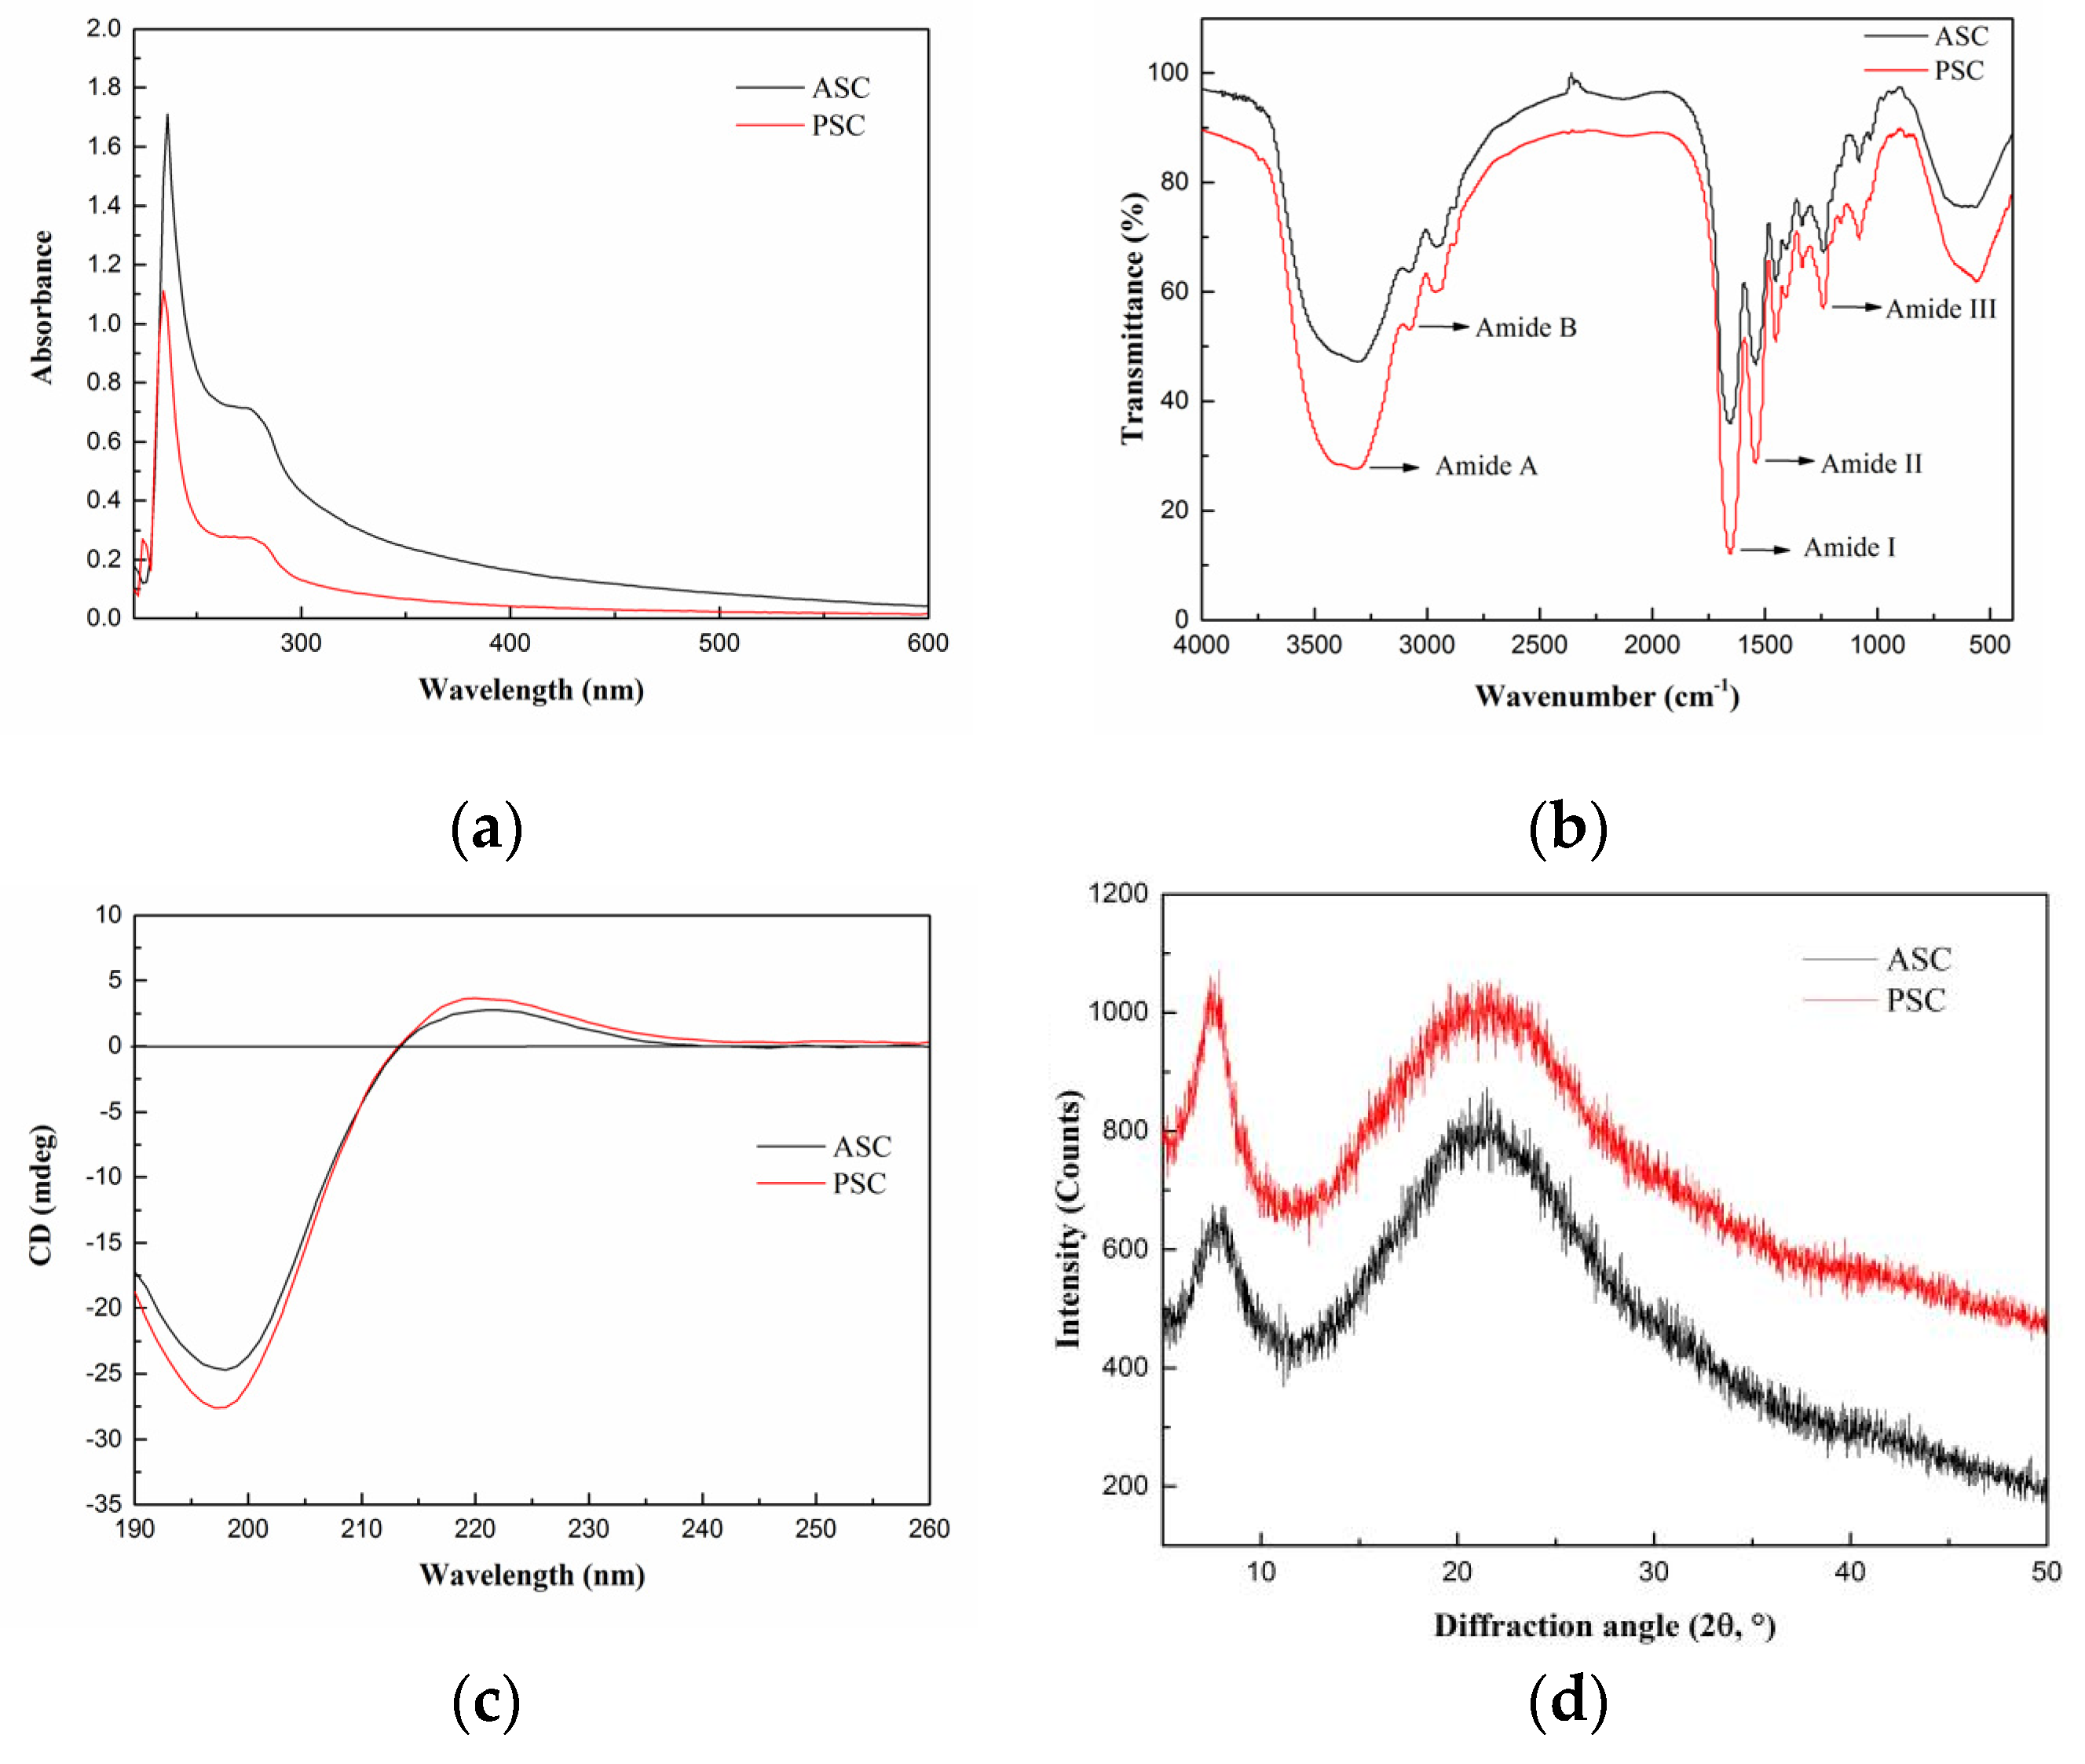
2.3.1. UV Absorption Spectrum
2.3.2. Fourier-Transform Infrared (FTIR) Spectrum
2.3.3. Circular Dichroism (CD) Spectrum
2.3.4. X-ray Diffraction (XRD) Spectrum
2.4. Amino Acid Composition
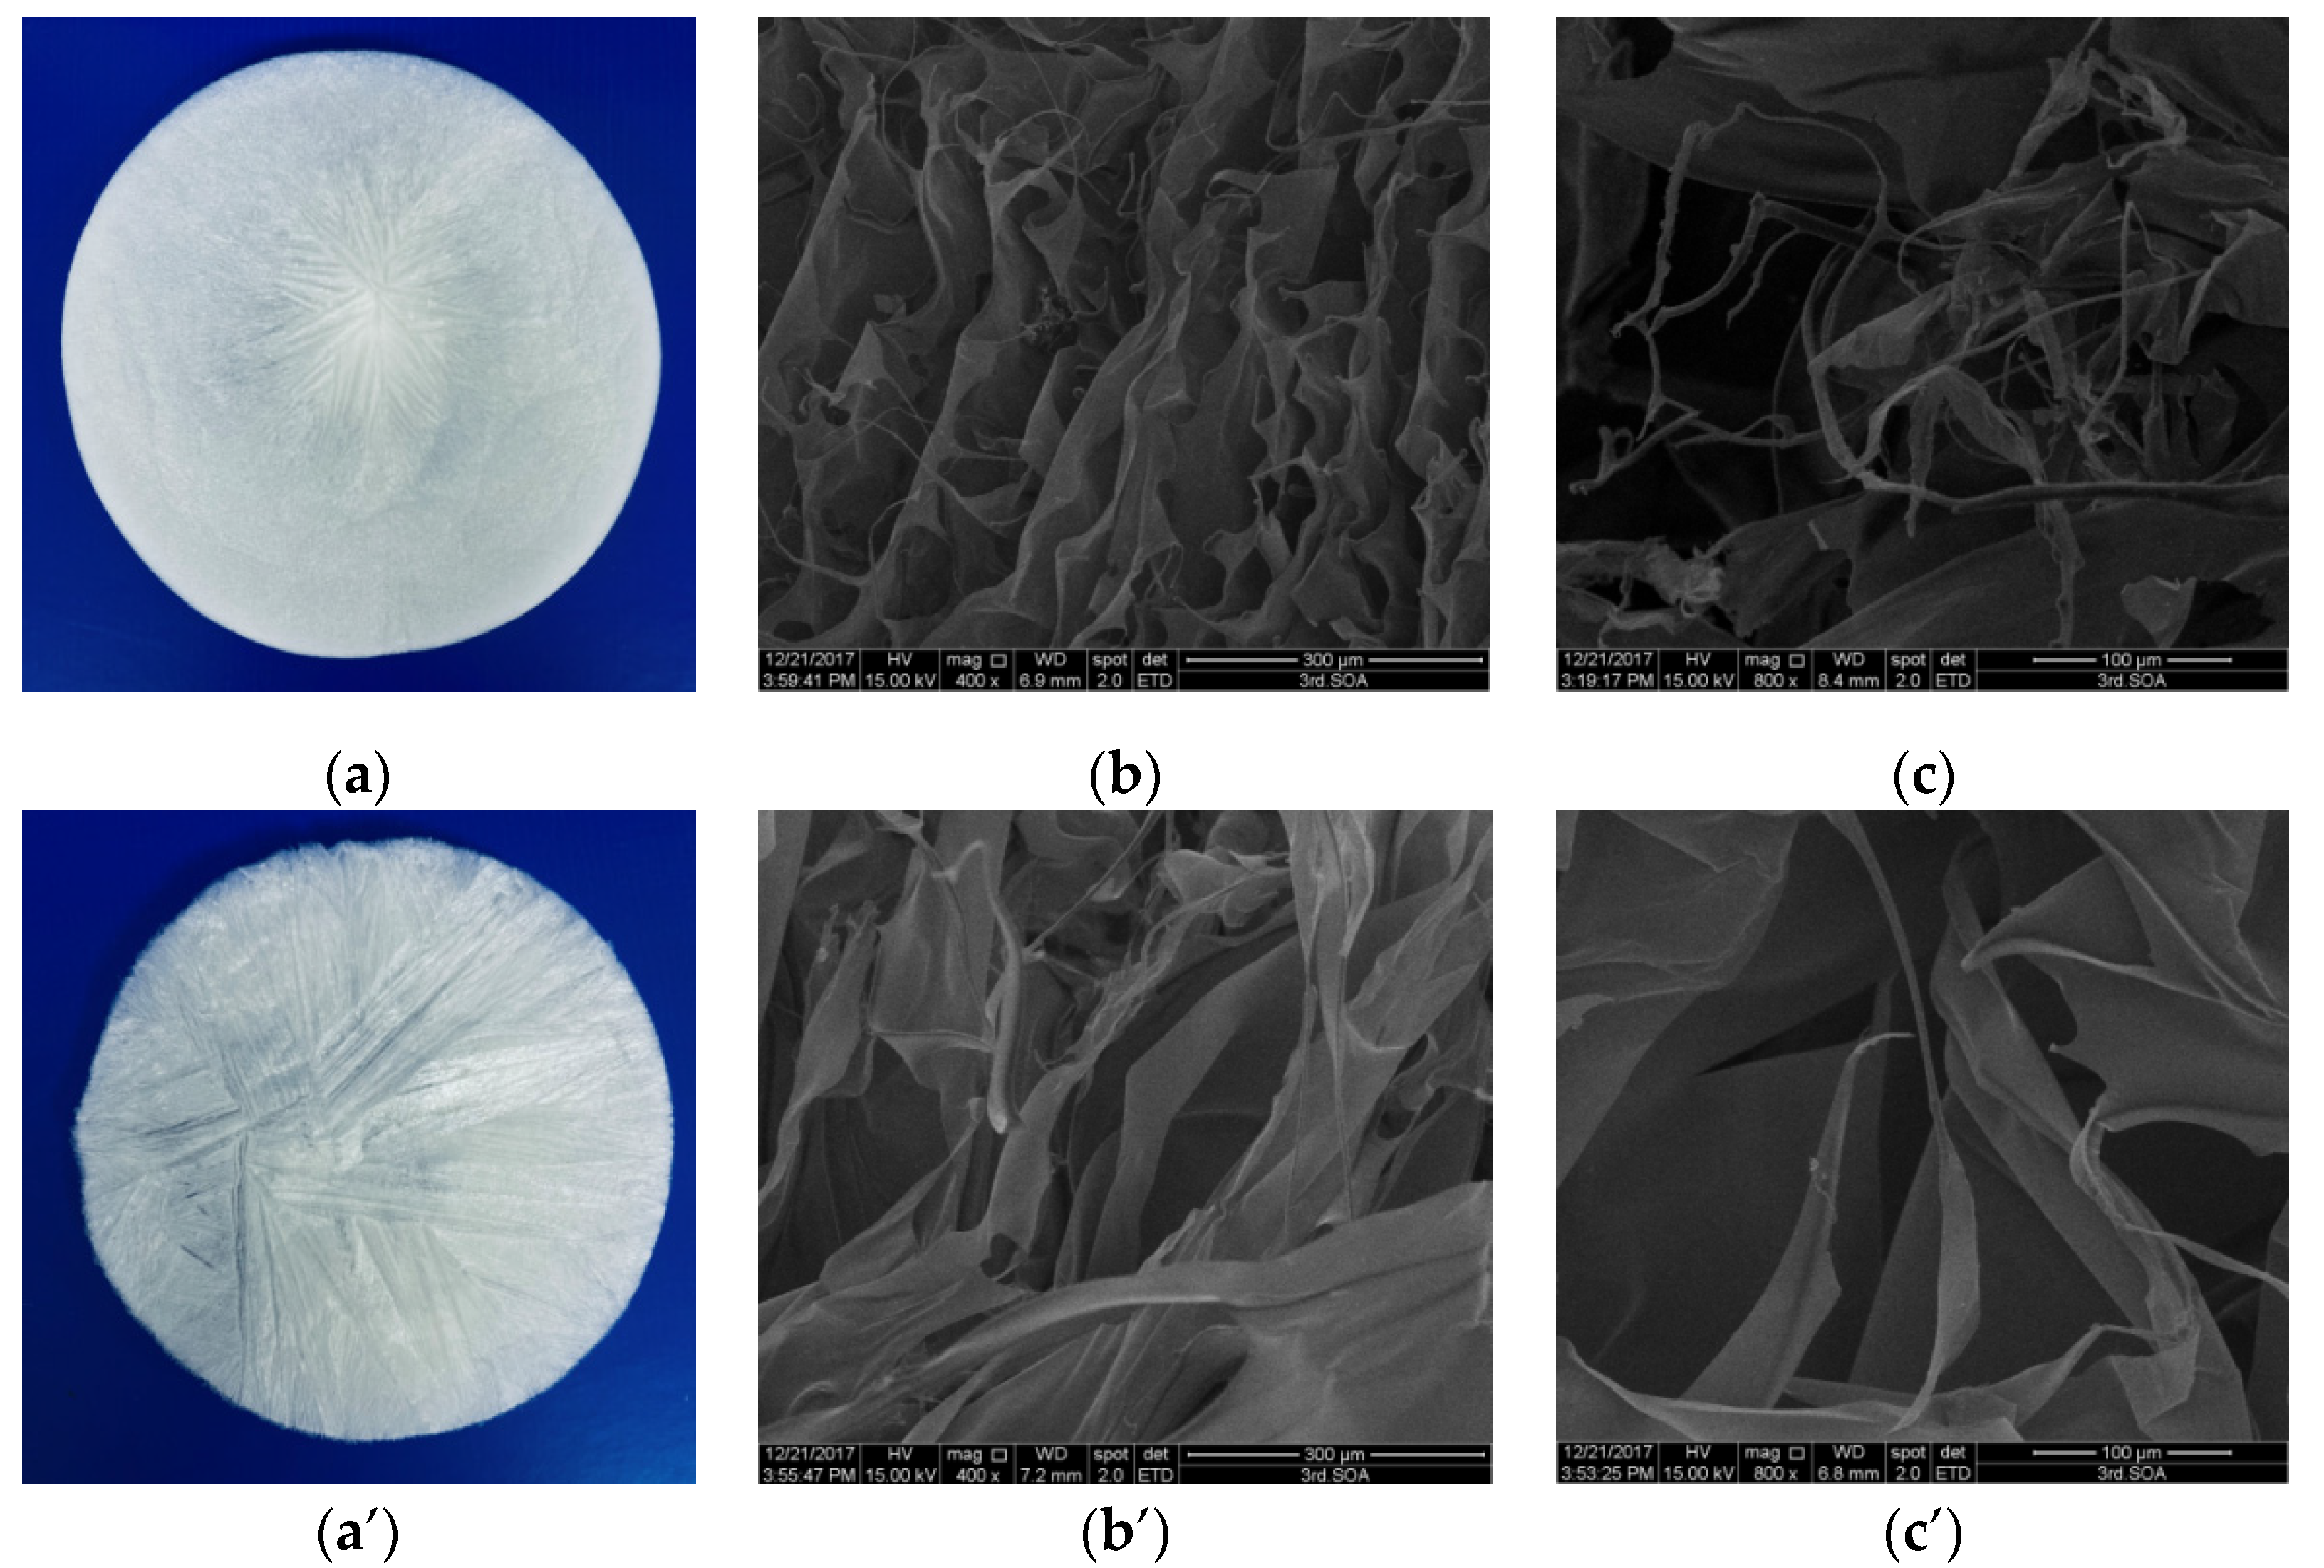
2.5. Morphology Characterization
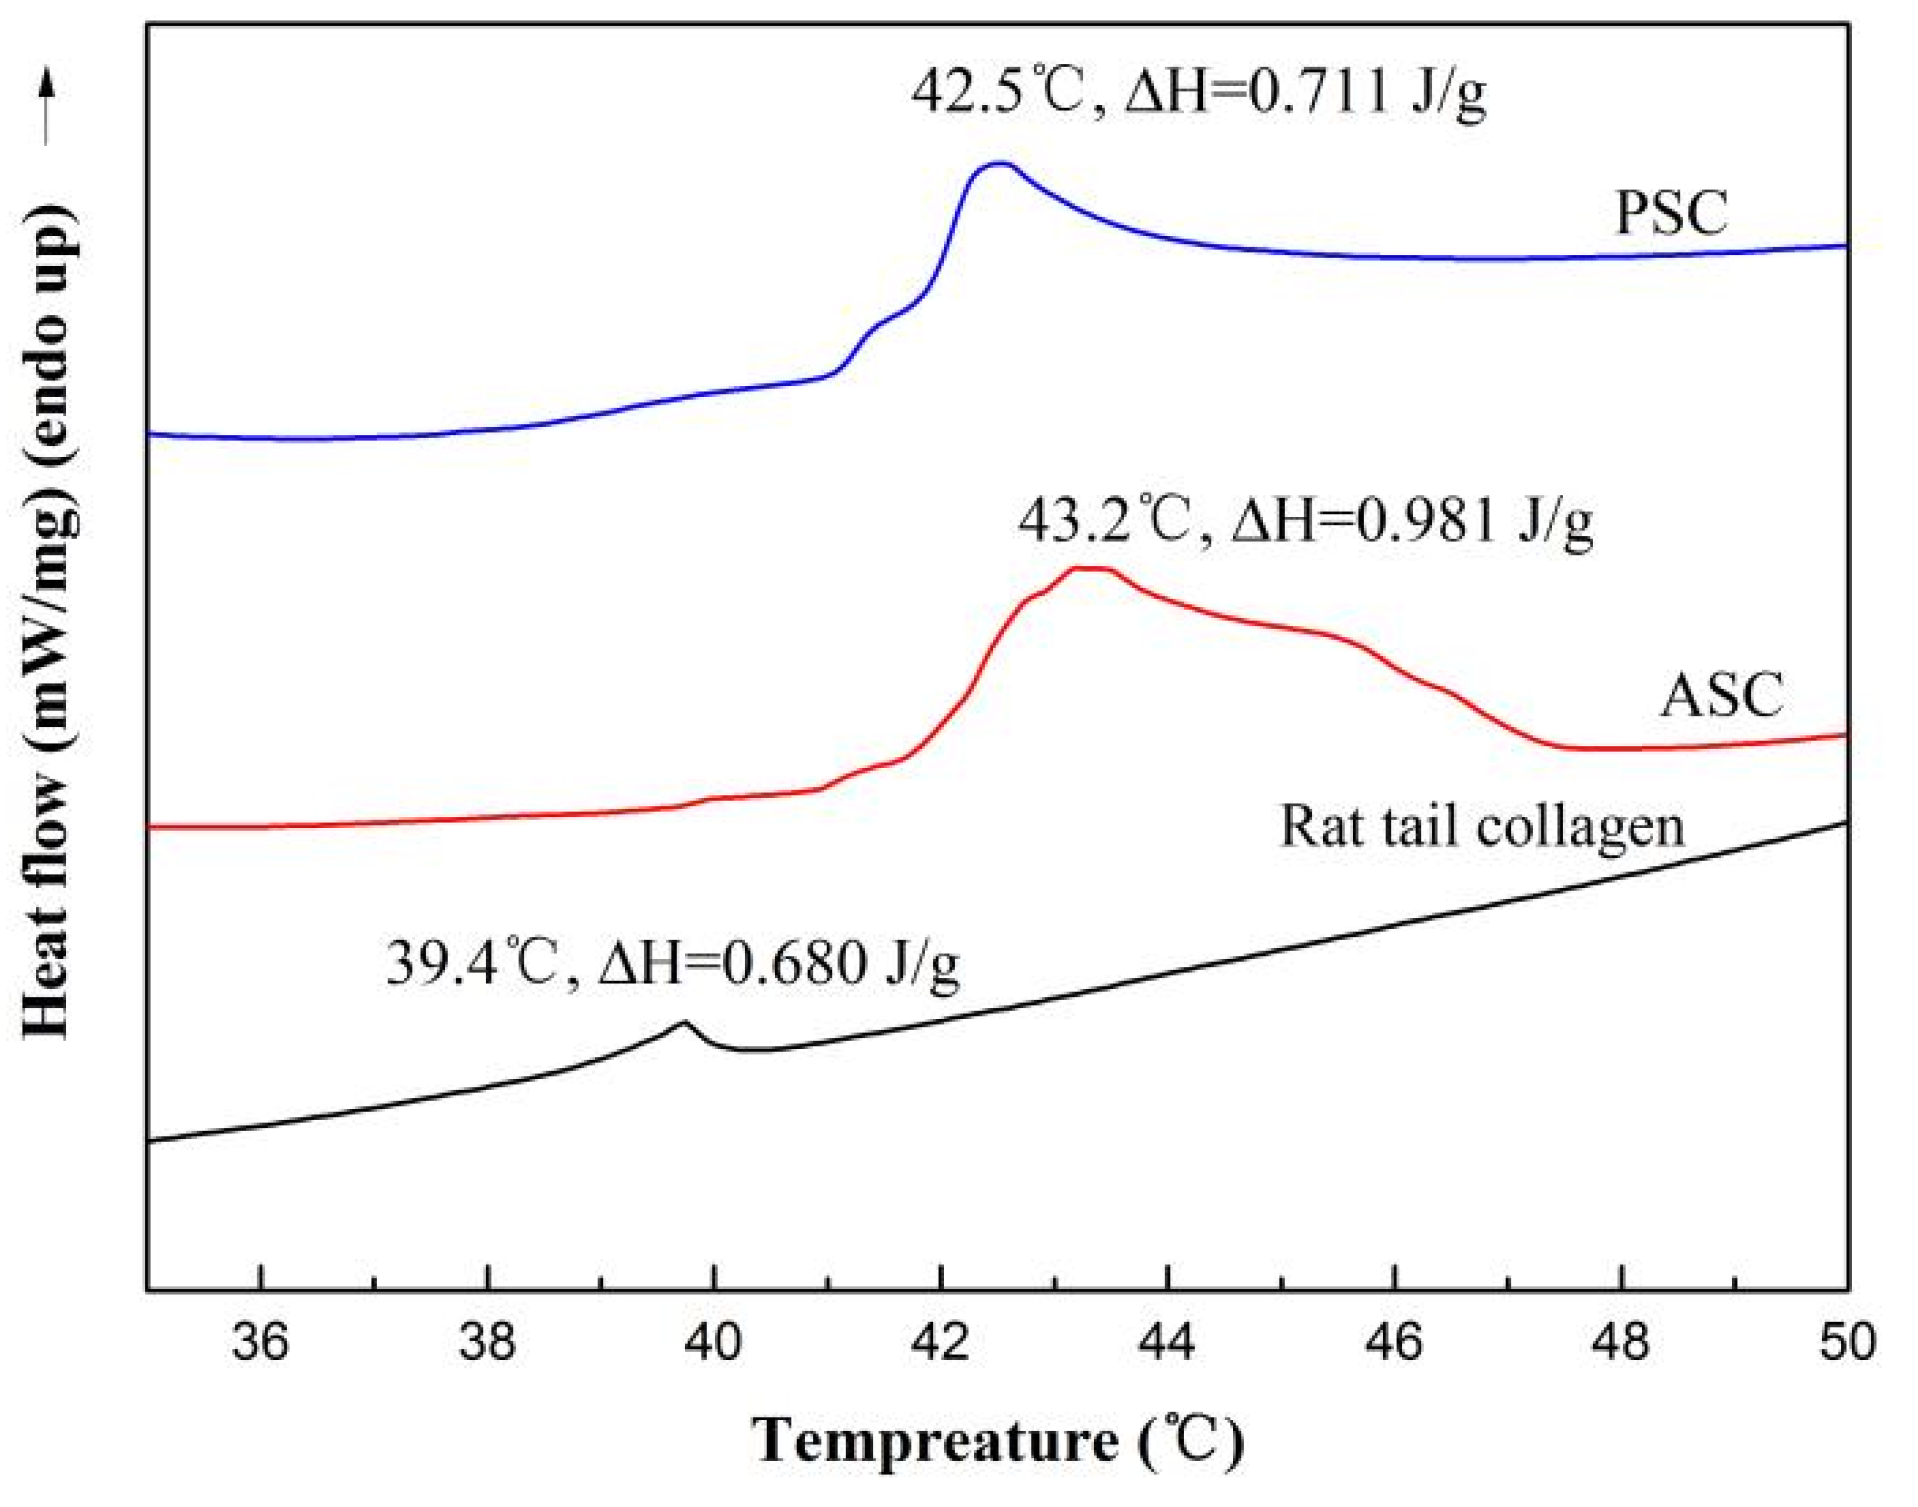
2.6. Thermal Stability
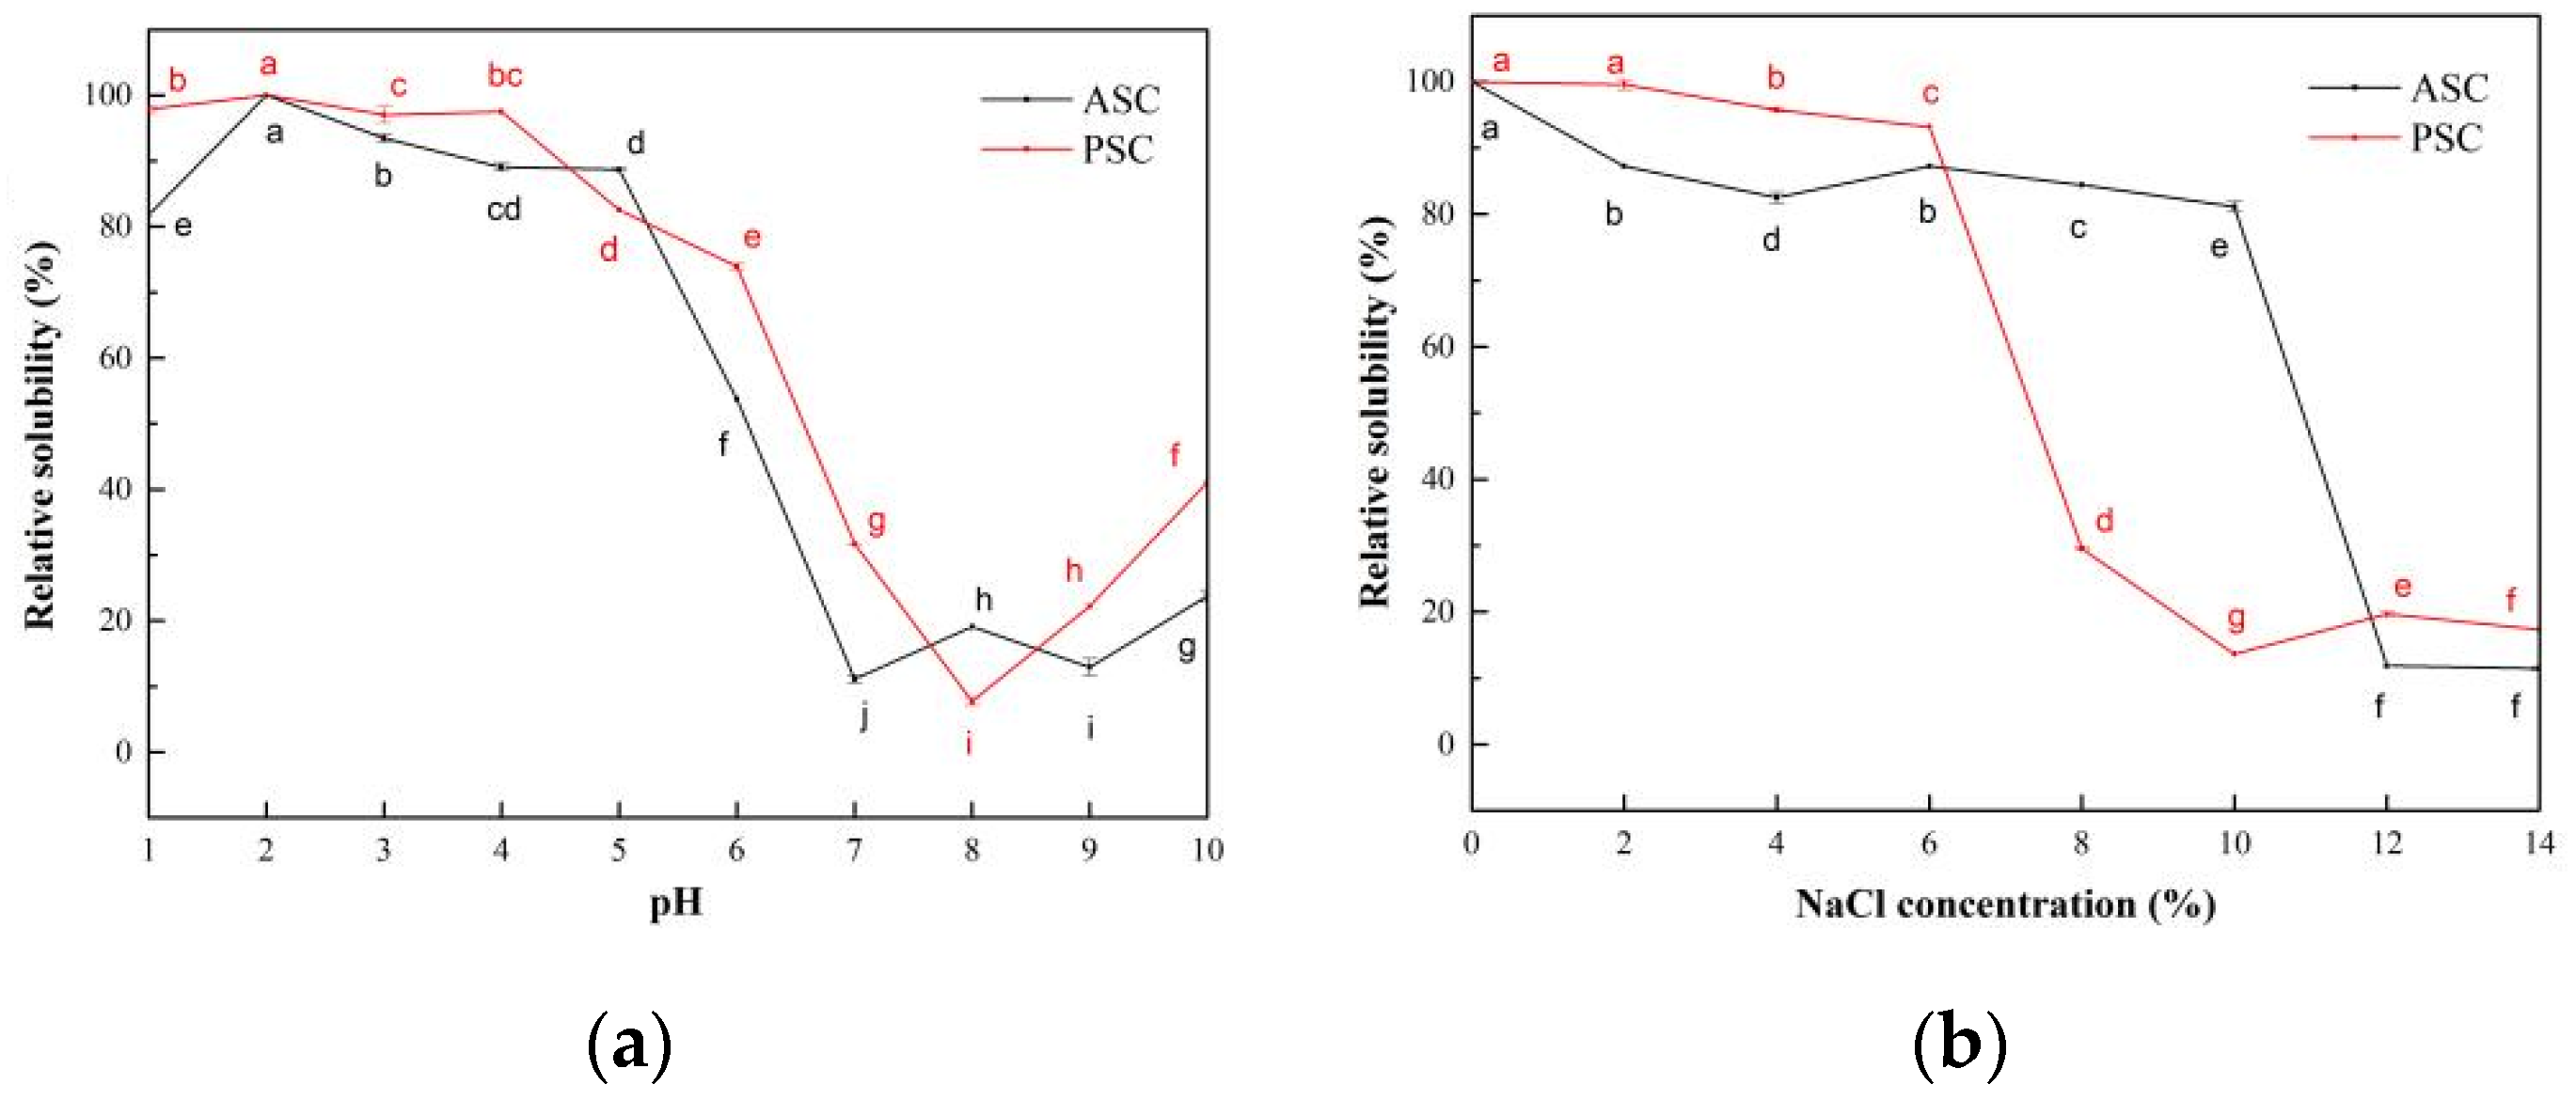
2.7. Solubility
2.7.1. The Influence of pH on the Solubility of Collagen Solutions
2.7.2. The Influence of NaCl Concentration on the Solubility of Collagen Solutions
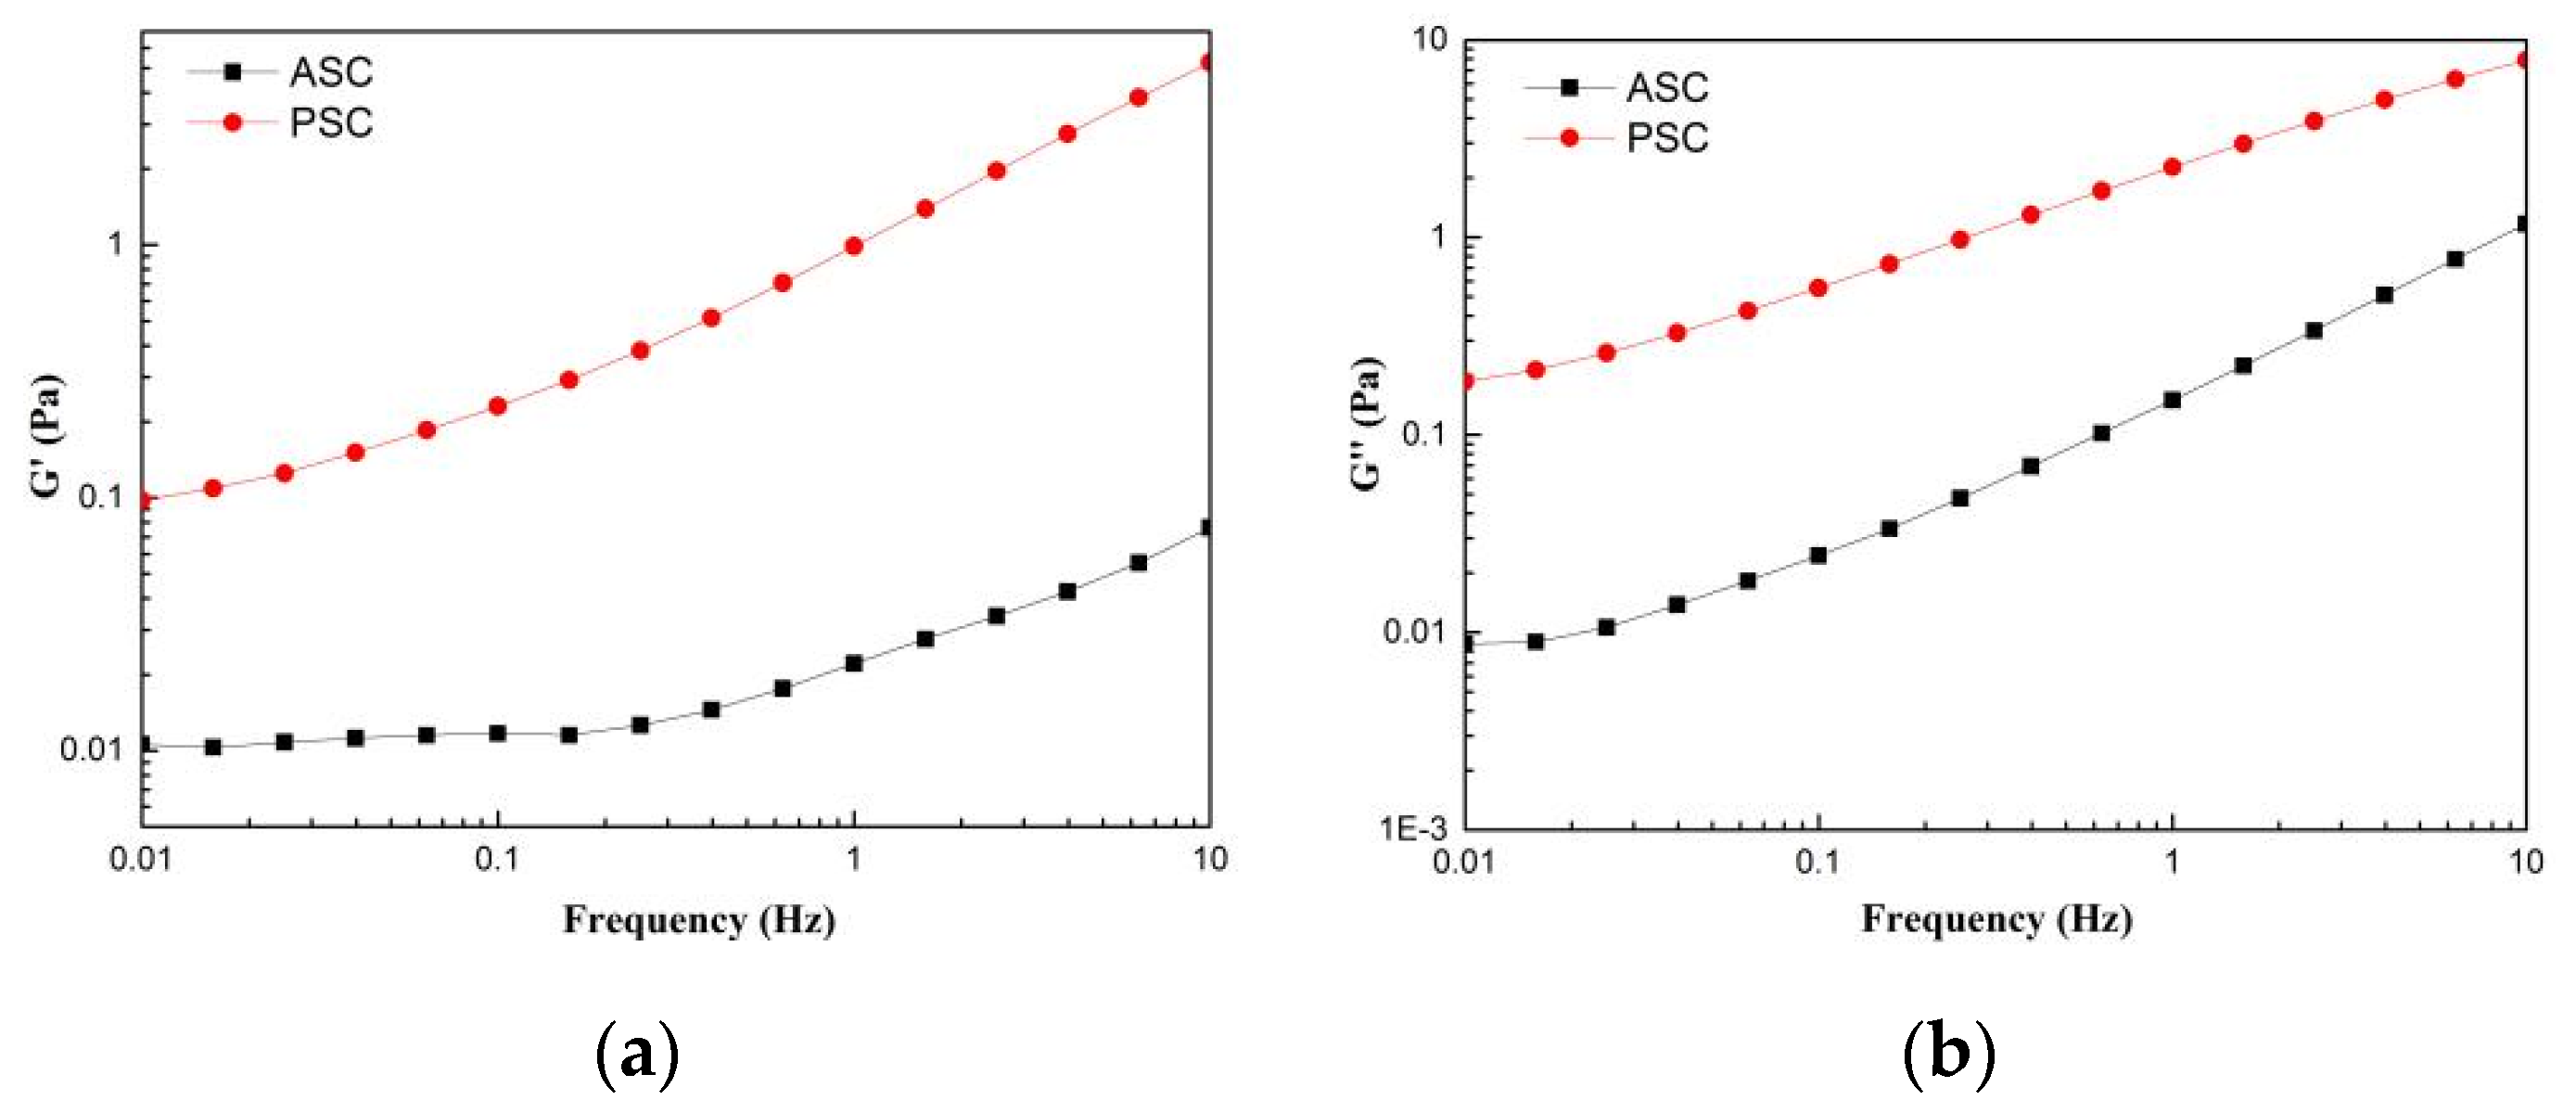
2.8. Rheological Properties
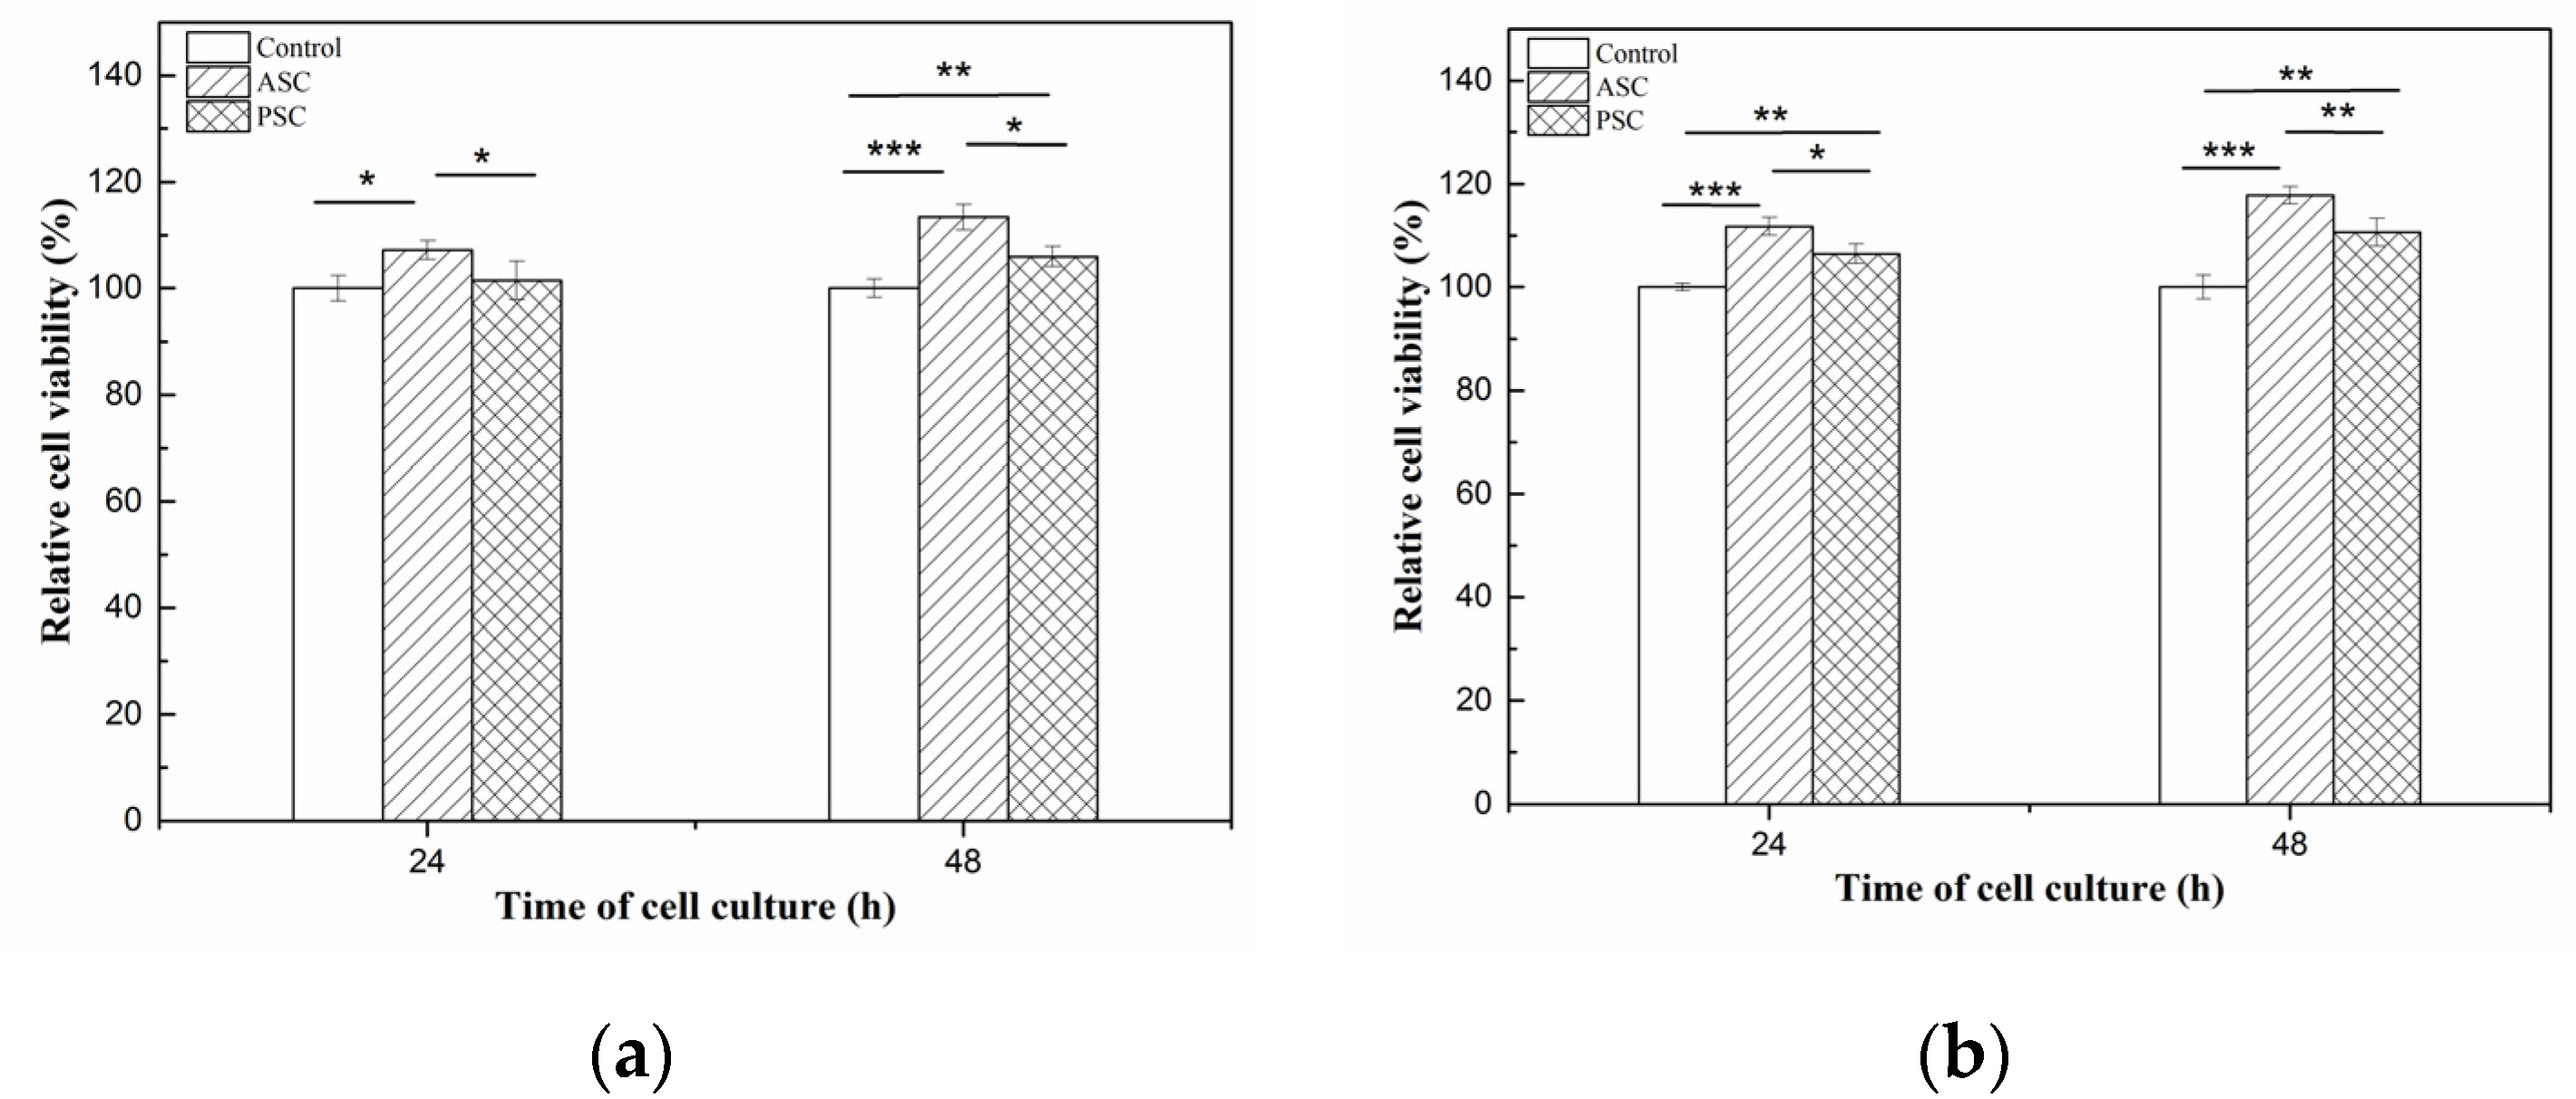
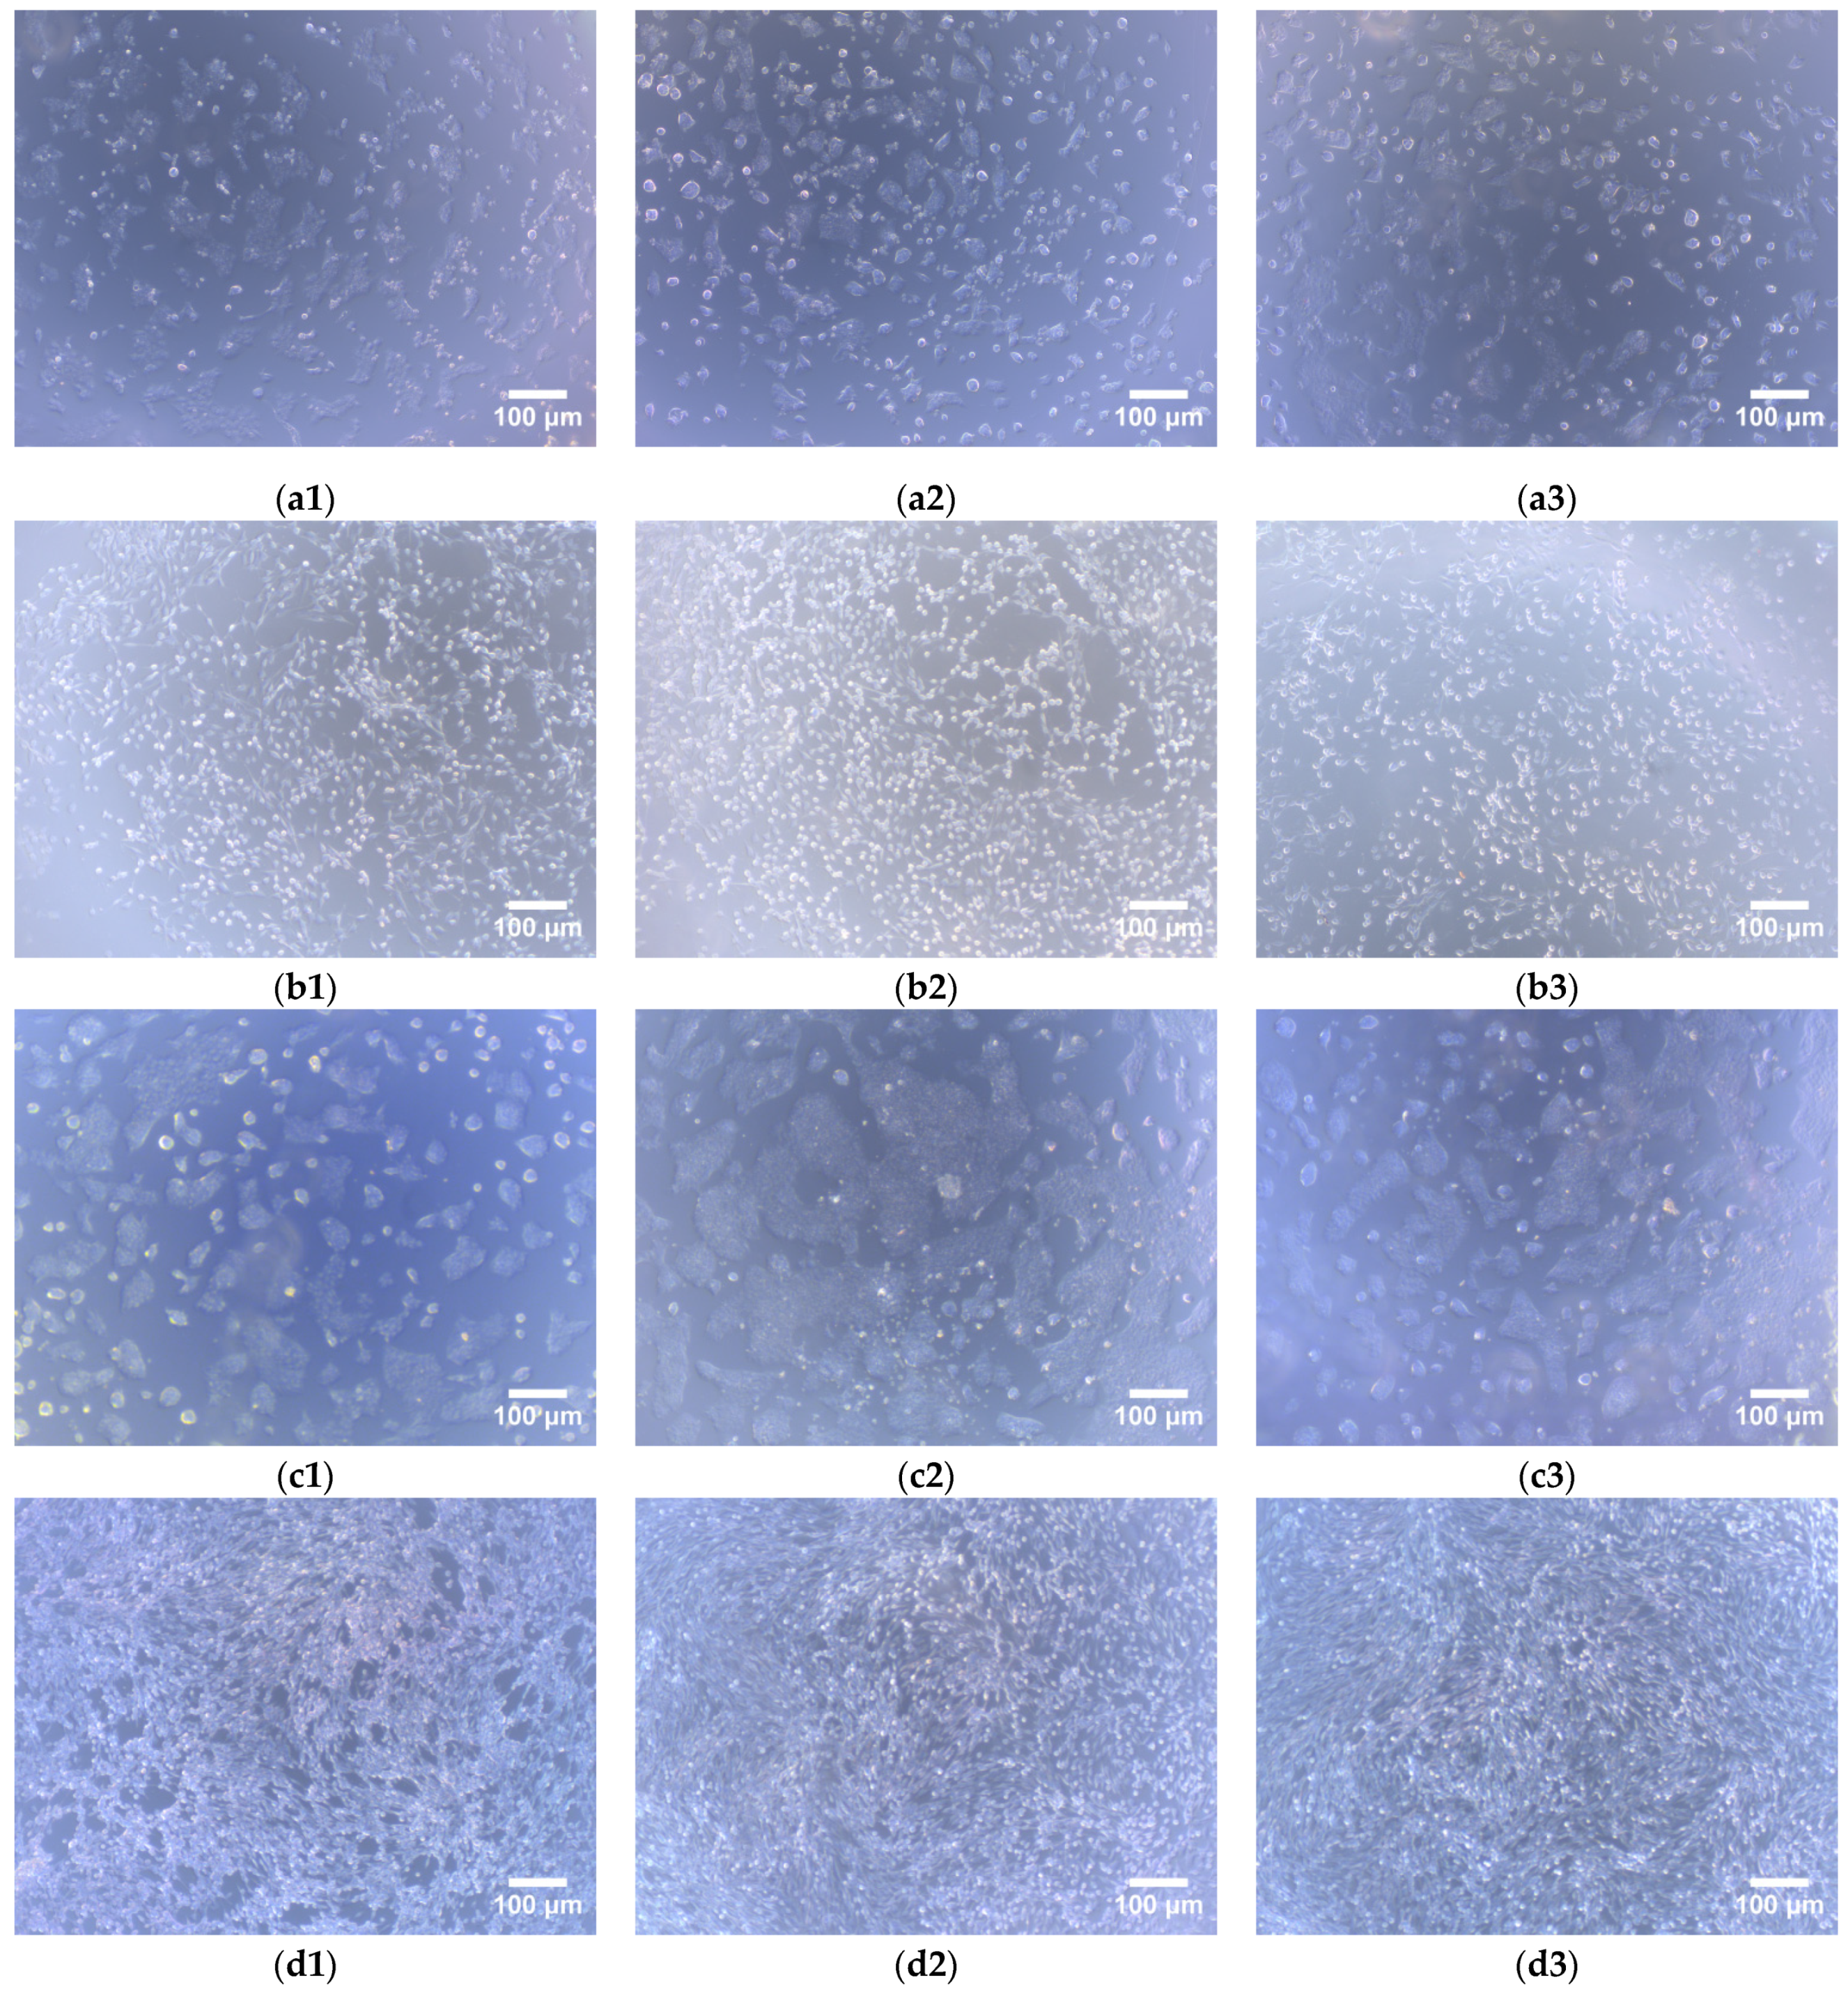
2.9. Cell Compatibility
3. Discussion
4. Materials and Methods
4.1. Materials
4.2. Preparation of Collagen
4.3. SDS-PAGE Characterization
4.4. Spectral Characterization
4.4.1. UV Spectrum
4.4.2. FTIR
4.4.3. CD
4.4.4. XRD
4.5. Amino Acid Analysis
4.6. Microscopy Characterisation
4.7. Thermal Stability
4.8. Solubility
4.8.1. Effect of pH
4.8.2. Effect of NaCl
4.9. Rheological Properties
4.10. Cell Compatibility and Cell Morphology
4.11. Statistical Analyses
5. Conclusions
Author Contributions
Funding
Institutional Review Board Statement
Informed Consent Statement
Data Availability Statement
Acknowledgments
Conflicts of Interest
References
- Ahmed, R.; Haq, M.; Chun, B.-S. Characterization of marine derived collagen extracted from the by-products of bigeye tuna (Thunnus obesus). Int. J. Biol. Macromol. 2019, 135, 668–676. [Google Scholar] [CrossRef]
- Lee, J.M.; Suen, S.K.Q.; Ng, W.L.; Ma, W.C.; Yeong, W.Y. Bioprinting of Collagen: Considerations, Potentials, and Applications. Macromol. Biosci. 2021, 21, e2000280. [Google Scholar] [CrossRef]
- Wang, S.; Zhao, J.; Chen, L.; Zhou, Y.; Wu, J. Preparation, isolation and hypothermia protection activity of antifreeze peptides from shark skin collagen. LWT 2014, 55, 210–217. [Google Scholar] [CrossRef]
- Hong, H.; Fan, H.; Roy, B.C.; Wu, J. Amylase enhances production of low molecular weight collagen peptides from the skin of spent hen, bovine, porcine, and tilapia. Food Chem. 2021, 352, 129355. [Google Scholar] [CrossRef]
- Davison-Kotler, E.; Marchall, W.S.; Garcia-Gareta, E. Sources of collagen for biomaterials in skin wound healing. Bioengineering 2019, 6, 56. [Google Scholar] [CrossRef] [Green Version]
- Faralizadeh, S.; Rahimabadi, E.Z.; Bahrami, S.H.; Hasannia, S. Extraction, characterization and biocompatibility evaluation of collagen from silver carp (Hypophthalmichthys molitrix) skin by-product. Sustain. Chem. Pharm. 2021, 22, 100454. [Google Scholar] [CrossRef]
- Bak, S.Y.; Lee, S.W.; Choi, C.H.; Kim, H.W. Assessment of the influence of acetic acid residue on type I collagen during iso-lation and characterization. Materials 2018, 11, 2518. [Google Scholar] [CrossRef] [Green Version]
- Rastian, Z.; Pütz, S.; Wang, Y.J.; Kumar, S.; Fleissner, F.; Weidner, T.; Parekh, S.H. Type i collagen from jellyfish catostylus mosaicus for biomaterial applications. ACS Biomater. Sci. Eng. 2018, 4, 2115–2125. [Google Scholar] [CrossRef]
- Subhan, F.; Ikram, M.; Shehzad, A.; Ghafoor, A. Marine Collagen: An Emerging Player in Biomedical applications. J. Food Sci. Technol. 2015, 52, 4703–4707. [Google Scholar] [CrossRef] [Green Version]
- Cruz-López, H.; Rodríguez-Morales, S.; Enríquez-Paredes, L.M.; Villarreal-Gómez, L.J.; Olivera-Castillo, L.; Cortes-Santiago, Y.; YadiraLópez, L.M. Comparison of collagen characteristic from the skin and swim bladder of gulf corvina (Cynoscion othonopterus). Tissue Cell 2021, 72, 101593. [Google Scholar] [CrossRef]
- Addad, S.; Exposito, J.-Y.; Faye, C.; Ricard-Blum, S.; Lethias, C. Isolation, Characterization and Biological Evaluation of Jellyfish Collagen for Use in Biomedical Applications. Mar. Drugs 2011, 9, 967–983. [Google Scholar] [CrossRef] [Green Version]
- Tziveleka, L.-A.; Ioannou, E.; Tsiourvas, D.; Berillis, P.; Foufa, E.; Roussis, V. Collagen from the marine sponges Axinella can-nabina and Suberites carnosus: Isolation and morphological, biochemical, and biophysical characterization. Mar. Drugs 2017, 15, 152. [Google Scholar] [CrossRef] [Green Version]
- Coppola, D.; Lauritano, C.; Esposito, F.P.; Riccio, G.; Rizzo, C.; de Pascale, D. Fish Waste: From problem to valuable resource. Mar. Drugs 2021, 19, 116. [Google Scholar] [CrossRef]
- Jafari, H.; Lista, A.; Siekapen, M.M.; Ghaffari-Bohlouli, P.; Nie, L.; Alimoradi, H.; Shavandi, A. Fish Collagen: Extraction, characterization, and applications for biomaterials engineering. Polymers 2020, 12, 2230. [Google Scholar] [CrossRef]
- Li, D.; Gao, Y.; Wang, Y.; Yang, X.; He, C.; Zhu, M.; Zhang, S.; Mo, X. Evaluation of biocompatibility and immunogenicity of micro/nanofiber materials based on tilapia skin collagen. J. Biomater. Appl. 2019, 33, 1118–1127. [Google Scholar] [CrossRef]
- Caruso, G.; Floris, R.; Serangeli, C.; Di Paola, L. Fishery Wastes as a Yet Undiscovered Treasure from the Sea: Biomolecules Sources, Extraction Methods and Valorization. Mar. Drugs 2020, 18, 622. [Google Scholar] [CrossRef]
- Liu, Y.; Ma, D.; Wang, Y.; Qin, W. A comparative study of the properties and self-aggregation behavior of collagens from the scales and skin of grass carp (Ctenopharyngodon idella). Int. J. Biol. Macromol. 2018, 106, 516–522. [Google Scholar] [CrossRef]
- Chen, J.; Li, L.; Yi, R.; Xu, N.; Gao, R.; Hong, B. Extraction and characterization of acid-soluble collagen from scales and skin of tilapia (Oreochromis niloticus). LWT 2016, 66, 453–459. [Google Scholar] [CrossRef]
- Tangguh, H.L.; Prahasanti, C.; Ulfah, N.; Krismariono, A. Characterization of pepsin-soluble collagen extracted from gourami (Osphronemus goramy) scales. Niger. J. Clin. Pract. 2021, 24, 89–92. [Google Scholar] [CrossRef]
- Li, L.Y.; Zhao, Y.Q.; He, Y.; Chi, C.F.; Wang, B. Physicochemical and antioxidant properties of acid- and pepsin-soluble col-lagens from the scales of miiuy croaker (Miichthys miiuy). Mar. Drugs 2018, 16, 394. [Google Scholar] [CrossRef] [Green Version]
- Pal, G.K.; Suresh, P.V. Physico-chemical characteristics and fibril-forming capacity of carp swim bladder collagens and ex-ploration of their potential bioactive peptides by in silico approaches. Int. J. Biol. Macromol. 2017, 101, 304–313. [Google Scholar] [CrossRef]
- Sun, L.; Li, B.; Song, W.; Si, L.; Hou, H. Characterization of Pacific cod (Gadus macrocephalus) skin collagen and fabrication of collagen sponge as a good biocompatible biomedical material. Process. Biochem. 2017, 63, 229–235. [Google Scholar] [CrossRef]
- Li, C.; Song, W.; Wu, J.; Lu, M.; Zhao, Q.; Fang, C.; Wang, W.; Park, Y.-D.; Qian, G.-Y. Thermal stable characteristics of acid- and pepsin-soluble collagens from the carapace tissue of Chinese soft-shelled turtle (Pelodiscus sinensis). Tissue Cell 2020, 67, 101424. [Google Scholar] [CrossRef]
- Zhang, J.; Duan, R.; Ye, C.; Konno, K. Isolation and characterization of collagens from scale of silver carp (hypophthalmichthys molitrix). J. Food Biochem. 2010, 34, 1343–1354. [Google Scholar] [CrossRef]
- Chen, J.; Li, M.; Yi, R.; Bai, K.; Wang, G.; Tan, R.; Sun, S.; Xu, N. Electrodialysis extraction of pufferfish skin (Takifugu flavidus): A promising source of collagen. Mar. Drugs 2019, 17, 25. [Google Scholar] [CrossRef] [Green Version]
- Sun, L.; Hou, H.; Li, B.; Zhang, Y. Characterization of acid- and pepsin-soluble collagen extracted from the skin of Nile tilapia (Oreochromis niloticus). Int. J. Biol. Macromol. 2017, 99, 8–14. [Google Scholar] [CrossRef]
- Zhu, S.C.; Yuan, Q.J.; Yang, M.T.; You, J.; Yin, T.; Gu, Z.P.; Hu, Y.; Xiong, S.B. A quantitative comparable study on multi-hierarchy conformation of acid and pepsin-solubilized collagens from the skin of grass carp (Ctenopharyngodon idella). Mater. Sci. Eng. C 2018, 96, 446–457. [Google Scholar] [CrossRef]
- Liu, A.; Zhang, Z.; Hou, H.; Zhao, X.; Li, B.; Zhao, T.; Liu, L. Characterization of Acid- and Pepsin-Soluble Collagens from the Cuticle of Perinereis nuntia (Savigny). Food Biophys. 2018, 13, 274–283. [Google Scholar] [CrossRef]
- Chen, J.; Li, J.; Li, Z.; Yi, R.; Shi, S.; Wu, K.; Li, Y.; Wu, S. Physicochemical and Functional Properties of Type I Collagens in Red Stingray (Dasyatis akajei) Skin. Mar. Drugs 2019, 17, 558. [Google Scholar] [CrossRef] [Green Version]
- Tang, Y.; Jin, S.; Li, X.; Li, X.; Hu, X.; Chen, Y.; Huang, F.; Yang, Z.; Yu, F.; Ding, G. Physicochemical properties and biocompatibility evaluation of collagen from the skin of giant croaker (Nibea japonica). Mar. Drugs 2018, 16, 222. [Google Scholar] [CrossRef] [Green Version]
- Sun, B.; Li, C.; Mao, Y.; Qiao, Z.; Jia, R.; Huang, T.; Xu, D.; Yang, W. Distinctive characteristics of collagen and gelatin extracted from Dosidicus gigas skin. Int. J. Food Sci. Technol. 2021, 56, 3443–3454. [Google Scholar] [CrossRef]
- Song, Z.; Liu, H.; Chen, L.; Chen, L.; Zhou, C.; Hong, P.; Deng, C. Characterization and comparison of collagen extracted from the skin of the Nile tilapia by fermentation and chemical pretreatment. Food Chem. 2021, 340, 128139. [Google Scholar] [CrossRef]
- Chen, X.H.; Jin, W.G.; Chen, D.J.; Dong, M.R.; Xin, X.; Li, C.Y.; Xu, Z. Collagens made from giant salamander (Andrias da-vidianus) skin and their odorants. Food Chem. 2021, 361, 130061. [Google Scholar] [CrossRef]
- Akram, A.N.; Zhang, C. Effect of ultrasonication on the yield, functional and physicochemical characteristics of collagen-II from chicken sternal cartilage. Food Chem. 2020, 307, 125544. [Google Scholar] [CrossRef]
- Ma, Y.H.; Teng, A.G.; Zhang, K.X.; Zhang, K.; Zhao, H.Y.; Duan, S.M.; Liu, S.Z.; Guo, Y.; Wang, W.H. A top-down approach to improve collagen film’s performance: The comparisons of macro, micro and nano sized fibers-sciencedirect. Food Chem. 2020, 309, 125624. [Google Scholar] [CrossRef]
- Guo, S.J.; He, L.L.; Yang, R.Q.; Chen, B.Y.; Xie, X.D.; Jiang, B.; Tian, W.D.; Ding, Y. Enhanced effects of electrospun collagen-chitosan nanofiber membranes on guided bone regeneration. J. Biomater. Sci. Polym. Ed. 2020, 31, 155–168. [Google Scholar] [CrossRef]
- Pal, G.K.; Suresh, P. Comparative assessment of physico-chemical characteristics and fibril formation capacity of thermostable carp scales collagen. Mater. Sci. Eng. C 2017, 70, 32–40. [Google Scholar] [CrossRef]
- Kaewdang, O.; Benjakul, S.; Kaewmanee, T.; Kishimura, H. Characteristics of collagens from the swim bladders of yellowfin tuna (Thunnus albacares). Food Chem. 2014, 155, 264–270. [Google Scholar] [CrossRef]
- Matmaroh, K.; Benjakul, S.; Prodpran, T.; Encarnacion, A.B.; Kishimura, H. Characteristics of acid soluble collagen and pepsin soluble collagen from scale of spotted golden goatfish (Parupeneus heptacanthus). Food Chem. 2011, 129, 1179–1186. [Google Scholar] [CrossRef]
- Wang, S.-S.; Yu, Y.; Sun, Y.; Liu, N.; Zhou, D.-Q. Comparison of physicochemical characteristics and fibril formation ability of collagens extracted from the skin of farmed river puffer (Takifugu obscurus) and Tiger Puffer (Takifugu rubripes). Mar. Drugs 2019, 17, 462. [Google Scholar] [CrossRef] [Green Version]
- Zhou, C.S.; Li, Y.H.; Yu, X.J.; Yang, H.; Ma, H.L.; Yagoub, A.E.A.; Cheng, Y.; Hu, J.L.; Otu, P.N.Y. Extraction and characterization of chicken feet soluble collagen. LWT-Food Sci. Technol. 2016, 74, 145–153. [Google Scholar] [CrossRef]
- Chuaychan, S.; Benjakul, S.; Kishimura, H. Characteristics of acid- and pepsin-soluble collagens from scale of seabass (Lates calcarifer). LWT Food Sci. Technol. 2015, 63, 71–76. [Google Scholar] [CrossRef]
- Zhang, Y.; Liu, W.; Li, G.; Shi, B.; Miao, Y.; Wu, X. Isolation and partial characterization of pepsin-soluble collagen from the skin of grass carp (Ctenopharyngodon idella). Food Chem. 2007, 103, 906–912. [Google Scholar] [CrossRef]
- Zhong, M.; Chen, T.; Hu, C.Q.; Ren, C.H. Isolation and characterization of collagen from the body wall of sea cucumber sti-chopus monotuberculatus. J. Food Sci. 2015, 80, C671–C679. [Google Scholar] [CrossRef] [PubMed]
- Chen, J.; Liu, Y.; Wang, G.; Sun, S.; Liu, R.; Hong, B.; Gao, R.; Bai, K. Processing optimization and characterization of angiotensin-Ι-converting enzyme inhibitory peptides from lizardfish (Synodus macrops) scale gelatin. Mar. Drugs 2018, 16, 228. [Google Scholar] [CrossRef] [Green Version]
- Nalinanon, S.; Benjakul, S.; Kishimura, H. Collagens from the skin of arabesque greenling (Pleurogrammus azonus) solubilized with the aid of acetic acid and pepsin from albacore tuna (Thunnus alalunga) stomach. J. Sc. Food Agr. 2010, 90, 1492–1500. [Google Scholar] [CrossRef]
- Oliveira, V.D.M.; Assis, C.R.D.; Costa, B.D.A.M.; Neri, R.C.D.A.; Monte, F.T.D.; Freitas, H.M.S.D.C.V.; França, R.C.P.; Santos, J.F.; Bezerra, R.D.S.; Porto, A.L.F. Physical, biochemical, densitometric and spectroscopic techniques for characterization collagen from alternative sources: A review based on the sustainable valorization of aquatic by-products. J. Mol. Struct. 2021, 1224, 129023. [Google Scholar] [CrossRef]
- Chen, Y.; Jin, H.; Yang, F.; Jin, S.; Liu, C.; Zhang, L.; Huang, J.; Wang, S.; Yan, Z.; Cai, X.; et al. Physicochemical, antioxidant properties of giant croaker (Nibea japonica) swim bladders collagen and wound healing evaluation. Int. J. Biol. Macromol. 2019, 138, 483–491. [Google Scholar] [CrossRef]
- Jongjareonrak, A.; Benjakul, S.; Visessanguan, W.; Nagai, T.; Tanaka, M. Isolation and characterisation of acid and pep-sin-solubilised collagens from the skin of brownstripe red snapper (Lutjanus vitta). Food Chem. 2005, 93, 475–484. [Google Scholar] [CrossRef]
- Kiew, P.L.; Mashitah, M.D. Isolation and characterization of collagen from the skin of Malaysian catfish (Hybrid Clarias sp.). J. Korean Soc. Appl. Biol. Chem. 2013, 56, 441–450. [Google Scholar] [CrossRef]
- Laemmli, U.K. Cleavage of structural proteins during the assembly of the head of bacteriophage T4. Nature 1970, 227, 680–685. [Google Scholar] [CrossRef] [PubMed]
- Lowry, O.H.; Rosebrough, N.J.; Farr, A.L.; Randall, R.J. Protein measurement with the Folin phenol reagent. J. Biol. Chem. 1951, 193, 265–275. [Google Scholar] [CrossRef]
- Sripriya, R.; Kumar, R. A Novel Enzymatic Method for Preparation and Characterization of Collagen Film from Swim Bladder of Fish Rohu (Labeo rohita). Food Nutr. Sci. 2015, 6, 1468–1478. [Google Scholar] [CrossRef] [Green Version]


| Amino Acid | ASC | PSC |
|---|---|---|
| Aspartic acid | 15 ± 1 | 16 ± 2 |
| Glutamine acid | 13 ± 1 | 11 ± 1 |
| Serine | 50 ± 2 | 51 ± 2 |
| Histidine | 7 ± 1 | 7 ± 2 |
| Glycine | 351 ± 19 | 349 ± 21 |
| Threonine | 29 ± 2 | 30 ± 3 |
| Arginine | 15 ± 1 | 14 ± 1 |
| Alanine | 161 ± 11 | 159 ± 14 |
| Tyrosine | 5 ± 1 | 5 ± 1 |
| Valine | 25 ± 2 | 26 ± 1 |
| Methionine | 8 ± 1 | 7 ± 1 |
| Phenylalanine | 11 ± 2 | 12 ± 1 |
| Isoleucine | 8 ± 2 | 10 ± 2 |
| Leucine | 26 ± 3 | 25 ± 1 |
| Lysine | 35 ± 4 | 37 ± 2 |
| Proline | 158 ± 9 | 157 ± 7 |
| Hydroxylysine | 4 ± 1 | 5 ± 1 |
| Hydroxyproline | 79 ± 9 | 79 ± 7 |
| Total | 1000 | 1000 |
| Proline + Hydroxyproline | 237 ± 16 | 236 ± 14 |
Publisher’s Note: MDPI stays neutral with regard to jurisdictional claims in published maps and institutional affiliations. |
© 2021 by the authors. Licensee MDPI, Basel, Switzerland. This article is an open access article distributed under the terms and conditions of the Creative Commons Attribution (CC BY) license (https://creativecommons.org/licenses/by/4.0/).
Share and Cite
Chen, J.; Wang, G.; Li, Y. Preparation and Characterization of Thermally Stable Collagens from the Scales of Lizardfish (Synodus macrops). Mar. Drugs 2021, 19, 597. https://doi.org/10.3390/md19110597
Chen J, Wang G, Li Y. Preparation and Characterization of Thermally Stable Collagens from the Scales of Lizardfish (Synodus macrops). Marine Drugs. 2021; 19(11):597. https://doi.org/10.3390/md19110597
Chicago/Turabian StyleChen, Junde, Guangyu Wang, and Yushuang Li. 2021. "Preparation and Characterization of Thermally Stable Collagens from the Scales of Lizardfish (Synodus macrops)" Marine Drugs 19, no. 11: 597. https://doi.org/10.3390/md19110597
APA StyleChen, J., Wang, G., & Li, Y. (2021). Preparation and Characterization of Thermally Stable Collagens from the Scales of Lizardfish (Synodus macrops). Marine Drugs, 19(11), 597. https://doi.org/10.3390/md19110597