
Integrated Modelling of Decentralised Energy Supply in Combination with Electric Vehicle Charging in a Real-Life Case Study


Abstract
1. Introduction
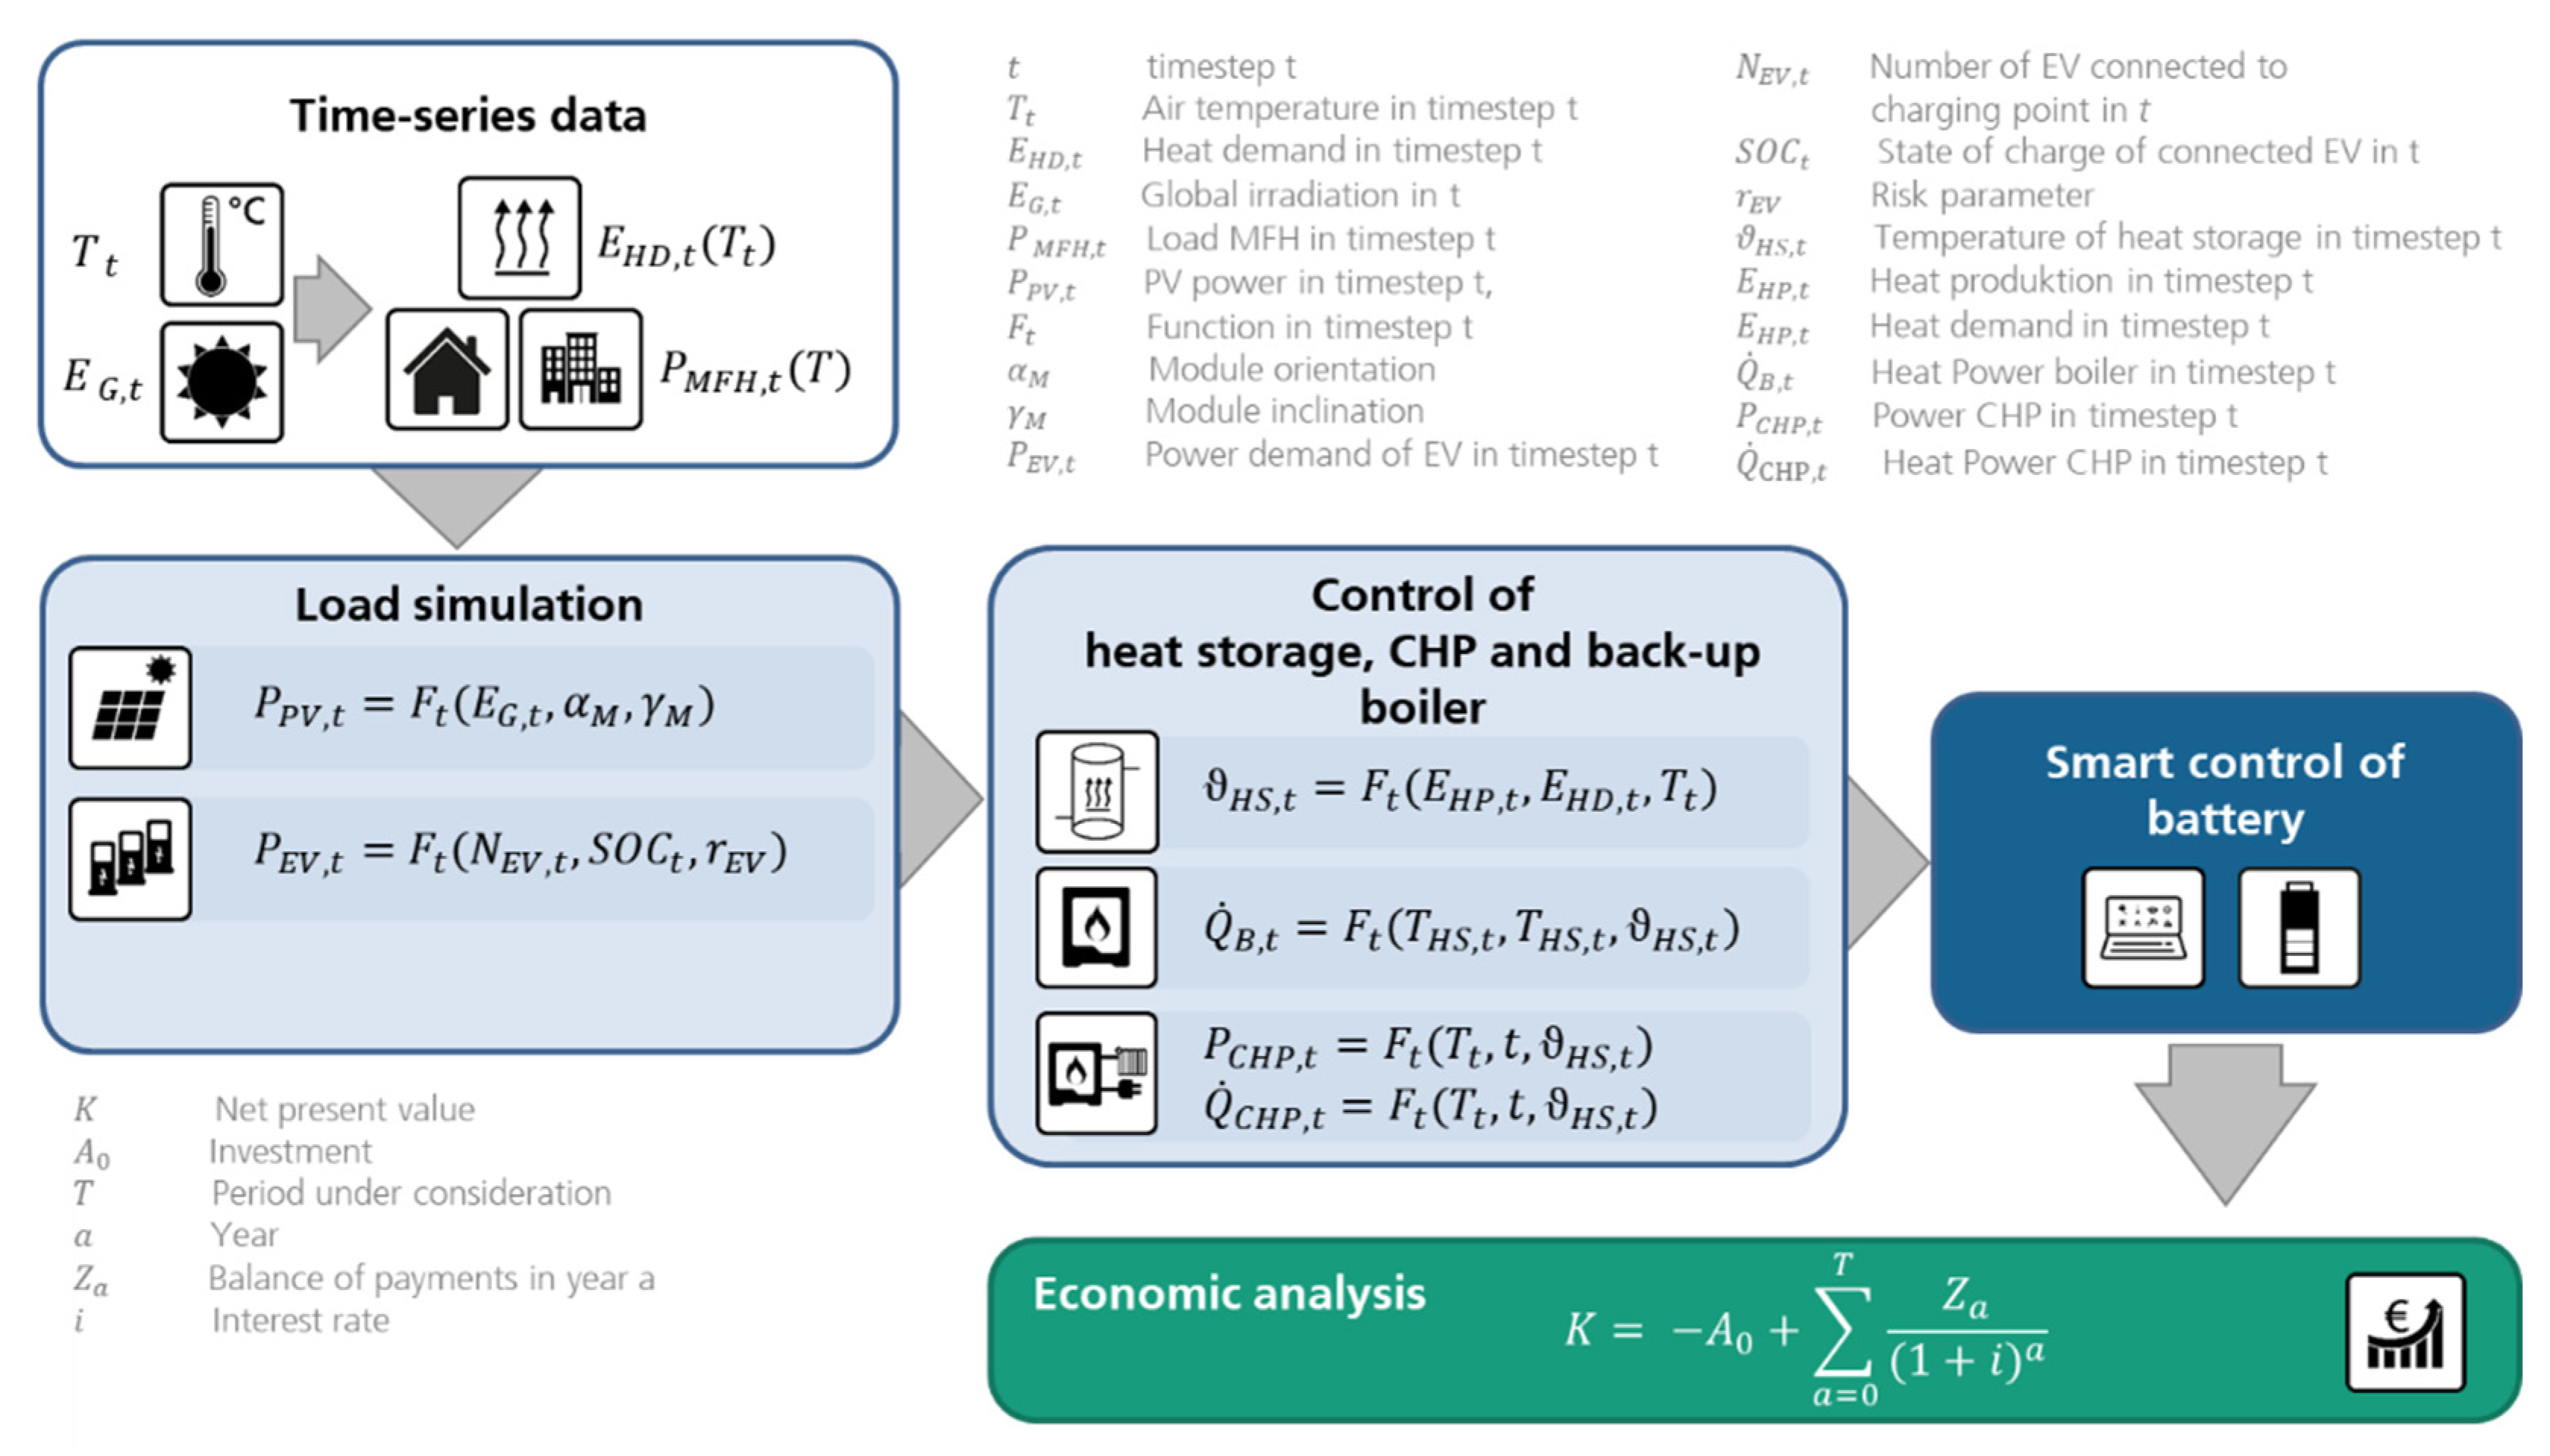
2. Methodology
2.1. Time-Series Data
2.2. Load Simulation
2.3. CHP, Back-up Boiler and Heat Storage
2.4. Battery Operation Strategies
2.5. Economic Analysis
3. Results
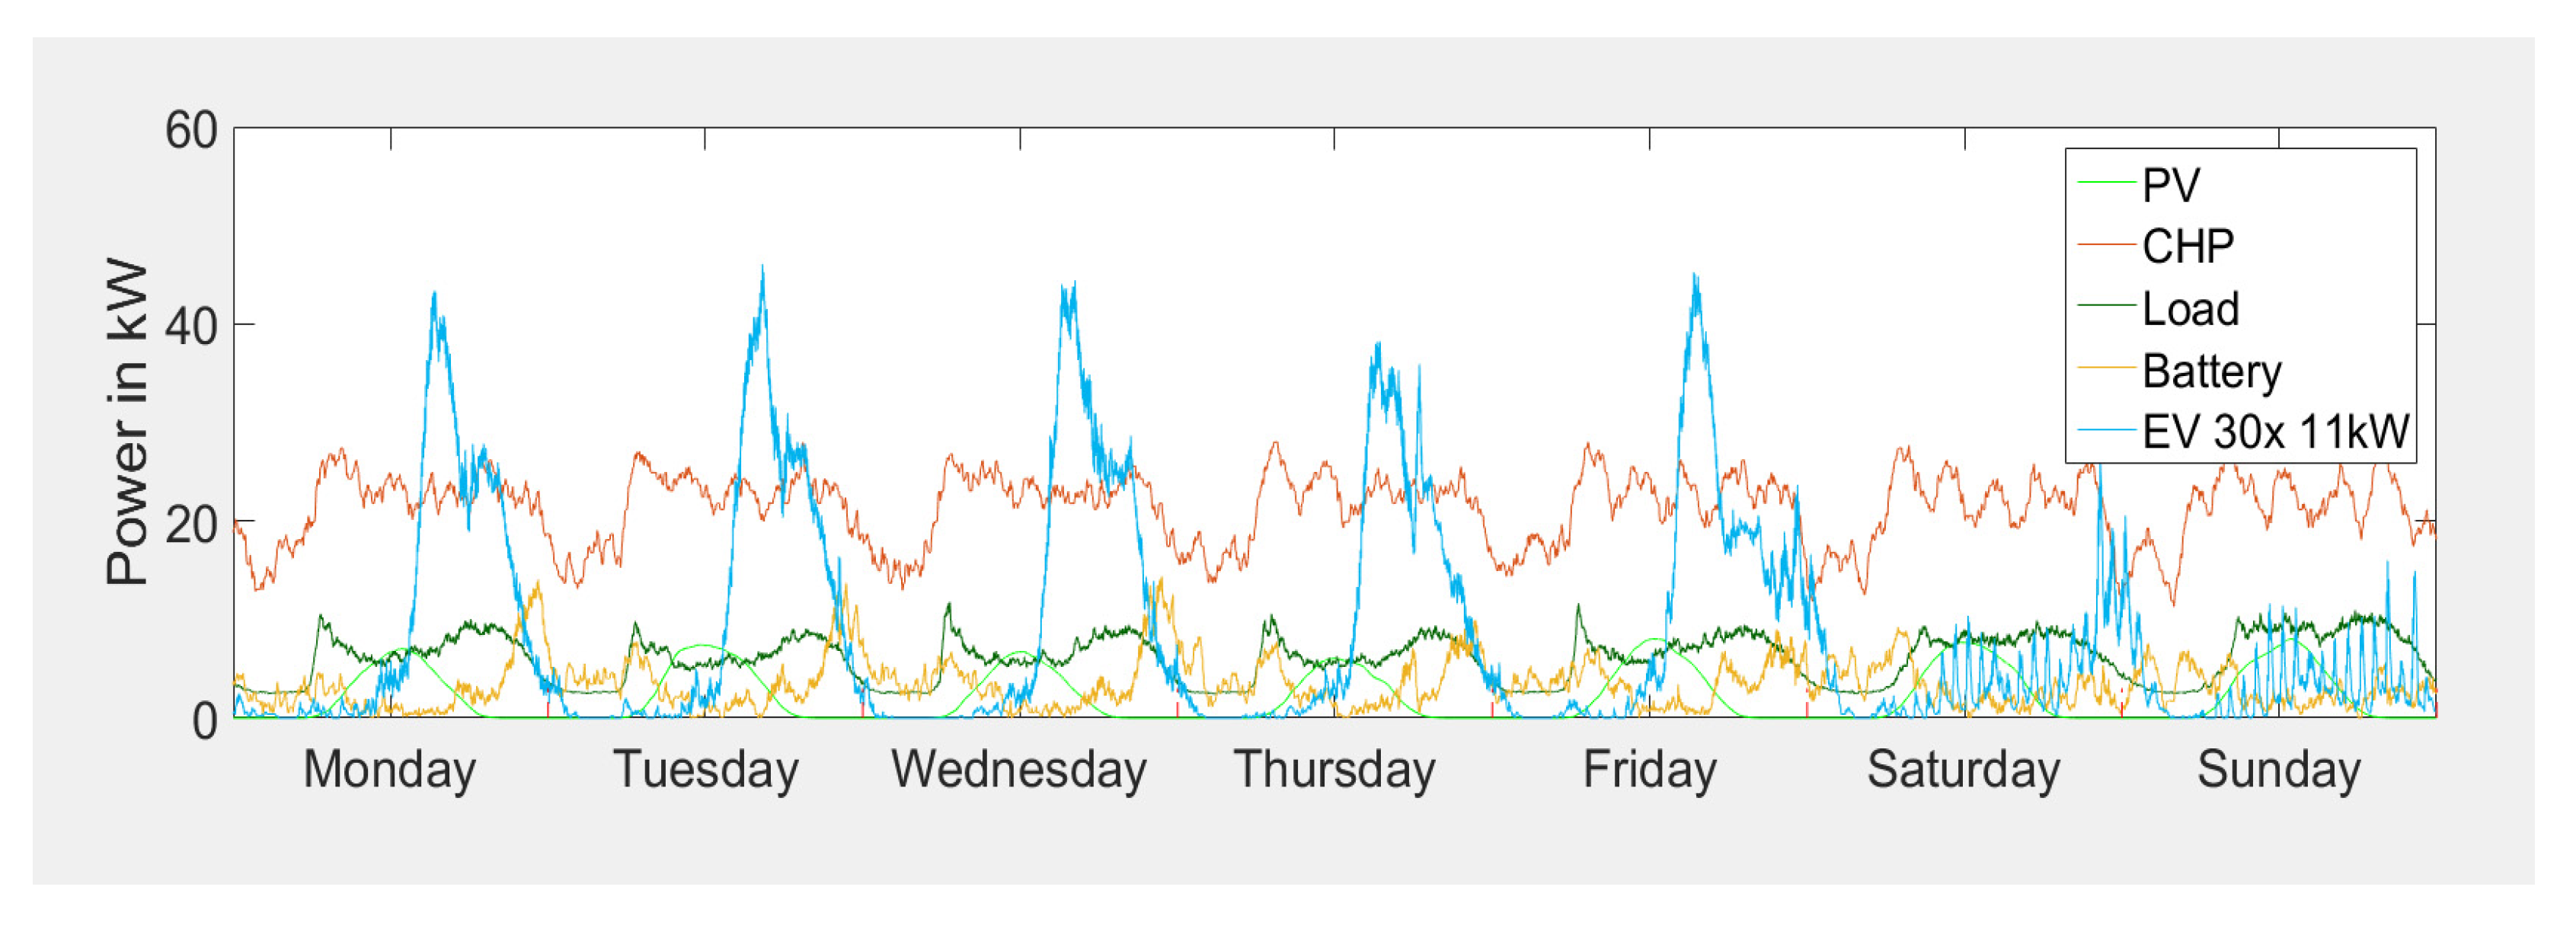
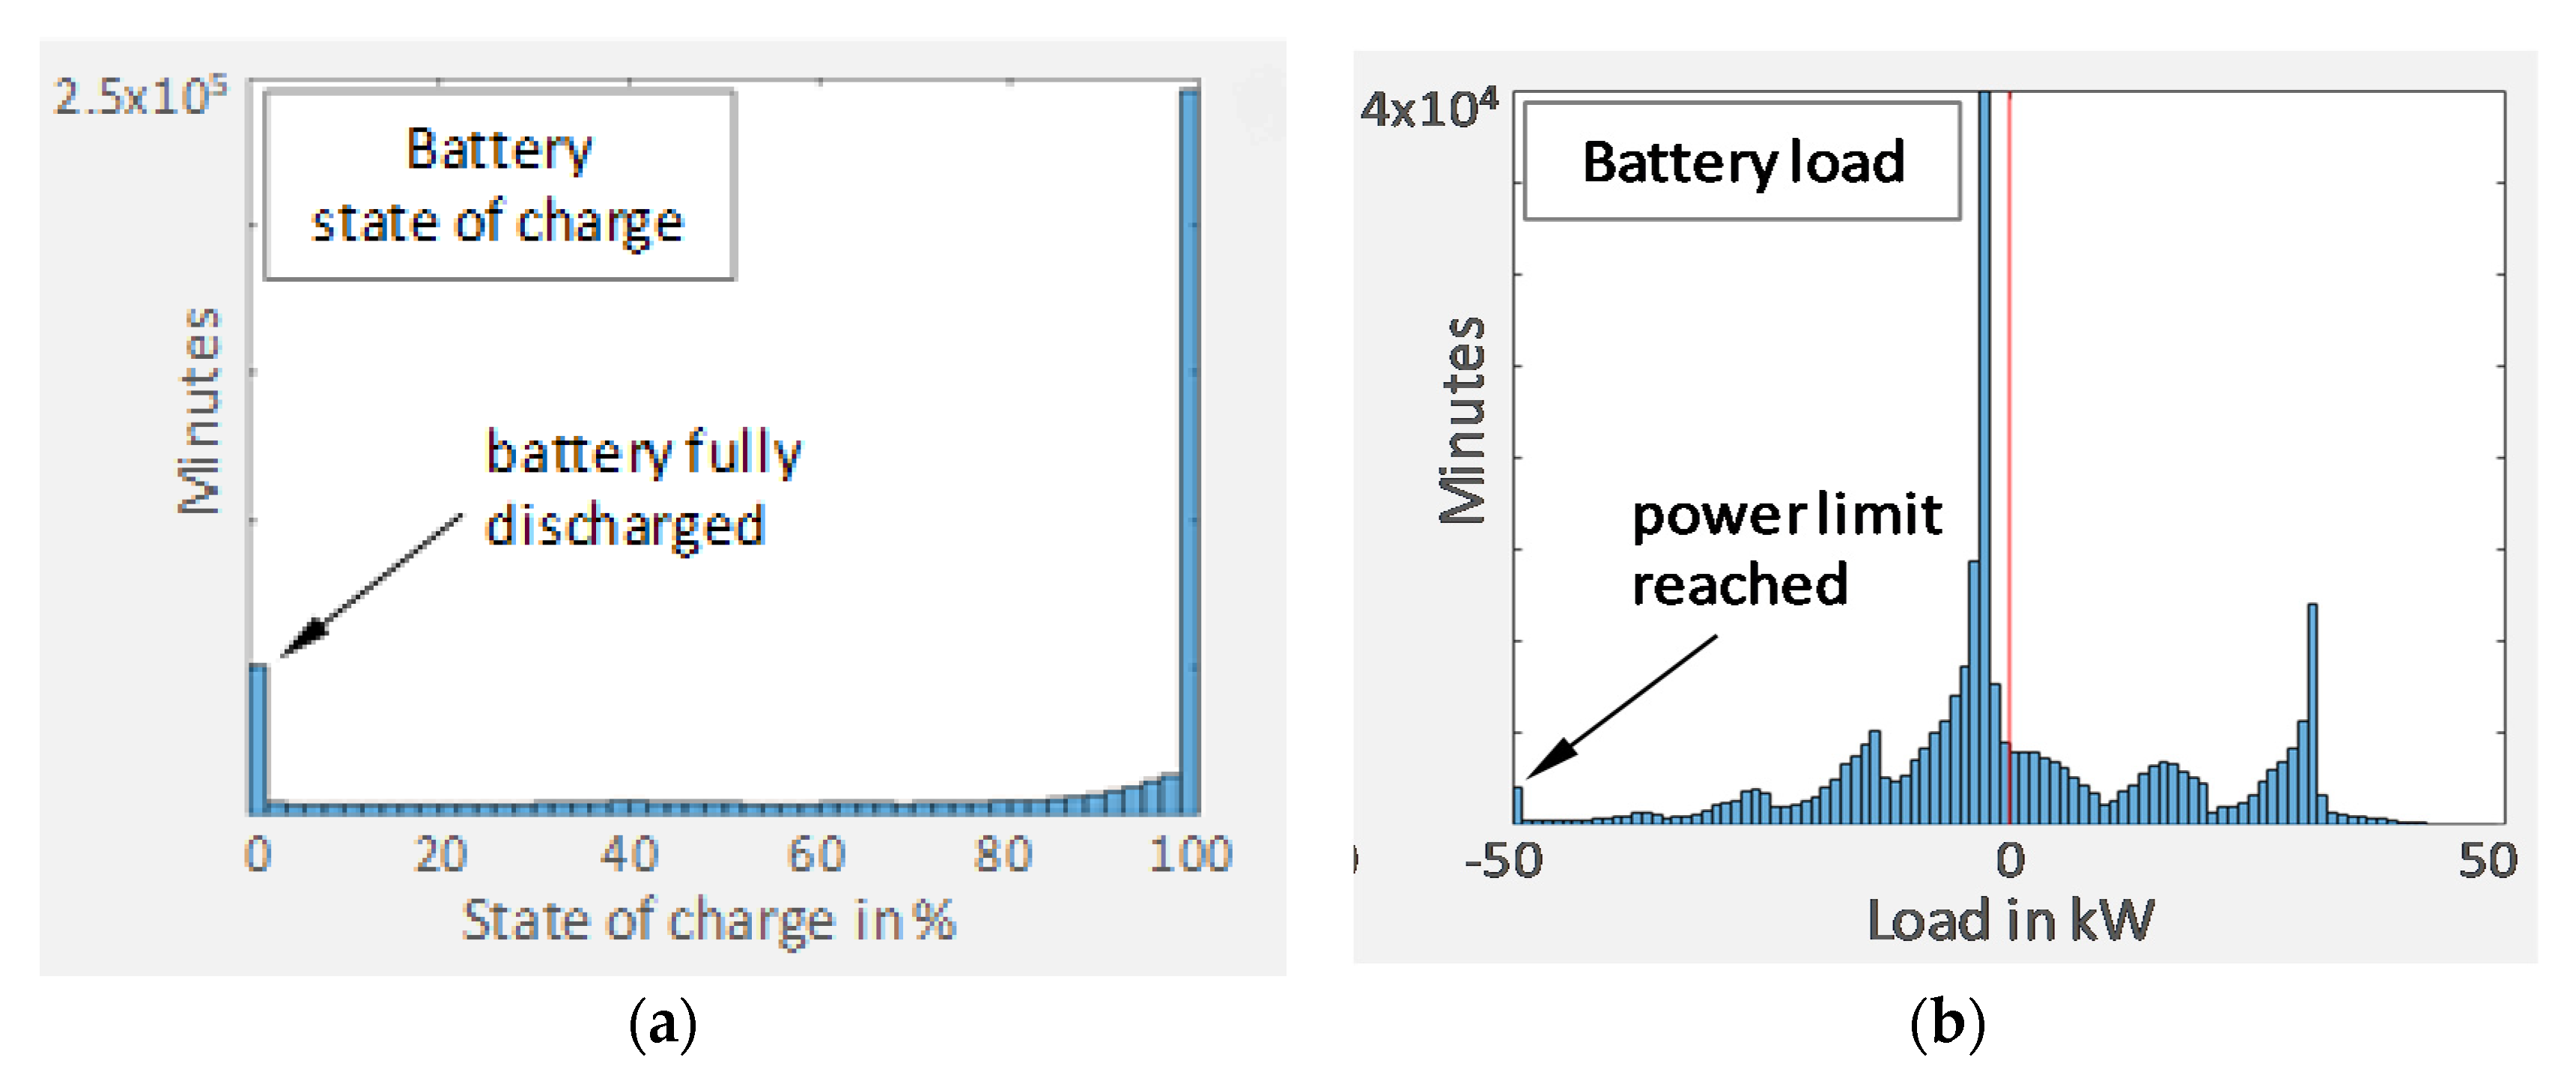
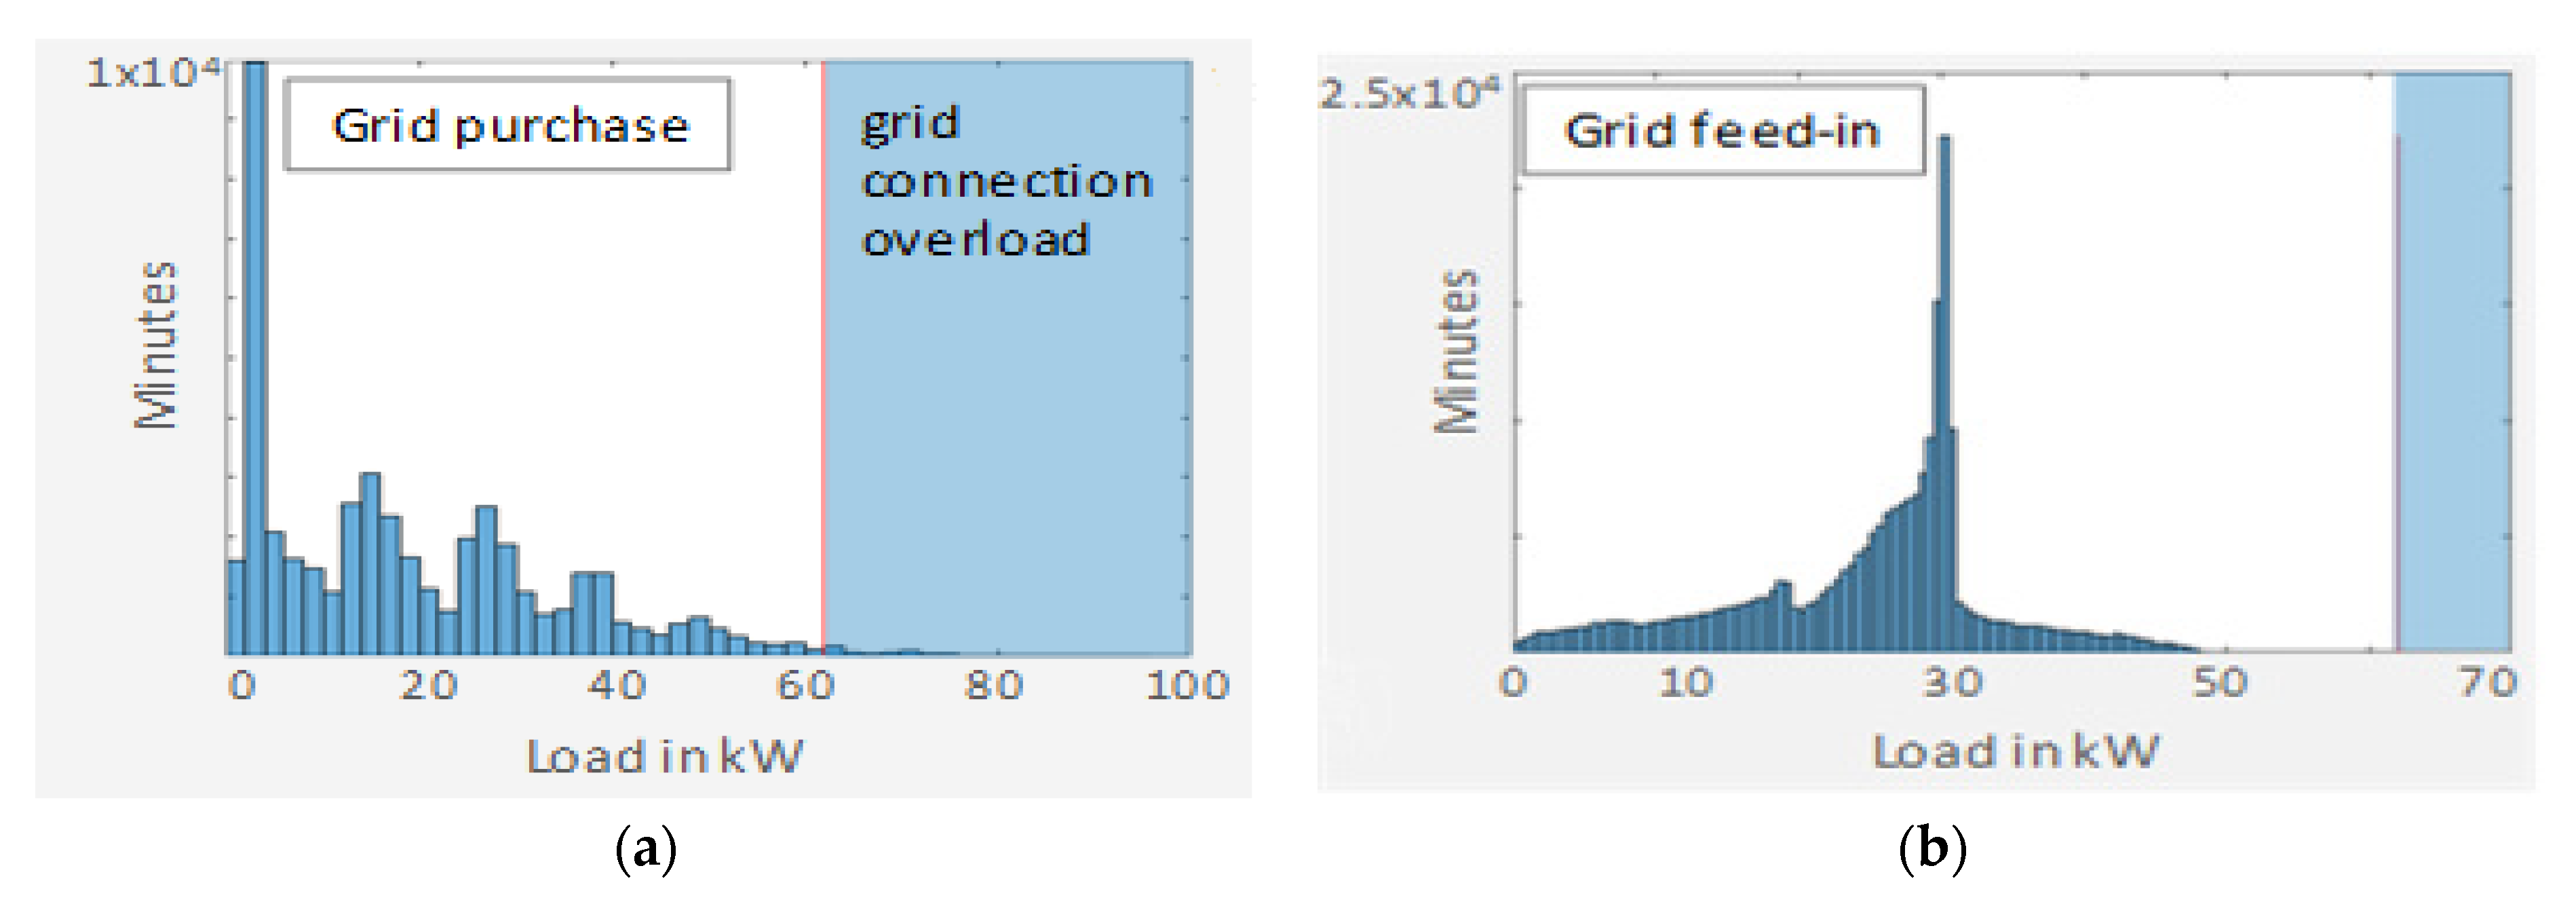
3.1. Load Simulation Results with a PV + CHP + Battery + EV System (Scenario S4)
3.2. Comparison of Scenarios
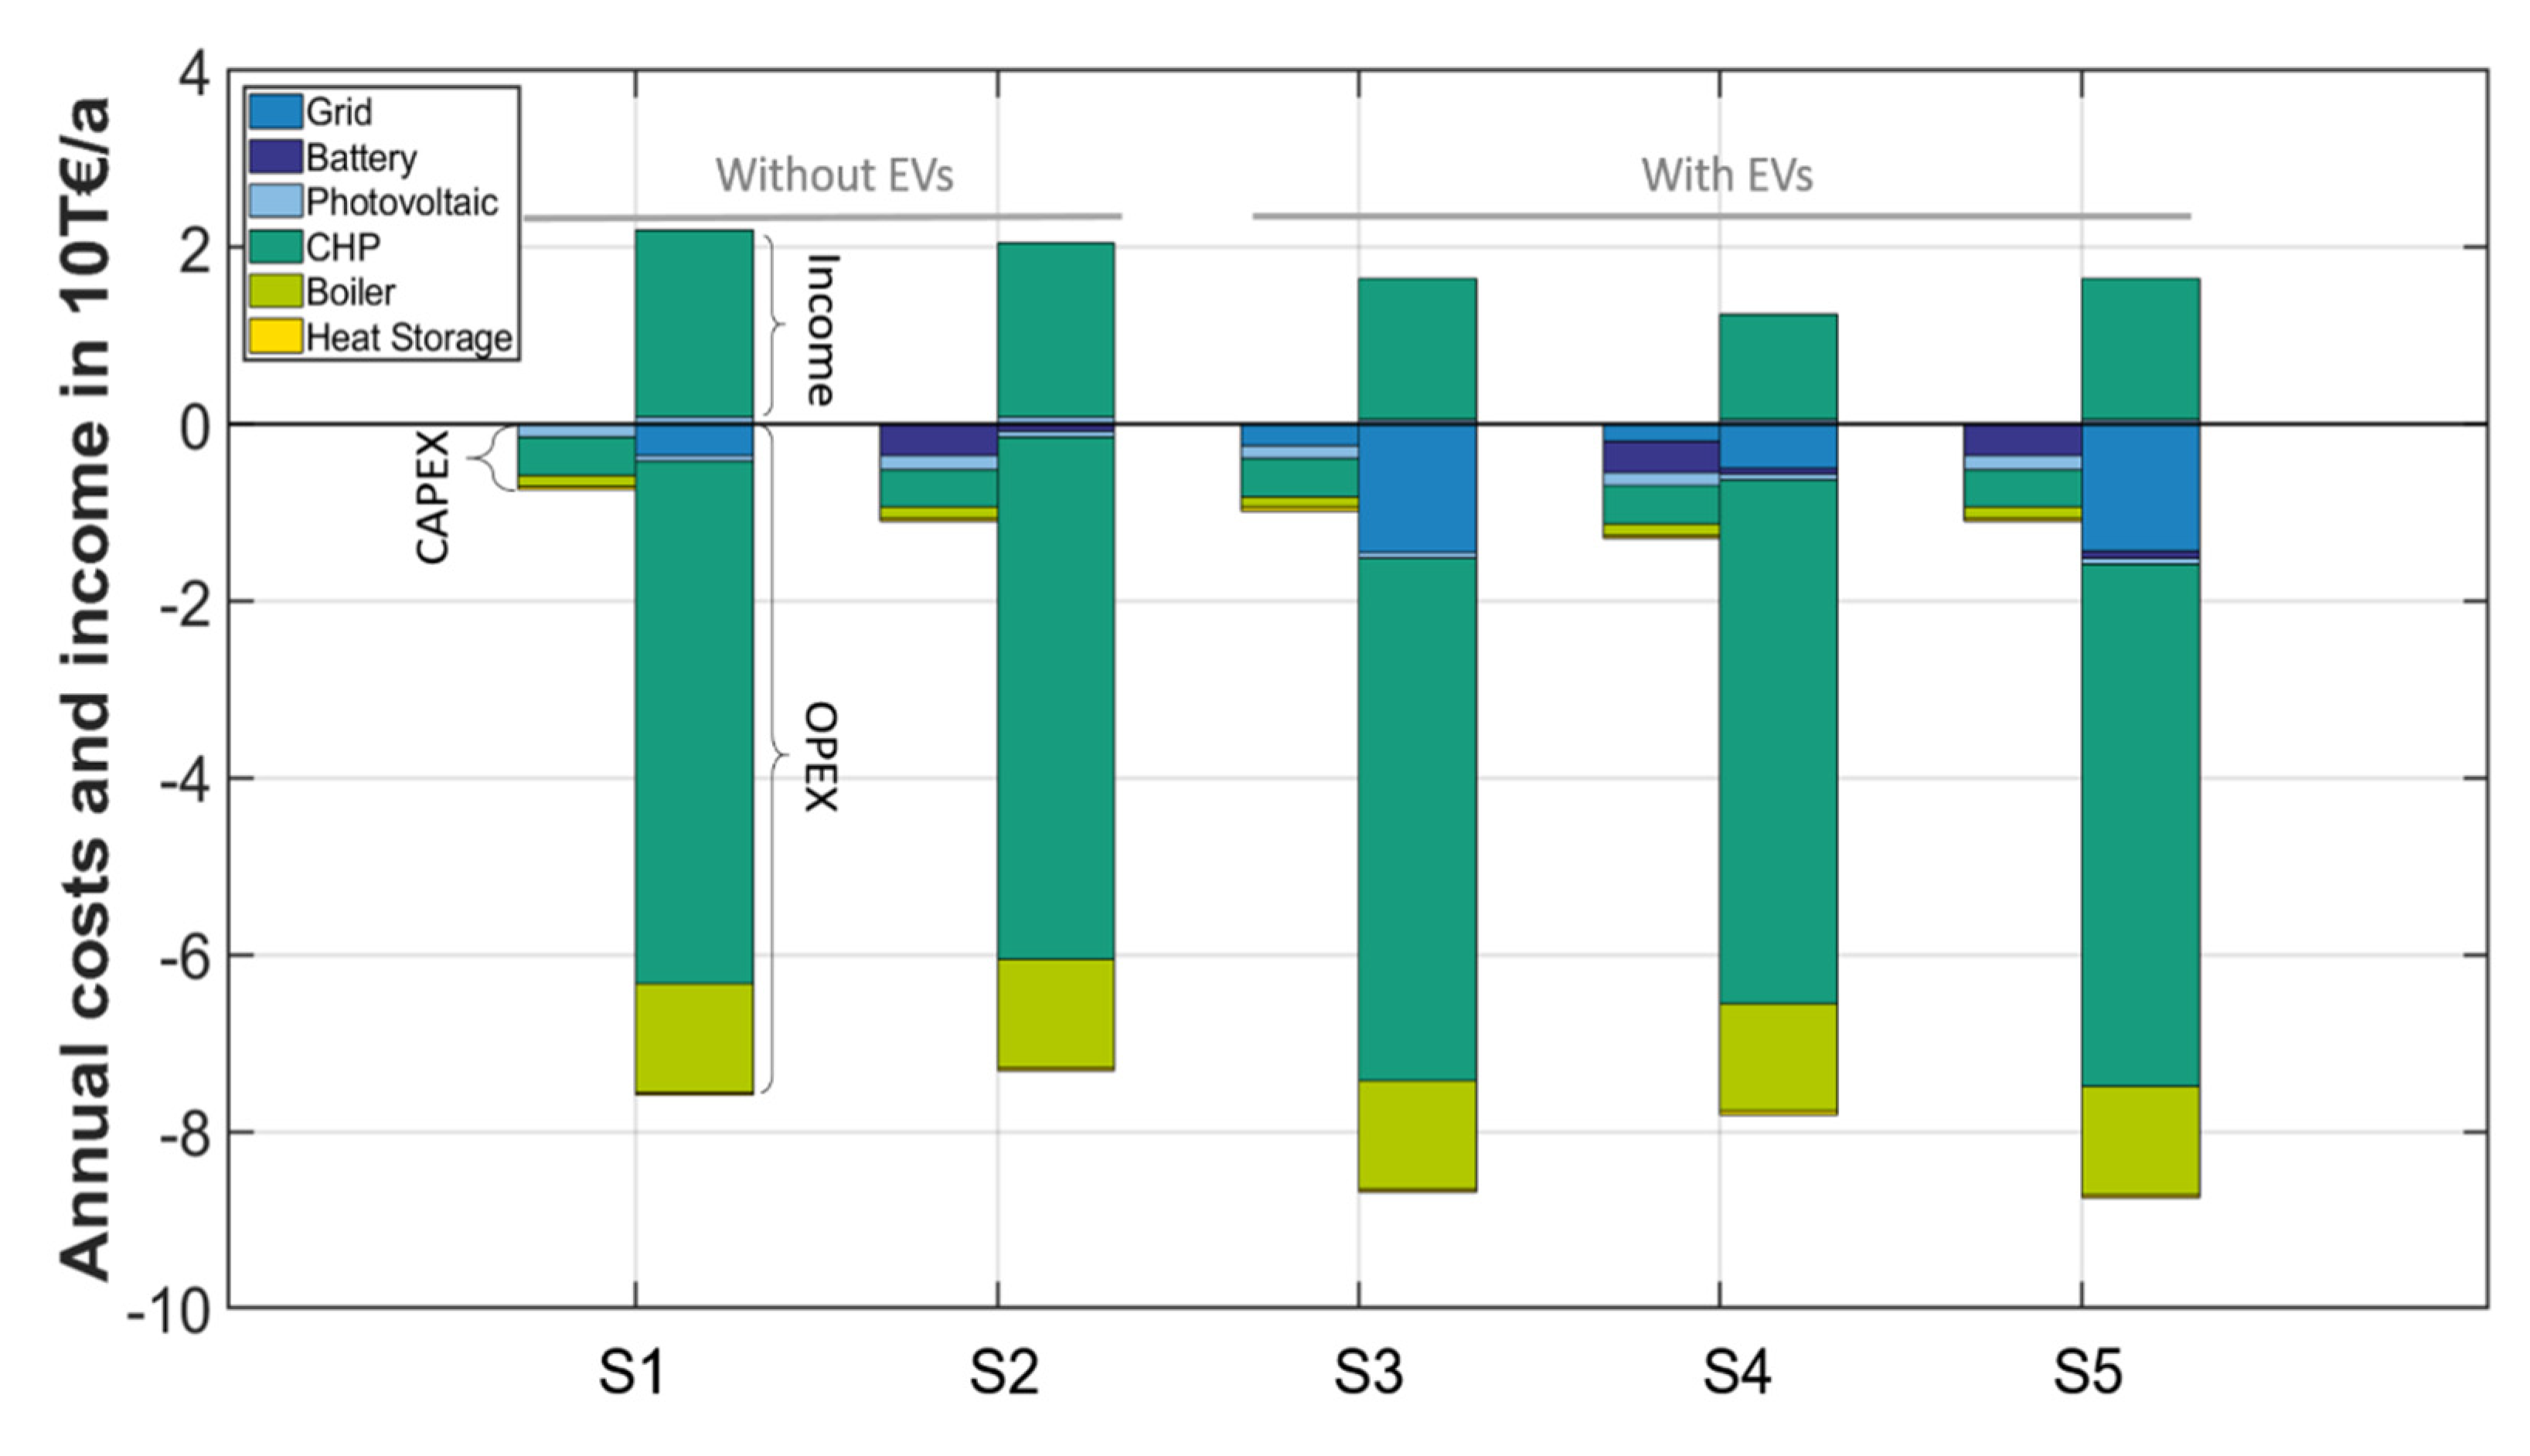
3.3. Economic Analysis of the Case Study
3.4. Model Validation with Real-Life Data
4. Discussion
5. Conclusions
Author Contributions
Funding
Institutional Review Board Statement
Informed Consent Statement
Data Availability Statement
Conflicts of Interest
References
- EU Commission, EPBD Recast. Directive 2010/31/EU of the European Parliament and of the Council of 19 May 2010 on the energy performance of buildings (recast). Off. J. Eur. Union 2010, 13–35. Available online: https://eur-lex.europa.eu/LexUriServ/LexUriServ.do?uri=OJ:L:2010:153:0013:0035:en:PDF (accessed on 15 October 2021).
- Satori, I.; Napolitano, A.; Voss, K. Net zero energy buildings: A consistent definition framework. Energy Build. 2012, 48, 220–232. [Google Scholar] [CrossRef]
- Good, C.; Kristjansdottír, T.; Wiberg, A.H.; Georges, L.; Hestnes, A.G. Influence of PV technology and system design on the emission balance of a net zero emission building concept. Sol. Energy 2016, 130, 89–100. [Google Scholar] [CrossRef]
- Klingler, A.-L. Self-consumption with PV + Battery systems: A market diffusion model considering individual consumer behaviour and preferences. Appl. Energy 2017, 205C, 1560–1570. [Google Scholar] [CrossRef]
- Claudy, M.C.; O’Driscoll, A.; Duffy, A. Home Owners’ Attitudes, Perceptions and Willingness to Pay for Microgeneration Technologies; Dublin Institute of Technology: Dublin, Ireland, 2010. [Google Scholar]
- Peter, R.; Peter, V. Solar based technology: A case study of challenges in a developing economy. In Proceedings of the International Conference of the Society for Global Business & Economic Development (SGBED), Montclair, NJ, USA, 21–24 June 2016; pp. 455–466. [Google Scholar]
- Scarpa, R.; Willis, K. Willingness-to-pay for renewable energy: Primary and discretionary choice of British households’ for micro-generation technologies. Energy Econ. 2010, 32, 129–136. [Google Scholar] [CrossRef]
- Timme, M.; Kocarev, L.; Witthaut, D. Focus on networks, energy and the economy. New J. Phys. 2015, 17, 110201. [Google Scholar] [CrossRef]
- Clulow, Z.; Ferguson, M.; Ashworth, P.; Reiner, D. Comparing public attitudes towards energy technologies in Australia and the UK: The role of political ideology. Glob. Environ. 2021, 70, 102327. [Google Scholar] [CrossRef]
- Engelken, M.; Römer, B.; Drescher, M.; Welpe, I. Why homeowners strive for energy self-supply and how policy makers can influence them. Energy Policy 2018, 117, 423–433. [Google Scholar] [CrossRef]
- Grosche, P.; Vance, C. Willingness to Pay for Energy Conservation and Free-Ridership on Subsidization: Evidence from Germany. Energy J. 2009, 30. [Google Scholar] [CrossRef]
- Davidovic, D.; Harring, N.; Jagers, S.C. The contingent effects of environmental concern and ideology: Institutional context and people’s willingness to pay environmental taxes. Environ. Politics 2020, 29, 674–696. [Google Scholar] [CrossRef]
- Ellison, G. Draft Summary Report of Findings. 2004. Available online: https://www.yumpu.com/en/document/view/17782820/ (accessed on 20 August 2020).
- Devine-Wright, P.; Batel, S.; Aas, O.; Sovacool, B.; Labelle, M.C.; Ruud, A. A conceptual framework for understanding the social acceptance of energy infrastructure: Insights from energy storage. Energy Policy 2017, 107, 27–31. [Google Scholar] [CrossRef]
- Gährs, S.; Mehler, K.; Bost, M.; Hirschl, B. Acceptance of Ancillary Services and Willingness to Invest in PV-storage-systems. Energy Procedia 2015, 73, 29–36. [Google Scholar] [CrossRef]
- Oberst, C.; Madlener, R. Prosumer Preferences Regarding the Adoption of Micro-Generation Technologies. In FCN Working Paper No. 22/2014; Institute for Future Energy Consumer Needs and Behavior, RWTH Aachen University: Aachen, Germany, 2015. [Google Scholar]
- Palm, J.; Tengvard, M. Motives for and barriers to household adoption of small-scale production of electricity: Examples from Sweden. Sustain. Sci. Pract. Policy 2011, 7, 6–15. [Google Scholar] [CrossRef]
- Claird, S.; Roy, R. Adoption and Use of Household Microgeneration Heat Technologies. Low Carbon Econ. 2010, 1, 61–70. [Google Scholar] [CrossRef]
- Munoz, L.; Huijben, J.; Verhees, B.; Verbon, G. The power of grid parity: A discursive approach. Technol. Forecast. Soc. Chang. 2014, 87, 179–190. [Google Scholar] [CrossRef]
- KfW. KfW-Programm Erneuerbare Energien “Speicher”; KfW: Frankfurt, Germany, 2018. [Google Scholar]
- BnetzA. Homepage der Bundesnetzagentur. 2020. Available online: https://www.bundesnetzagentur.de/DE/Sachgebiete/ElektrizitaetundGas/Unternehmen_Institutionen/ErneuerbareEnergien/ZahlenDatenInformationen/EEG_Registerdaten/ArchivDatenMeldgn/ArchivDatenMeldgn_node.html (accessed on 15 September 2021).
- KWKG. Gesetz für die Erhaltung, die Modernisierung und den Ausbau der Kraft-Wärme-Kopplung (Kraft-Wärme-Kopplungsgesetz—KWKG). 2015. Available online: https://www.gesetze-im-internet.de/kwkg_2016/BJNR249810015.html (accessed on 19 October 2021).
- EEG. Gesetz für den Ausbau Erneuerbarer Energien (Erneuerbare-Energien-Gesetz—EEG 2017). 2017. Available online: https://www.gesetze-im-internet.de/eeg_2014/BJNR106610014.html (accessed on 19 October 2021).
- BMWI. Homepage Bundesministerium für Wirtschaft und Energie. 2020. Available online: https://www.bmwi.de/Redaktion/DE/Artikel/Energie/strompreise-bestandteile.html (accessed on 19 October 2021).
- Philipps, D.S.; Bett, D.A.; Rau, D.B.; Schlatmann, P.D. Technologiebericht 1.3 Photovoltaik. In Wuppertal Institut, ISI, IZES (Hrsg.): Technologien für die Energiewende. Teilbericht 2 an das Bundesministerium für Wirtschaft und Energie (BMWI); Wuppertal, Karlsruhe, Saarbrücken; Available online: https://epub.wupperinst.org/frontdoor/deliver/index/docId/7043/file/7043_Photovoltaik.pdf (accessed on 15 September 2021).
- McKenna, R.; Herbes, C.; Fichtner, W. Energieautarkie: Definitionen, Für- bzw. Gegenargumente, und Entstehende Forschungsbedarfe; 2015; Available online: https://www.hfwu.de/fileadmin/user_upload/ISR/Sonstiges/Working_Paper_Energieautarkie_March_15.pdf (accessed on 15 September 2021).
- Mahmud, K.; Hossain, M.J.; Town, G.E. Peak-Load Reduction by Coordinated Response of Photovoltaics, Battery Storage, and Electric Vehicles. IEEE Access 2018, 6, 29353–29365. [Google Scholar] [CrossRef]
- Munkhammar, J.; Grahn, P.; Widén, J. Quantifying self-consumption of onsite photovoltaic power generation in households with electric vehicle home charging. Sol. Energy 2013, 97, 208–216. [Google Scholar] [CrossRef]
- Hoarau, Q.; Perez, Y. Interactions between electric mobility and photovoltaic generation: A review. Renew. Sustain. Energy Rev. 2018, 94, 510–522. [Google Scholar] [CrossRef]
- Laurischkat, K.; Jandt, D. Techno-economic analysis of sustainable mobility and energy solutions consisting of electric vehicles, photovoltaic systems and battery storages. J. Clean. Prod. 2018, 179, 642–661. [Google Scholar] [CrossRef]
- Gudmunds, D.; Nyholm, E.; Taljegard, M.; Odenberger, M. Self-consumption and self-sufficiency for household solar producers when introducing an electric vehicle. Renew. Energy 2020, 148, 1200–1215. [Google Scholar] [CrossRef]
- Medina, J.; Muller, N.; Roytelman, I. Demand Response and Distribution Grid Operations: Opportunities and Challenges. IEEE Trans. Smart Grid 2010, 1, 193–198. [Google Scholar] [CrossRef]
- Amin, M.; Rasheed, A.; Raja, A.A.; Lateef, A.; Khalid, S.; Khan, B. Smart-Grid Based Real-Time Load Management Methodology for Power Deficient Systems. IJEEE 2015, 3, 6. [Google Scholar] [CrossRef][Green Version]
- Erdinc, O.; Paterakis, N.G.; Catalao, J.P. Overview of insular power systems under increasing penetration of renewable energy sources: Opportunities and challenges. Renew. Sustain. Energy Rev. 2015, 52, 333–346. [Google Scholar] [CrossRef]
- Rascon, O.C.; Resch, M.; Bühler, J.; Sumper, A. Techno-economic comparison of a schedule-based and a forecast-based control strategy for residential photovoltaic storage systems in Germany. Electr. Eng. 2016, 98, 375–383. [Google Scholar] [CrossRef]
- Schittekatte, T.; Stadler, M.; Cardoso, G.; Mashayekh, S.; Narayanan, S. The Impact of Short-term Stochastic Variability in Solar Irradiance on Optimal Microgrid Design. IEEE Trans. Smart Grid 2016, 9, 1647–1656. [Google Scholar] [CrossRef]
- ENatsheh, M.; Albarbar, A.; Yazdani, J. Modeling and control for smart grid integration of solar/wind energy conversion system. In Proceedings of the 2nd IEEE PES International Conference and Exhibition on Innovative Smart Grid Technologies (ISGT Europe), Manchester, UK, 5–7 December 2011; pp. 1–8. [Google Scholar]
- Sun, C.; Sun, F.; Moura, S.J. Nonlinear predictive energy management of residential buildings with photovoltaics & batteries. J. Power Sources 2016, 325, 723–731. [Google Scholar]
- Unger, R.; Schwan, T.; Mikoleit, B.; Bäker, B.; Kehrer, C.; Rodemann, T. Green Building—Modelling renewable building energy systems and electric mobility concepts using Modelica. In Proceedings of the 9th International MODELICA Conference, Munich, German, 3–5 September 2012. [Google Scholar]
- Klingler, A.-L. The effect of electric vehicles and heat pumps on the market potential of PV + battery systems. Energy 2018, 161, 1064–1073. [Google Scholar] [CrossRef]
- Cao, S.; Sirén, K. Impact of simulation time-resolution on the matching of PV production and household electric demand. Appl. Energy 2014, 128, 192–208. [Google Scholar] [CrossRef]
- Luthander, R.; Widén, J.; Nilsson, D.; Palm, J. Photovoltaic self-consumption in buildings: A review. Appl. Energy 2015, 142, 80–94. [Google Scholar] [CrossRef]
- Mathworks. Data Interpolation with Pchip. 2021. Available online: https://de.mathworks.com/help/matlab/ref/pchip.html (accessed on 19 October 2021).
- Tjaden, T.; Bergner, J.; Weniger, J.; Quaschning, V. Repräsentative Elektrische Lastprofile für Wohngebäude in Deutschland auf 1-Sekündiger Datenbasis; 2015; Available online: https://pvspeicher.htw-berlin.de/wp-content/uploads/Repr%C3%A4sentative-elektrische-Lastprofile-f%C3%BCr-Wohngeb%C3%A4ude-in-Deutschland-auf-1-sek%C3%BCndiger-Datenbasis.pdf (accessed on 15 September 2021).
- BGW. Anwendung von Standardlastprofilen zur Belieferung Nichtleistungsgemessener Kunden; Praxisinformation P 2006/8 Gastransport/Betriebswirtschaft; BGW: Berlin, Germany, 2006; Available online: https://www.eichsfeldwerke.de/fileadmin/user_upload/Praxisinformation_P2007_13.pdf (accessed on 15 September 2021).
- Bundesamtes für Bauwesen und Raumordnung (BBR); Climate & Environment Consulting Potsdam GmbH; Deutscher Wetterdienst (DWD). Testreferenzjahre von Deutschland für Mittlere, Extreme und Zukünftige Witterungsverhältnisse. 2014; Available online: https://www.bbsr.bund.de/BBSR/DE/forschung/programme/zb/Auftragsforschung/5EnergieKlimaBauen/2013/testreferenzjahre/try-handbuch.pdf?__blob=publicationFile&v=6 (accessed on 15 September 2021).
- Göhler, G.; Otteny, F.; Triebke, H.; Reiser, M. Load Profile Generator for Electric Vehicle Home Charging. In Proceedings of the 32nd Electric Vehicle Symposium (EVS32), Lyon, France, 19–22 May 2019. [Google Scholar]
- Patel, M.R. Wind and Solar Power Systems; Boca Raton: Palm Beach County, FL, USA, 1999. [Google Scholar]
- Suttor, W. Blockheizkraftwerke: Ein Leitfaden für den Anwender, 8th ed., Fraunhofer IRB-Verl. 2014. Available online: https://www.bhkw-infozentrum.de/buecher/buch_bhkw_leitfaden.html (accessed on 15 September 2021).
- KW Energie GmbH & Co. KG. Datenblatt Hocheffizienz-BHKW—Smartblock. 2020. Available online: https://www.smartblock.eu/de/wp-content/uploads/sites/8/2019/10/KWE_smartblock_33_NG_20190822.pdf (accessed on 19 October 2021).
- Verein deutscher Ingenieure (VDI). VDI 2067 Blatt 40: Wirtschaftlichkeit Gebäudetechnischer Anlagen Energieaufwand für die Erzeugung; Verein deutscher Ingenieure (VDI): Düsseldorf, Germany, 2013. [Google Scholar]
- Heesen, B. Investitionsrechnung für Praktiker. Fallorientierte Darst. Der Verfahr. Und Berechn. 2016. [Google Scholar] [CrossRef]
- Göhler, G.; Schnizer, N.; Widmann, F. SmaLES. Smart Local Energy Services—Demonstrations- und Transfervorhaben zur energetischen und nutzerbezogenen Umsetzung Eines Innovativen Micro Smart Grids für Wohnen & E-Mobilität auf Quartiersebene in der Stadtausstellung; 2019. Available online: https://pudi.lubw.de/detailseite/-/publication/10093 (accessed on 19 October 2021).
- Statistisches Bundesamt. Preise—Daten zur Energiepreisentwicklung. Lange Reihen von Januar 2005 bis November 2019; Statistisches Bundesamt: Wiesbaden, Germany, 2019.
- Research, E. Photovoltaik-Preismonitor Deutschland. 2013. Available online: https://www.solarwirtschaft.de/preisindex.html (accessed on 10 October 2019).
- Klein, C.; Rozanski, K.; Gailfuß, M.; Kukuk, J.; Beck, T. BHKW-Kenndaten 2014/2015; Module, Anbieter, Kosten. Available online: https://asue.de/sites/default/files/asue/themen/blockheizkraftwerke/2014/broschueren/05_10_14_bhkw_kenndaten_leseprobe.pdf (accessed on 15 October 2019).
- Energie-Datenbank. 2019. Available online: http://www.energie-datenbank.eu/ (accessed on 19 January 2019).
- Gebhardt, M.; Kohl, H.; Steinrötter, T. Preisatlas. Ableitung von Kostenfunktionen für Komponenten der Rationellen Energienutzung. 2002. Available online: http://docplayer.org/33002259-Preisatlas-ableitung-von-kostenfunktionen-fuer-komponenten-der-rationellen-energienutzung.html (accessed on 15 September 2021).
- Schmitt, G.; Röckle, F. Forschungsvorhaben zur Etablierung Eines Bundesweiten Schnelllades für Achsen und Metropolen (SLAM): Verbund-Abschlussbericht. Stuttg. Univ. Stuttg. 2019. [Google Scholar] [CrossRef]
- Tuttgart Netze. Ergänzende Bedingungen zur Niederspannungsanschlussverordnung (NAV) Sowie Kostenerstattungsregelungen. Available online: https://www.stuttgart-netze.de/media/filer_public/27/df/27df94d2-44b5-49cf-b094-edcac8f842b1/zvp_af_erg_bed_nav_snb_v301.pdf (accessed on 19 October 2021).
- Andor, M.; Frondel, M.S.S. Photovoltaik-Anlagen in Deutschland—Ausgestattet mit der Lizenz zum Gelddrucken? Energiewirtschaft 2015, 39, 253–262. [Google Scholar] [CrossRef][Green Version]
- Wirth, H. Aktuelle Fakten zur Photovoltaik in Deutschland. 2019. Available online: https://www.ise.fraunhofer.de/content/dam/ise/de/documents/publications/studies/aktuelle-fakten-zur-photovoltaik-in-deutschland.pdf (accessed on 15 October 2021).
- Härdtlein, M.; Reith, S.; Notheis, M.; Krich, F.; Eltrop, L. Datengrundlagen und Konzeption für den Online-Wärmekostenrechner für Wohn- und Nichtwohngebäude. 2019. Available online: https://www.ier.uni-stuttgart.de/forschung/modelle/heizkostenvergleich/pdf/Dokumentation.pdf (accessed on 15 September 2021).
- Völler, K.; Reinholz, T. Branchenbarometer Biomethan; Erneuerbare Energien und Mobilität. 2019. Available online: https://www.dena.de/fileadmin/dena/Publikationen/PDFs/2019/dena-Analyse_Branchenbarometer_Biomethan_2019.pdf (accessed on 15 October 2021).
- Paetz, A.; Kaschub, T.; Jochem, P.; Fichtner, W. Load-shifting potentials in households including electric mobility—A comparison of user behaviour with modelling results. In Proceedings of the 10th International Conference on the European Energy Market (EEM), Stockholm, Sweden, 27–31 May 2013; pp. 1–7. [Google Scholar]
- Gnann, T.; Klingler, A.-L.; Kühnbach, M. The load shift potential of plug-in electric vehicles with different amounts of charging infrastructure. J. Power Sources 2018, 390, 20–29. [Google Scholar] [CrossRef]
- Jia, X.; Chuai, G.; Niu, H.; Zhang, Q. Grid Connected Power Generation Control Method for Z-Source Integrated Bidirectional Charging System. In Proceedings of the International Power Electronics Conference (IPEC-Niigata 2018-ECCE Asia), Niigata, Japan, 20–24 May 2018. [Google Scholar]
- Mohammadi, F.; Nazri, G.A.; Sarif, M. A Bidirectional Power Charging Control Strategy for Plug-in Hybrid Electric Vehicles. Sustainability 2019, 11, 4317. [Google Scholar] [CrossRef]
- Dubarry, M.; Devie, A.; McKenzie, K. Durability and reliability of electric vehicle batteries under electric utility grid operations. J. Power Sources 2017, 358, 39–49. [Google Scholar] [CrossRef]
- Boström, T.; Babar, B.; Hansen, J.B.; Good, C. The pure PV-EV energy system—A conceptual study of a nationwide energy system based solely on photovoltaics and electric vehicles. Smart Energy 2021, 1, 100001. [Google Scholar] [CrossRef]
- Tan, K.M.; Ramachandaramurthy, V.K.; Yong, J.Y. Integration of electric vehicles in smart grid. A review on vehicle to grid technologies and optimization techniques. Renew. Sustain. Energy Rev. 2016, 53, 720–732. [Google Scholar] [CrossRef]
- Figgener, J.; Haberschusz, D.; Kairies, K.-P.; Wessels, O.; Zurmühlen, S.; Sauer, D.U. Speichermonitoring BW; Jahresbericht: Aachen, Germany, 2019. [Google Scholar]
- Winkler, J.; Oehler, P.; Klingler, A.-L.; Sensfuß, F.; Höfling, H.; Ragwitz, M.; Tersteegen, B. Zukunftswerkstatt Erneuerbare Energien-Szenarien für die Entwicklung der Eigenversorgung von Strom; Karlsruhe, Germany, 2016. Available online: https://www.bmwi.de/Redaktion/DE/Publikationen/Studien/zukunftswerkstatt-erneuerbare-energien.pdf?__blob=publicationFile&v=8 (accessed on 15 October 2021).


| Parameter/System Component | Unit | House 1 + EV + Heat |
|---|---|---|
| Number of dwellings | 13 | |
| Living area | m2 | 1471 |
| Hot water demand | kWh/a | 528,000 |
| Electricity demand | kWh/a | 54,000 |
| Grid connection | kW | 62 |
| PV system | kW | 20 |
| CHP (thermal power) | kW | 73 |
| CHP (electrical power) | kW | 33 |
| Back-up boiler | kW | 284 |
| Hot water tank | l | 5000 |
| Battery (capacity) | kWh | 67 |
| Battery (power) | kW | 50 |
| Number of parking lots | 92 | |
| Number of charging points | 30 |
| System Scenarios | (S1) | (S2) | (S3) | (S4) | (S5) |
|---|---|---|---|---|---|
| PV | ✓ | ✓ | ✓ | ✓ | ✓ |
| CHP | ✓ | ✓ | ✓ | ✓ | ✓ |
| EV | ✓ | ✓ | ✓ | ||
| Batt. | ✓ | ✓ | ✓ | ||
| EV | 30 × 11 kW | 30 × 11 kW | 30 × 11 kW | ||
| Battery strategy | max. SC | max. SC | min. PL |
| System Scenarios | (S1) | (S2) | (S3) | (S4) | (S5) |
|---|---|---|---|---|---|
| rSC | 21% | 26% | 41% | 55% | 41% |
| rSF | 82% | 100% | 67% | 91% | 68% |
| full cycles | 165 | 420 | 2 | ||
| Grid connection sufficient? | ✓ | ✓ | x | x | ✓ |
| Parameter | Case Study Assumptions | ||||||
|---|---|---|---|---|---|---|---|
| General | Interest rate in % | 1 | |||||
| Period under consideration in years | 20 | ||||||
| Electricity price in cent/kWh | 30 a | ||||||
| Rate of increase electricity price | 1.5 | ||||||
| Parameter | PV | CHP | Battery | Boiler | Heat Storage | Grid | |
| Investment and operating costs | Investment in EUR | 29,640 b | 86,633 c | 71,493 d | 24,887 e | 7500 e | 1400 /kVA f,g |
| Maintenance in EUR/a | 300 h | 1975 c | 1072 i | 373 j | - | - | |
| EEG levy SC (40%) in cent/kWh | 2.7 k | 2.7 | |||||
| Fuel price (biogas) in cent/kWh | 7.5 l | 7.5 l | |||||
| Rate of increase biogas | 1.5 | 1.5 | |||||
| Revenues | Feed-in remuneration in cent/kWh | 9.59 m | 13.32 k | ||||
| System Scenarios | (S1) | (S2) | (S3) | (S4) | (S5) |
|---|---|---|---|---|---|
| CapEx in EUR/a | 7433 | 11,007 | 9749 | 12,921 | 11,007 |
| OpEx in EUR/a | 75,849 | 73,106 | 86,848 | 78,054 | 87,519 |
| Net present value K in million EUR | −1.114 | −1.163 | −1.458 | −1.435 | −1.496 |
| Simulation | Real-Life Data | Deviation | |
|---|---|---|---|
| Consumption households | 54,002 kWh | 55,101 kWh | 2% |
| Supply from grid | 0 kWh | 7108 kWh | n/a |
| Feed-in to grid | 153,116 kWh | 136,050 kWh | 11% |
| PV production | 19,991 kWh | 19,413 kWh | 3% |
| CHP production (el.) | 190,427 kWh | 165,204 kWh | 13% |
| CHP run time | 5771 h | 5261 h | 9% |
| Battery efficiency | 91.85% | 90.16% | 2% |
Publisher’s Note: MDPI stays neutral with regard to jurisdictional claims in published maps and institutional affiliations. |
© 2021 by the authors. Licensee MDPI, Basel, Switzerland. This article is an open access article distributed under the terms and conditions of the Creative Commons Attribution (CC BY) license (https://creativecommons.org/licenses/by/4.0/).
Share and Cite
Göhler, G.; Klingler, A.-L.; Klausmann, F.; Spath, D. Integrated Modelling of Decentralised Energy Supply in Combination with Electric Vehicle Charging in a Real-Life Case Study. Energies 2021, 14, 6874. https://doi.org/10.3390/en14216874
Göhler G, Klingler A-L, Klausmann F, Spath D. Integrated Modelling of Decentralised Energy Supply in Combination with Electric Vehicle Charging in a Real-Life Case Study. Energies. 2021; 14(21):6874. https://doi.org/10.3390/en14216874
Chicago/Turabian StyleGöhler, Georg, Anna-Lena Klingler, Florian Klausmann, and Dieter Spath. 2021. "Integrated Modelling of Decentralised Energy Supply in Combination with Electric Vehicle Charging in a Real-Life Case Study" Energies 14, no. 21: 6874. https://doi.org/10.3390/en14216874
APA StyleGöhler, G., Klingler, A.-L., Klausmann, F., & Spath, D. (2021). Integrated Modelling of Decentralised Energy Supply in Combination with Electric Vehicle Charging in a Real-Life Case Study. Energies, 14(21), 6874. https://doi.org/10.3390/en14216874