The Effect of the Traditional Mediterranean-Style Diet on Metabolic Risk Factors: A Meta-Analysis

 ,
,
Abstract
:1. Introduction
2. Methods
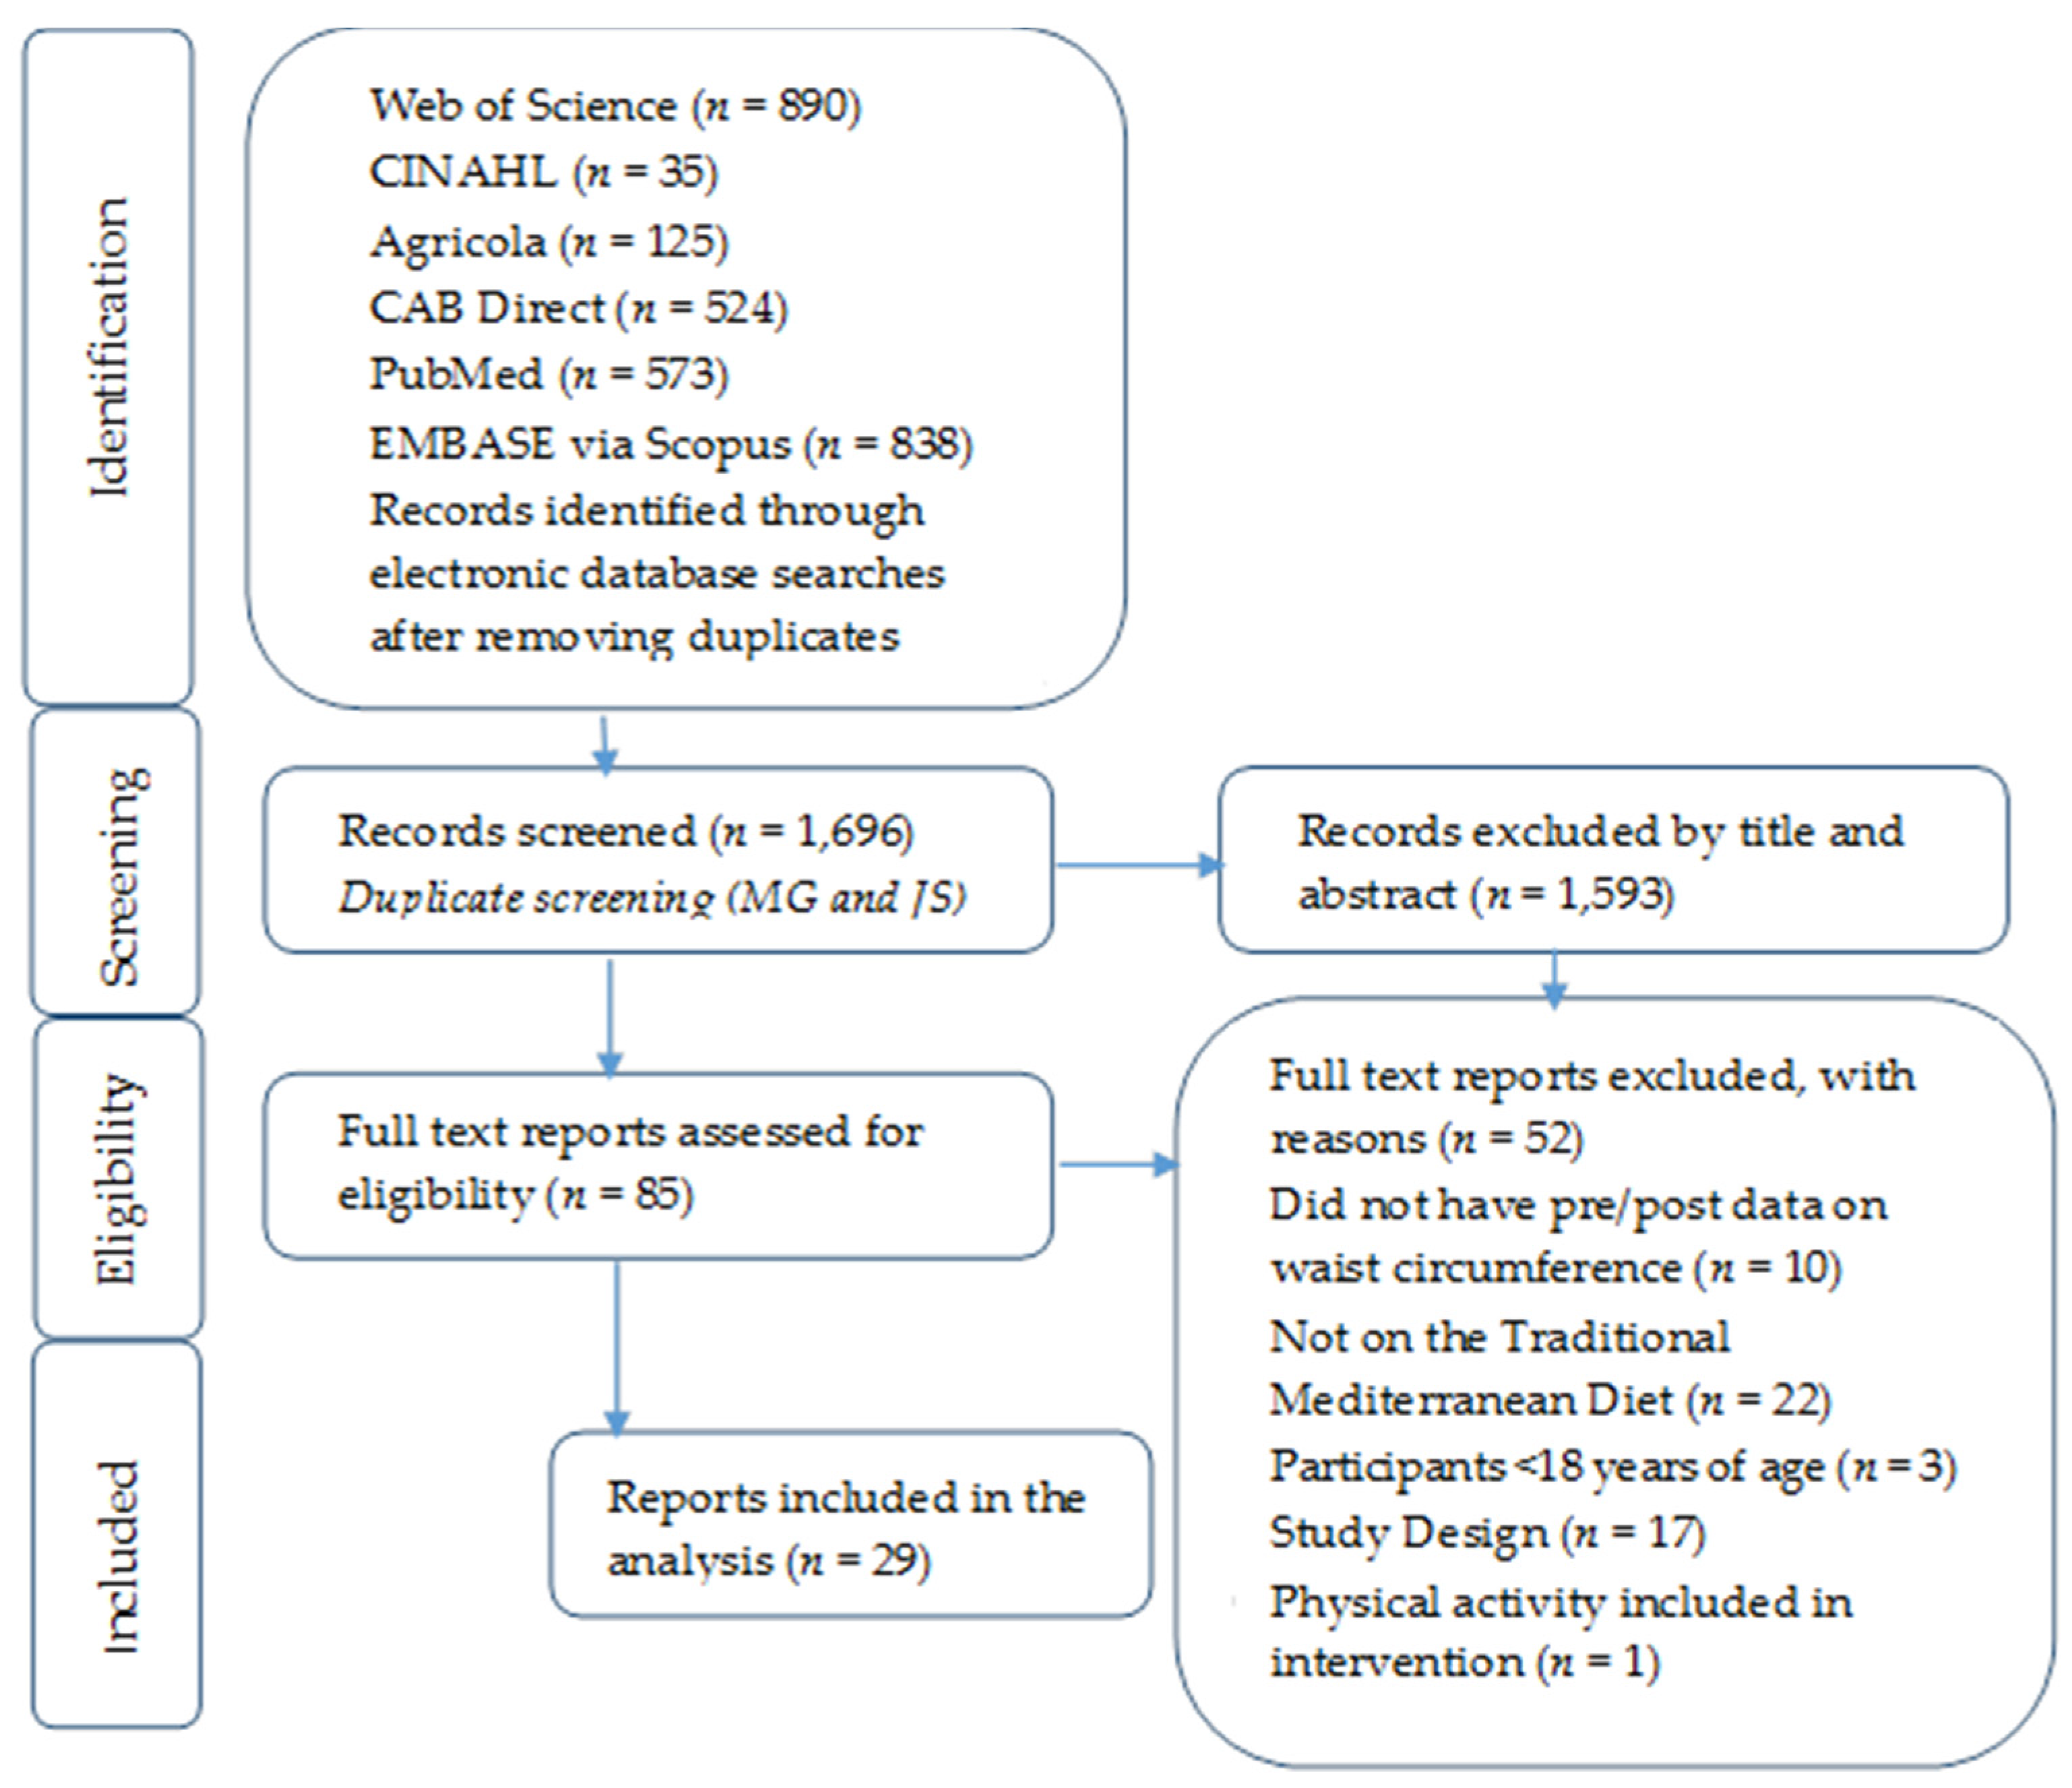
2.1. Literature Search
2.2. Selection Criteria
2.3. Data Extraction
2.4. Risk of Bias
2.5. Statistical Analysis
3. Results
3.1. Description of Included Studies
3.2. Effect Sizes
3.3. Moderator Analysis
3.4. Risk of Bias
4. Discussion
Study Limitation and Strengths
5. Conclusions
Supplementary Materials
Acknowledgments
Author Contributions
Conflicts of Interest
Abbreviations
| MedSD | Mediterranean-style Diet |
| CVD | Cardiovascular Disease |
| PRISMA | Preferred Reporting Items for Systematic Reviews and Meta-Analyses |
| MQ | Methodological Quality |
| ESs | Effect Sizes |
| WC | Waist circumference |
| FBG | Fasting blood glucose |
| TG | Triglycerides |
| SBP | Systolic blood pressure |
| DBP | Diastolic blood pressure |
| IPP | Impact per publication |
References
- Grundy, S.M.; Cleeman, J.I.; Daniels, S.R.; Donato, K.A.; Eckel, R.H.; Franklin, B.A.; Gordon, D.J.; Krauss, R.M.; Savage, P.J.; Smith, S.C., Jr.; et al. Diagnosis and management of the metabolic syndrome: An American Heart Association/National Heart, Lung, and Blood Institute scientific statement. Curr. Opin. Cardiol. 2006, 21, 1–6. [Google Scholar] [CrossRef] [PubMed]
- Grundy, S.M.; Brewer, H.B., Jr.; Cleeman, J.I.; Smith, S.C., Jr.; Lenfant, C.; National Heart, Lung, and Blood Institute; American Heart Association. Definition of metabolic syndrome: Report of the National Heart, Lung, and Blood Institute/American Heart Association conference on scientific issues related to definition. Arterioscler. Thromb. Vasc. Biol. 2004, 24, e13–e18. [Google Scholar] [CrossRef] [PubMed]
- Ervin, R.B. Prevalence of metabolic syndrome among adults 20 years of age and over, by sex, age, race and ethnicity, and body mass index: United States, 2003–2006. In National Health Statistics Reports; Center for Disease Control and Prevention: Hyattsville, MD, USA, 2009; pp. 1–7. [Google Scholar]
- Sofi, F.; Abbate, R.; Gensini, G.F.; Casini, A. Accruing evidence on benefits of adherence to the Mediterranean diet on health: An updated systematic review and meta-analysis. Am. J. Clin. Nutr. 2010, 92, 1189–1196. [Google Scholar] [CrossRef] [PubMed]
- Babio, N.; Toledo, E.; Estruch, R.; Ros, E.; Martinez-Gonzalez, M.A.; Castaner, O.; Bullo, M.; Corella, D.; Aros, F.; Gomez-Gracia, E.; et al. PREDIMED Study Investigators Mediterranean diets and metabolic syndrome status in the PREDIMED randomized trial. CMAJ 2014, 186, E649–E657. [Google Scholar] [CrossRef] [PubMed]
- Mediterranean Diet Pyramid. Oldways: Health through Heritage. Available online: http://oldwayspt.org/resources/heritage-pyramids/mediterranean-pyramid/overview (accessed on 3 August 2014).
- Kastorini, C.M.; Milionis, H.J.; Esposito, K.; Giugliano, D.; Goudevenos, J.A.; Panagiotakos, D.B. The effect of Mediterranean diet on metabolic syndrome and its components: A meta-analysis of 50 studies and 534,906 individuals. J. Am. Coll. Cardiol. 2011, 57, 1299–1313. [Google Scholar] [CrossRef] [PubMed]
- United States Department of Agriculture (USDA), Center for Nutrition Policy and Promotion. Report of the Dietary Guidelines Advisory Committee on the Dietary Guidelines for Americans, 2015; United States Department of Agriculture: Washington, DC, USA, 2015.
- Moher, D.; Liberati, A.; Tetzlaff, J.; Altman, D.G. Preferred Reporting Items for Systematic Reviews and Meta-Analyses: The PRISMA Statement. J. Clin. Epidemiol. 2009, 62, 1006–1012. [Google Scholar] [CrossRef] [PubMed]
- Higgins, J.P.; Green, S. (Eds.) Cochrane Handbook for Systematic Reviews of Interventions; The Cochrane Collaboration: Chichster, UK, 2011.
- Johnson, B.T.; Low, R.E.; MacDonald, H.V. Panning for the gold in health research: Incorporating studies’ methodological quality in meta-analysis. Psychol. Health 2015, 30, 135–152. [Google Scholar] [CrossRef] [PubMed]
- Cohen, J. Weighted kappa: Nominal scale agreement with provision for scaled disagreement or partial credit. Psychol. Bull. 1968, 70, 213–220. [Google Scholar] [CrossRef] [PubMed]
- Bartko, J.J. The intraclass correlation coefficient as a measure of reliability. Psychol. Rep. 1966, 19, 3–11. [Google Scholar] [CrossRef] [PubMed]
- Begg, C.B.; Mazumdar, M. Operating characteristics of a rank correlation test for publication bias. Biometrics 1994, 50, 1088–1101. [Google Scholar] [CrossRef] [PubMed]
- Egger, M.; Davey Smith, G.; Schneider, M.; Minder, C. Bias in meta-analysis detected by a simple, graphical test. BMJ 1997, 315, 629–634. [Google Scholar] [CrossRef] [PubMed]
- Duval, S.; Tweedie, R. A Nonparametric “Trim and Fill” Method of Accounting for Publication Bias in Meta-Analysis. J. Am. Stat. Assoc. 2000, 95, 89–98. [Google Scholar]
- Sterne, J.A.; Egger, M. Funnel plots for detecting bias in meta-analysis: Guidelines on choice of axis. J. Clin. Epidemiol. 2001, 54, 1046–1055. [Google Scholar] [CrossRef]
- R Development Core Team. R: A Language and Environment for Statistical Computing; ISBN 3-900051-07-0. Available online: http://www.R-project.org/ (accessed on 14 March 2016).
- Viechtbauer, W. Conducting meta-analyses in R with the meta for package. J. Stat. Softw. 2010, 36, 59862. [Google Scholar] [CrossRef]
- Becker, B.J. Synthesizing standardized mean-change measures. Br. J. Math. Stat. Psychol. 1998, 41, 257–278. [Google Scholar] [CrossRef]
- Huedo-Medina, T.B.; Johnson, B.T. Estimating the Standardized Mean Difference Effect Size and Its Variance from Different Data Sources: A Spreadsheet; University of Connecticut: Storrs, CT, USA, 2011. [Google Scholar]
- Becker, B.E.A. Multivariate Meta-Analysis; Academic Press: San Diego, CA, USA, 2000. [Google Scholar]
- Gleser, L.J.; Olkin, I. Stochastically dependent effect sizes. In The Handbook of Research Synthesis and Meta-Analysis, 2nd ed.; Russell Sage: New York, NY, USA, 1994; p. 357. [Google Scholar]
- Rubenfire, M.; Mollo, L.; Krishnan, S.; Finkel, S.; Weintraub, M.; Gracik, T.; Kohn, D.; Oral, E.A. The metabolic fitness program: Lifestyle modification for the metabolic syndrome using the resources of cardiac rehabilitation. J. Cardiopulm. Rehabil. Prev. 2011, 31, 282–289. [Google Scholar] [CrossRef] [PubMed]
- Timar, R.; Timar, B.; Horhat, F.; Oancea, C. The impact of Mediterranean diet on glycemic control and cardiovascular risk factors in type 2 diabetic patients. J. Food Agric. Environ. 2013, 11, 561–563. [Google Scholar]
- Aizawa, K.; Shoemaker, J.K.; Overend, T.J.; Petrella, R.J. Effects of lifestyle modification on central artery stiffness in metabolic syndrome subjects with pre-hypertension and/or pre-diabetes. Diabetes Res. Clin. Pract. 2009, 83, 249–256. [Google Scholar] [CrossRef] [PubMed]
- Bedard, A.; Dodin, S.; Corneau, L.; Lemieux, S. The impact of abdominal obesity status on cardiovascular response to the Mediterranean diet. J. Obes. 2012, 2012, 969124. [Google Scholar] [CrossRef] [PubMed]
- Connolly, S.; Holden, A.; Turner, E.; Fiumicelli, G.; Stevenson, J.; Hunjan, M.; Mead, A.; Kotseva, K.; Jennings, C.; Jones, J.; et al. MyAction: An innovative approach to the prevention of cardiovascular disease in the community. Br. J. Cardiol. 2011, 18, 171–176. [Google Scholar]
- Schmidt, F.L.; Oh, I.S.; Hayes, T.L. Fixed- versus random-effects models in meta-analysis: Model properties and an empirical comparison of differences in results. Br. J. Math. Stat. Psychol. 2009, 62, 97–128. [Google Scholar] [CrossRef] [PubMed]
- Higgins, J.P.; Thompson, S.G.; Deeks, J.J.; Altman, D.G. Measuring inconsistency in meta-analyses. BMJ 2003, 327, 557–560. [Google Scholar] [CrossRef] [PubMed] [Green Version]
- Huedo-Medina, T.B.; Sanchez-Meca, J.; Marin-Martinez, F.; Botella, J. Assessing heterogeneity in meta-analysis: Q statistic or I2 index? Psychol. Methods 2006, 11, 193–206. [Google Scholar] [CrossRef] [PubMed]
- Johnson, B.T.; Huedo-Medina, T.B. Depicting estimates using the intercept in meta-regression models: The moving constant technique. Res. Synth. Methods 2011, 2, 204–220. [Google Scholar] [CrossRef] [PubMed]
- Lipsey, M.W.; Wilson, D.B. Practical Meta-Analysis; SAGE: Thousand Oaks, CA, USA, 2001. [Google Scholar]
- Bekkouche, L.; Bouchenak, M.; Malaisse, W.J.; Yahia, D.A. The Mediterranean diet adoption improves metabolic, oxidative, and inflammatory abnormalities in Algerian metabolic syndrome patients. Horm. Metab. Res. 2014, 46, 274–282. [Google Scholar] [CrossRef] [PubMed]
- Bos, M.B.; de Vries, J.H.; Feskens, E.J.; van Dijk, S.J.; Hoelen, D.W.; Siebelink, E.; Heijligenberg, R.; de Groot, L.C. Effect of a high monounsaturated fatty acids diet and a Mediterranean diet on serum lipids and insulin sensitivity in adults with mild abdominal obesity. Nutr. Metab. Cardiovasc. Dis. 2010, 20, 591–598. [Google Scholar] [CrossRef] [PubMed]
- Corbalan, M.D.; Morales, E.M.; Canteras, M.; Espallardo, A.; Hernandez, T.; Garaulet, M. Effectiveness of cognitive-behavioral therapy based on the Mediterranean diet for the treatment of obesity. Nutrition 2009, 25, 861–869. [Google Scholar] [CrossRef] [PubMed]
- Esposito, K.; Giugliano, F.; de Sio, M.; Carleo, D.; di Palo, C.; D’Armiento, M.; Giugliano, D. Dietary factors in erectile dysfunction. Int. J. Impot. Res. 2006, 18, 370–374. [Google Scholar] [CrossRef] [PubMed]
- Esposito, K.; Giugliano, D.; Ciotola, M. Mediterranean diet and the metabolic syndrome. Mol. Nutr. Food Res. 2007, 51, 1268–1274. [Google Scholar] [CrossRef] [PubMed]
- Esposito, K.; Marfella, R.; Ciotola, M.; di Palo, C.; Giugliano, F.; Giugliano, G.; D’Armiento, M.; D’Andrea, F.; Giugliano, D. Effect of a Mediterranean-style diet on endothelial dysfunction and markers of vascular inflammation in the metabolic syndrome: A randomized trial. JAMA 2004, 292, 1440–1446. [Google Scholar] [CrossRef] [PubMed] [Green Version]
- Esposito, K.; Maiorino, M.I.; di Palo, C.; Giugliano, D. Adherence to a Mediterranean diet and glycaemic control in Type 2 diabetes mellitus. Diabet. Med. 2009, 26, 900–907. [Google Scholar] [CrossRef] [PubMed]
- Goulet, J.; Lamarche, B.; Nadeau, G.; Lemieux, S. Effect of a nutritional intervention promoting the Mediterranean food pattern on plasma lipids, lipoproteins and body weight in healthy French-Canadian women. Atherosclerosis 2003, 170, 115–124. [Google Scholar] [CrossRef]
- Goulet, J.; Lapointe, A.; Lamarche, B.; Lemieux, S. Effect of a nutritional intervention promoting the Mediterranean food pattern on anthropometric profile in healthy women from the Quebec city metropolitan area. Eur. J. Clin. Nutr. 2007, 61, 1293–1300. [Google Scholar] [CrossRef] [PubMed]
- Jones, J.L.; Ackermann, D.; Barona, J.; Calle, M.; Andersen, C.; Kim, J.E.; Volek, J.S.; McIntosh, M.; Najm, W.; Lerman, R.H.; et al. A Mediterranean low-glycemic-load diet alone or in combination with a medical food improves insulin sensitivity and reduces inflammation in women with metabolic syndrome. Br. J. Med. Med. Res. 2011, 1, 356–370. [Google Scholar] [CrossRef]
- Kolomvotsou, A.I.; Rallidis, L.S.; Mountzouris, K.C.; Lekakis, J.; Koutelidakis, A.; Efstathiou, S.; Nana-Anastasiou, M.; Zampelas, A. Adherence to Mediterranean diet and close dietetic supervision increase total dietary antioxidant intake and plasma antioxidant capacity in subjects with abdominal obesity. Eur. J. Nutr. 2013, 52, 37–48. [Google Scholar] [CrossRef] [PubMed]
- Leblanc, V.; Bégin, C.; Hudon, A.M.; Royer, M.M.; Corneau, L.; Dodin, S.; Lemieux, S. Gender differences in the long-term effects of a nutritional intervention program promoting the Mediterranean diet: Changes in dietary intakes, eating behaviors, anthropometric and metabolic variables. Nutr. J. 2014, 13, 107. [Google Scholar] [CrossRef] [PubMed]
- Leighton, F.; Polic, G.; Strobel, P.; Pérez, D.; Martínez, C.; Vásquez, L.; Castillo, O.; Villarroel, L.; Echeverría, G.; Urquiaga, I.; et al. Health impact of Mediterranean diets in food at work. Public Health Nutr. 2009, 12, 1635–1643. [Google Scholar] [CrossRef] [PubMed]
- Lerman, R.H.; Minich, D.M.; Darland, G.; Lamb, J.J.; Chang, J.; Hsi, A.; Bland, J.S.; Tripp, M.L. Subjects with elevated LDL cholesterol and metabolic syndrome benefit from supplementation with soy protein, phytosterols, hops rho iso-alpha acids, and Acacia nilotica proanthocyanidins. J. Clin. Lipidol. 2010, 4, 59–68. [Google Scholar] [CrossRef] [PubMed]
- Lindeberg, S.; Jonsson, T.; Granfeldt, Y.; Borgstrand, E.; Soffman, J.; Sjostrom, K.; Ahren, B. A Palaeolithic diet improves glucose tolerance more than a Mediterranean-like diet in individuals with ischaemic heart disease. Diabetologia 2007, 50, 1795–1807. [Google Scholar] [CrossRef] [PubMed]
- Llaneza, P.; Gonzalez, C.; Fernandez-Inarrea, J.; Alonso, A.; Diaz-Fernandez, M.J.; Arnott, I.; Ferrer-Barriendos, J. Soy isoflavones, Mediterranean diet, and physical exercise in postmenopausal women with insulin resistance. Menopause 2010, 17, 372–378. [Google Scholar] [CrossRef] [PubMed]
- Papandreou, C.; Schiza, S.E.; Bouloukaki, I.; Hatzis, C.M.; Kafatos, A.G.; Siafakas, N.M.; Tzanakis, N.E. Effect of Mediterranean diet versus prudent diet combined with physical activity on OSAS: A randomised trial. Eur. Respir. J. 2012, 39, 1398–1404. [Google Scholar] [CrossRef] [PubMed]
- Papandreou, C.; Schiza, S.E.; Tzatzarakis, M.N.; Kavalakis, M.; Hatzis, C.M.; Tsatsakis, A.M.; Kafatos, A.G.; Siafakas, N.M.; Tzanakis, N.E. Effect of Mediterranean diet on lipid peroxidation marker TBARS in obese patients with OSAHS under CPAP treatment: A randomised trial. Sleep Breath 2012, 16, 873–879. [Google Scholar] [CrossRef] [PubMed]
- Rallidis, L.S.; Lekakis, J.; Kolomvotsou, A.; Zampelas, A.; Vamvakou, G.; Efstathiou, S.; Dimitriadis, G.; Raptis, S.A.; Kremastinos, D.T. Close adherence to a Mediterranean diet improves endothelial function in subjects with abdominal obesity. Am. J. Clin. Nutr. 2009, 90, 263–268. [Google Scholar] [CrossRef] [PubMed]
- Richard, C.; Couillard, C.; Royer, M.-M.; Desroches, S.; Couture, P.; Lamarche, B. Impact of the Mediterranean diet with and without weight loss on plasma cell adhesion molecule concentrations in men with the metabolic syndrome. Mediterr. J. Nutr. Metab. 2011, 4, 33–39. [Google Scholar] [CrossRef]
- Ryan, M.C.; Itsiopoulos, C.; Thodis, T.; Ward, G.; Trost, N.; Hofferberth, S.; O’Dea, K.; Desmond, P.V.; Johnson, N.A.; Wilson, A.M. The Mediterranean diet improves hepatic steatosis and insulin sensitivity in individuals with non-alcoholic fatty liver disease. J. Hepatol. 2013, 59, 138–143. [Google Scholar] [CrossRef] [PubMed]
- Sánchez-Benito, J.L.; Pontes Torrado, Y.; González Rodríguez, A. Weight loss intervention has achieved a significant decrease of blood pressure and cholesterol. Clin. Investig. Arterioscler. 2012, 24, 241–249. [Google Scholar] [CrossRef]
- Stendell-Hollis, N.R.; Thompson, P.A.; West, J.L.; Wertheim, B.C.; Thomson, C.A. A comparison of Mediterranean-style and MyPyramid diets on weight loss and inflammatory biomarkers in postpartum breastfeeding women. J. Women’s Health (Larchmt.) 2013, 22, 48–57. [Google Scholar] [CrossRef] [PubMed]
- Van Velden, D.P.; van der Merwe, S.; Fourie, E.; Kidd, M.; Blackhurst, D.M.; Kotze, M.J.; Mansvelt, E.P.G. The short-term influence of a Mediterranean-type diet and mild exercise with and without red wine on patients with the metabolic syndrome. S. Afr. J. Enol. Vitic. 2007, 28, 44–49. [Google Scholar]
- Shea, B.J.; Grimshaw, J.M.; Wells, G.A.; Boers, M.; Andersson, N.; Hamel, C.; Porter, A.C.; Tugwell, P.; Moher, D.; Bouter, L.M. Development of AMSTAR: A measurement tool to assess the methodological quality of systematic reviews. BMC Med. Res. Methodol. 2007, 7. [Google Scholar] [CrossRef] [PubMed] [Green Version]
- Ajala, O.; English, P.; Pinkney, J. Systematic review and meta-analysis of different dietary approaches to the management of type 2 diabetes. Am. J. Clin. Nutr. 2013, 97, 505–516. [Google Scholar] [CrossRef] [PubMed]
- Nordmann, A.J.; Suter-Zimmermann, K.; Bucher, H.C.; Shai, I.; Tuttle, K.R.; Estruch, R.; Briel, M. Meta-Analysis Comparing Mediterranean to Low-Fat Diets for Modification of Cardiovascular Risk Factors. Am. J. Med. 2011, 124, 841–851. [Google Scholar] [CrossRef] [PubMed]
- Nordmann, A. Mediterranean or low-fat diets to reduce cardiovascular risk? Praxis (Bern 1994) 2011, 100, 1283–1288. [Google Scholar] [CrossRef] [PubMed]
- Psaltopoulou, T.; Sergentanis, T.N.; Panagiotakos, D.B.; Sergentanis, I.N.; Kosti, R.; Scarmeas, N. Mediterranean diet and stroke, cognitive impairment, depression: A meta-analysis. Ann. Neurol. 2013, 74, 580–591. [Google Scholar] [CrossRef] [PubMed]


| Study | Country | N | % F | Age | Diseases | Recruit-ment | Dietary Assessment | Type of Diet | Duration (Weeks) | Control | Outcome |
|---|---|---|---|---|---|---|---|---|---|---|---|
| Aizawa, et al. (2009) [26] | Canada | 63 | 51% | 53.9 | PDM PHTN | Physician referral | Group, unsupervised | MedSD | 24 | No carotid artery stiffness | Carotid artery stiffness |
| Bedard, et al. (2012) [27] | Canada | 67 | NR | 39 | Ob (57%) | NR | Individual, supervised | MedSD | 8 | Non-Ob | CVDRF |
| Bekkouche, et al. (2014) [34] | Algeria | 86 | NR | 52 | MS (67%) | Hospital | Individual, unsupervised | MedSD | 12 | No MS, healthy | IR, OS, Inflam. |
| Bos, et al. (2010) [35] | Netherlands | 60 | NR | 52.5 | Ob (100%) | NR | Individual, unsupervised | MedSD | 10 | High SFA diet; High MUFA diet | Serum lipids, IS |
| Connolly, et al. (2011) [28] | Great Britain | 206 | 42% | 60.4 | CVD or CVDRF (100%) | Hospital, physician referral | Individual, unsupervised | MedSD | 16 | None | CVDRF |
| Corbalan, et al. (2009) [36] | Spain | 1406 | 82% | 39 | Ob (100%) | Clinic referral | Individual, unsupervised | MedSD | 34 | None | WT |
| Esposito, et al. (2006) [37] | Italy | 65 | 0% | 43.9 | MS, ED (100%) | Research database | Individual, unsupervised | MedSD | 24 | Regular diet | IIEF score |
| Esposito, et al. (2007) [38] | Italy | 59 | 100% | 41.9 | MS, FSD (100%) | Research Database | Individual, unsupervised | MedSD | 24 | Regular Diet | FSFI score |
| Esposito, et al. (2004) [39] | Italy | 180 | 45% | 43.9 | MS (100%) | Clinic | Group, unsupervised | MedSD | 104 | Regular Diet | Endo func, Vas Infl |
| Esposito, et al. (2009) [40] | Italy | 215 | 51% | 52.2 | NIDDM (100%) | Clinic | Group, unsupervised | MedSD | 208 | LF Diet | Glycemic control |
| Goulet, et al. (2003) [41] | Canada | 77 | 100% | 47 | None, healthy | Newspaper ad. | Individual, unsupervised | MedSD | 12 | None | Serum lipid, WT |
| Goulet, et al. (2007) [42] | Canada | 77 | 100% | 46.7 | None, healthy | Newspaper ad. | Individual, unsupervised | MedSD | 24 | None | WT |
| Jones, et al. (2011) [43] | United States | 89 | 100% | 47.5 | MS (100%) | NR | Individual, unsupervised | MedSD-MF | 12 | MD, no MF | MS RF |
| Kolomvotsou, et al. (2013) [44] | Greece | 90 | 48% | 50.4 | Ob (100%) | Hospital | Individual, unsupervised | MedSD | 8 | Regular diet | AO intake, plasma AO capacity |
| Leblanc, et al. (2014) [45] | Canada | 108 | 47% | 41.4 | Ob, MS (100%) | Media advertise-ments | Individual and group, unsupervised and supervised | MedSD | 12 | None | Dietary intake, Met profile |
| Leighton, et al. (2009) [46] | Chile | 145 | 0% | 39 | MS (24%) | Maestranza Diesel | Group, supervised | MedSD | 52 | None | MS RF |
| Lerman, et al. (2010) [47] | United States | 24 | 83% | 54.4 | MS and high LDL-C (100%) | Previous study by Lerman | NR | MedSD-MF | 12 | MD, no MF | Plasma lipids |
| Lindeberg, et al. (2007) [48] | Sweden | 29 | 0% | 61 | IHD, IGT, NIDDM | Hospital | Individual, unsupervised | MedSD | 12 | Paleolithic Diet | WT, serum glucose |
| Llaneza, et al. (2010) [49] | Spain | 116 | 100% | 56.4 | IR (100%) | Hospital | Group, unsupervised | MedSD, soy supplement | 104 | MD, no supp | IR |
| Papandreou, et al. (2012 [50] | Greece | 40 | NR | 41.5 | Ob, OSAS (100%) | University Medical School | Group, unsupervised | MedSD | 26 | Prudent Diet | OSAS |
| Papandreou, et al. (2012) [51] | Greece | 21 | NR | 41.5 | Ob, OSAS (100%) | University Medical School | Group, unsupervised | MedSD | 26 | Prudent Diet | TBARS |
| Rallidis, et al. (2009) [52] | Greece | 82 | 48% | 50.4 | Ob (100%) | Hospital | Individual, unsupervised | MedSD | 8 | Regular Diet | Endo func |
| Richard, et al. (2011) [53] | Canada | 26 | 0% | 49.4 | MS (100%) | NR | Individual, unsupervised | MedSD | 35 | Western Diet | CVDRF |
| Rubenfire, et al. (2011) [24] | United States | 126 | 68% | 51 | MS (100%) | Physician referral | Individual, unsupervised | MedSD | 12 | None | WT, BP, TG, serum glucose |
| Ryan, et al. (2013) [54] | Australia | 12 | 50% | 55 | NAFLD (100%) | Hospital | Individual, unsupervised | MedSD | 6 | LF diet | WT, IS |
| Sanchez-Benito, et al. (2012) [55] | Spain | 158 | 87% | 48 | OverWT (100%) | Pharmacy office | Individual, unsupervised | MedSD | 26 | None | BMI, BP, cholesterol |
| Stendall-Hollis, et al. (2013) [56] | United States | 129 | 100% | 29.7 | OverWT (100%) | Magazine, hospital, Craigslist | Individual, unsupervised | MedSD | 16 | MyPyramid for P & B | WT, Inflam Bio |
| Timar, et al. (2013) [25] | Romania | 223 | 50% | 55 | NIDDM (100%) | Diabetes Center | Group, unsupervised | MedSD | 52 | Diabetic Diet | Glycemic control, CVDRF |
| Van Velden, et al. (2007) [57] | South Africa | 12 | 25% | 46 | MS (100%) | NR | Group, unsupervised | MedSD with red wine | 8 | MD without red wine | CVDRF |
- Individual: A dietitian performed a dietary assessment, providing individualized needs for caloric intake and recommendations, for each participant.
- Group: The study provided general dietary recommendations for the participants, such as a range of servings of certain food groups, calories based on sex, as opposed to tailoring diets to individual needs based on weight and height.
- Supervised: Participants consumed foods in a supervised setting, where the researchers had control over participant food choices and quantity of food served.
- Unsupervised: Participants food consumption was unsupervised by researchers, such as eating at home.
| Outcome | k | d+ (95% CI) | Homogeneity of d’s | |||
|---|---|---|---|---|---|---|
| Fixed-Effects | Random-Effects | Q | I2 (%) | p-Value | ||
| WC | 39 | −0.44 (−0.48 to −0.41) * | −0.54 (−0.77 to −0.31) * | 390.1 | 96.39 | <0.0001 |
| HDL | 27 | 0.15 (0.09 to 0.21) * | 0.19 (−0.07 to 0.46) | 294.6 | 93.95 | <0.0001 |
| TG | 25 | −0.34 (−0.40 to −0.28) * | −0.46 (−0.72 to −0.21) * | 231.06 | 93.74 | <0.0001 |
| FBG | 23 | −0.37 (−0.42 to −0.33) * | −0.50 (−0.81 to −0.20) * | 281.18 | 96.69 | <0.0001 |
| SBP | 25 | −0.74 (−0.78 to −0.70) * | −0.72 (−1.03 to −0.42) * | 320.11 | 97.00 | <0.0001 |
| DBP | 25 | −0.99 (−1.06 to −0.93) * | −0.94 (−1.45 to −0.44) * | 2263.05 | 98.42 | <0.0001 |
| Moderator | Outcome | Category | k | d+ (95% CI) | R2 | p-Value | Clinical Unit of Measure |
|---|---|---|---|---|---|---|---|
| Study Characteristics | |||||||
| Region | WC | Europe | 19 | −0.49 (−1.23 to 0.24) | 2.25% | 0.19 | −1.23 cm |
| US | 7 | −0.33 (−0.96 to 0.29) | 2.90% | 0.19 | −0.83 cm | ||
| HDL | Europe | 10 | 0.80 (0.04 to 1.57) | 19.3% | 0.04 | 0.13 mmol/L | |
| US | 6 | −0.10 (−0.71 to 0.50) | 19.3% | 0.04 | −0.02 mmol/L | ||
| TG | Europe | 9 | −0.74 (−1.46 to −0.03) | 4.11% | 0.12 | −0.35 mmol/L | |
| US | 4 | −0.13 (−073 to 0.46) | 4.11% | 0.12 | −0.06 mmol/L | ||
| FBG | Europe | 9 | −0.74 (−1.76 to 0.27) | 9.14% | 0.15 | −0.06 mmol/L | |
| US | 3 | −0.18 (−1.05 to 0.69) | 9.14% | 0.15 | −0.01 mmol/L | ||
| SBP | Europe | 10 | −0.68 (−1.83 to 0.47) | 0.36% | 0.25 | −3.21 mmol/L | |
| US | 4 | −0.47 (−1.44 to 0.50) | 0.36% | 0.25 | −2.22 mmol/L | ||
| DBP | Europe | 10 | −1.13 (−2.02 to 1.14) | 2.88% | 0.24 | −3.47 mmol/L | |
| US | 4 | −0.44 (−1.95 to 0.74) | 2.88% | 0.24 | −1.35 mmol/L | ||
| Study Design | WC | MedSD vs. Other Diet | 13 | −1.14 (−1.49 to −0.78) | 28.71% | <0.0001 | −2.87 cm |
| Pre/Post or Crossover | 23 | −0.27 (−0.52 to −0.02) | 28.71% | <0.0001 | −0.68 cm | ||
| HDL | MedSD vs. Other Diet | 9 | 0.79 (0.45 to 1.15) | 45.64% | <0.0001 | 0.13 mmol/L | |
| Pre/Post or Crossover | 16 | −0.16 (−0.42 to 0.09) | 45.64% | <0.0001 | −0.16 mmol/L | ||
| TG | MedSD vs. Other Diet | 8 | −0.98 (−1.39 to −0.59) | 28.04% | 0.008 | −0.46 mmol/L | |
| Pre/Post or Crossover | 15 | −0.21 (−0.49 to 0.07) | 28.04% | 0.008 | −0.10 mmol/L | ||
| FBG | MedSD vs. Other Diet | 7 | −1.13 (−1.59 to −0.66) | 30.92% | <0.0001 | −0.09 mmol/L | |
| Pre/Post or Crossover | 14 | −0.27 (−0.59 to 0.06) | 30.92% | <0.0001 | −0.02 mmol/L | ||
| SBP | MedSD vs. Other Diet | 7 | −1.37 (−1.86 to −0.87) | 32.26% | <0.0001 | −6.47 mmHg | |
| Pre/Post or Crossover | 16 | −0.53 (−0.84 to −0.22) | 32.26% | <0.0001 | −2.69 mmHg | ||
| DBP | MedSD vs. Other Diet | 7 | −1.32 (−2.31 to −0.32) | 0.00% | 0.004 | −4.06 mmHg | |
| Pre/Post or Crossover | 16 | −0.87 (−1.52 to −0.21) | 0.00% | 0.004 | −2.67 mmHg | ||
| Impact per Publication Metric | WC | 0 (minimum) | 39 | −0.18 (−0.42 to 0.06) | 50.13% | <0.0001 | −0.45 cm |
| 16.104 (maximum) | 39 | −1.89 (−2.43 to −1.37) | 50.13% | <0.0001 | −4.76 cm | ||
| HDL | 0 (minimum) | 26 | −0.03 (−0.31 to 0.26) | 29.44% | 0.0006 | −0.005 mmol/L | |
| 16.104 (maximum) | 26 | 0.95 (0.38 to 1.52) | 29.44% | 0.0006 | 0.15 mmol/L | ||
| TG | 0 (minimum) | 24 | −0.23 (−0.53 to 0.08) | 22.65% | <0.0001 | −0.11 mmol/L | |
| 16.104 (maximum) | 24 | −1.09 (−1.68 to −0.52) | 22.65% | <0.0001 | −0.52 mmol/L | ||
| FBG | 0 (minimum) | 22 | −0.13 (−0.45 to 0.19) | 41.52% | 0.0004 | −0.01 mmol/L | |
| 16.104 (maximum) | 22 | −1.45 (−2.03 to −0.88) | 41.52% | 0.0004 | −0.11 mmol/L | ||
| SBP | 0 (minimum) | 24 | −0.51 (−0.86 to −0.16) | 13.10% | 0.13 | −2.41 mmHg | |
| 16.104 (maximum) | 24 | −1.16 (−1.84 to −0.49) | 13.10% | 0.13 | −5.48 mmHg | ||
| DBP | 0 (minimum) | 23 | −0.69 (−1.37 to 0.02) | 3.54% | 0.18 | −2.12 mmHg | |
| 16.104 (maximum) | 23 | −1.77 (−3.06 to −0.49) | 3.54% | 0.18 | −5.44 mmHg | ||
| Intervention Characteristics | |||||||
| Length of intervention (in weeks) | WC | 4 weeks (minimum) | 39 | −0.24 (−0.45 to −0.03) | 46.18% | <0.0001 | −0.604 cm |
| 208 weeks (maximum) | 39 | −2.50 (−3.29 to −1.71) | 46.18% | <0.0001 | −6.29 cm | ||
| HDL | 4 weeks (minimum) | 27 | −0.09 (−0.32 to 0.14) | 48.04% | <0.0001 | −0.01 mmol/L | |
| 208 weeks (maximum) | 27 | 1.79 (1.06 to 2.53) | 48.04% | <0.0001 | 0.29 mmol/L | ||
| TG | 4 weeks (minimum) | 25 | −0.19 (−0.46 to 0.07) | 32.1% | 0.0009 | −0.09 mmol/L | |
| 208 weeks (maximum) | 25 | −1.73 (−2.51 to −0.95) | 32.1% | 0.0009 | −0.83 mmol/L | ||
| FBG | 4 weeks (minimum) | 23 | −0.19 (−0.45 to 0.07) | 51.13% | <0.0001 | −0.01 mmol/L | |
| 208 weeks (maximum) | 23 | −2.22 (−3.02 to −1.41) | 51.1% | <0.0001 | −0.17 mmol/L | ||
| SBP | 4 weeks (minimum) | 25 | −0.45 (−0.77 to −0.14) | 27.89% | 0.0004 | −2.12 mmHg | |
| 208 weeks (maximum) | 25 | −2.04 (−2.98 to −1.09) | 27.89% | 0.004 | −9.63 mmHg | ||
| DBP | 4 weeks (minimum) | 25 | −0.67 (−1.26 to −0.08) | 6.39% | 0.10 | −2.06 mmHg | |
| 208 weeks (maximum) | 25 | −2.37 (−4.15 to −0.59) | 6.39% | 0.10 | −7.28 mmHg | ||
| Number of Females | WC | 0 (minimum) | 35 | −0.49 (−0.76 to −0.23) | 0.00% | 0.95 | −1.23 cm |
| 1154 (maximum) | 35 | −0.54 (−1.91 to 0.83) | 0.00% | 0.95 | −1.36 cm | ||
| HDL | 0 (minimum) | 25 | 0.33 (−0.06 to 0.72) | 0.00% | 0.39 | 0.06 mmol/L | |
| 1154 (maximum) | 25 | −3.43 (−11.69 to 4.83) | 0.00% | 0.39 | −0.56 mmol/L | ||
| TG | 0 (minimum) | 23 | −0.45 (−0.87 to −0.03) | 0.00% | 0.89 | −0.22 mmol/L | |
| 1154 (maximum) | 23 | −1.04 (−10.91 to 8.83) | 0.00% | 0.91 | −0.49 mmol/L | ||
| FBG | 0 (minimum) | 21 | −0.55 (−0.91 to −0.19) | 0.00% | 0.91 | −0.04 mmol/L | |
| 1154 (maximum) | 21 | −0.46 (−1.94 to 1.01) | 0.00% | 0.91 | −0.04 mmol/L | ||
| SBP | 0 (minimum) | 23 | −0.70 (−1.04 to −0.36) | 0.00% | 0.79 | −3.31 mmHg | |
| 1154 (maximum) | 23 | −0.91 (−2.36 to 0.53) | 0.00% | 0.79 | −4.29 mmHg | ||
| DBP | 0 (minimum) | 22 | −0.59 (−0.95 to −0.25) | 67.92% | <0.0001 | −1.81 mmHg | |
| 1154 (maximum) | 22 | −5.82 (−7.29 to −4.33) | 67.92% | <0.0001 | −17.89 mmHg | ||
| Total sample size | WC | 12 (minimum) | 39 | −0.54 (−0.81 to −0.26) | 0.00% | 0.97 | −1.36 cm |
| 1406 (maximum) | 39 | −0.56 (−1.88 to 0.77) | 0.00% | 0.97 | −1.41 cm | ||
| HDL | 12 (minimum) | 27 | −0.18 (−0.63 to 0.27) | 13.29% | 0.05 | −0.03 mmol/L | |
| 1406 (maximum) | 27 | 5.69 (0.10 to 11.29) | 13.29% | 0.05 | 0.93 mmol/L | ||
| TG | 12 (minimum) | 25 | −0.20 (−0.66 to 0.26) | 4.55% | 0.18 | −0.09 mmol/L | |
| 1406 (maximum) | 25 | −4.65 (−10.79 to 1.48) | 4.55% | 0.18 | −2.22 mmol/L | ||
| FBG | 12 (minimum) | 23 | −0.49 (−0.84 to −0.15) | 0.00% | 0.85 | −0.04 mmol/L | |
| 1406 (maximum) | 23 | −0.64 (−2.05 to −0.78) | 0.00% | 0.85 | −0.05 mmol/L | ||
| SBP | 12 (minimum) | 25 | −0.71 (−1.05 to −0.35) | 0.00% | 0.79 | −3.35 mmHg | |
| 1406 (maximum) | 25 | −0.93 (−2.38 to 0.53) | 0.00% | 0.79 | −4.39 mmHg | ||
| DBP | 12 (minimum) | 24 | −0.41 (−0.73 to −0.09) | 72.14% | <0.0001 | −1.26 mmHg | |
| 1406 (maximum) | 24 | −5.9 (−7.22 to −4.58) | 72.14% | <0.0001 | −18.14 mmHg | ||
| Sample size of intervention group | WC | 11 (minimum) | 39 | −0.54 (−0.79 to −0.28) | 0.00% | 0.99 | −1.36 cm |
| 1154 (maximum) | 39 | −0.55 (−1.93 to 0.82) | 0.00% | 0.99 | −1.38 cm | ||
| HDL | 11 (minimum) | 27 | 0.11 (−0.33 to 0.54) | 0.00% | 0.60 | 0.02 mmol/L | |
| 1154 (maximum) | 27 | 2.24 (−5.41 to 9.89) | 0.00% | 0.60 | 0.37 mmol/L | ||
| TG | 11 (minimum) | 25 | −0.34 (−0.76 to 0.07) | 0.00% | 0.47 | −0.16 mmol/L | |
| 1154 (maximum) | 25 | −3.45 (−11.62 to 4.73) | 0.00% | 0.47 | −1.65 mmol/L | ||
| FBG | 11 (minimum) | 23 | −0.50 (−0.84 to −0.17) | 0.00% | 0.96 | −0.04 mmol/L | |
| 1154 (maximum) | 23 | −0.54 (−1.96 to 0.88) | 0.00% | 0.96 | −0.04 mmol/L | ||
| SBP | 11 (minimum) | 25 | −0.71 (−1.05 to −0.37) | 0.00% | 0.78 | −3.35 mmHg | |
| 1154 (maximum) | 25 | −0.93 (−2.39 to 0.53) | 0.00% | 0.78 | −4.39 mmHg | ||
| DBP | 11 (minimum) | 24 | −0.51 (−0.82 to −0.20) | 71.80% | <0.0001 | −1.57 mmHg | |
| 1154 (maximum) | 24 | −5.91 (−7.25 to −4.58) | 71.80% | <0.0001 | −18.17 mmHg | ||
| Use of a behavioral technique | WC | No | 21 | −0.43 (−0.74 to −0.11) | 0.00% | <0.0001 | −1.08 cm |
| Yes | 18 | −0.66 (−1.00 to −0.33) | 0.00% | <0.0001 | −1.66 cm | ||
| HDL | No | 14 | −0.08 (−0.42 to 0.26) | 13.88% | 0.02 | −0.01 mmol/L | |
| Yes | 13 | 0.48 (0.13 to 0.83) | 13.88% | 0.02 | 0.08 mmol/L | ||
| TG | No | 14 | −0.27 (−0.61 to 0.06) | 6.26% | 0.0003 | −0.13 mmol/L | |
| Yes | 11 | −0.70 (−1.08 to −0.33) | 6.26% | 0.0003 | −0.33 mmol/L | ||
| FBG | No | 12 | −0.29 (−0.71 to 0.12) | 4.51% | 0.001 | −0.02 mmol/L | |
| Yes | 11 | −0.72 (−1.14 to −0.29) | 4.51% | 0.001 | −0.06 mmol/L | ||
| SBP | No | 13 | −0.53 (−0.94 to −0.12) | 1.71% | <0.0001 | −2.50 mmHg | |
| Yes | 12 | −0.94 (−1.37 to −0.51) | 1.71% | <0.0001 | −4.44 mmHg | ||
| Level of intervention or supervision during the study | WC | Primarily one-on-one | 14 | −0.47 (−0.83 to −0.11) | 17.28% | <0.0001 | −1.18 cm |
| Small groups | 9 | −1.14 (−1.58 to −0.69) | 17.28% | <0.0001 | −2.87 cm | ||
| HDL | Primarily one-on-one | 8 | −0.18 (−0.63 to 0.28) | 15.73% | 0.03 | −0.03 mmol/L | |
| Small groups | 9 | 0.65 (0.23 to 1.07) | 15.73% | 0.03 | 0.11 mmol/L | ||
| TG | Primarily one-on-one | 8 | −0.14 (−0.55 to 0.27) | 16.04% | <0.0001 | −0.07 mmol/L | |
| Small groups | 7 | −1.03 (−1.45 to −0.59) | 16.04% | <0.0001 | −0.49 mmol/L | ||
| FBG | Primarily one-on-one | 7 | −0.19 (−0.69 to 0.32) | 19.26% | 0.0002 | −0.01 mmol/L | |
| Small groups | 7 | −1.04 (−1.54 to −0.55) | 19.26% | 0.0002 | −0.08 mmol/L | ||
| SBP | Primarily one-on-one | 9 | −0.48 (−0.92 to −0.04) | 28.65% | <0.0001 | −2.26 mmHg | |
| Small groups | 7 | −1.43 (−1.93 to −0.94) | 28.65% | <0.0001 | −6.75 mmHg | ||
| DBP | Primarily one-on-one | 9 | −0.37 (−1.19 to 0.46) | 2.44% | 0.002 | −1.13 mmHg | |
| Small groups | 7 | −1.54 (−2.48 to −0.60) | 2.44% | 0.002 | −4.73 mmHg | ||
© 2016 by the authors; licensee MDPI, Basel, Switzerland. This article is an open access article distributed under the terms and conditions of the Creative Commons by Attribution (CC-BY) license (http://creativecommons.org/licenses/by/4.0/).
Share and Cite
Garcia, M.; Bihuniak, J.D.; Shook, J.; Kenny, A.; Kerstetter, J.; Huedo-Medina, T.B. The Effect of the Traditional Mediterranean-Style Diet on Metabolic Risk Factors: A Meta-Analysis. Nutrients 2016, 8, 168. https://doi.org/10.3390/nu8030168
Garcia M, Bihuniak JD, Shook J, Kenny A, Kerstetter J, Huedo-Medina TB. The Effect of the Traditional Mediterranean-Style Diet on Metabolic Risk Factors: A Meta-Analysis. Nutrients. 2016; 8(3):168. https://doi.org/10.3390/nu8030168
Chicago/Turabian StyleGarcia, Marissa, Jessica D. Bihuniak, Julia Shook, Anne Kenny, Jane Kerstetter, and Tania B. Huedo-Medina. 2016. "The Effect of the Traditional Mediterranean-Style Diet on Metabolic Risk Factors: A Meta-Analysis" Nutrients 8, no. 3: 168. https://doi.org/10.3390/nu8030168
APA StyleGarcia, M., Bihuniak, J. D., Shook, J., Kenny, A., Kerstetter, J., & Huedo-Medina, T. B. (2016). The Effect of the Traditional Mediterranean-Style Diet on Metabolic Risk Factors: A Meta-Analysis. Nutrients, 8(3), 168. https://doi.org/10.3390/nu8030168