Figure 1.
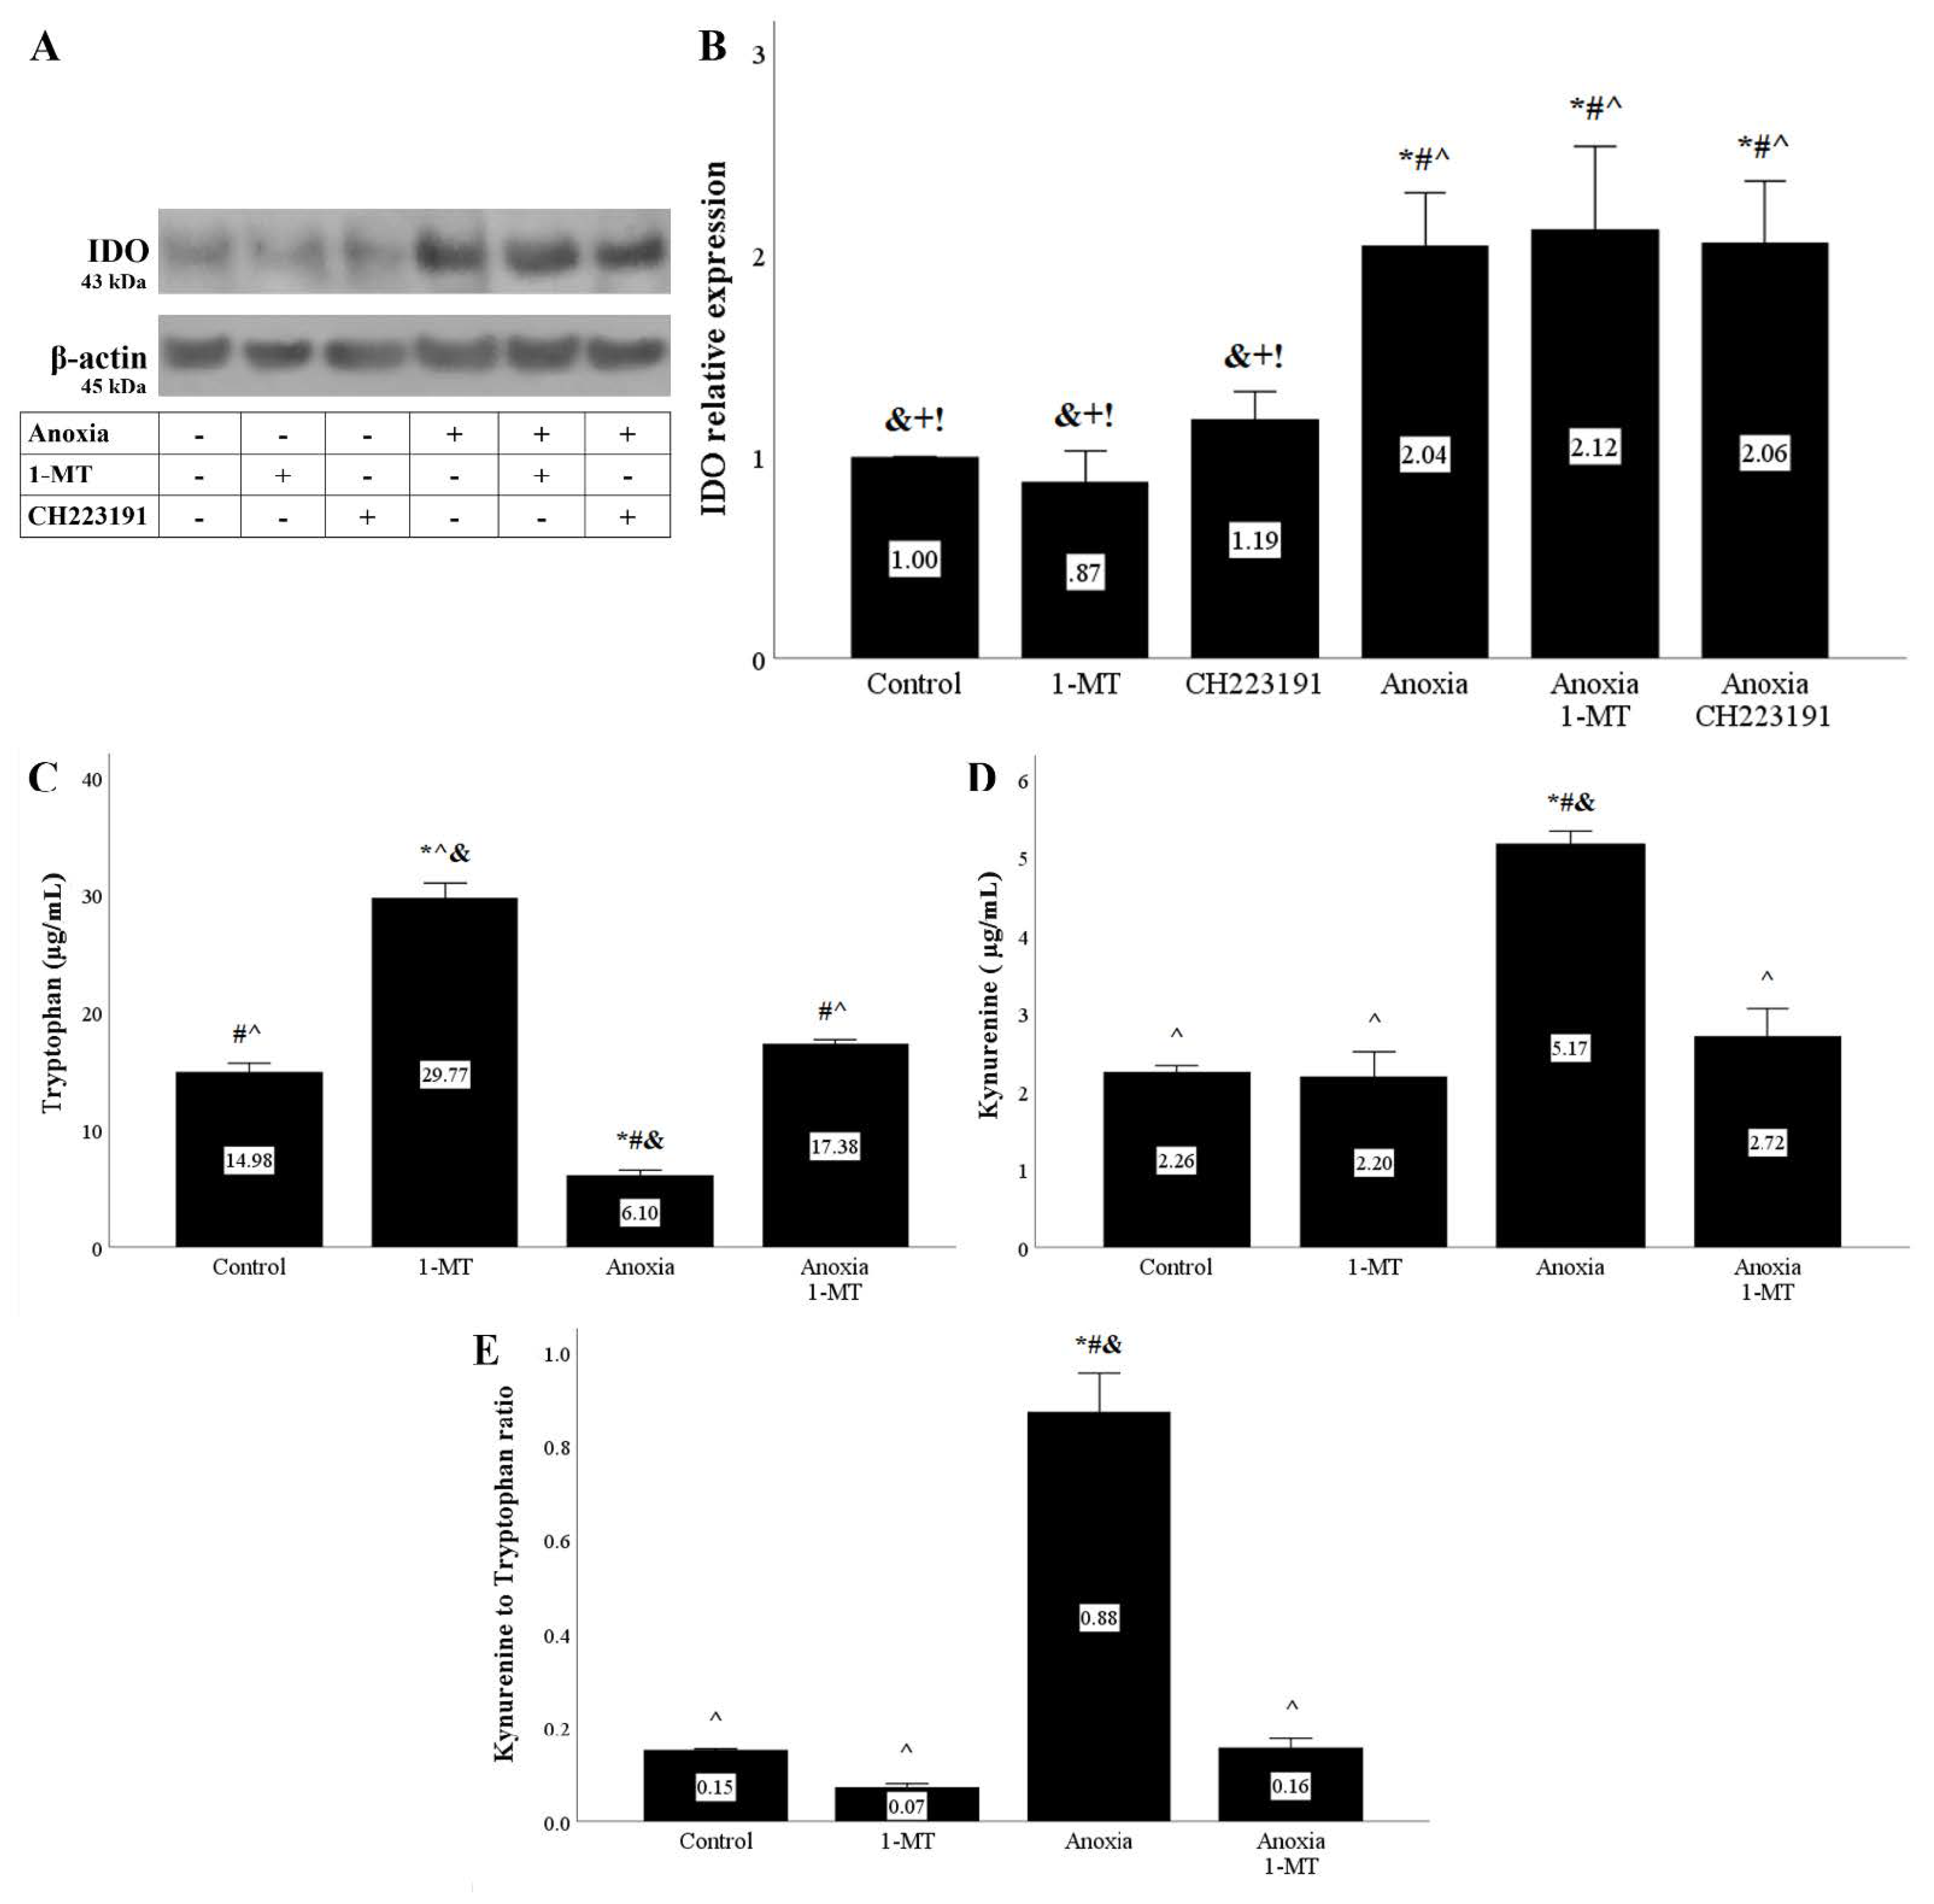
Anoxia upregulates IDO expression and activity. Cells were cultured under anoxic conditions for 24 h along with the indicating treatments. Anoxia in the presence or not of 1MT or CH223191 increased IDO protein level. A representative Western blot experiment is displayed in panel (A), whereas panel (B) depicts the cumulative results of four repeated experiments. * p < 0.05 vs. Control, # p < 0.05 vs. Control with 1-MT, ^ p < 0.05 vs. Control with CH223191, & p < 0.05 vs. Anoxia, + p < 0.05 vs. Anoxia with 1-MT, ! p < 0.05 vs. Anoxia with CH223191. IDO activity assessed by the ratio of kynurenine to tryptophan concentration in cell culture supernatants also increased under anoxic conditions, an effect that is abolished by the IDO inhibitor 1-MT (C–E). Six such experiments were performed. * p < 0.05 vs. Control, # p < 0.05 vs. Control with 1-MT, ^ p < 0.05 vs. Anoxia, & p < 0.05 vs. Anoxia with 1-MT. Error bars correspond to SEM. 1-MT, 1-DL-methyltryptophan; IDO, indoleamine 2,3-dioxygenase 1.
Figure 1.
Anoxia upregulates IDO expression and activity. Cells were cultured under anoxic conditions for 24 h along with the indicating treatments. Anoxia in the presence or not of 1MT or CH223191 increased IDO protein level. A representative Western blot experiment is displayed in panel (A), whereas panel (B) depicts the cumulative results of four repeated experiments. * p < 0.05 vs. Control, # p < 0.05 vs. Control with 1-MT, ^ p < 0.05 vs. Control with CH223191, & p < 0.05 vs. Anoxia, + p < 0.05 vs. Anoxia with 1-MT, ! p < 0.05 vs. Anoxia with CH223191. IDO activity assessed by the ratio of kynurenine to tryptophan concentration in cell culture supernatants also increased under anoxic conditions, an effect that is abolished by the IDO inhibitor 1-MT (C–E). Six such experiments were performed. * p < 0.05 vs. Control, # p < 0.05 vs. Control with 1-MT, ^ p < 0.05 vs. Anoxia, & p < 0.05 vs. Anoxia with 1-MT. Error bars correspond to SEM. 1-MT, 1-DL-methyltryptophan; IDO, indoleamine 2,3-dioxygenase 1.

Figure 2.
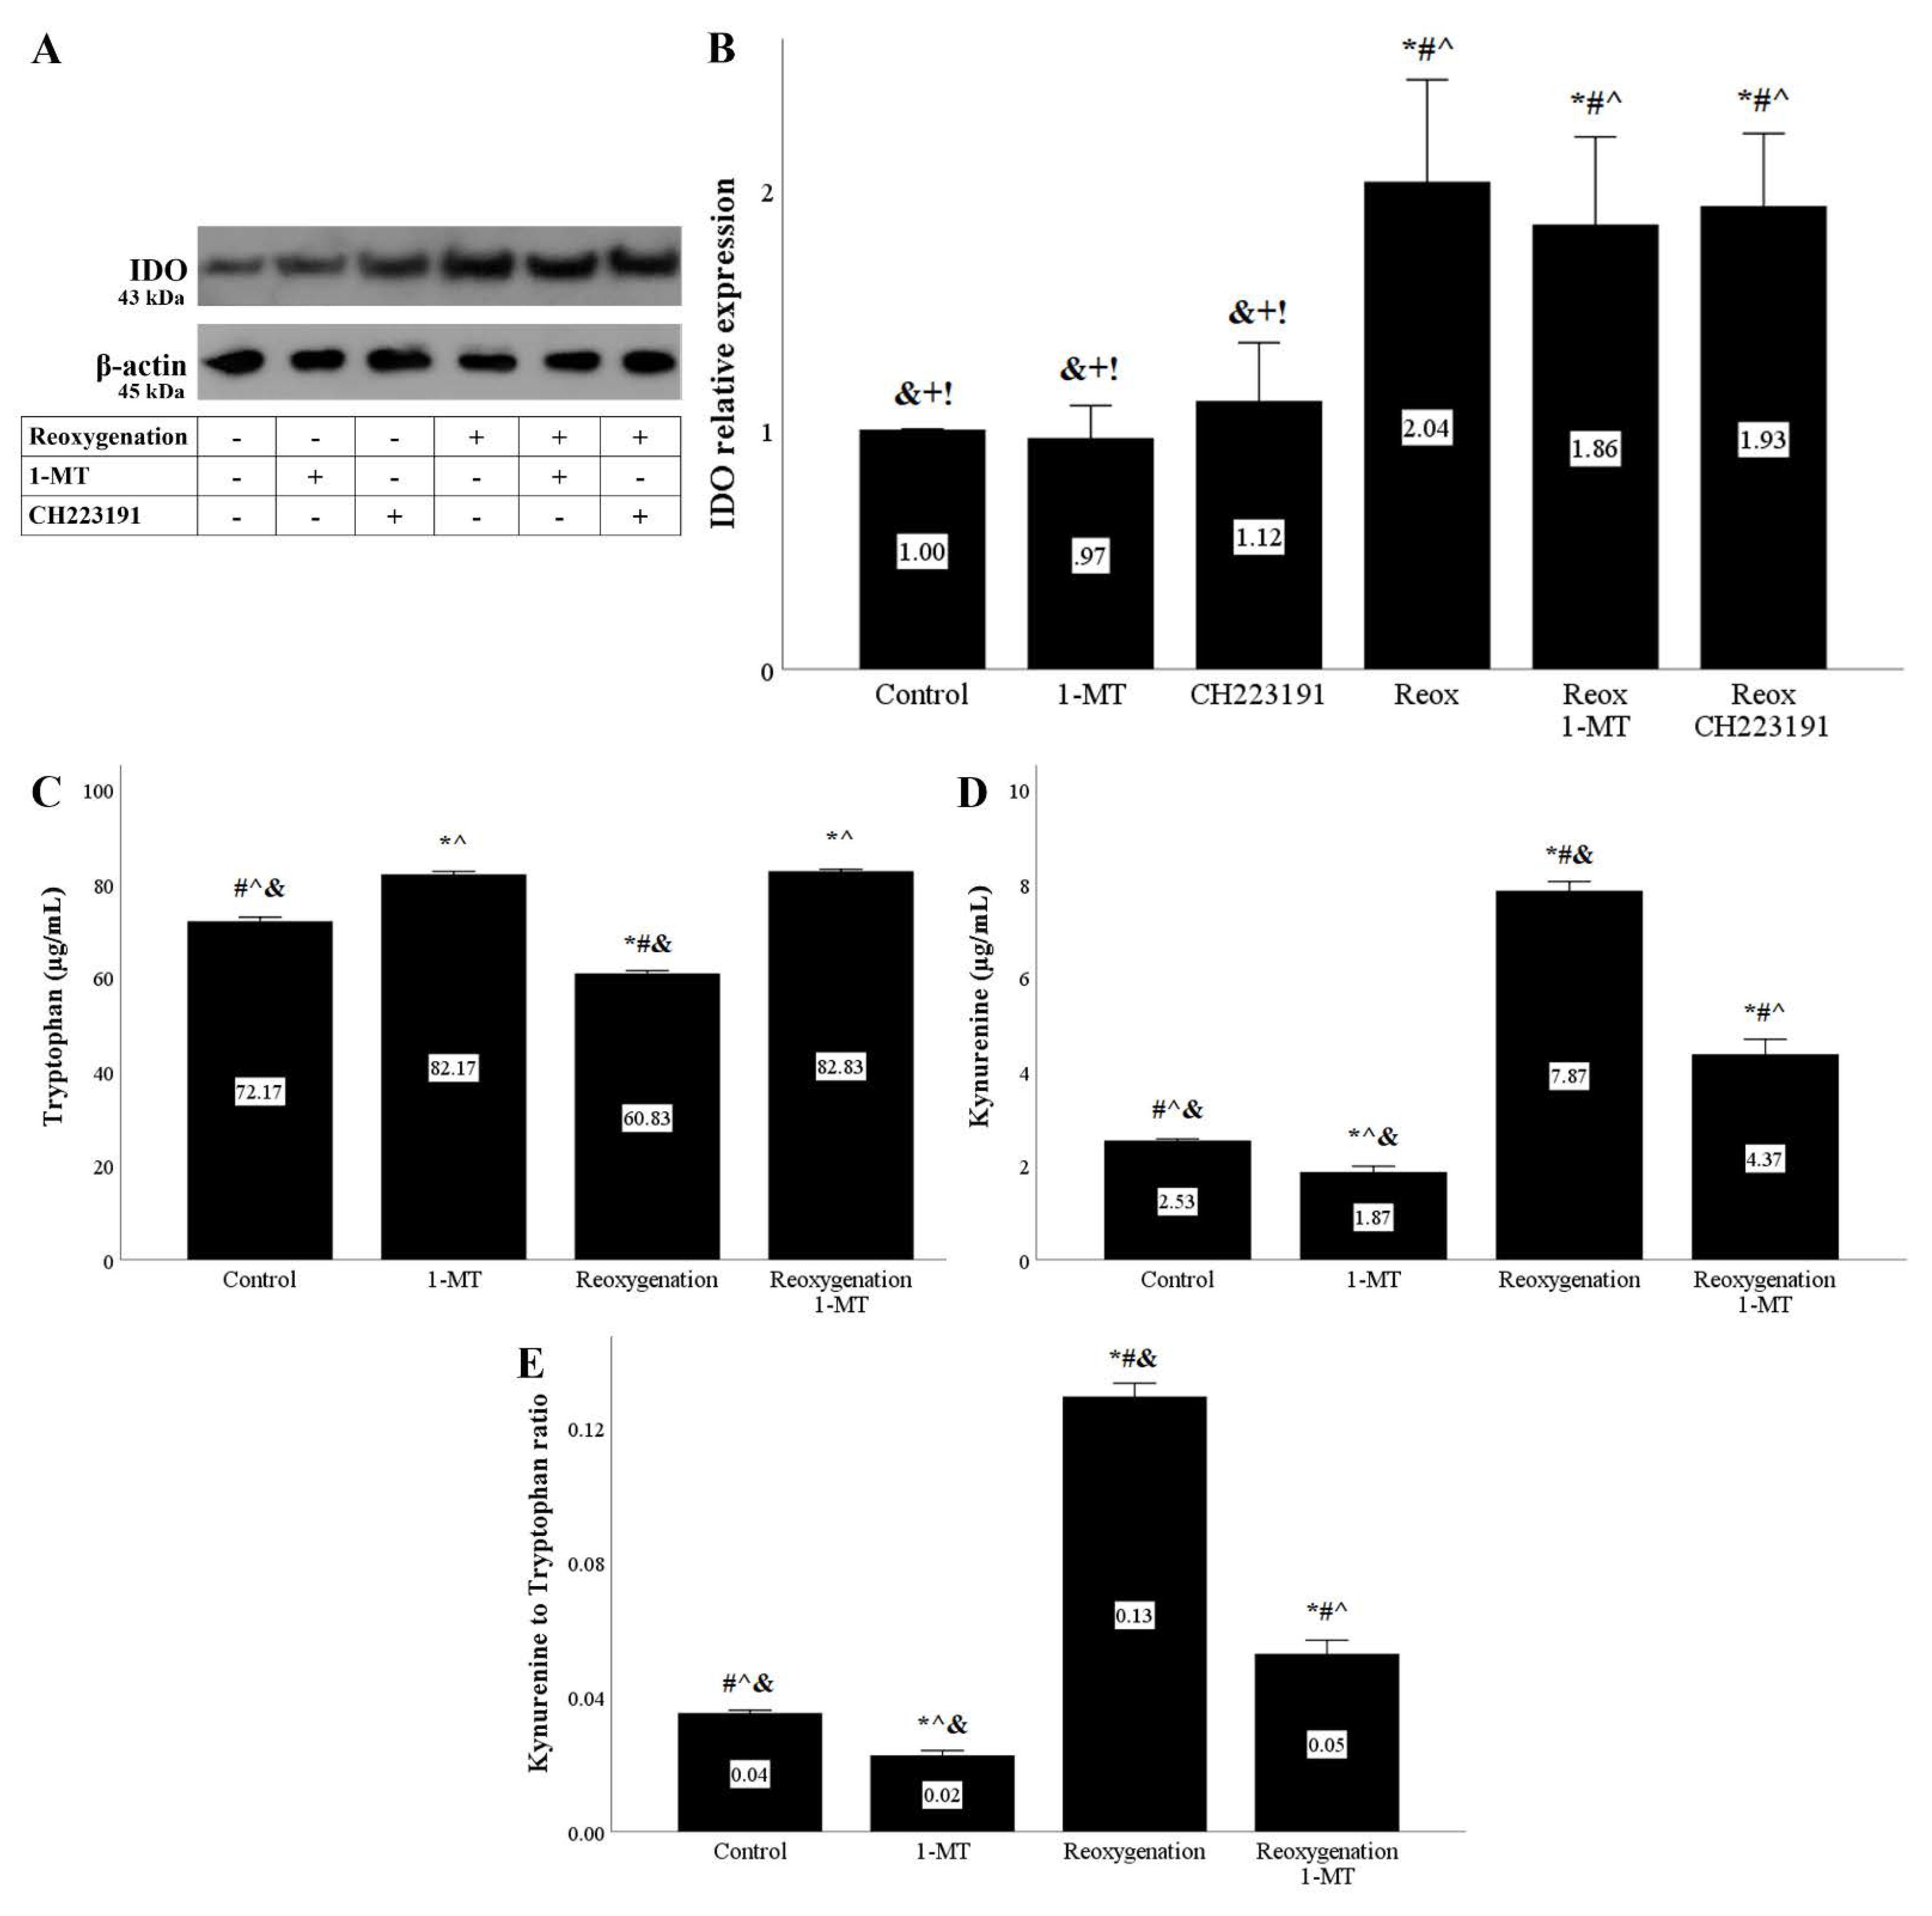
Reoxygenation upregulates IDO expression and activity. Cells were cultured under anoxic conditions for 24 h and then subjected to 2 h of reoxygenation along with the indicating treatments. Reoxygenation in the presence or not of 1-MT or CH223191 increased IDO protein level. A representative Western blot experiment is displayed in panel (A), whereas panel (B) depicts the cumulative results of four repeated experiments. * p < 0.05 vs. Control, # p < 0.05 vs. Control with 1-MT, ^ p < 0.05 vs. Control with CH223191, & p < 0.05 vs. Reoxygenation, + p < 0.05 vs. Reoxygenation with 1-MT, ! p < 0.05 vs. Reoxygenation with CH223191. IDO activity assessed by the ratio of kynurenine to tryptophan concentration in cell culture supernatants also increased under reoxygenation, an effect that is abolished by the IDO inhibitor 1-MT (C–E). Six such experiments were performed. * p < 0.05 vs. Control, # p < 0.05 vs. Control with 1-MT, ^ p < 0.05 vs. Reoxygenation, & p < 0.05 vs. Reoxygenation with 1-MT. Error bars correspond to SEM. 1-MT, 1-DL-methyltryptophan; IDO, indoleamine 2,3-dioxygenase 1; Reox, reoxygenation.
Figure 2.
Reoxygenation upregulates IDO expression and activity. Cells were cultured under anoxic conditions for 24 h and then subjected to 2 h of reoxygenation along with the indicating treatments. Reoxygenation in the presence or not of 1-MT or CH223191 increased IDO protein level. A representative Western blot experiment is displayed in panel (A), whereas panel (B) depicts the cumulative results of four repeated experiments. * p < 0.05 vs. Control, # p < 0.05 vs. Control with 1-MT, ^ p < 0.05 vs. Control with CH223191, & p < 0.05 vs. Reoxygenation, + p < 0.05 vs. Reoxygenation with 1-MT, ! p < 0.05 vs. Reoxygenation with CH223191. IDO activity assessed by the ratio of kynurenine to tryptophan concentration in cell culture supernatants also increased under reoxygenation, an effect that is abolished by the IDO inhibitor 1-MT (C–E). Six such experiments were performed. * p < 0.05 vs. Control, # p < 0.05 vs. Control with 1-MT, ^ p < 0.05 vs. Reoxygenation, & p < 0.05 vs. Reoxygenation with 1-MT. Error bars correspond to SEM. 1-MT, 1-DL-methyltryptophan; IDO, indoleamine 2,3-dioxygenase 1; Reox, reoxygenation.

Figure 3.
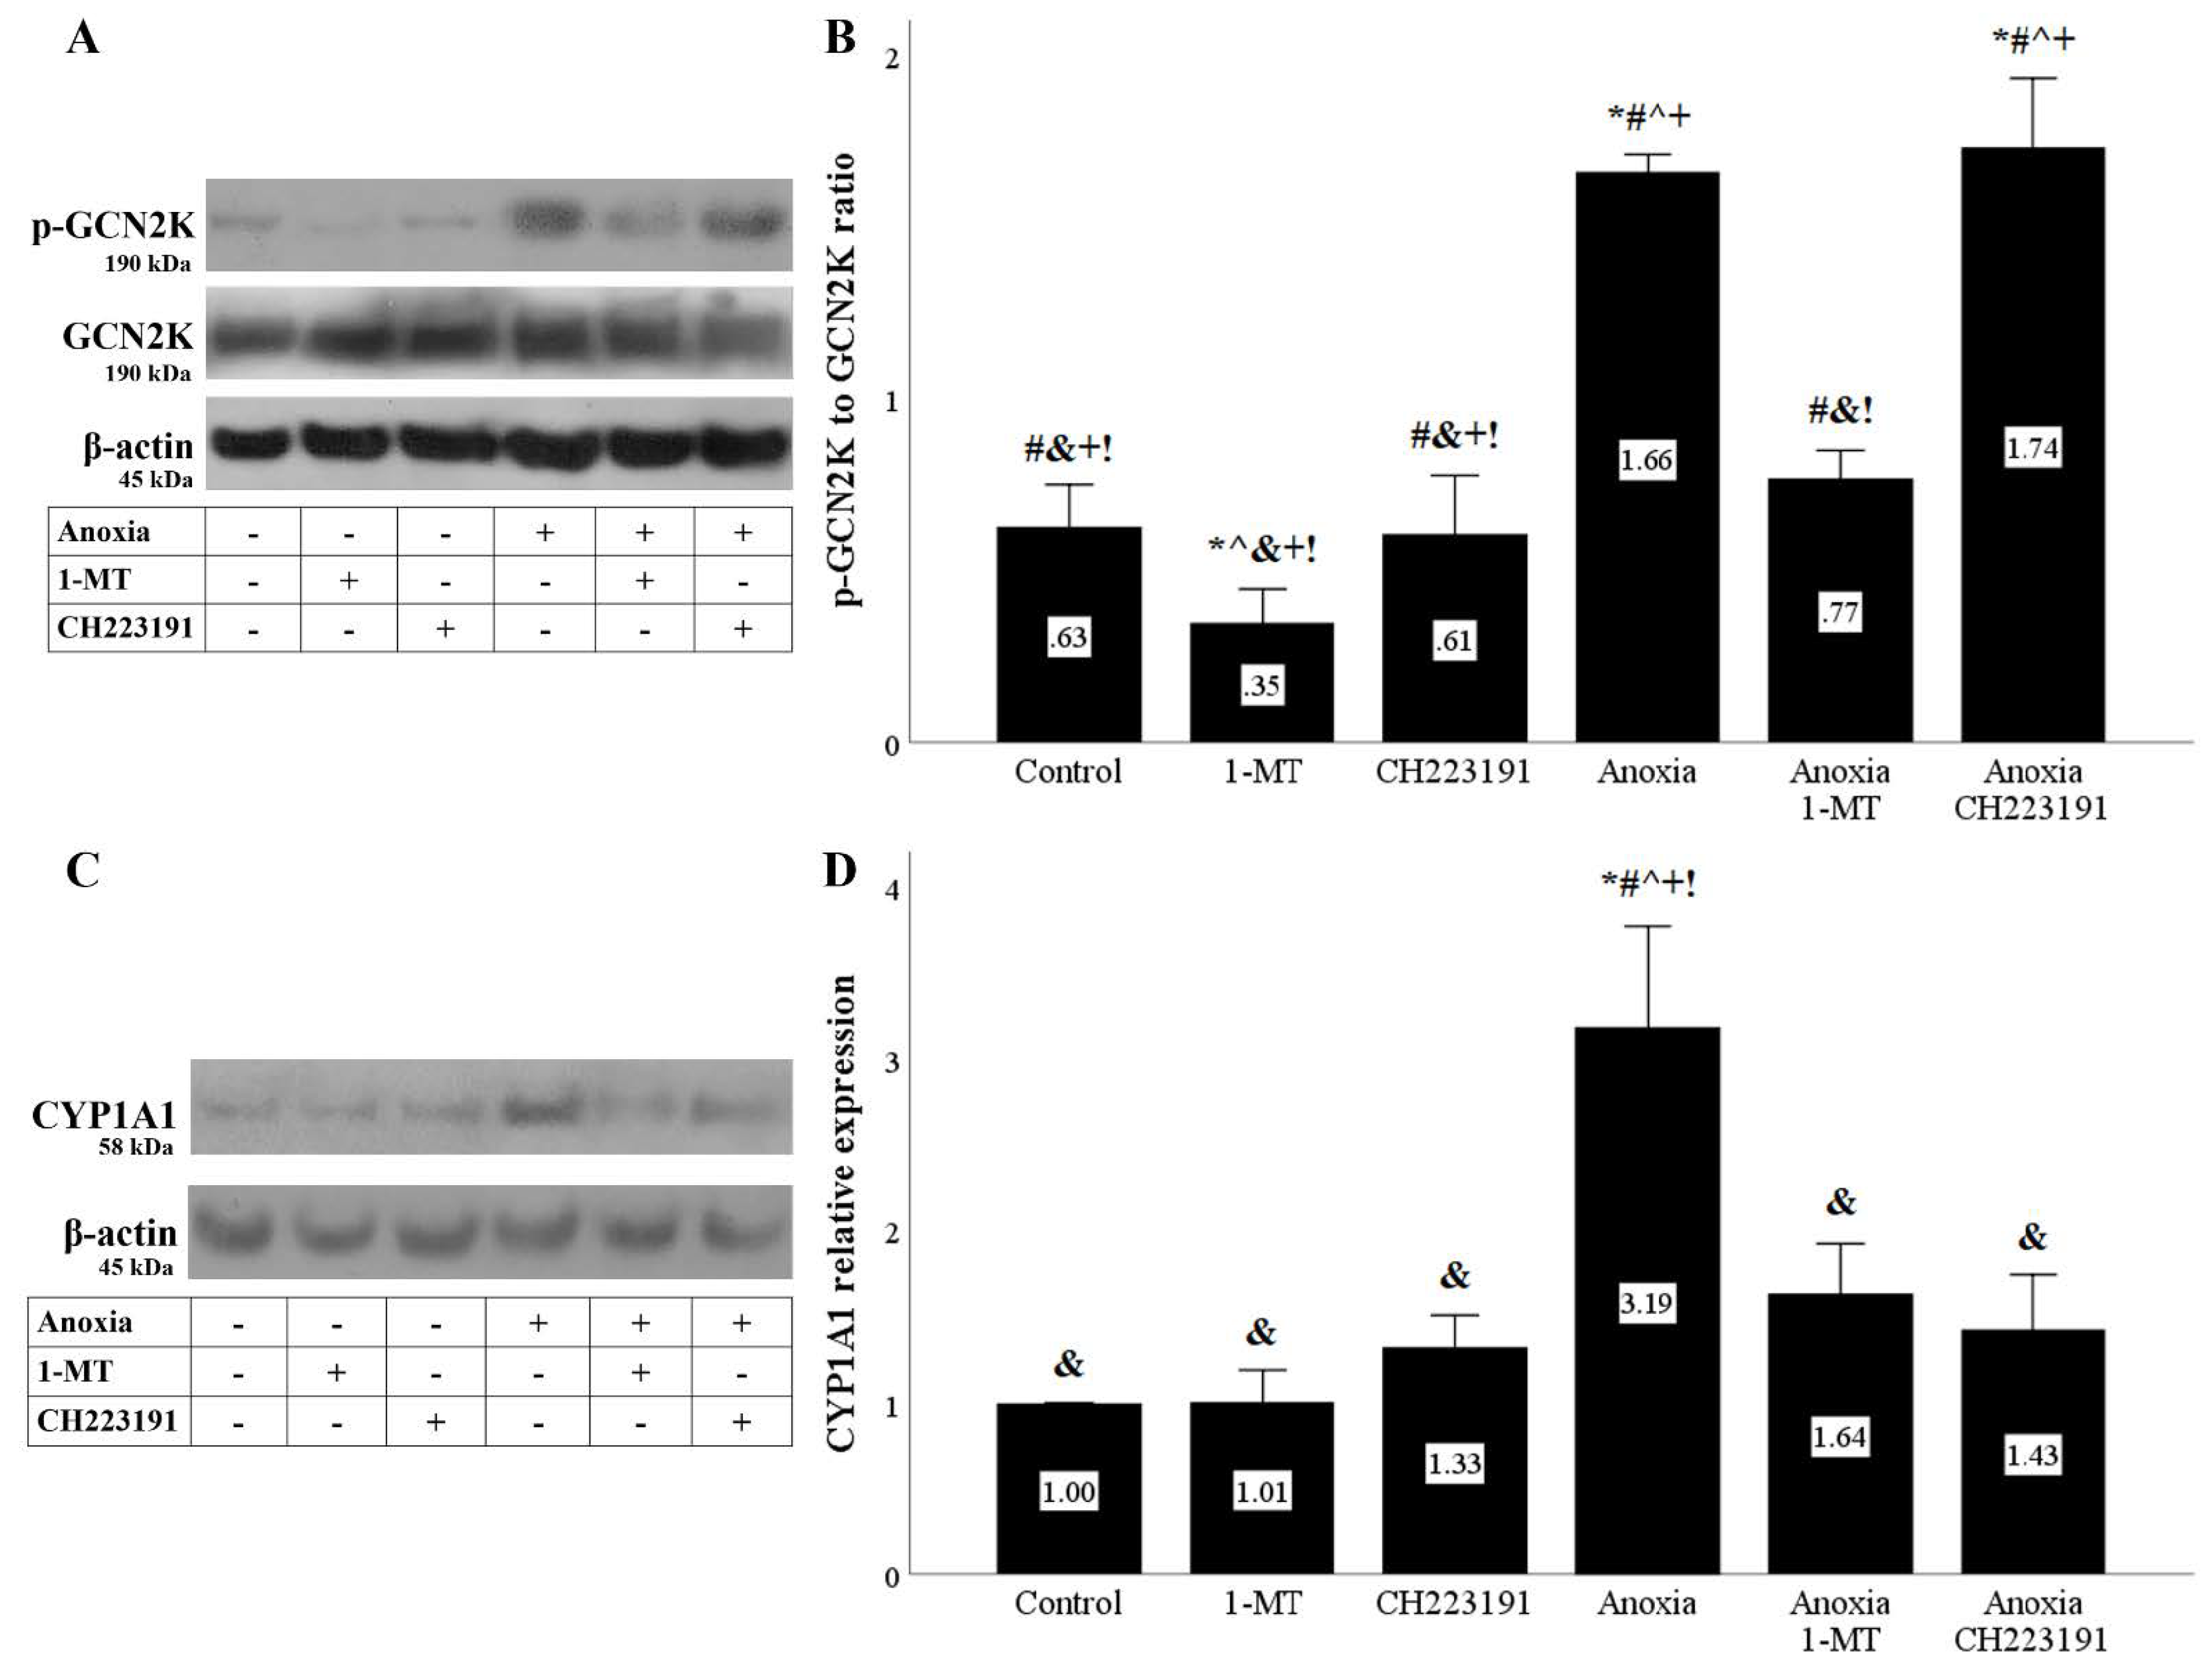
Anoxia activates both IDO activity-derived pathways. Cells were cultured under anoxic conditions for 24 h along with the indicating treatments. Anoxia activated the GCN2K pathway assessed by the level of phosphorylated activated GCN2K. 1-MT, but not CH223191, prevented GCN2K activation. A representative Western blot experiment is displayed in panel (A), whereas panel (B) depicts the cumulative results of four repeated experiments. Anoxia activated the AhR pathway assessed by the level of the AhR transcriptional target CYP1A1. Both the IDO inhibitor 1-MT and the AhR inhibitor CH223191 prevented AhR activation. A representative Western blot experiment is displayed in panel (C), whereas panel (D) depicts the cumulative results of four repeated experiments. * p < 0.05 vs. Control, # p < 0.05 vs. Control with 1-MT, ^ p < 0.05 vs. Control with CH223191, & p < 0.05 vs. Anoxia, + p < 0.05 vs. Anoxia with 1-MT, ! p < 0.05 vs. Anoxia with CH223191. Error bars correspond to SEM. 1-MT, 1-DL-methyltryptophan; CYP1A1, cytochrome P450, family 1, subfamily A, polypeptide 1; GCN2K, general control nonderepressible 2 kinase; p-GCN2K, phosphorylated GCN2K.
Figure 3.
Anoxia activates both IDO activity-derived pathways. Cells were cultured under anoxic conditions for 24 h along with the indicating treatments. Anoxia activated the GCN2K pathway assessed by the level of phosphorylated activated GCN2K. 1-MT, but not CH223191, prevented GCN2K activation. A representative Western blot experiment is displayed in panel (A), whereas panel (B) depicts the cumulative results of four repeated experiments. Anoxia activated the AhR pathway assessed by the level of the AhR transcriptional target CYP1A1. Both the IDO inhibitor 1-MT and the AhR inhibitor CH223191 prevented AhR activation. A representative Western blot experiment is displayed in panel (C), whereas panel (D) depicts the cumulative results of four repeated experiments. * p < 0.05 vs. Control, # p < 0.05 vs. Control with 1-MT, ^ p < 0.05 vs. Control with CH223191, & p < 0.05 vs. Anoxia, + p < 0.05 vs. Anoxia with 1-MT, ! p < 0.05 vs. Anoxia with CH223191. Error bars correspond to SEM. 1-MT, 1-DL-methyltryptophan; CYP1A1, cytochrome P450, family 1, subfamily A, polypeptide 1; GCN2K, general control nonderepressible 2 kinase; p-GCN2K, phosphorylated GCN2K.

Figure 4.
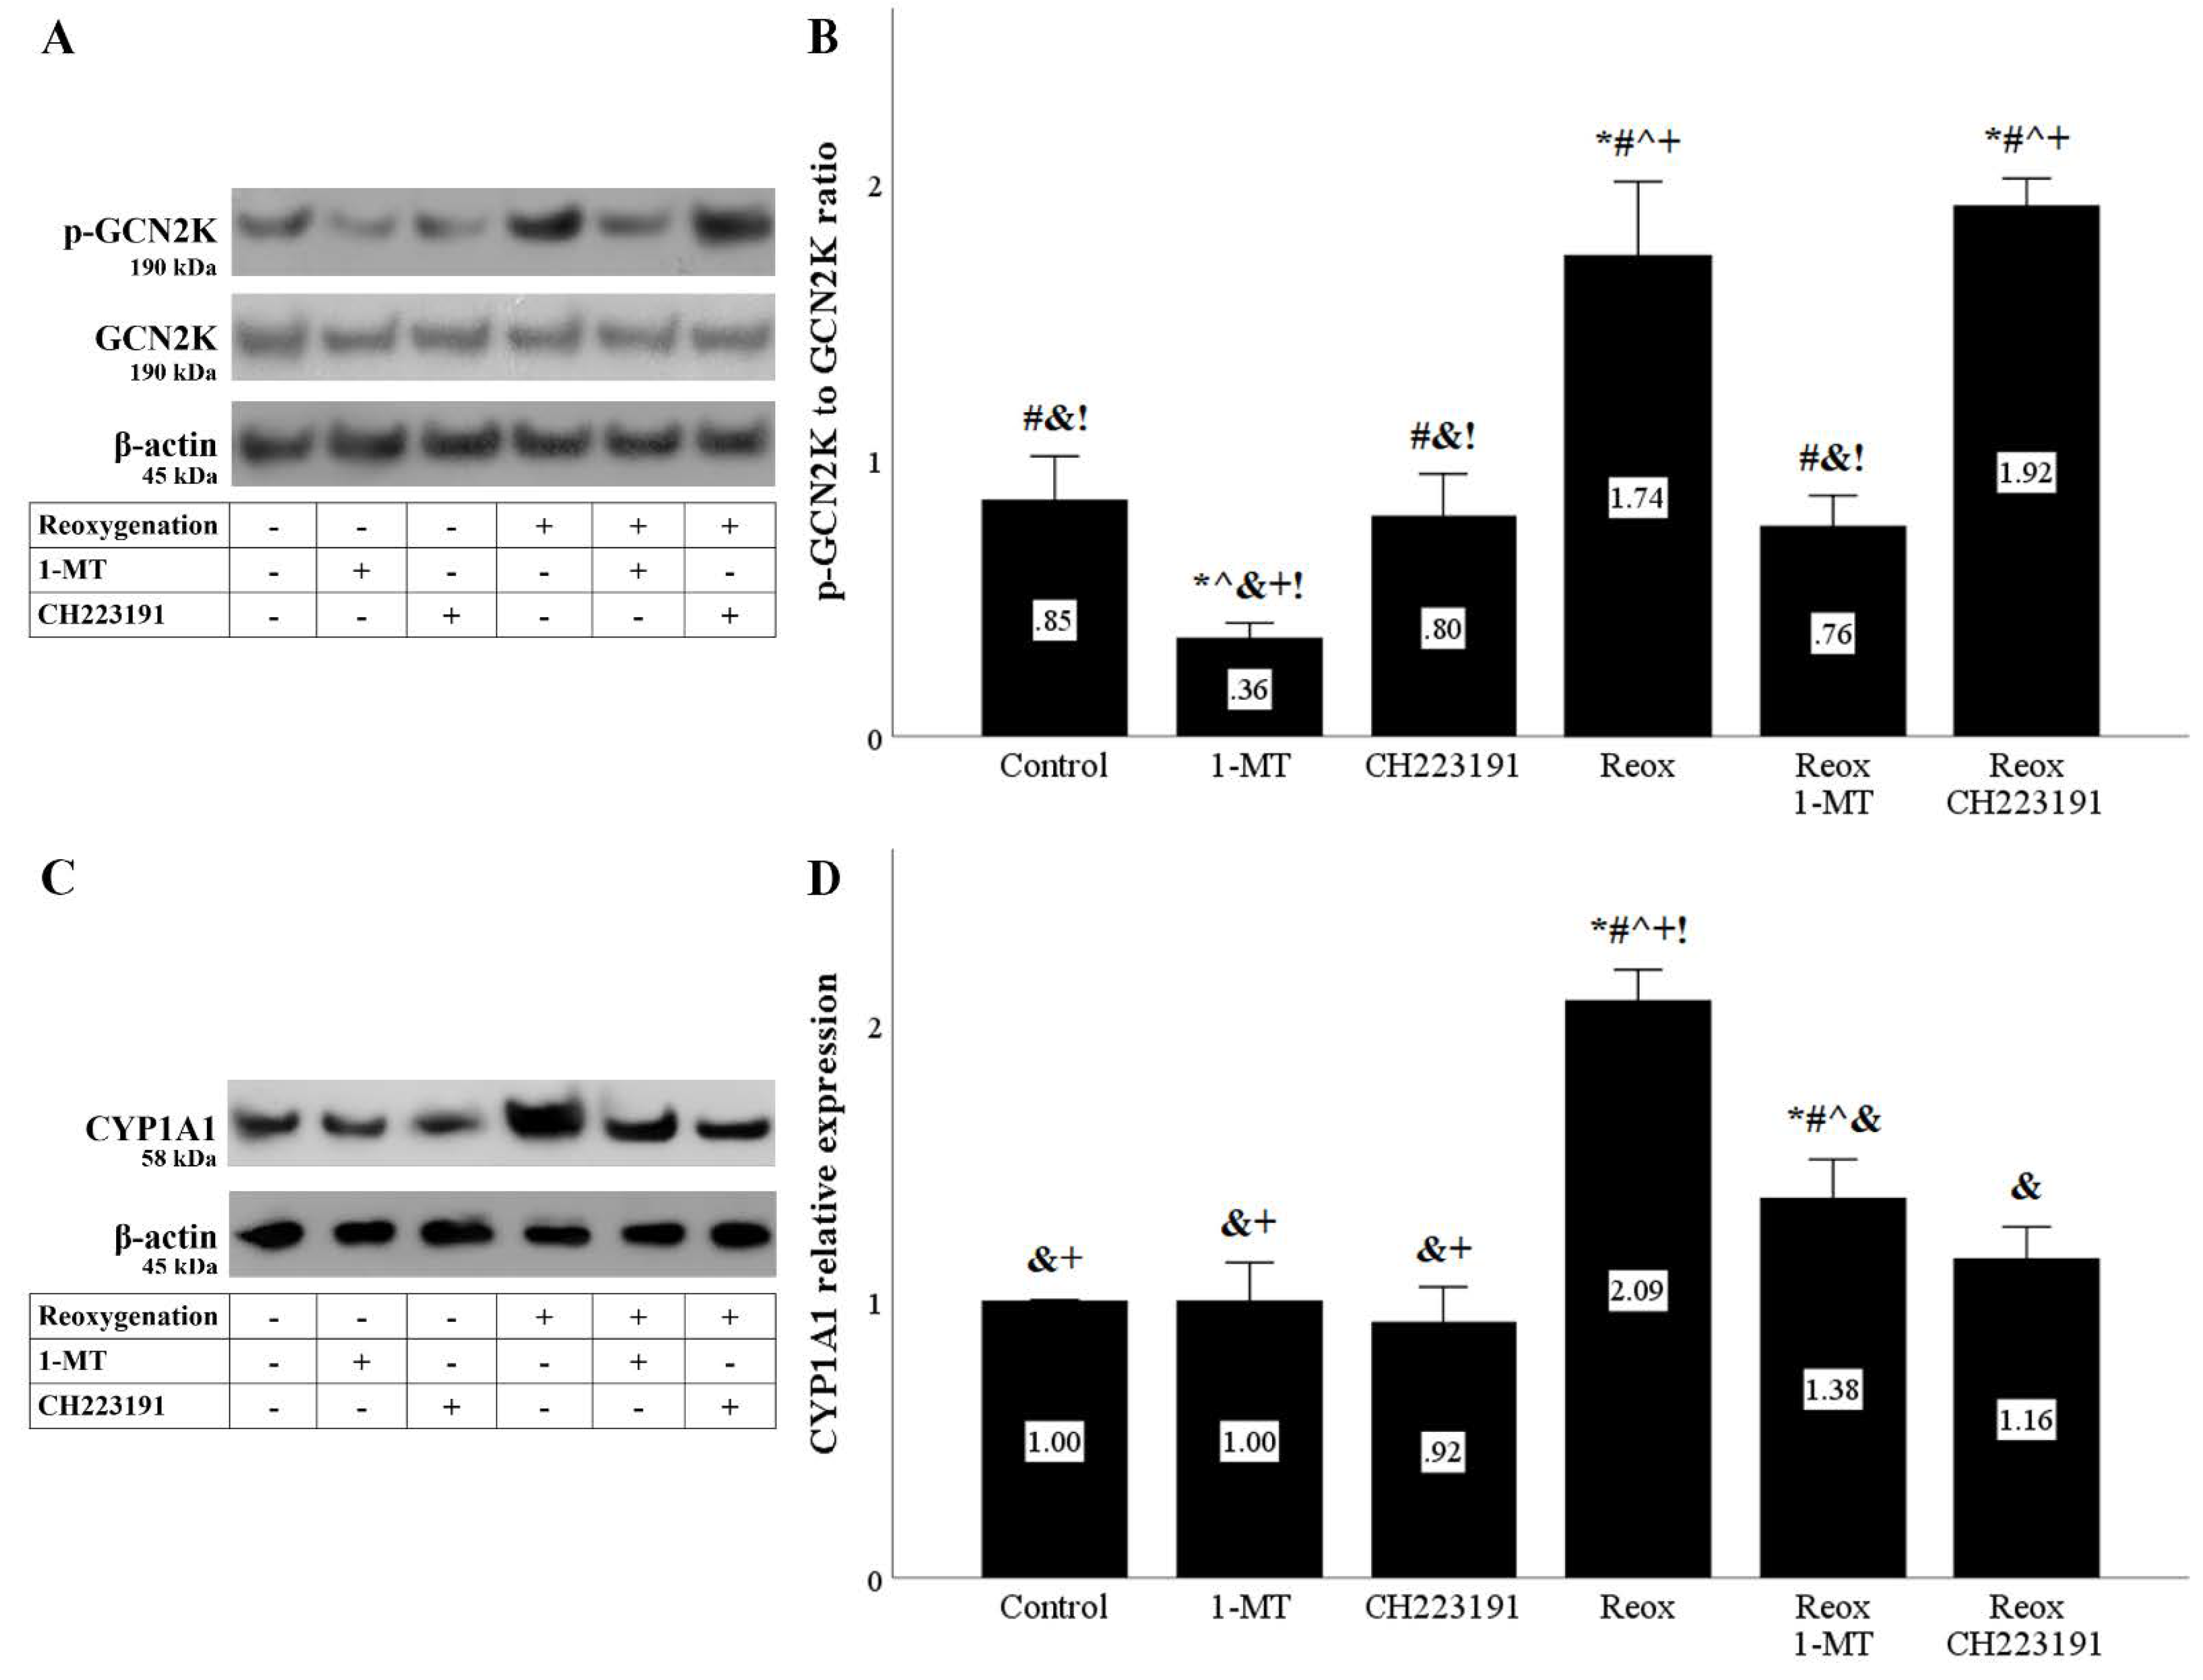
Reoxygenation activates both IDO activity-derived pathways. Cells were cultured under anoxic conditions for 24 h and then subjected to 2 h of reoxygenation along with the indicating treatments. Reoxygenation activated the GCN2K pathway assessed by the level of phosphorylated activated GCN2K. 1-MT, but not CH223191, prevented GCN2K activation. A representative Western blot experiment is displayed in panel (A), whereas panel (B) depicts the cumulative results of four repeated experiments. Reoxygenation activated the AhR pathway assessed by the level of the AhR transcriptional target CYP1A1. Both the IDO inhibitor 1-MT and the AhR inhibitor CH223191 prevented AhR activation. A representative Western blot experiment is displayed in panel (C), whereas panel (D) depicts the cumulative results of four repeated experiments. * p < 0.05 vs. Control, # p < 0.05 vs. Control with 1-MT, ^ p < 0.05 vs. Control with CH223191, & p < 0.05 vs. Reox, + p < 0.05 vs. Reox with 1-MT, ! p < 0.05 vs. Reox with CH223191. Error bars correspond to SEM. 1-MT, 1-DL-methyltryptophan; CYP1A1, cytochrome P450, family 1, subfamily A, polypeptide 1; GCN2K, general control nonderepressible 2 kinase; p-GCN2K, phosphorylated GCN2K; Reox, reoxygenation.
Figure 4.
Reoxygenation activates both IDO activity-derived pathways. Cells were cultured under anoxic conditions for 24 h and then subjected to 2 h of reoxygenation along with the indicating treatments. Reoxygenation activated the GCN2K pathway assessed by the level of phosphorylated activated GCN2K. 1-MT, but not CH223191, prevented GCN2K activation. A representative Western blot experiment is displayed in panel (A), whereas panel (B) depicts the cumulative results of four repeated experiments. Reoxygenation activated the AhR pathway assessed by the level of the AhR transcriptional target CYP1A1. Both the IDO inhibitor 1-MT and the AhR inhibitor CH223191 prevented AhR activation. A representative Western blot experiment is displayed in panel (C), whereas panel (D) depicts the cumulative results of four repeated experiments. * p < 0.05 vs. Control, # p < 0.05 vs. Control with 1-MT, ^ p < 0.05 vs. Control with CH223191, & p < 0.05 vs. Reox, + p < 0.05 vs. Reox with 1-MT, ! p < 0.05 vs. Reox with CH223191. Error bars correspond to SEM. 1-MT, 1-DL-methyltryptophan; CYP1A1, cytochrome P450, family 1, subfamily A, polypeptide 1; GCN2K, general control nonderepressible 2 kinase; p-GCN2K, phosphorylated GCN2K; Reox, reoxygenation.

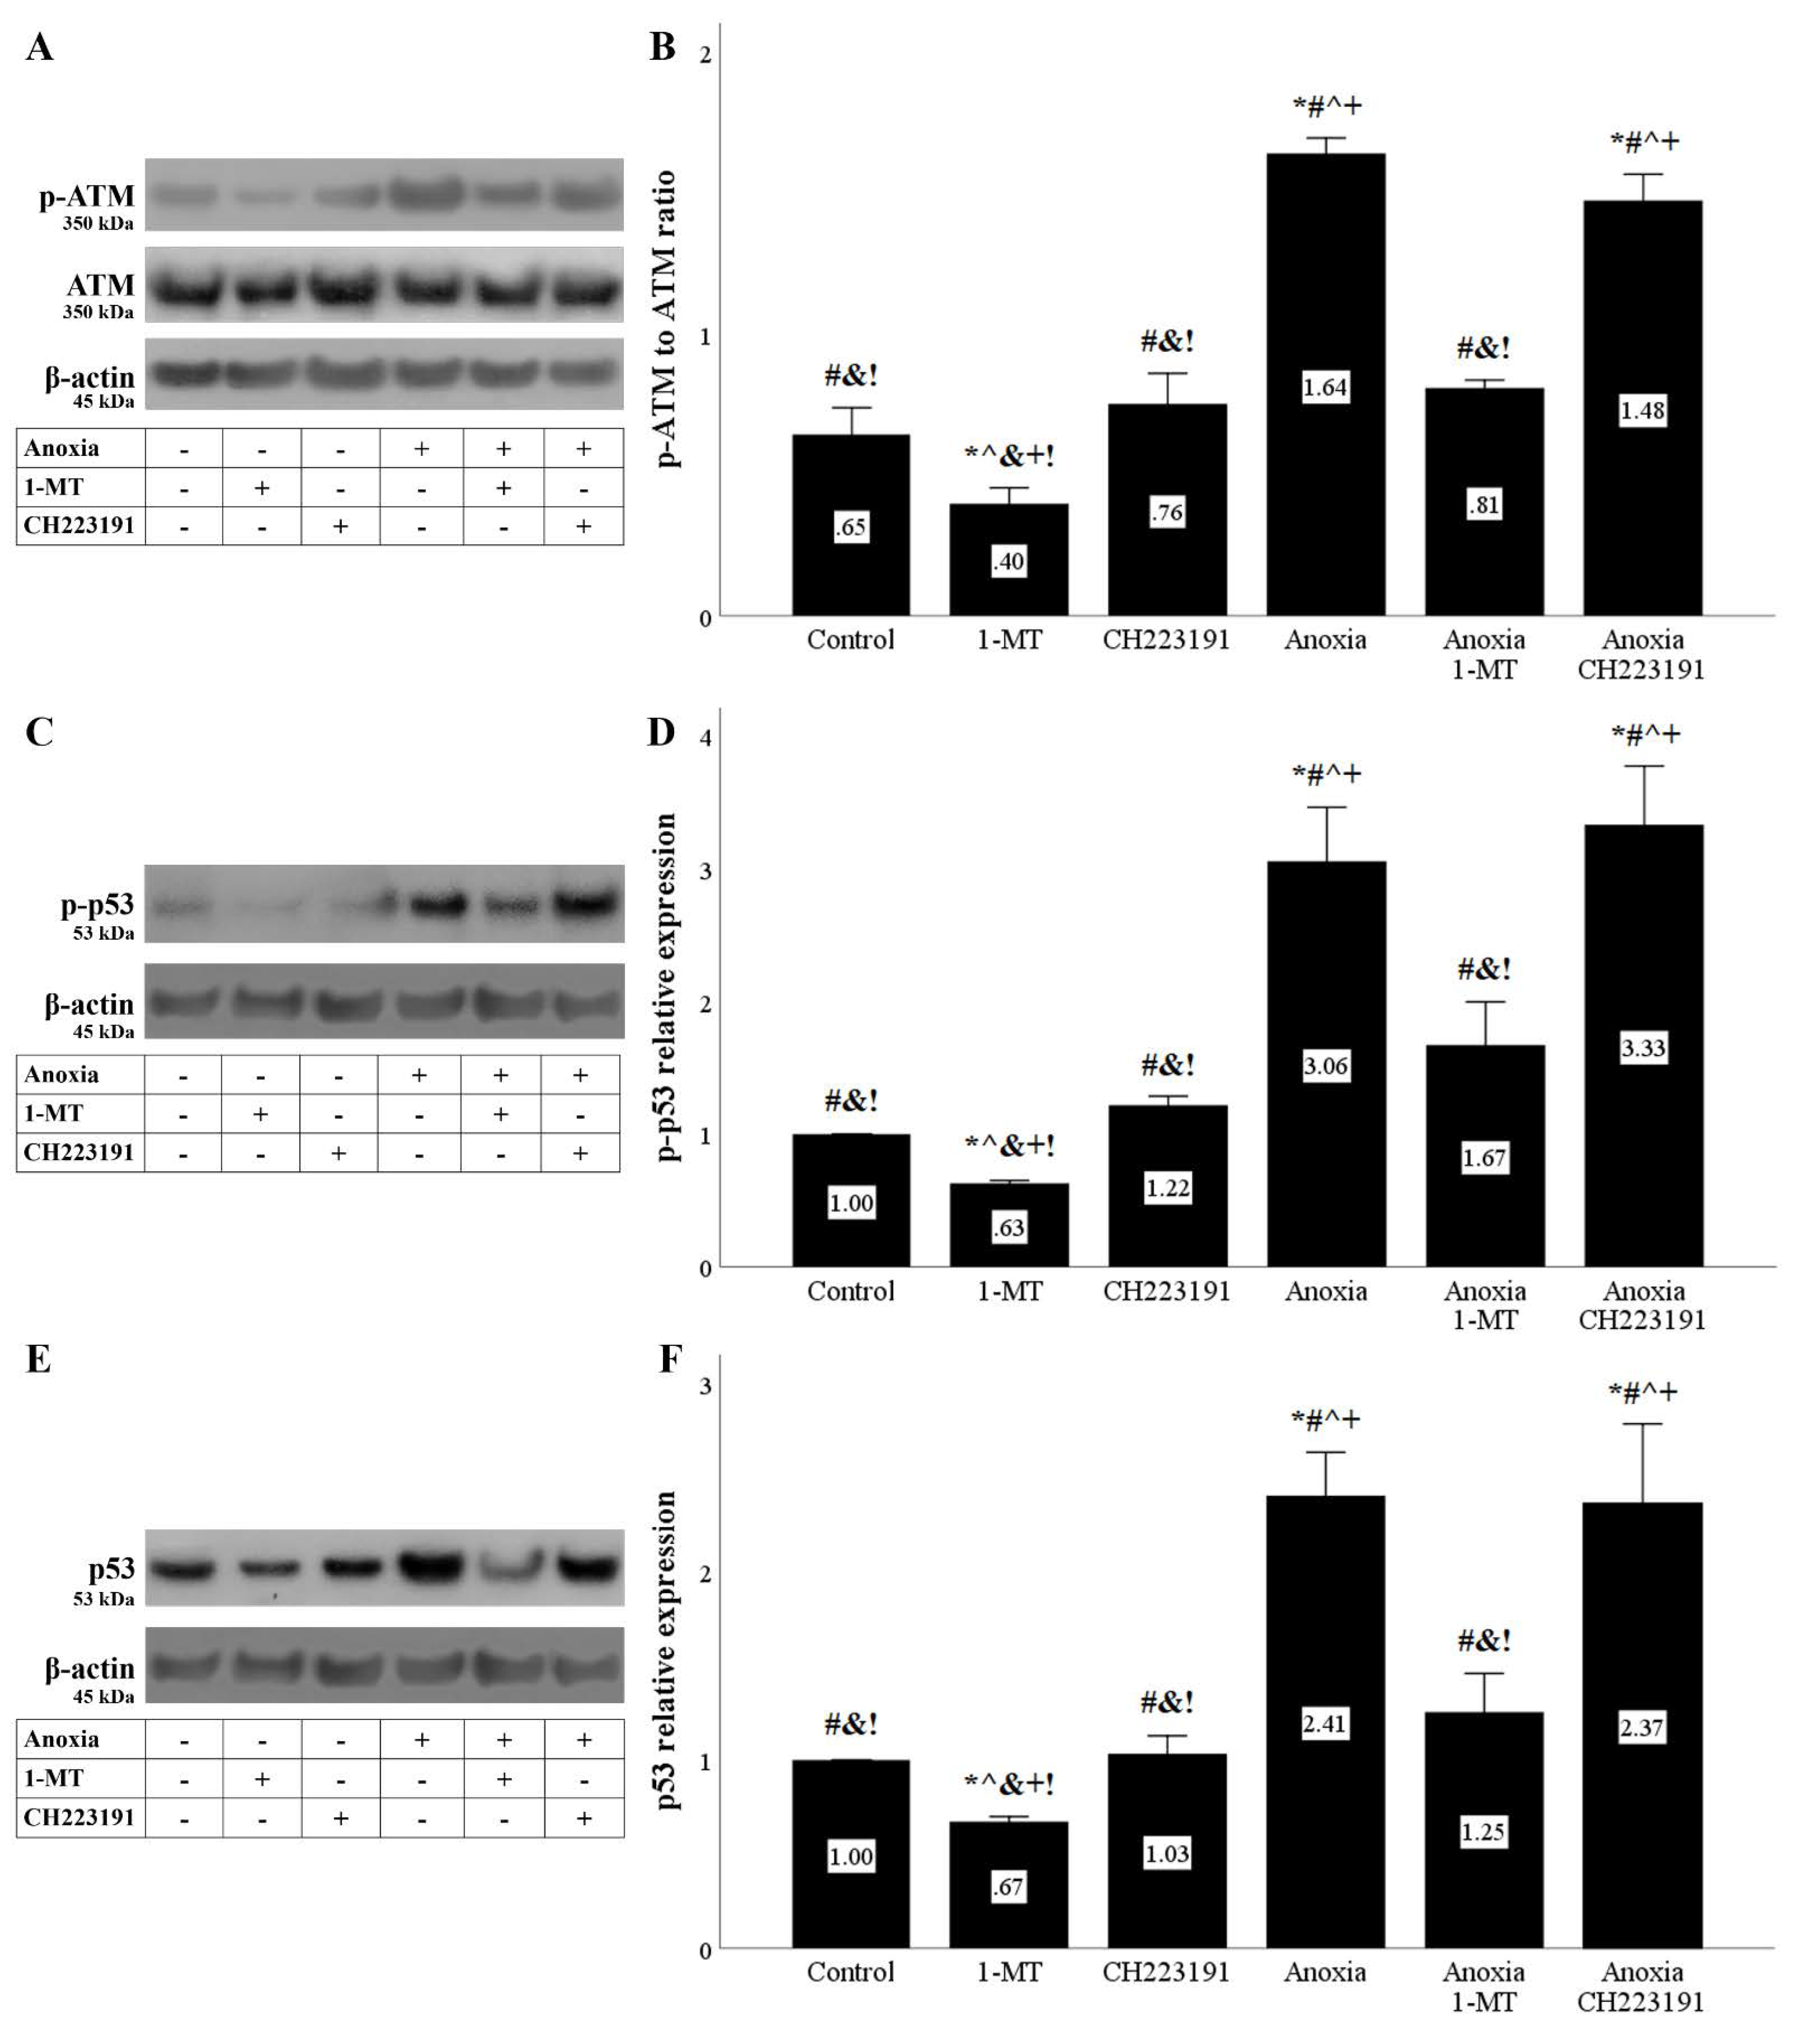
Figure 5.
Anoxia induces DNA damage response that is ameliorated by inhibition of IDO. Cells were cultured under anoxic conditions for 24 h along with the indicating treatments. Anoxia induced a DNA damage response assessed by the level of phosphorylated activated ATM. 1-MT, but not CH223191, prevented p-ATM upregulation. A representative Western blot experiment is displayed in panel (A), whereas panel (B) depicts the cumulative results of four repeated experiments. Anoxia increased p-p53 level. 1-MT, but not CH223191, prevented p-p53 increase. A representative Western blot experiment is displayed in panel (C), whereas panel (D) depicts the cumulative results of four repeated experiments. Anoxia increased p53 level. 1-MT, but not CH223191, prevented p53 rise. A representative Western blot experiment is displayed in panel (E), whereas panel (F) depicts the cumulative results of four repeated experiments. * p < 0.05 vs. Control, # p < 0.05 vs. Control with 1-MT, ^ p < 0.05 vs. Control with CH223191, & p < 0.05 vs. Anoxia, + p < 0.05 vs. Anoxia with 1-MT, ! p < 0.05 vs. Anoxia with CH223191. Error bars correspond to SEM. 1-MT, 1-DL-methyltryptophan; p-p53, phosphorylated p53.

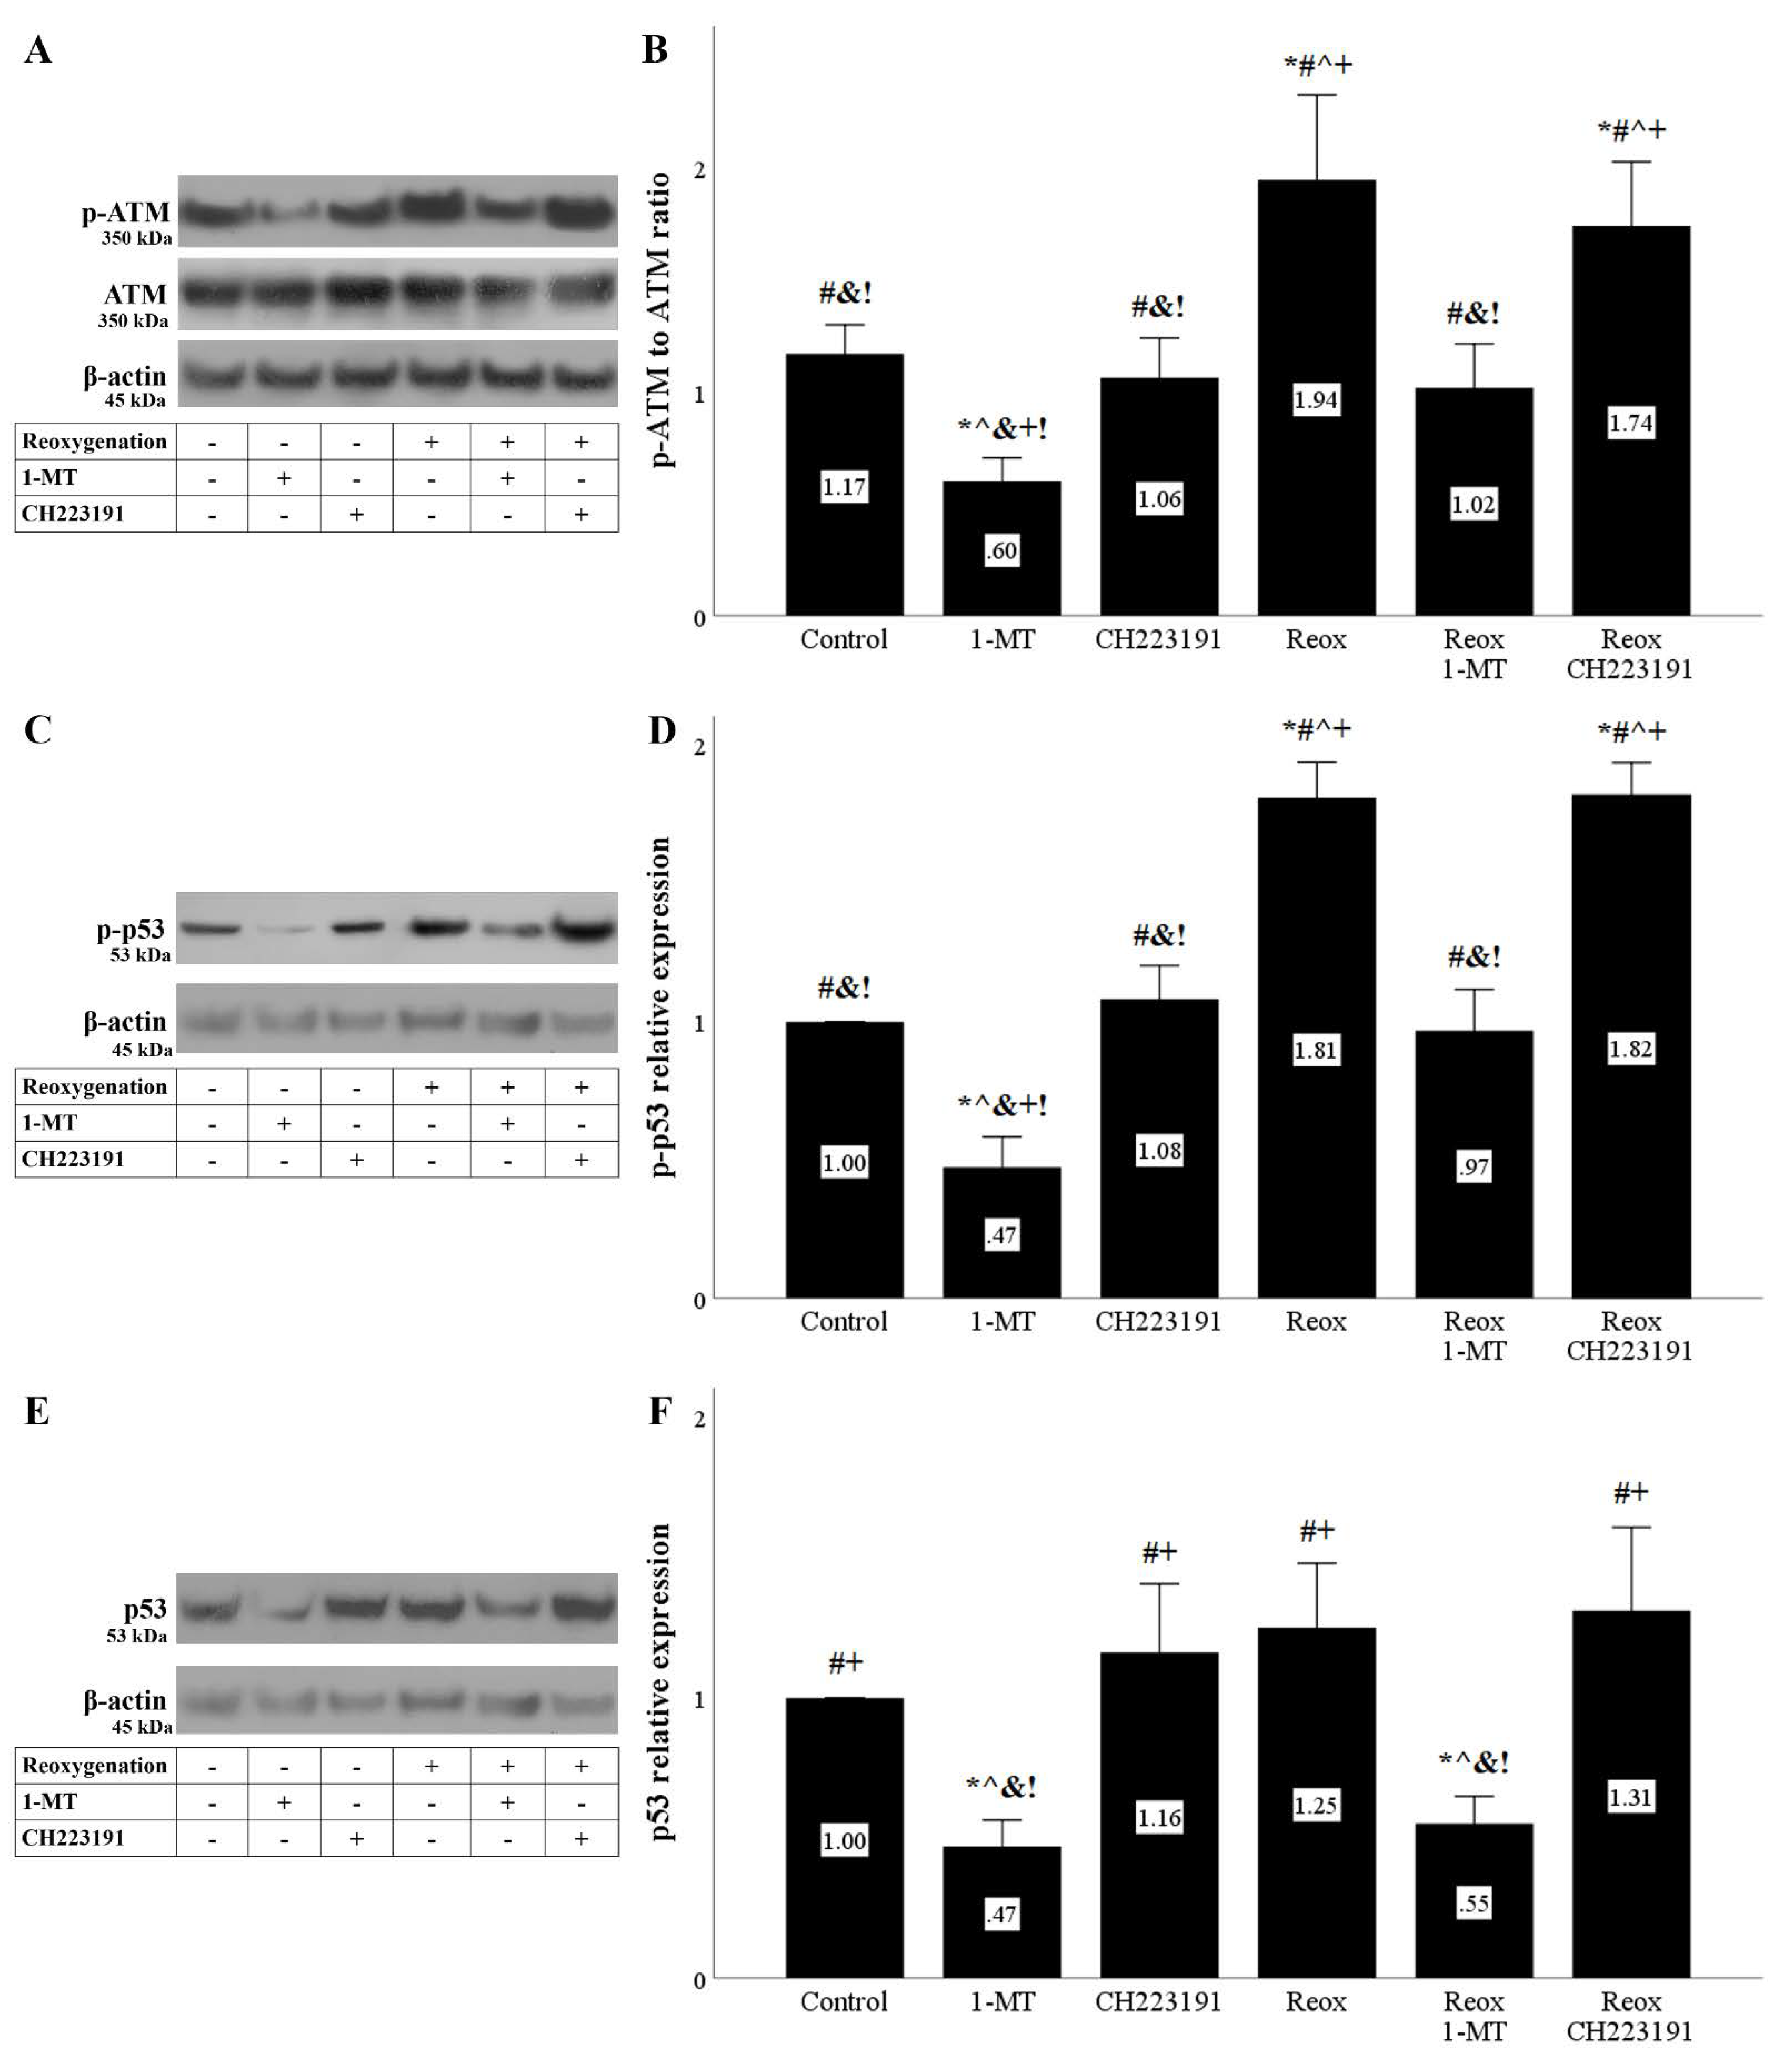
Figure 6.
Reoxygenation induces DNA damage response that is ameliorated by inhibition of IDO. Cells were cultured under anoxic conditions for 24 h and then subjected to 2 h of reoxygenation along with the indicating treatments. Reoxygenation induced a DNA damage response assessed by the level of phosphorylated activated ATM. 1-MT, but not CH223191, prevented p-ATM upregulation. A representative Western blot experiment is displayed in panel (A), whereas panel (B) depicts the cumulative results of four repeated experiments. Reoxygenation increased p-p53 level. 1-MT, but not CH223191, prevented p-p53 increase. A representative Western blot experiment is displayed in panel (C), whereas panel (D) depicts the cumulative results of four repeated experiments. Although 1-MT decreased p53 levels, reoxygenation per se did not affect p53. CH223191 left p53 levels unaffected. A representative Western blot experiment is displayed in panel (E), whereas panel (F) depicts the cumulative results of four repeated experiments. * p < 0.05 vs. Control, # p < 0.05 vs. Control with 1-MT, ^ p < 0.05 vs. Control with CH223191, & p < 0.05 vs. Reox, + p < 0.05 vs. Reox with 1-MT, ! p < 0.05 vs. Reox with CH223191. Error bars correspond to SEM. 1-MT, 1-DL-methyltryptophan; p-p53, phosphorylated p53, Reox, reoxygenation.

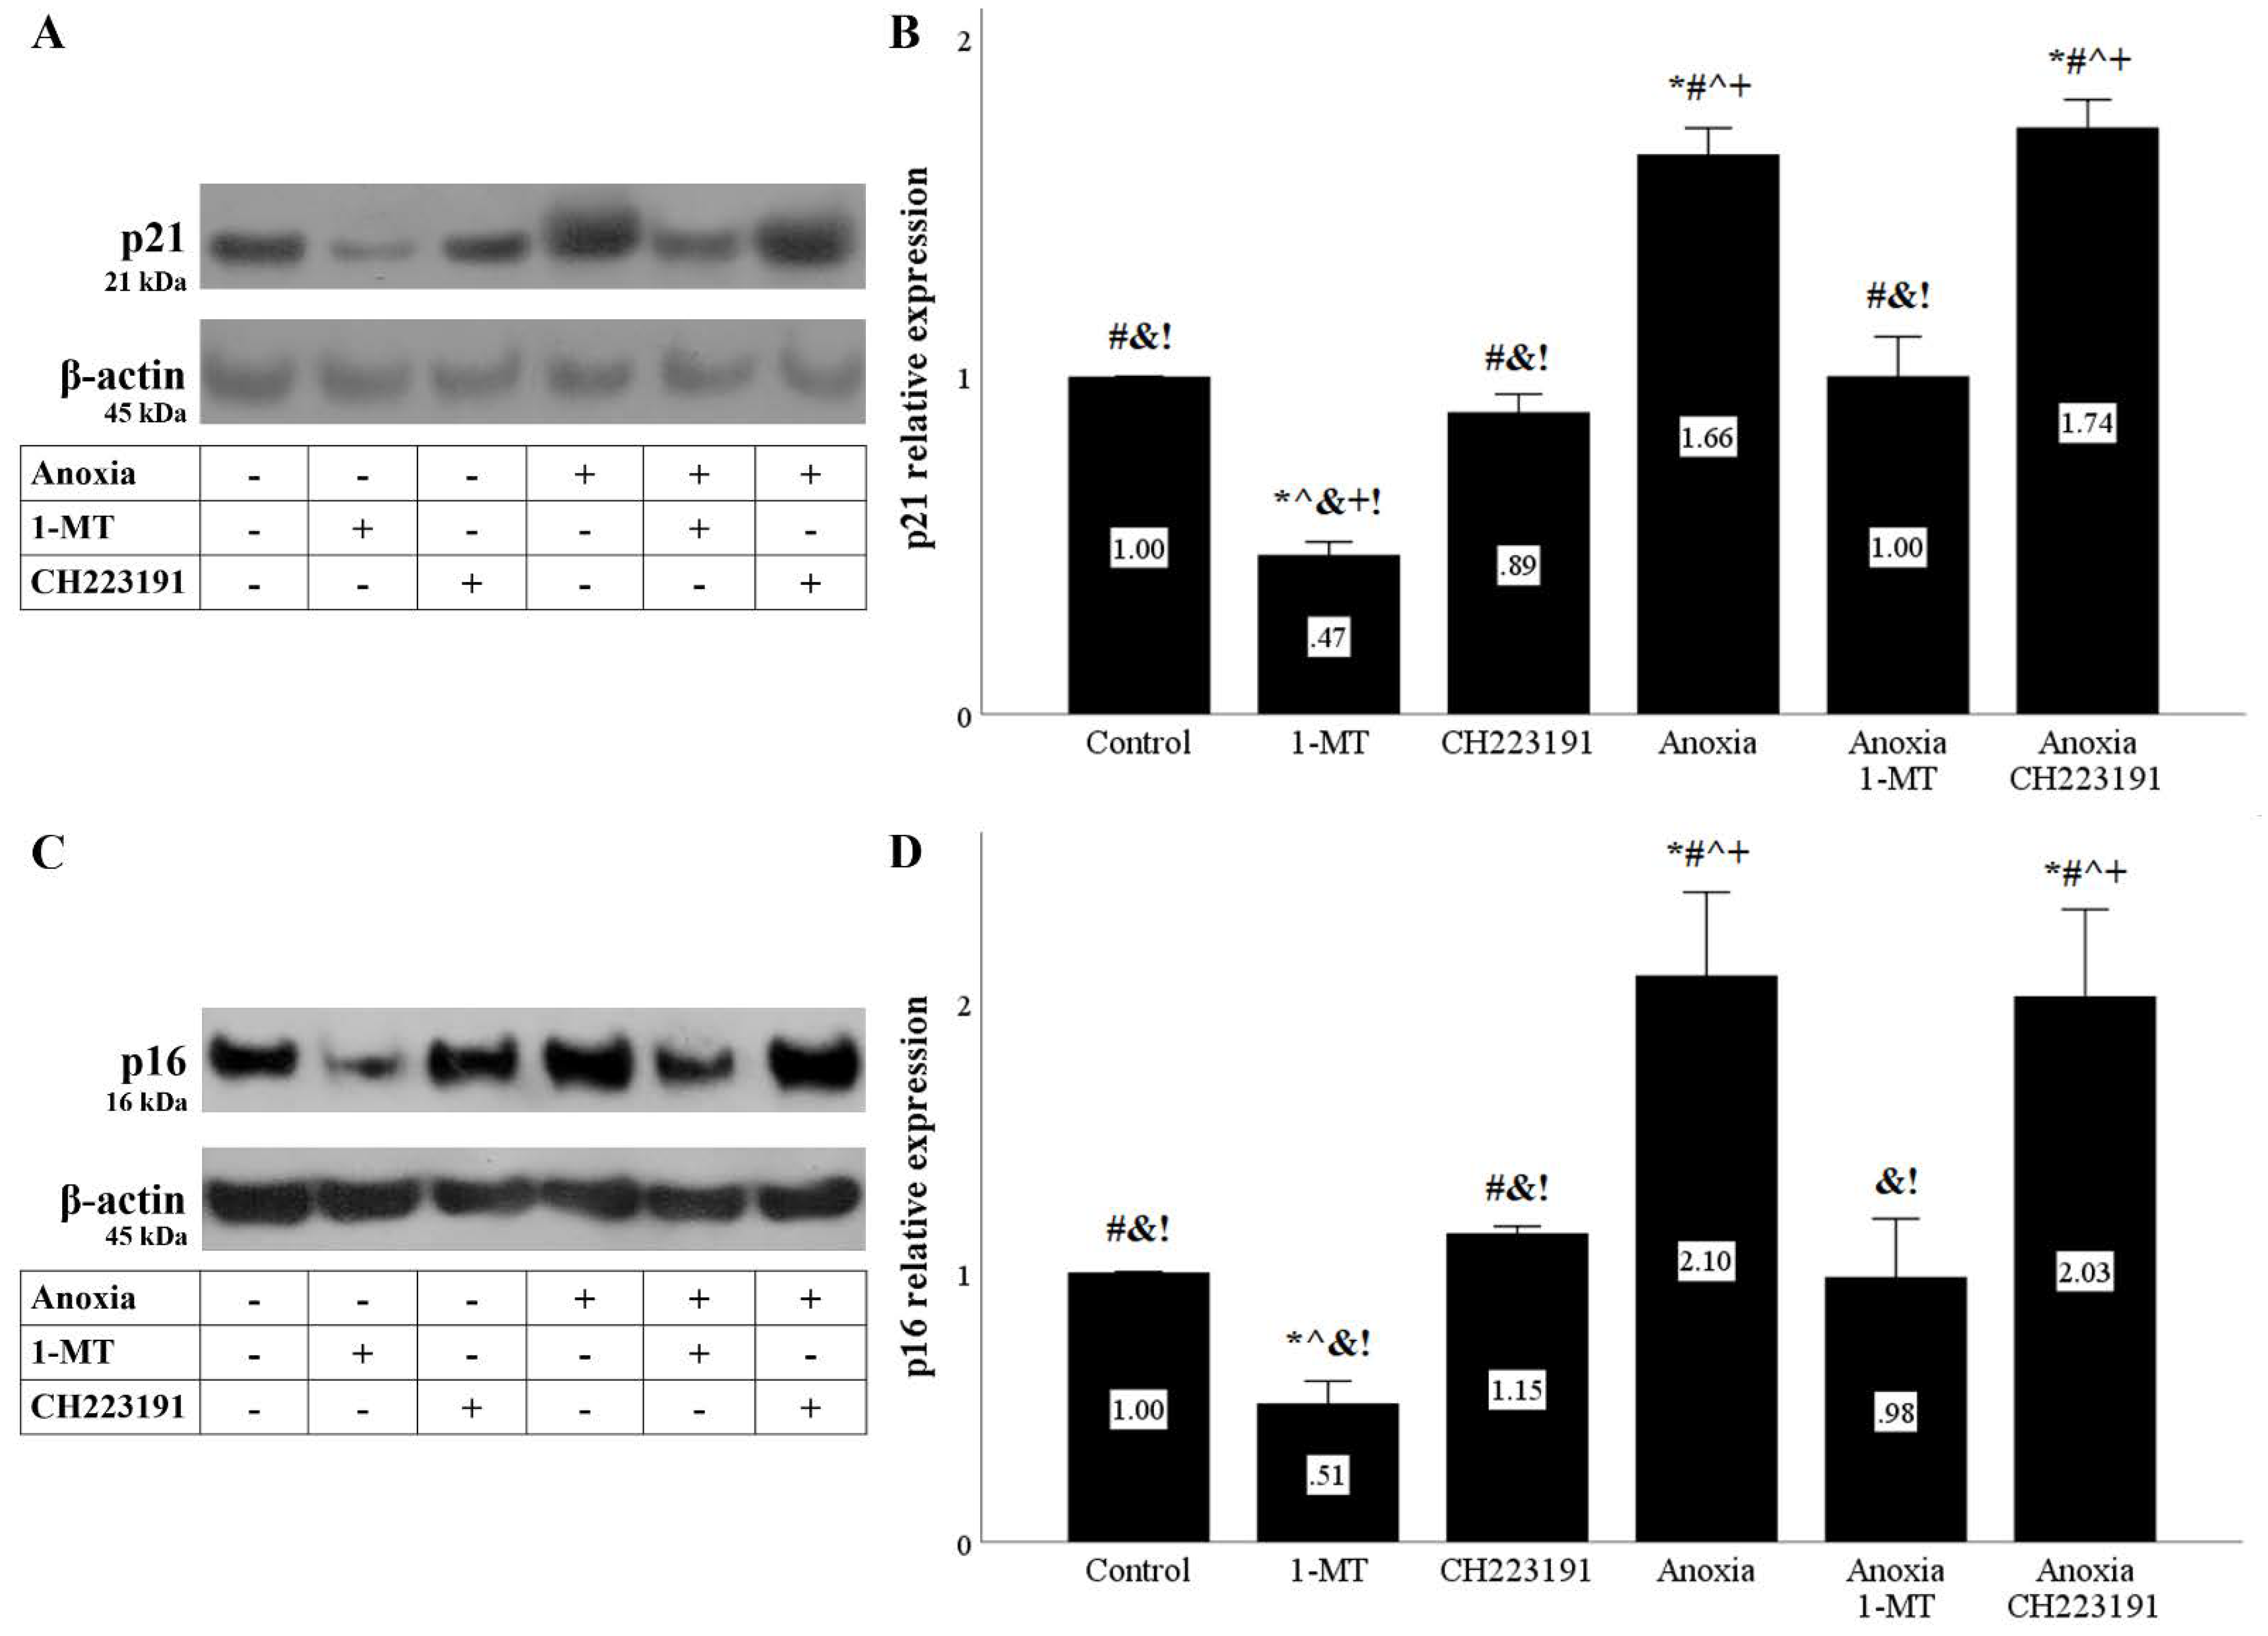
Figure 7.
Anoxia upregulates the cell-cycle inhibitors p21 and p16, whereas inhibition of IDO prevents their upregulation. Cells were cultured under anoxic conditions for 24 h along with the indicating treatments. Anoxia upregulated p21. 1-MT, but not CH223191, prevented p21 upregulation. A representative Western blot experiment is displayed in panel (A), whereas panel (B) depicts the cumulative results of four repeated experiments. Anoxia increased p16 levels. 1-MT, but not CH223191, prevented p16 increase. A representative Western blot experiment is displayed in panel (C), whereas panel (D) depicts the cumulative results of four repeated experiments. * p < 0.05 vs. Control, # p < 0.05 vs. Control with 1-MT, ^ p < 0.05 vs. Control with CH223191, & p < 0.05 vs. Anoxia, + p < 0.05 vs. Anoxia with 1-MT, ! p < 0.05 vs. Anoxia with CH223191. Error bars correspond to SEM. 1-MT, 1-DL-methyltryptophan.
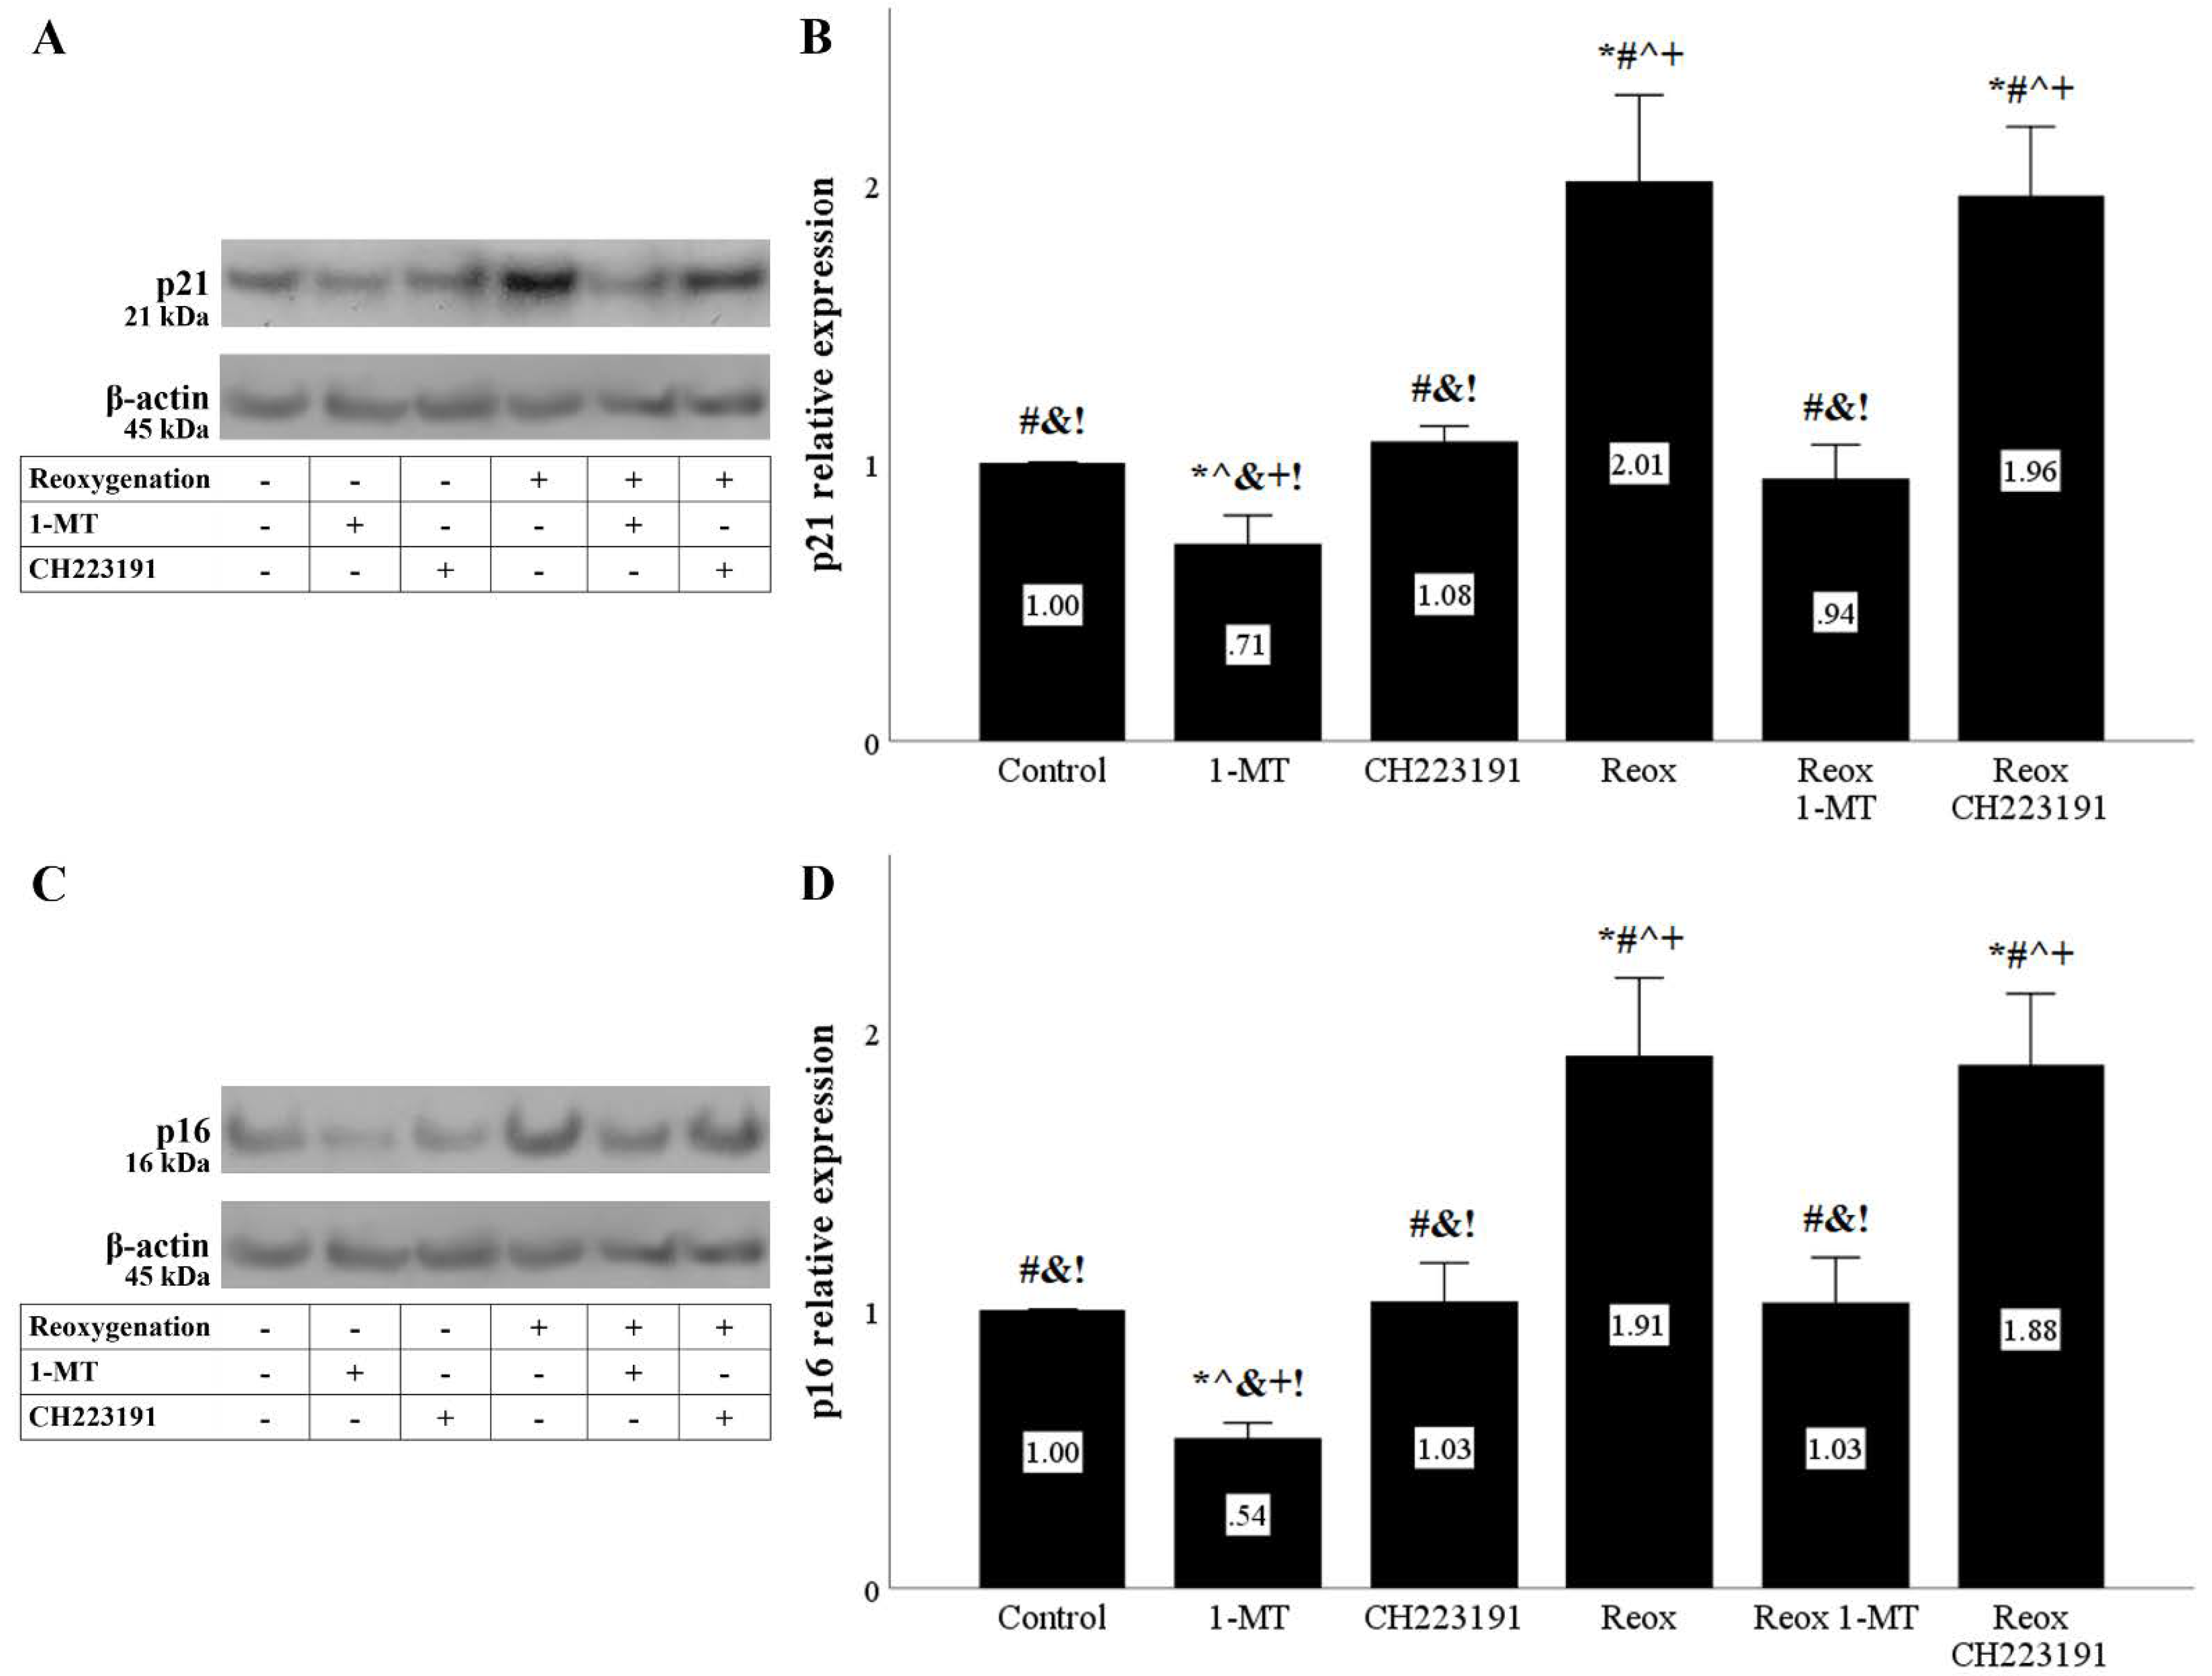
Figure 8.
Reoxygenation upregulates the cell-cycle inhibitors p21 and p16, whereas inhibition of IDO prevents their upregulation. Cells were cultured under anoxic conditions for 24 h and then subjected to 2 h of reoxygenation along with the indicating treatments. Reoxygenation increased p21 levels. 1-MT, but not CH223191, prevented p21 increase. A representative Western blot experiment is displayed in panel (A), whereas panel (B) depicts the cumulative results of four repeated experiments. Reoxygenation upregulated p16 levels. 1-MT, but not CH223191, prevented p16 upregulation. A representative Western blot experiment is displayed in panel (C), whereas panel (D) depicts the cumulative results of four repeated experiments. * p < 0.05 vs. Control, # p < 0.05 vs. Control with 1-MT, ^ p < 0.05 vs. Control with CH223191, & p < 0.05 vs. Reox, + p < 0.05 vs. Reox with 1-MT, ! p < 0.05 vs. Reox with CH223191. Error bars correspond to SEM. 1-MT, 1-DL-methyltryptophan; Reox, reoxygenation.
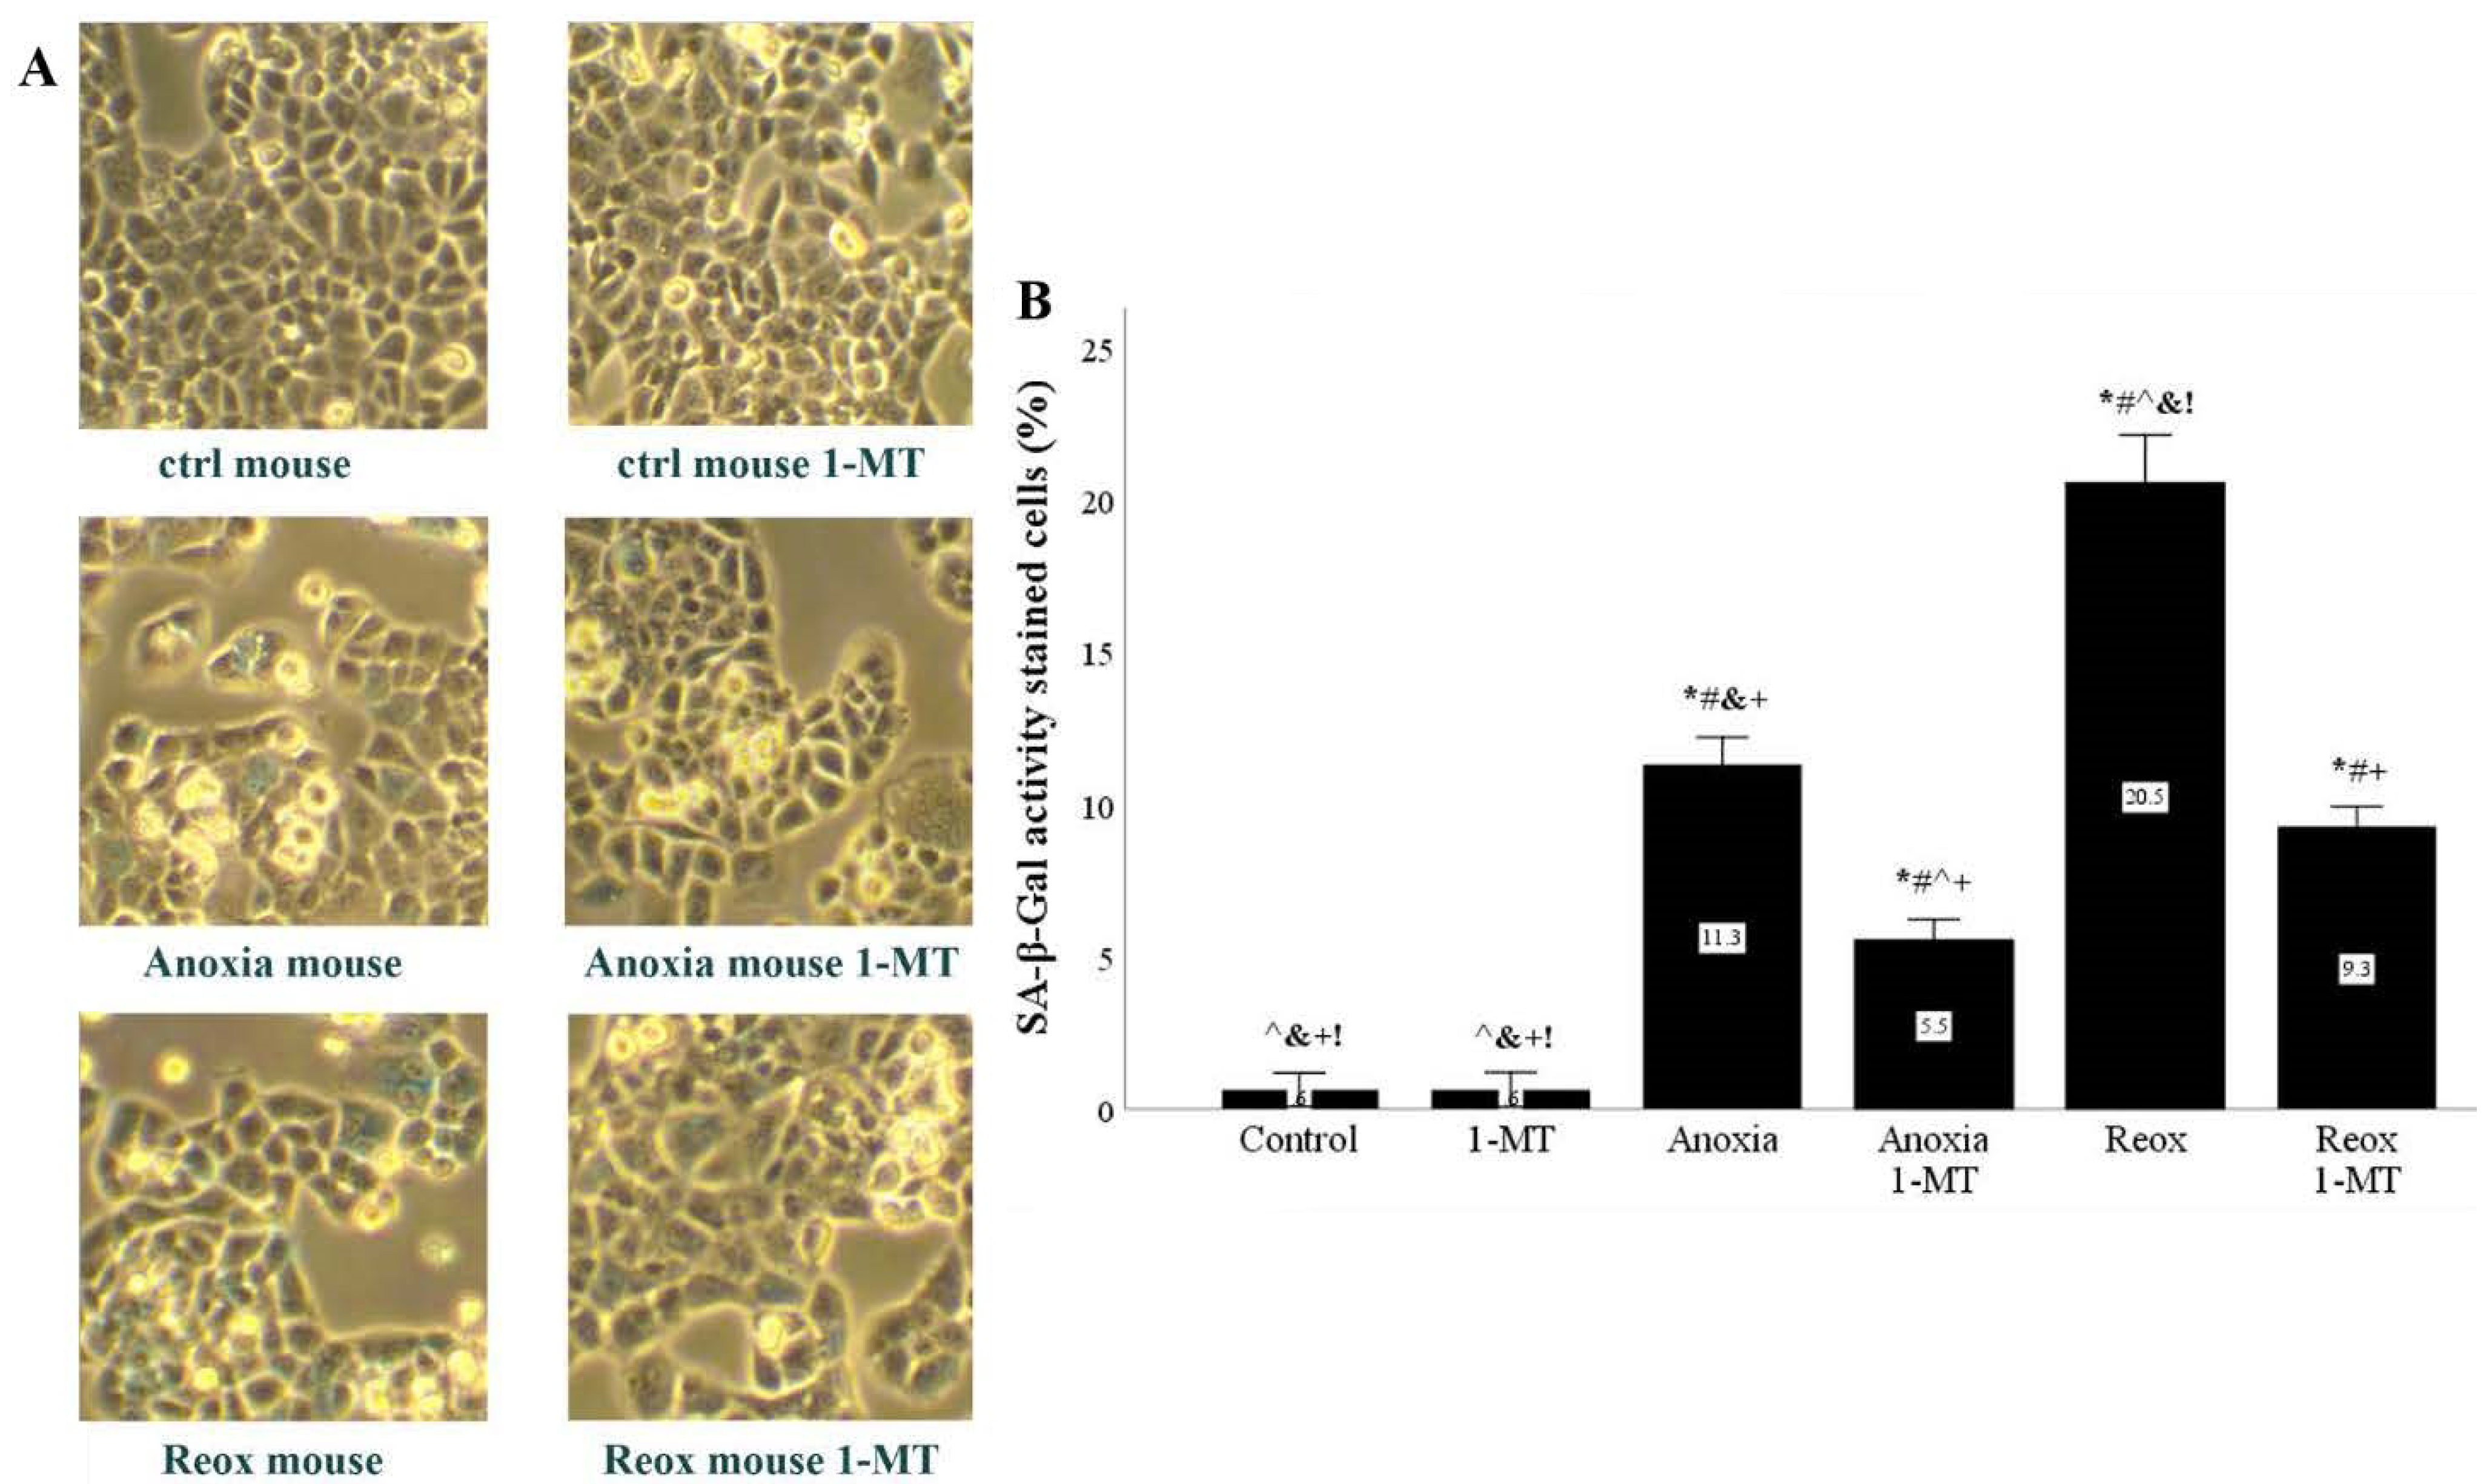
Figure 9.
In mouse RPTECS, IDO inhibition decreased anoxia- or reoxygenation-induced upregulation of SA-β-Gal activity. Mouse RPTECs were cultured under anoxic conditions for 24 h or subsequently subjected to reoxygenation for another 2 h. A representative of three independent experiments is depicted in panel (A). Anoxia upregulated SA-β-Gal activity, which was further upregulated by reoxygenation. In both cases, the IDO inhibitor 1-MT decreased SA-β-Gal activity (B). * p < 0.05 vs. Control, # p < 0.05 vs. Control with 1-MT, ^ p < 0.05 vs. Anoxia, & p < 0.05 vs. Anoxia with 1-MT, + p < 0.05 vs. Reox, ! p < 0.05 vs. Reox with 1-MT. Error bars correspond to SEM. 1-MT, 1-DL-methyltryptophan; Reox, reoxygenation; SA-β-Gal, senescence-associated β-galactosidase.
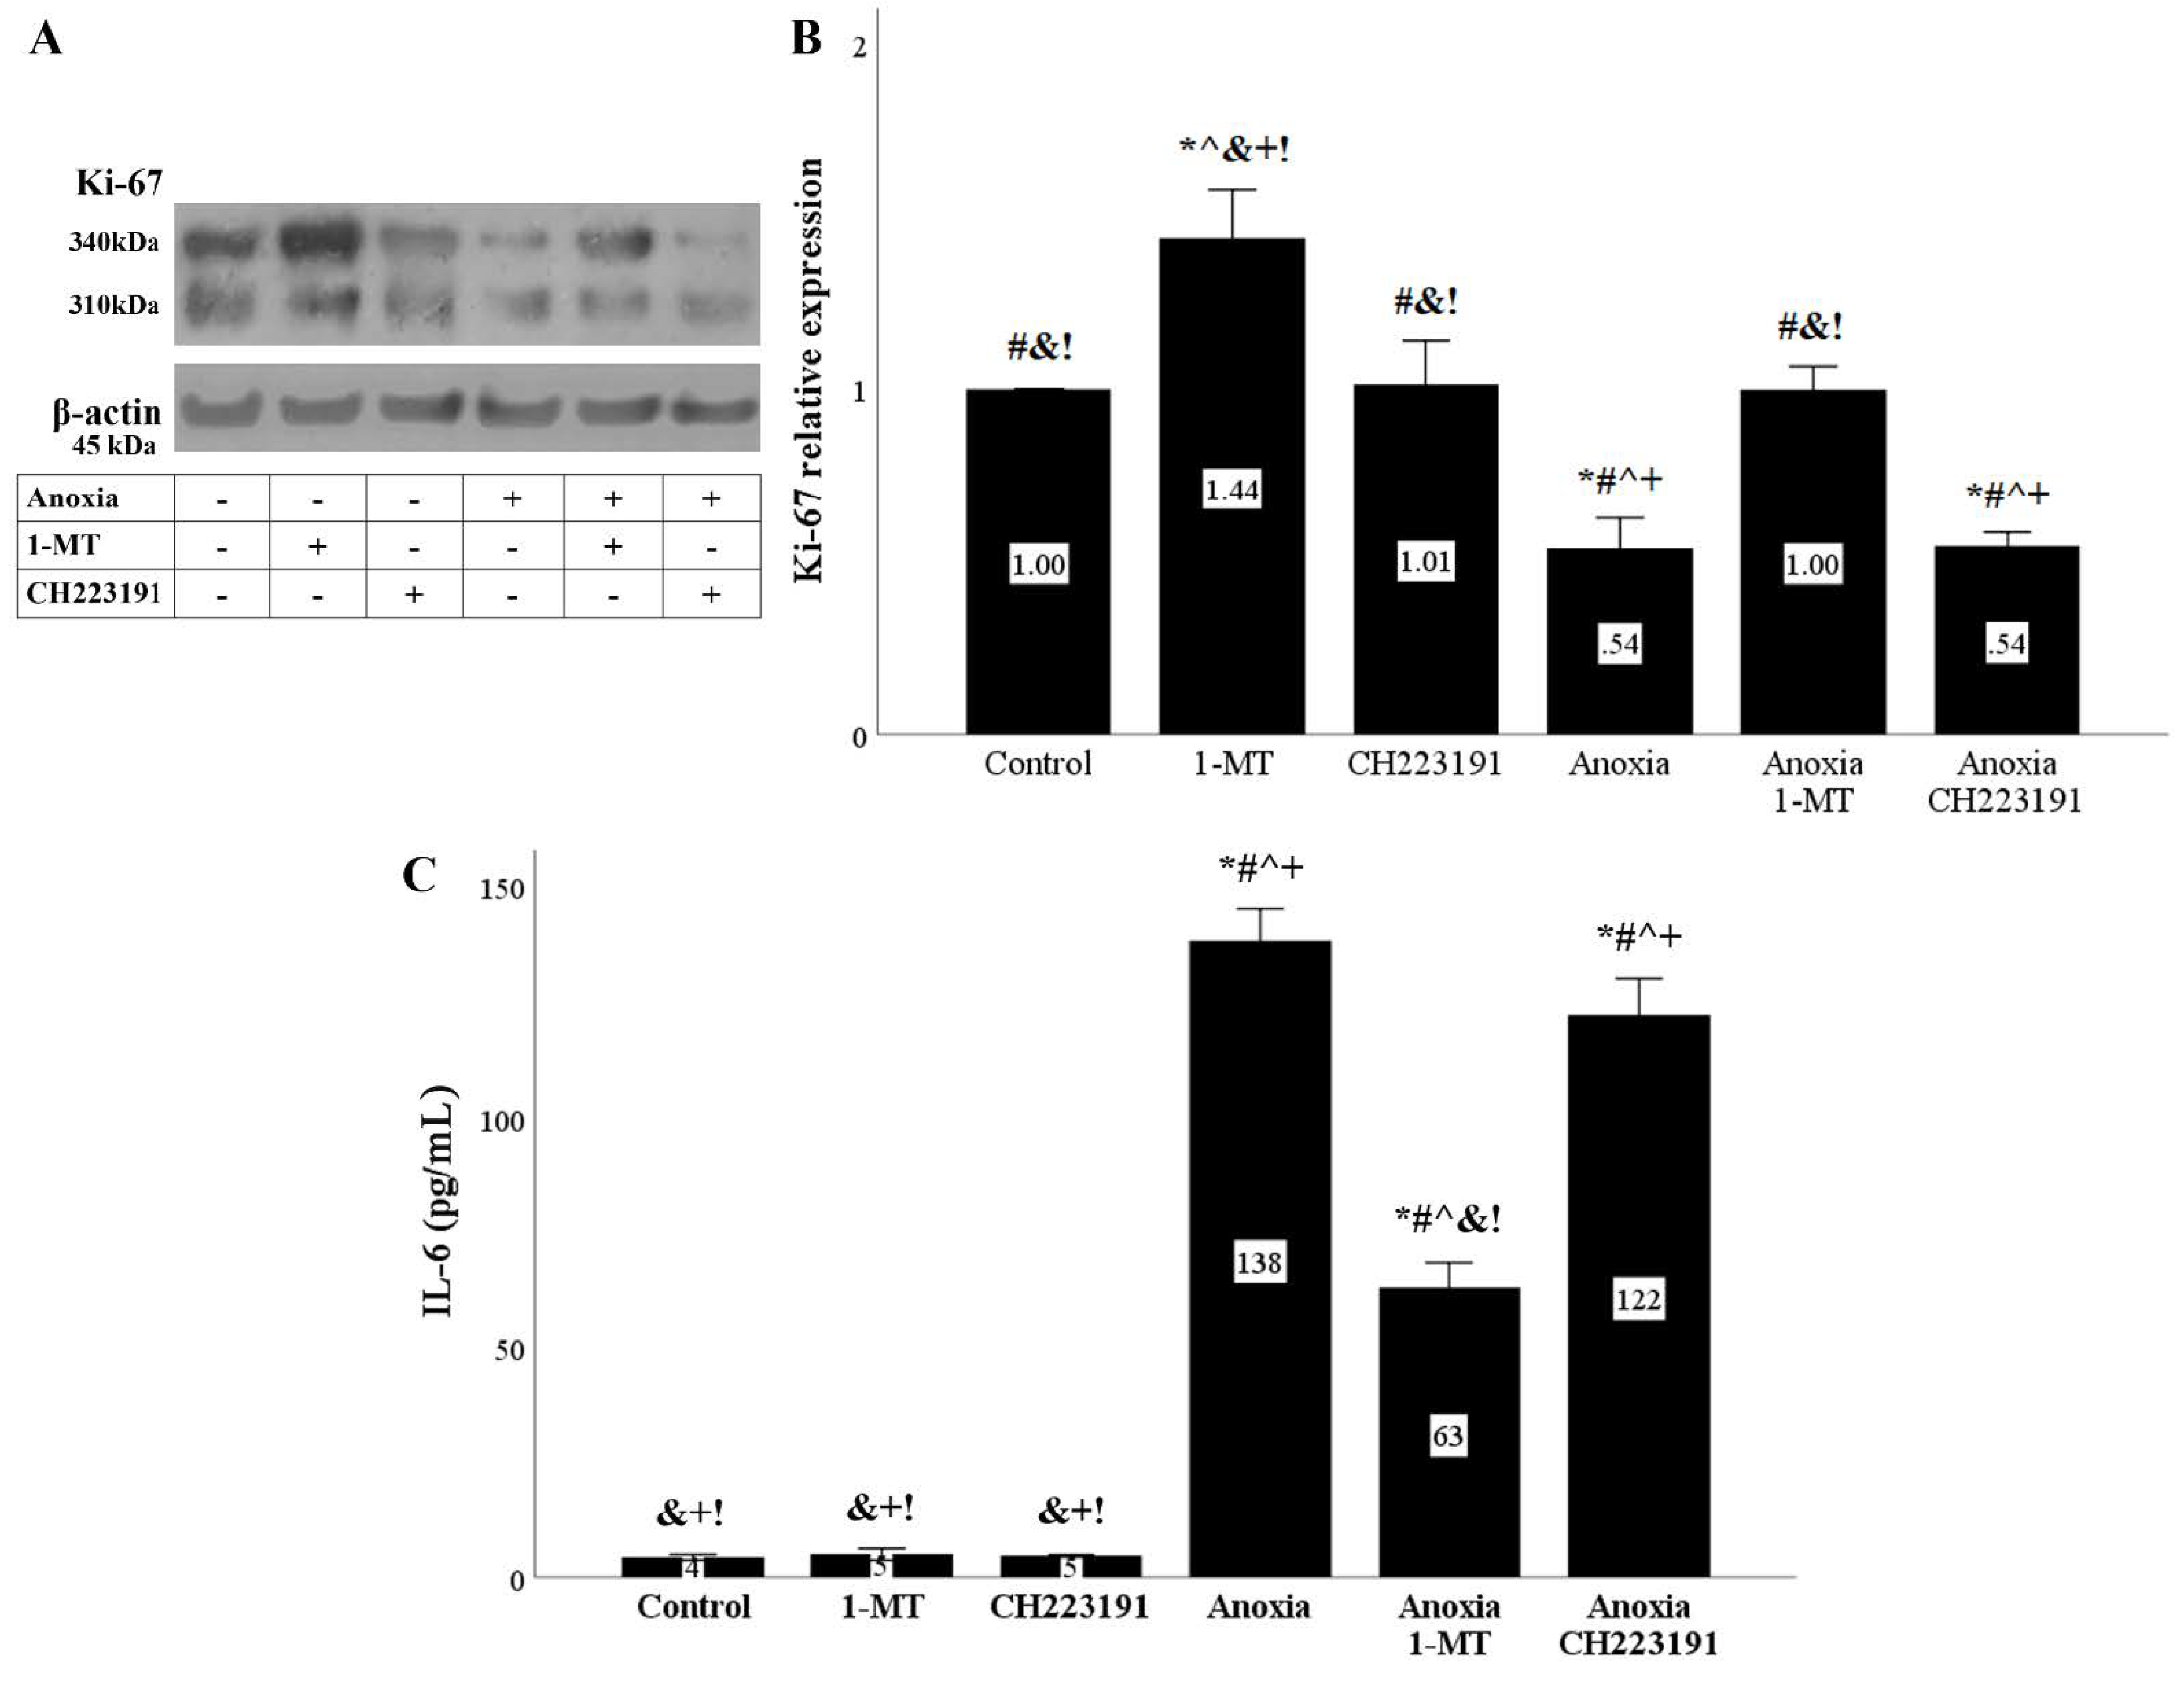
Figure 10.
Anoxia inhibits cell proliferation and induces IL-6 production in an IDO dependent manner. Cells were cultured under anoxic conditions for 24 h along with the indicating treatments. Anoxia decreased the levels of the cell proliferation marker Ki-67. The IDO inhibitor 1-MT restored Ki-67 levels, whereas the AhR inhibitor CH223191 left Ki-67 levels unaffected. A representative Western blot experiment is displayed in panel (A), whereas panel (B) depicts the cumulative results of four repeated experiments. Anoxia increased IL-6 concentration in the RPTECs culture supernatants. 1-MT decreased the anoxia-induced IL-6 production, whereas CH223191 did not affect IL-6 levels (C). Six such experiments were performed. * p < 0.05 vs. Control, # p < 0.05 vs. Control with 1-MT, ^ p < 0.05 vs. Control with CH223191, & p < 0.05 vs. Anoxia, + p < 0.05 vs. Anoxia with 1-MT, ! p < 0.05 vs. Anoxia with CH223191. Error bars correspond to SEM. 1-MT, 1-DL-methyltryptophan; IL-6, interleukin-6.
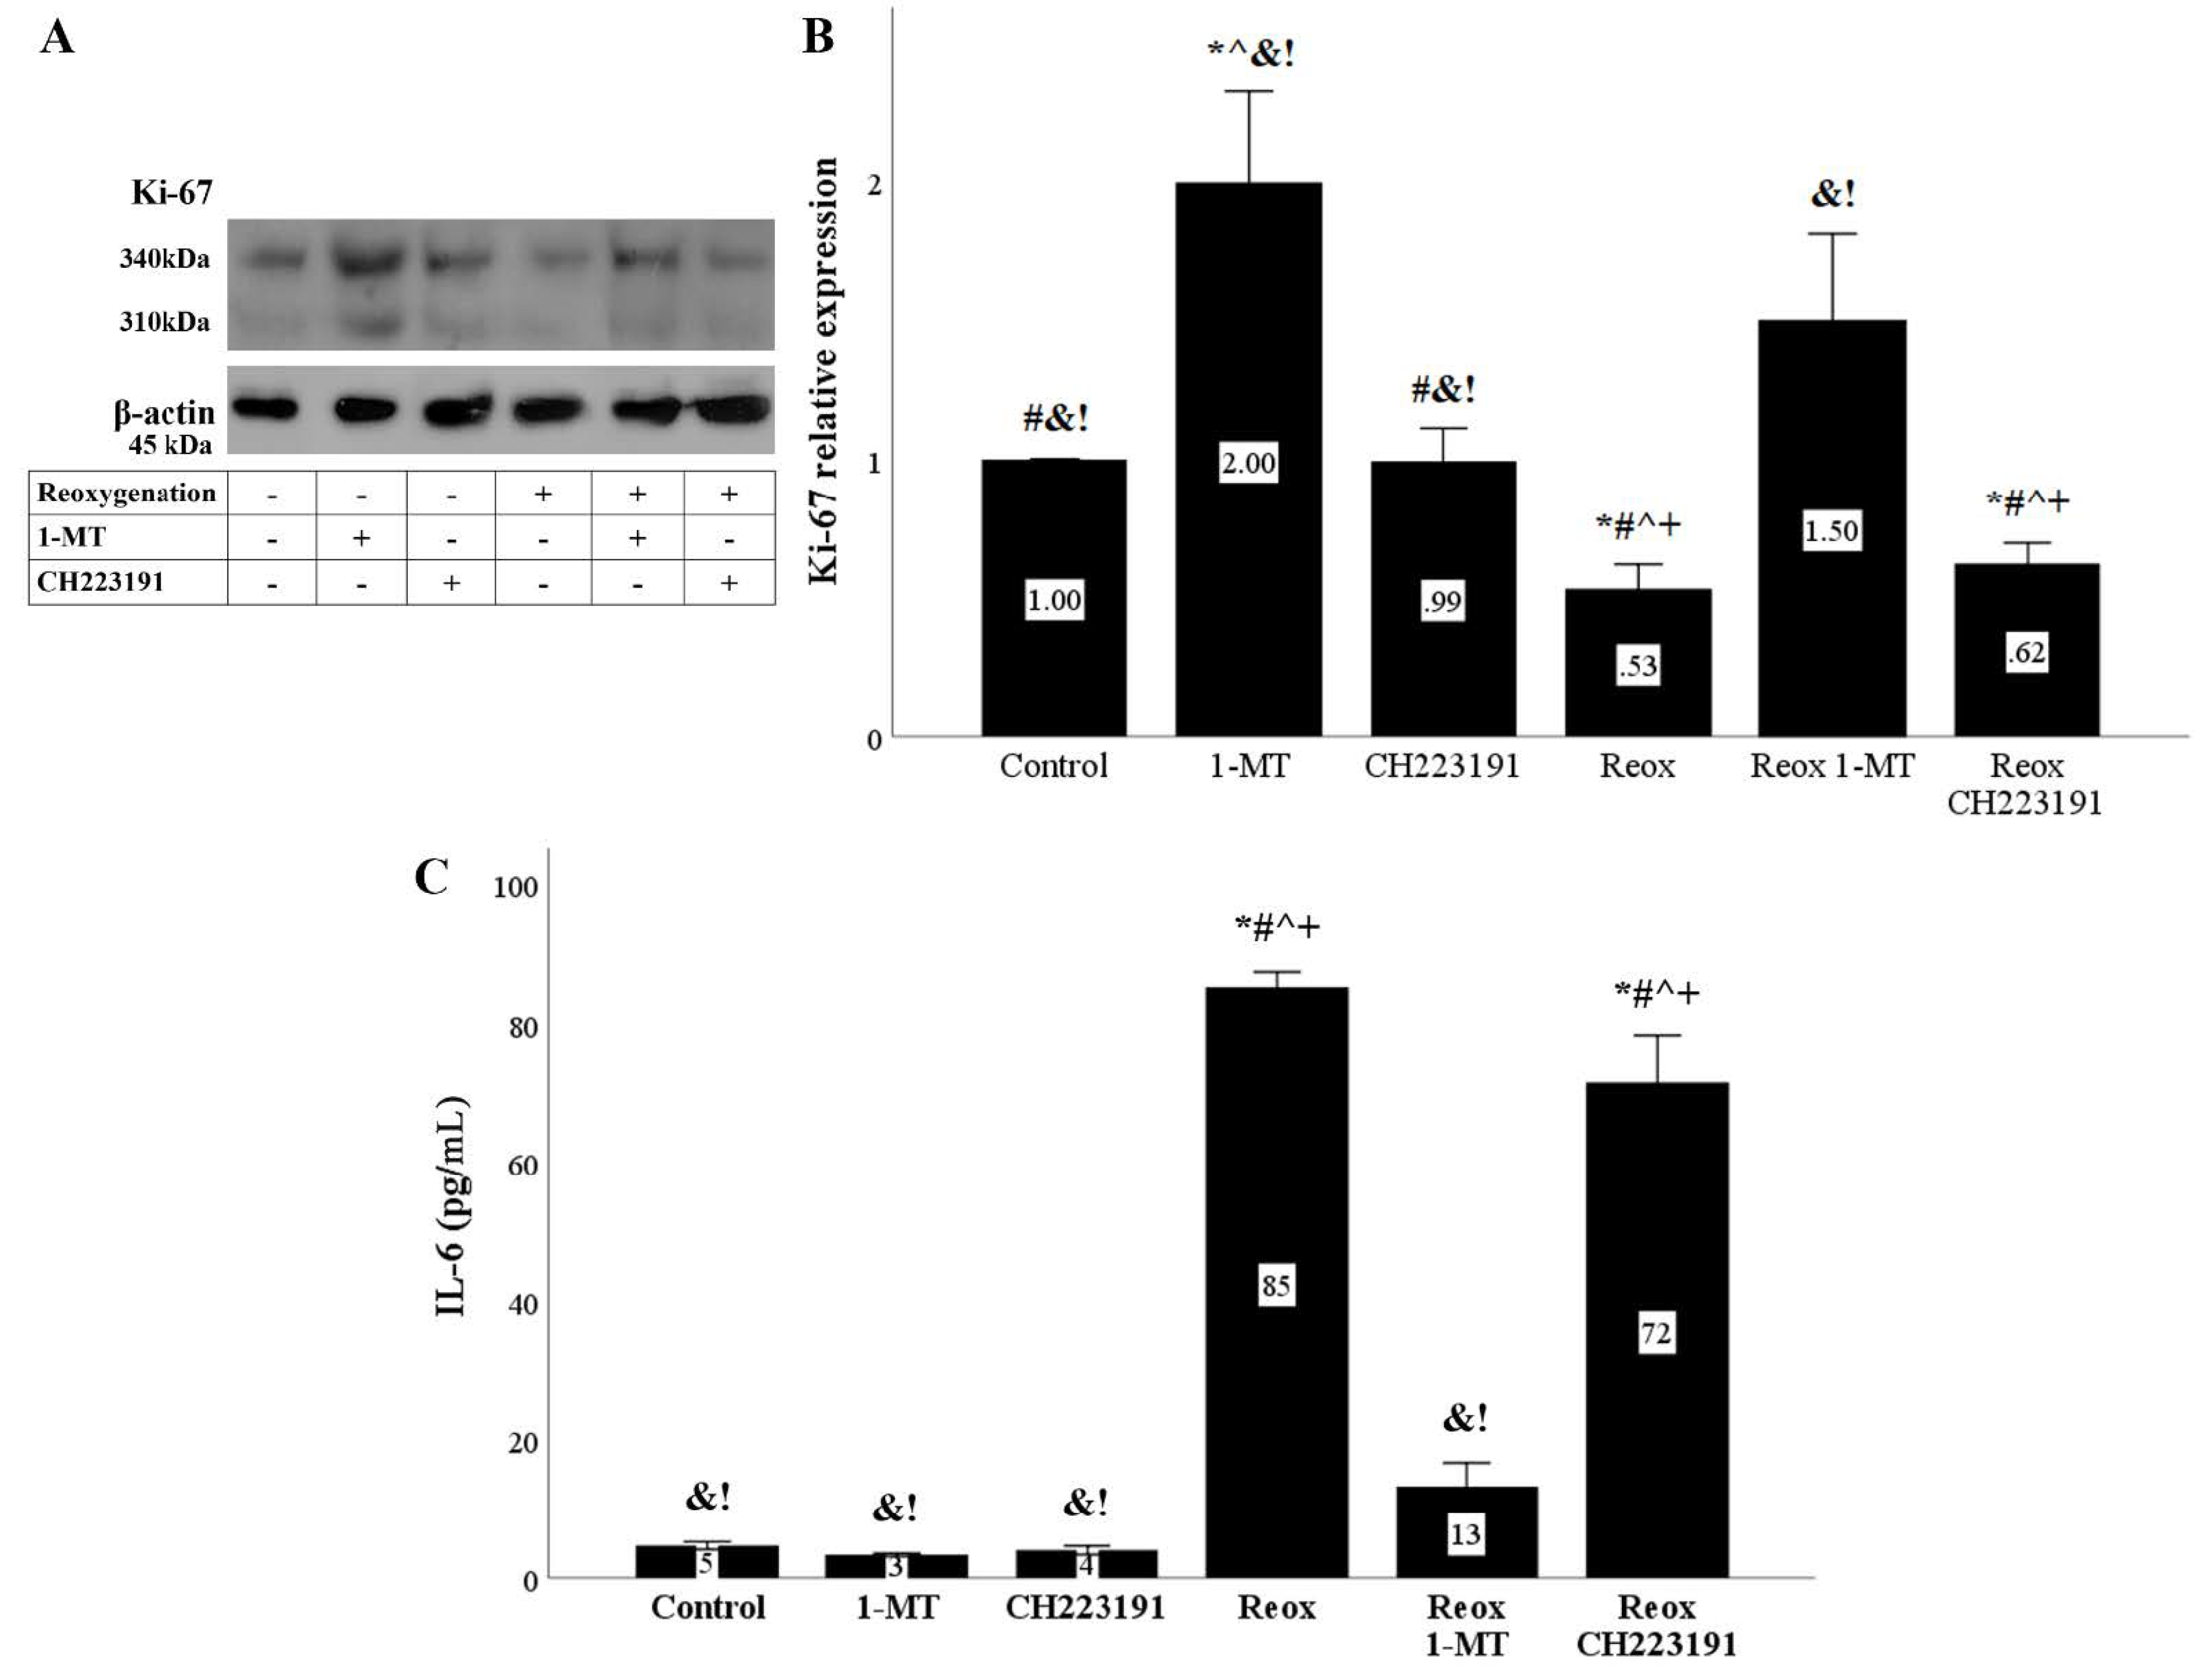
Figure 11.
Reoxygenation inhibits cell proliferation and induces IL-6 production in an IDO dependent manner. Cells were cultured under anoxic conditions for 24 h and then subjected to 2 h of reoxygenation along with the indicating treatments. Reoxygenation reduced the levels of the cell proliferation marker Ki-67. The IDO inhibitor 1-MT restored Ki-67 levels, whereas the AhR inhibitor CH223191 did not affect Ki-67. A representative Western blot experiment is displayed in panel (A), whereas panel (B) depicts the cumulative results of four repeated experiments. Reoxygenation increased IL-6 concentration in the RPTECs culture supernatants. 1-MT reduced the reoxygenation-induced IL-6 production, whereas CH223191 did not affect IL-6 levels (C). Six such experiments were performed. * p < 0.05 vs. Control, # p < 0.05 vs. Control with 1-MT, ^ p < 0.05 vs. Control with CH223191, & p < 0.05 vs. Reox, + p < 0.05 vs. Reox with 1-MT, ! p < 0.05 vs. Reox with CH223191. Error bars correspond to SEM. 1-MT, 1-DL-methyltryptophan; IL-6, interleukin-6; Reox, reoxygenation.

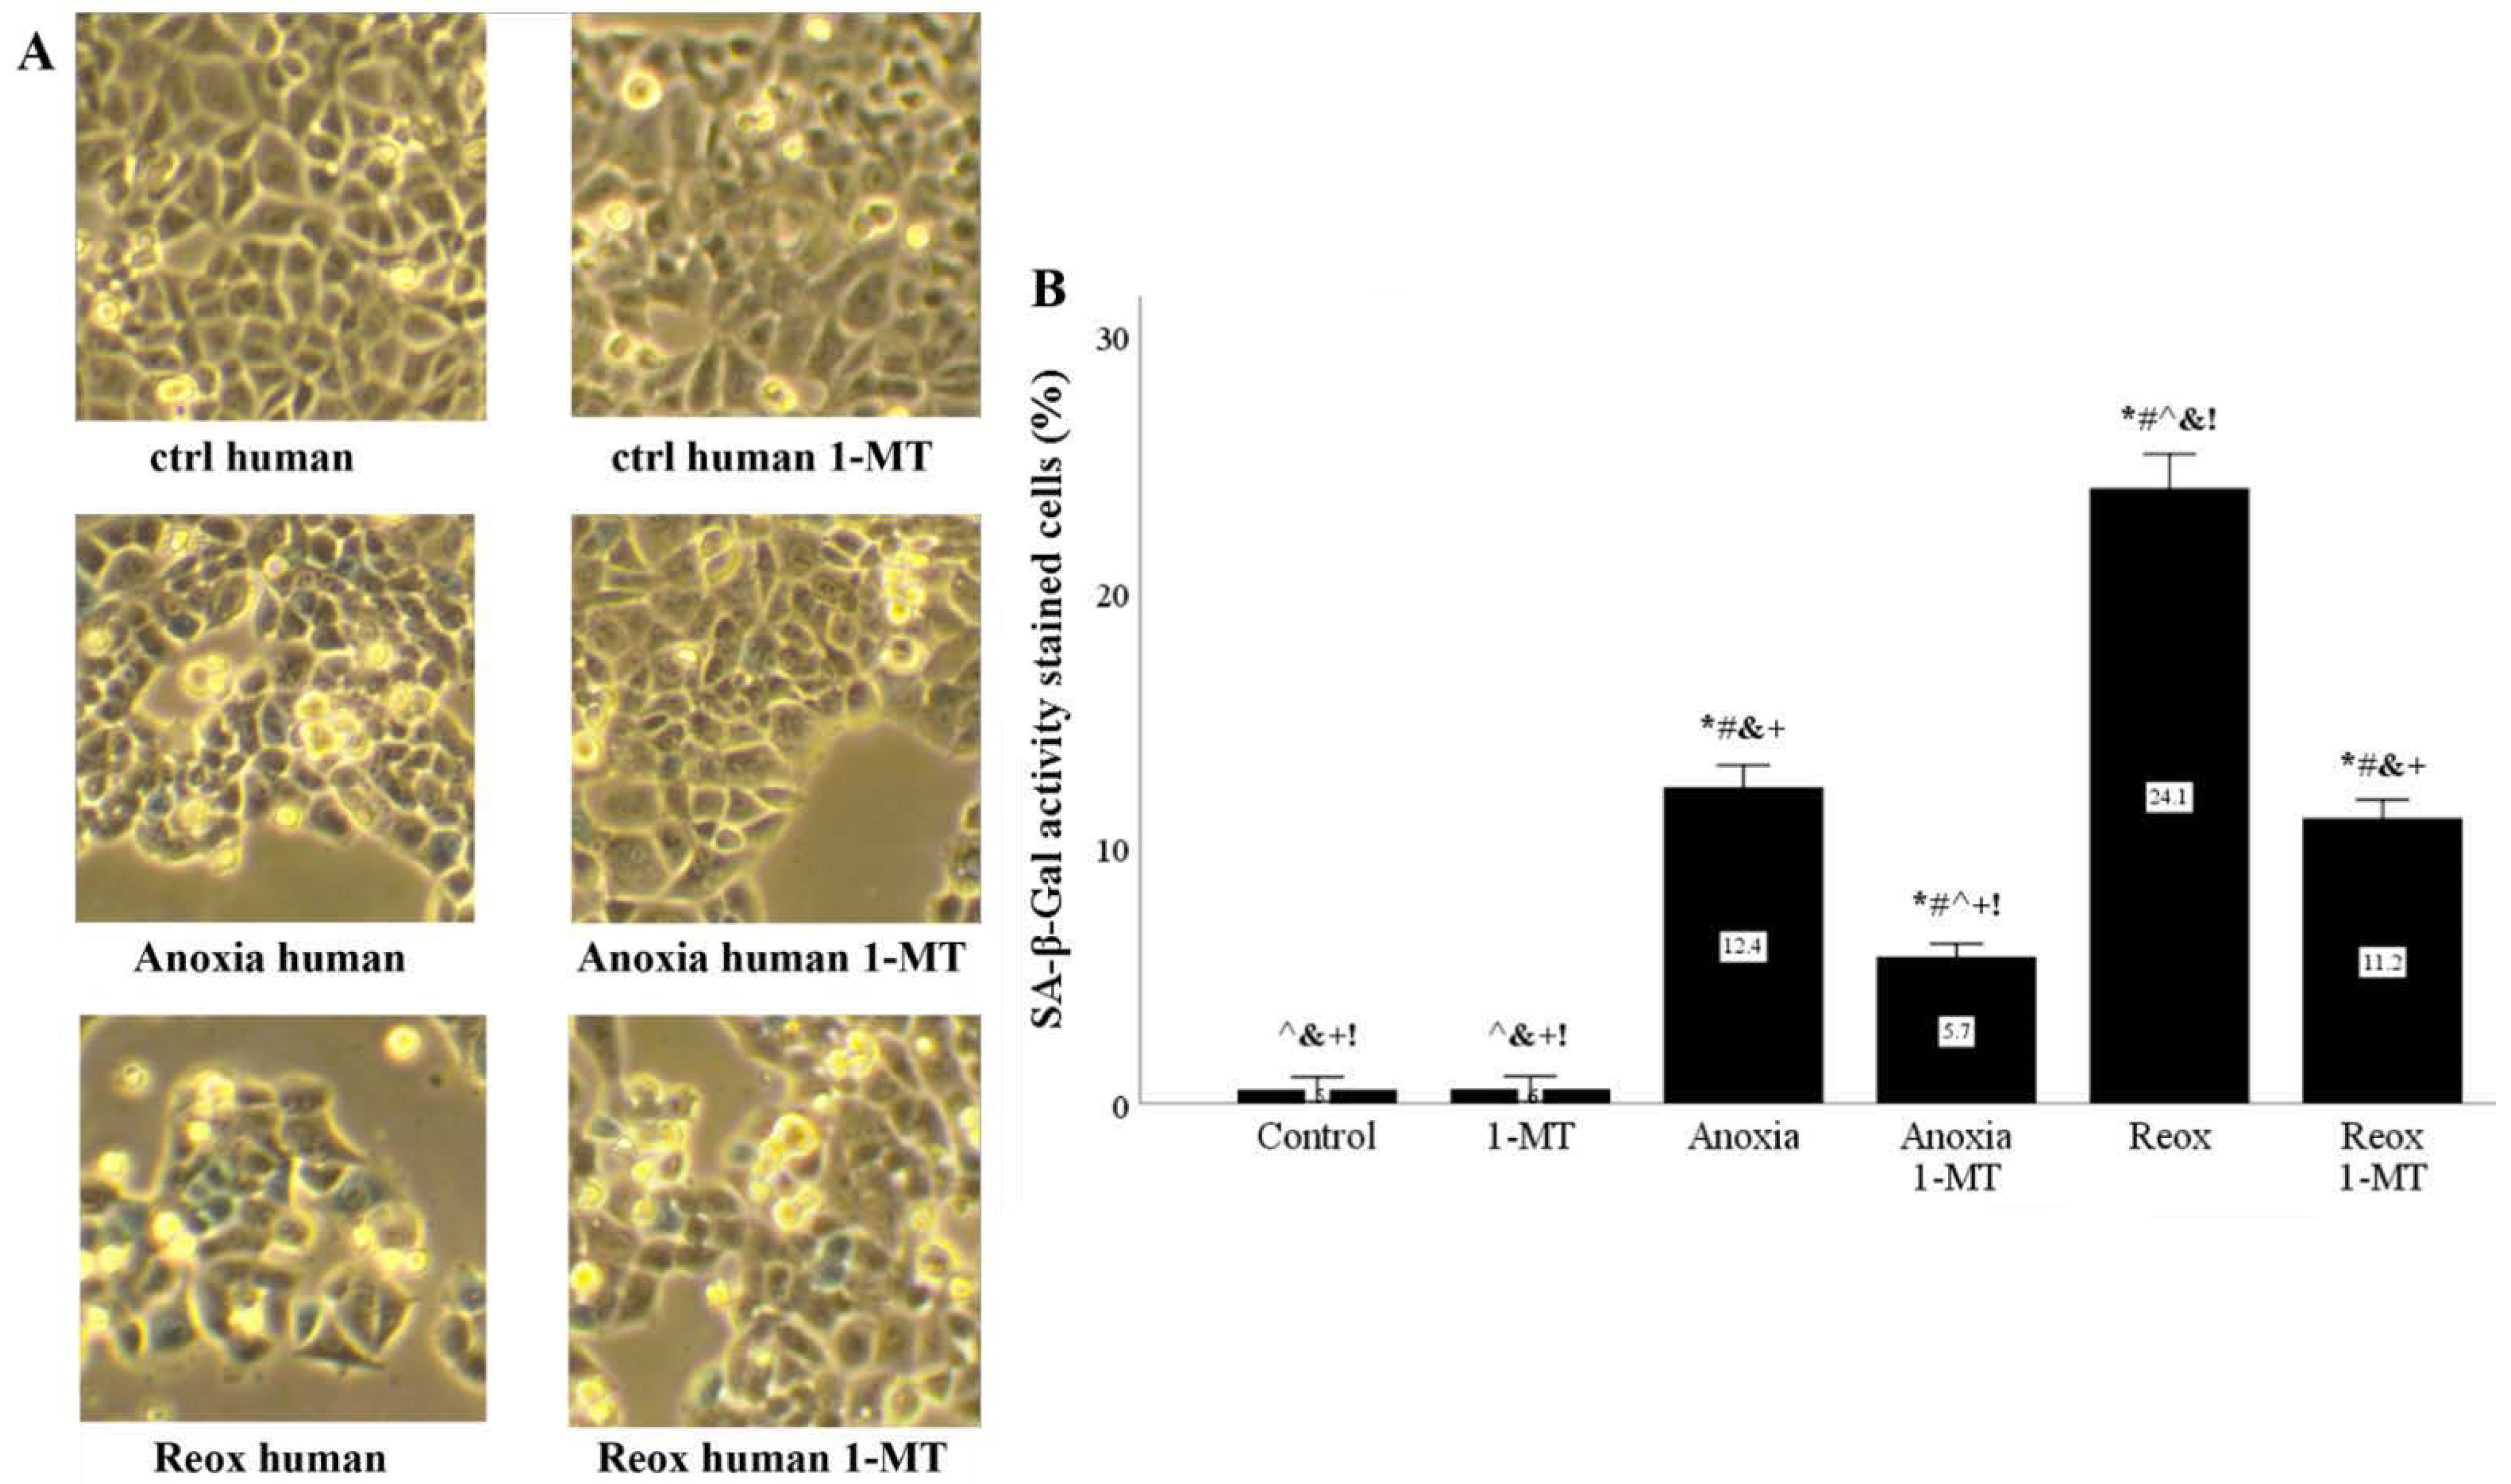
Figure 12.
In human RPTECS, inhibition of IDO reduces anoxia- or reoxygenation-induced upregulation of SA-β-Gal activity. Primary human RPTECs were cultured under anoxia for 2 h or subjected to reoxygenation for another 24 h. A representative of three independent experiments is depicted in panel (A). Anoxia increased SA-β-Gal activity, which was further increased by reoxygenation. The IDO inhibitor 1-MT reduced both anoxia and reoxygenation-induced upregulation of SA-β-Gal activity (B). * p < 0.05 vs. Control, # p < 0.05 vs. Control with 1-MT, ^ p < 0.05 vs. Anoxia, & p < 0.05 vs. Anoxia with 1-MT, + p < 0.05 vs. Reox, ! p < 0.05 vs. Reox with 1-MT. Error bars correspond to SEM. 1-MT, 1-DL-methyltryptophan; Reox, reoxygenation; SA-β-Gal, senescence-associated β-galactosidase.


 ,
, 


