
Green Brand Equity—Empirical Experience from a Systematic Literature Review


Abstract
1. Introduction
2. Methodology
2.1. Study Design
- What are the main factors that determine GBE?
- How often do traditional elements, such as brand loyalty, perceived quality, brand associations, brand awareness, and brand knowledge, appear in empirical research on GBE?
- What specific factors contribute to GBE?
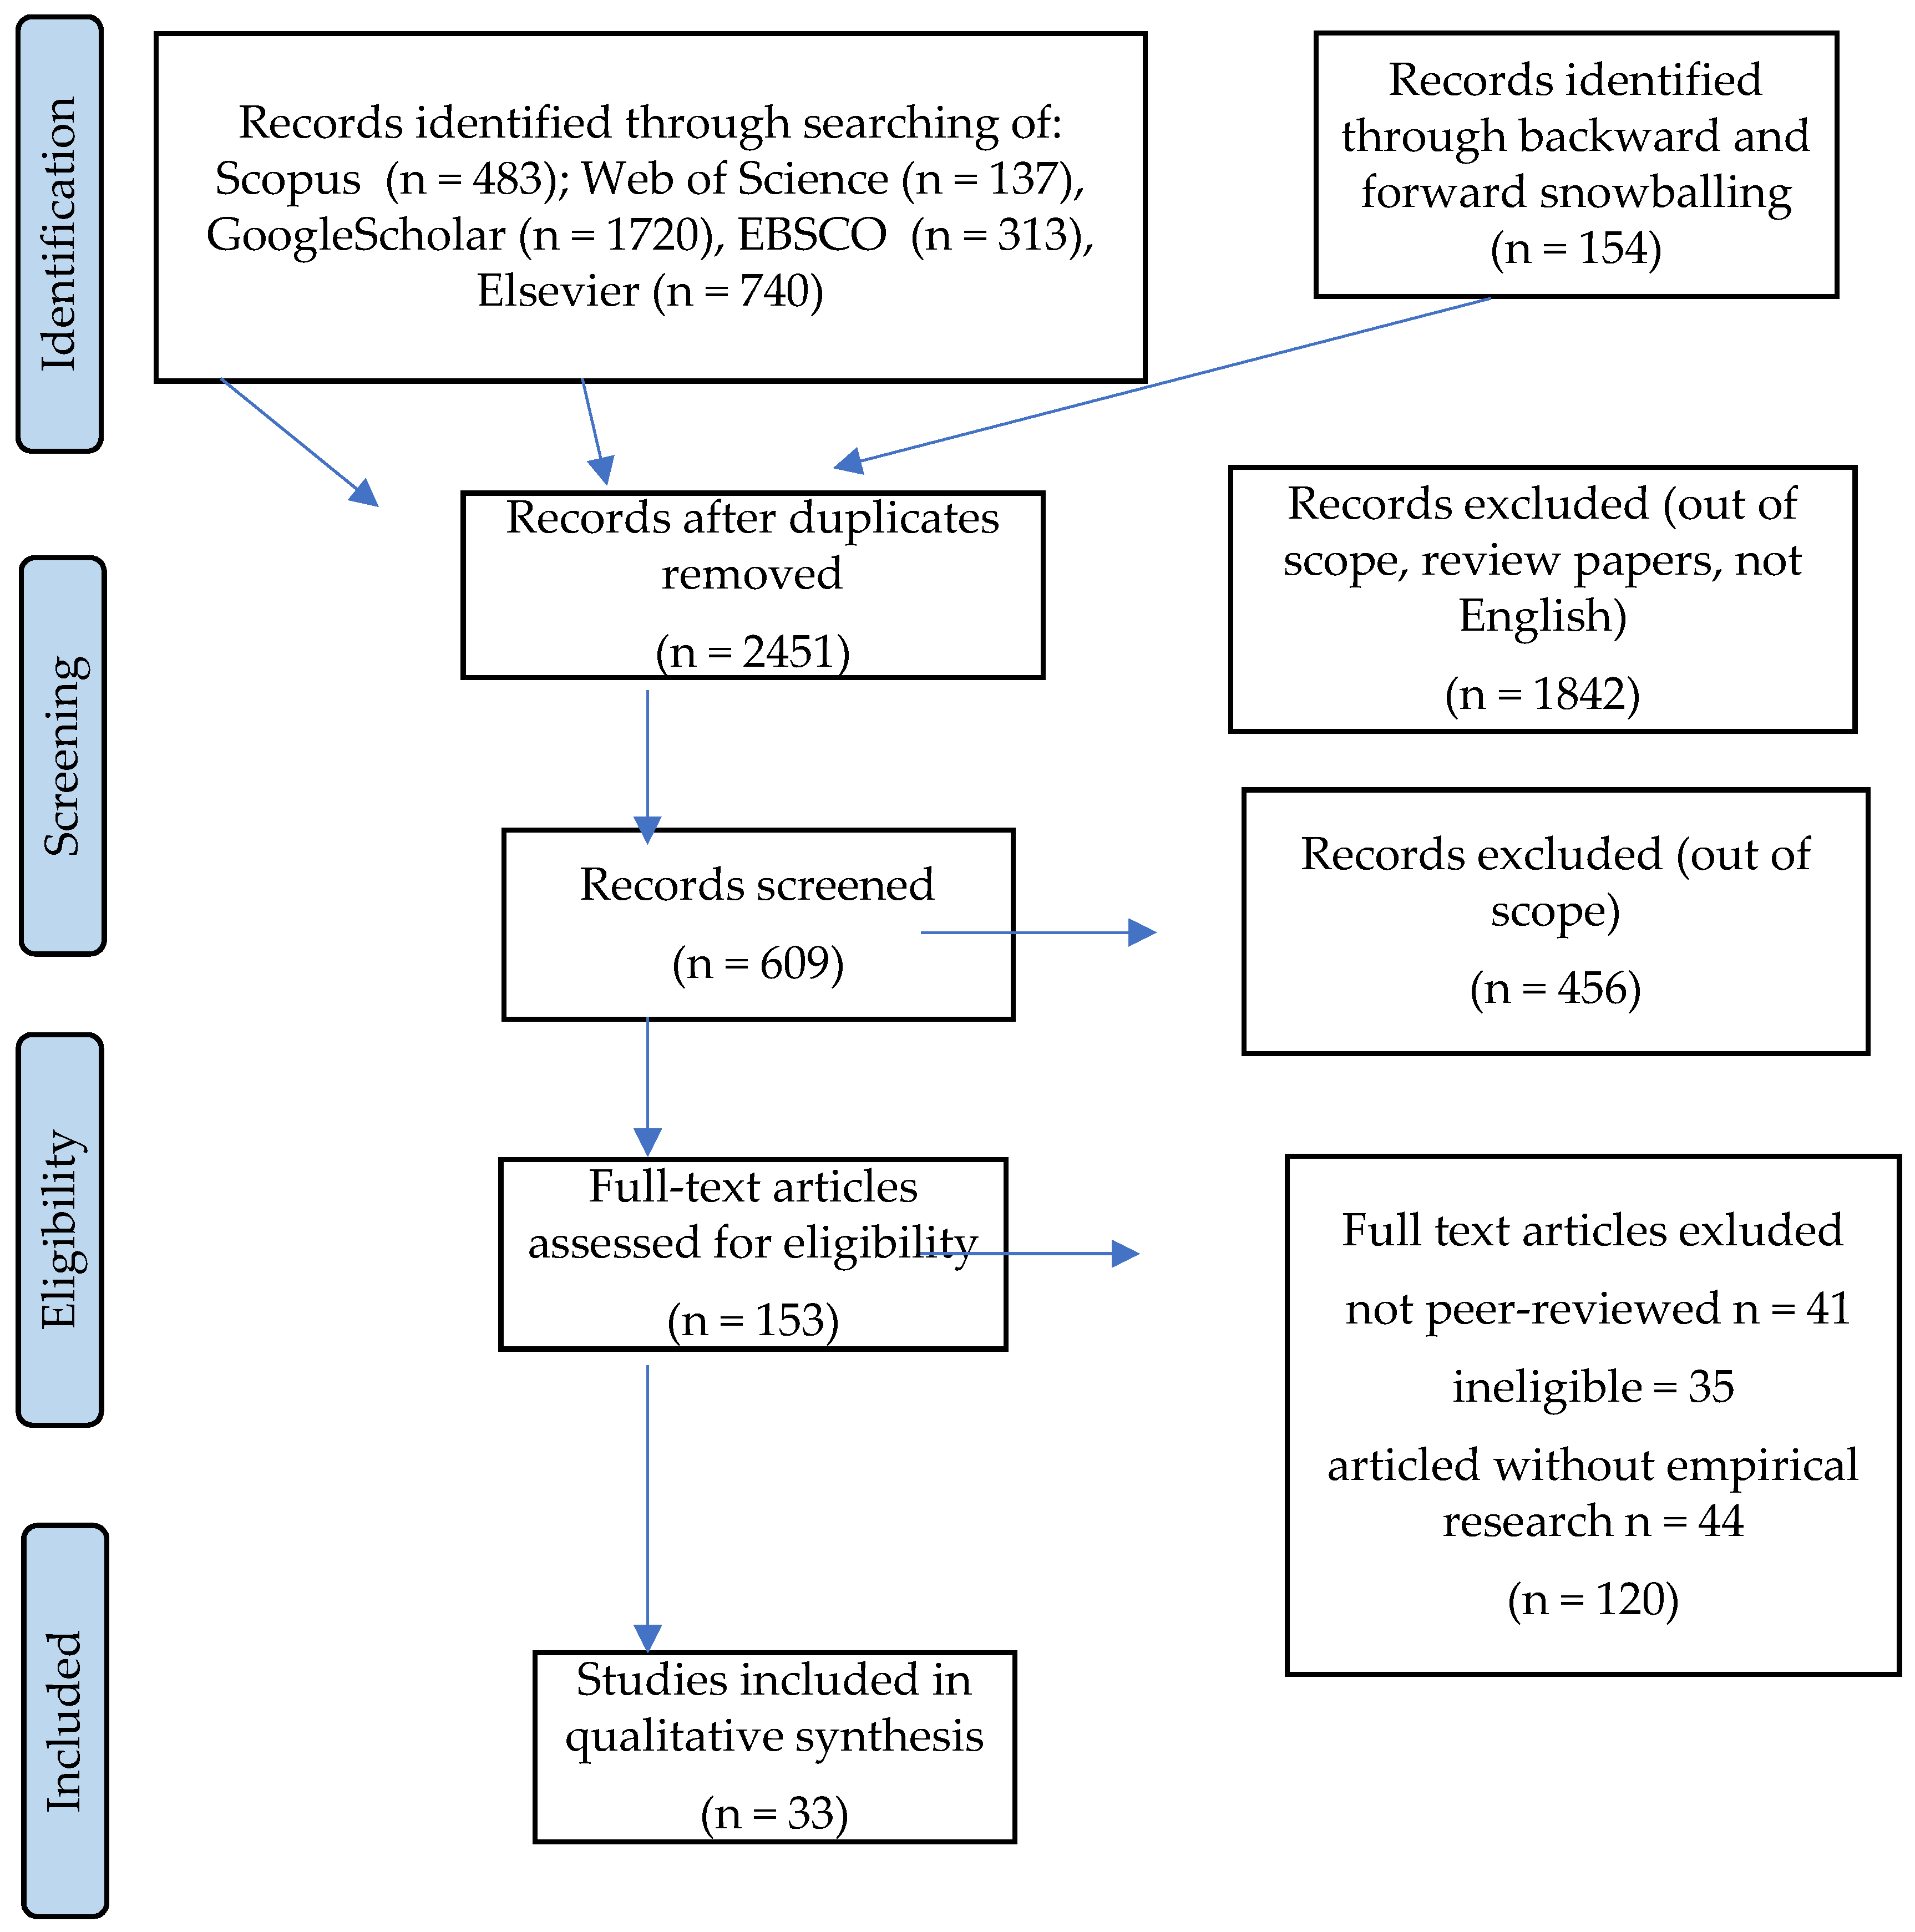
2.2. Planning the SLR
- Scopus: TITLE–ABS–KEY (green AND brand AND equity), and (TITLE–ABS–KEY (brand AND equity) AND green));
- Web of Sciences: ALL FIELDS: (green) AND ALL FIELDS: (brand) AND ALL FIELDS: (equity);
- Google Scholar: allintitle: green brand equity; with the statement: “green brand equity”; allintitle: green brand equity; with the statement: “brand equity” and “green”;
- EBSCO: ALL FIELDS “green brand equity”; SU green AND SU brand AND SU equity; TI green AND TI brand AND TI equity SU green brand AND SU equity; TI green brand AND TI equity; SU green brand equity, TI green brand equity;
- Elsevier: title, abstract, keywords: “green brand equity” or “brand equity” and “green”, articles with terms: “green brand equity”; “brand equity” and “green”.
2.3. Conducting the SLR
- -
- Empirical studies;
- -
- Peer-reviewed papers;
- -
- English language;
- -
- Any publication time.
- -
- Studies with theoretical models;
- -
- Studies describing BE not related to GBE;
- -
- Ph.D. thesis and short reports;
- -
- Workshop papers;
- -
- Work-in-progress papers and editorials;
- -
- Practice guidelines;
- -
- Book chapters and reviews;
- -
- Conference publications, including proceedings, posters, and abstracts.
3. Results
3.1. General Information

| Article | Author, Year | Country of Study | Product Category/Brands | Research Method | Sample Size |
|---|---|---|---|---|---|
| [114] 30 | Kazmi, Shahbaz, Mubarik, Ahmed, 2021 | China, Pakistan | Green brands | Survey | 331 (400 distributed questionnaires) |
| [105] 1 | Ha, 2020 | Vietnam | Green products and green brands | Survey | 302 (400 distributed questionnaires) |
| [106] 2 | Liu, Tsaur, 2020 | Taiwan | Smartphones | Survey | 332 |
| [25] 3 | Javed, Yang, Gilal, Gilal, 2020 | China | Clothing | Survey | 316 |
| [24] 4 | Tsai, Lin, Zheng, Chen, Chen, Su, 2020 | Taiwan | Coffee | Survey | 60 |
| [77] 5 | Ishaq, 2020 | Italy, Pakistan | Telecommunication, home appliances | Survey | 980 |
| [107] 31 | Sozer, 2020 | Istanbul, Turkey | Personal care and cosmetic products | Survey | 450 questionnaires (412 accepted) |
| [28] 6 | Khandelwal, Kulshreshtha, Tripathi, 2019 | India | Mall’s customers | Survey | 480 |
| [108] 7 | Gupta, Dash, Mihra, 2019 | India | Tourism | Survey | 208 (first dataset) 315 (second dataset) |
| [109] 8 | Ho, Wu, Nguyen, Chen, 2019 | Taiwan | Tissues | Survey | 236 |
| [29] 9 | Lee, Chen, 2019 | Taiwan | Cosmetics | Survey | 868 723 accepted |
| [79] 10 | Li, Li, Sun, 2019 | China | Flooring products | Survey | 700 490 |
| [78] 11 | Suryawan, 2019 | Indonesia | Mineral Water | Survey | 180 |
| [30] 12 | Akturan, 2018 | Turkey | Refrigerator—high-involvement product Tissue paper—low-involvement product | Survey | 500 |
| [31] 13 | Avcılar, Demirgünes, 2017 | Turkey | Gas stations | Survey | 400 consumers |
| [32] 14 | Butt, Mushtaq, Afzal, Khong, Ong, Ng, 2017 | Pakistan | Green products/green brands | Survey | 199 students |
| [110] 28 | Deniz, Onder, 2017 | Turkey | White goods | survey | 381 (400 distributed questionnaires) |
| [33] 15 | Esmaeili, Sepahvand, Rostamzadeh, Joksiene, Autucheviciene, 2017 | Iran | Supermarket customers | Survey | 384 |
| [111] 33 | Vijay MallikRaj, Karthikeyan, Sekar 2017 | Madurai, India | Green products | Survey | 182 |
| [34] 16 | Bekk, Sporrle, Hedjasie, Kerschreiter, 2016 | Germany | Services | Survey | 358 |
| [26] 17 | Amegbe, Hanu, 2016 | Ghana | SMEs | Survey | 298 owners 408 customers |
| [117] 29 | Dolatabadi, Tabaeeian, Tavakoli, 2016 | Iran | Green products | Survey | 267 |
| [112] 18 | Chen, Lee 2015 | Taiwan | Coffee | Survey | 920 |
| [118] 19 | Delafrooz, Goli 2015 | Iran | Low-power electronic and electric products | Survey | 384 |
| [115] 20 | Konuk, 2015 | Turkey, Finland, Pakistan | Green products | Survey | 314 (500 distributed questionnaires) |
| [113] 21 | Chang, Chen, 2014 | Taiwan | Information and electronic products | Survey | 248 |
| [121] 22 | Pechyiam, Jaroenwanit, 2014 | Thailand | Electronic appliances with environmental labels | Survey | 1000 questionnaires |
| [120] 23 | Ng, Butt, Khong, Ong, 2014 | Malaysia | Electric and electronic products | survey | 236 (300 distributed questionnaires) |
| [119] 32 | Namkung, Jang 2013 | US | Green restaurants: food green practices, environmental focused green practices | Scenario-based experiment Web-based survey | 512 responses |
| [122] 24 | Kang, Hur, 2012 | South Korea | Electronic products | survey | 400 questionnaires |
| [7] 25 | Mourad, 2012 | Egypt | Telecom industry | Survey | 302 questionnaires |
| [76] 26 | Chen, 2010 | Taiwan | Information and electronic products | survey | 254 (650 distributed questionnaires) |
| [116] 27 | Adnan, Naveed, Ahmad, Hamid, 2006 | Pakistan | Green electronic/electric products | survey | 316 questionnaires (430 distributed) |

3.2. Research Specifications
3.3. Comparison and Summary
4. Discussion
4.1. General Outcomes
4.2. Practical Implications Related to GBE
5. Conclusions
Author Contributions
Funding
Institutional Review Board Statement
Informed Consent Statement
Data Availability Statement
Conflicts of Interest
References
- Sdrolia, E.; Zarotiadis, G. A Comprehensive Review for Green Product Term: From Definition to Evaluation. J. Econ. Surv. 2019, 33, 150–178. [Google Scholar] [CrossRef]
- Henion, K. Ecological Marketing; American Marketing Association: Chicago, IL, USA, 1976; ISBN 9780877570769. [Google Scholar]
- Peattie, K.; Crane, A. Green marketing: Legend, myth, farce or prophesy? Qual. Mark. Res. Int. J. 2005, 8, 357–370. [Google Scholar] [CrossRef]
- Charter, M.; Polonsky, M.J. Greener Marketing: A Global Perspective on Greening Marketing Practice; Routledge: London, UK, 1999; p. 432. [Google Scholar]
- Dangelico, R.M.; Vocalelli, D. “Green Marketing”: An analysis of definitions, strategy steps, and tools through a systematic review of the literature. J. Clean. Prod. 2017, 165, 1263–1279. [Google Scholar] [CrossRef]
- Haque, K.M.R. Exploring Price Sensitivity of a Green Brand: A Consumers’ Perspective World Review of Business Research Exploring Price Sensitivity of a Green Brand: A Consumers’ Perspective. World Rev. Bus. Res. 2011, 1, 84–97. [Google Scholar]
- Mourad, M.; Ahmed, Y.S.E. Perception of green brand in an emerging innovative market. Eur. J. Innov. Manag. 2012, 15, 514–537. [Google Scholar] [CrossRef]
- Hafezi, M.; Zolfagharinia, H. Green product development and environmental performance: Investigating the role of government regulations. Int. J. Prod. Econ. 2018, 204, 395–410. [Google Scholar] [CrossRef]
- Fraccascia, L.; Giannoccaro, I.; Albino, V. Green product development: What does the country product space imply? J. Clean. Prod. 2018, 170, 1076–1088. [Google Scholar] [CrossRef]
- Shamdasani, P.; Chon-Lin, G.O.; Richmond, D. Exploring Green Consumers in an Oriental Culture: Role of Personal and Marketing Mix Factors. ACR North Am. Adv. 1993, 20, 488–493. [Google Scholar]
- Mohd Suki, N. Customer environmental satisfaction and loyalty in the consumption of green products. Int. J. Sustain. Dev. World Ecol. 2015, 22, 292–301. [Google Scholar] [CrossRef]
- Nuttavuthisit, K.; Thøgersen, J. The Importance of Consumer Trust for the Emergence of a Market for Green Products: The Case of Organic Food. J. Bus. Ethics 2017, 140, 323–337. [Google Scholar] [CrossRef]
- Baker, M.J. The Marketing Book; Routledge: London, UK, 2012; pp. 1–836. [Google Scholar]
- Tomasin, L.; Pereira, G.M.; Borchardt, M.; Sellitto, M.A. How can the sales of green products in the Brazilian supply chain be increased? J. Clean. Prod. 2013, 47, 274–282. [Google Scholar] [CrossRef]
- De Medeiros, J.F.; Ribeiro, J.L.D.; Cortimiglia, M.N. Success factors for environmentally sustainable product innovation: A systematic literature review. J. Clean. Prod. 2014, 65, 76–86. [Google Scholar] [CrossRef]
- Haws, K.L.; Winterich, K.P.; Naylor, R.W. Seeing the world through GREEN-tinted glasses: Green consumption values and responses to environmentally friendly products. J. Consum. Psychol. 2014, 24, 336–354. [Google Scholar] [CrossRef]
- Canciglieri Junior, O.; Mattioda, R.; Teixeira Fernandes, P.; Pereira Detro, S.; Adami Mattioda, R.; Luis Casela, J. Principle of Triple Bottom Line in the Integrated Development of Sustainable Products Grupo BIM PUCPR View project Method for Evaluation and Translation the Cognitive and Affective Experience View project Principle of Triple Bottom Line in the Integrated. Chem. Eng. Trans. 2013, 35. [Google Scholar] [CrossRef]
- Seuring, S.; Müller, M. From a literature review to a conceptual framework for sustainable supply chain management. J. Clean. Prod. 2008, 16, 1699–1710. [Google Scholar] [CrossRef]
- Bashir, S.; Khwaja, M.G.; Rashid, Y.; Turi, J.A.; Waheed, T. Green Brand Benefits and Brand Outcomes: The Mediating Role of Green Brand Image. SAGE Open 2020, 10. [Google Scholar] [CrossRef]
- Doszhanov, A.; Ahmad, Z.A. Customers’ Intention to Use Green Products: The Impact of Green Brand Dimensions and Green Perceived Value. SHS Web Conf. 2015, 18, 01008. [Google Scholar] [CrossRef]
- Valentine, S.V.; Savage, V.R. A strategic environmental management framework: Evaluating the profitability of being green. Sustain. Matters Environ. Manag. Asia 2010, 1–32. [Google Scholar] [CrossRef]
- Lin, J.; Zhou, Z. The positioning of green brands in enhancing their image: The mediating roles of green brand innovativeness and green perceived value. Int. J. Emerg. Mark. 2020. [Google Scholar] [CrossRef]
- de Chernatony, L.; Dall’Olmo Riley, F. Defining A “Brand”: Beyond The Literature with Experts’ Interpretations. J. Mark. Manag. 1998, 14, 417–443. [Google Scholar] [CrossRef]
- Tsai, P.H.; Lin, G.Y.; Zheng, Y.L.; Chen, Y.C.; Chen, P.Z.; Su, Z.C. Exploring the effect of Starbucks’ green marketing on consumers’ purchase decisions from consumers’ perspective. J. Retail. Consum. Serv. 2020, 56, 102162. [Google Scholar] [CrossRef]
- Javed, T.; Yang, J.; Gilal, W.G.; Gilal, N.G. The sustainability claims’ impact on the consumer’s green perception and behavioral intention: A case study of H&M. Adv. Manag. Appl. Econ. 2020, 10, 1792–7552. [Google Scholar]
- Amegbe, H.; Hanu, C. Exploring the Relationship Between Green Orientation, Customer Based Brand Equity (CBBE) and the Competitive Performance of SMEs in Ghana. J. Mark. Dev. Compet. 2016, 10, 80–93. [Google Scholar]
- Cuesta-Valiño, P.; Gutiérrez-Rodríguez, P.; Sierra-Fernández, M.-P.; Aguirre García, M.-B. Measuring a multidimensional green brand equity: A tool for entrepreneurship development. Br. Food J. 2021. ahead of print. [Google Scholar] [CrossRef]
- Khandelwal, U.; Kulshreshtha, K.; Tripathi, V. Importance of Consumer-based Green Brand Equity: Empirical Evidence. Paradigm 2019, 23, 83–97. [Google Scholar] [CrossRef]
- Lee, Y.-H.; Chen, S.-L. Effect of Green Attributes Transparency on WTA for Green Cosmetics: Mediating E ff ects of CSR and Green Brand Concepts. Sustainability 2019, 11, 5258. [Google Scholar] [CrossRef]
- Akturan, U. How does greenwashing affect green branding equity and purchase intention? An empirical research. Mark. Intell. Plan. 2018, 36, 809–824. [Google Scholar] [CrossRef]
- Avcilar, M.Y.; Demirgünes, B.K. Developing Perceived Greenwash Index and Its Effect on Green Brand Equity: A Research on Gas Station Companies in Turkey. Int. Bus. Res. 2016, 10, 222–239. [Google Scholar] [CrossRef]
- Butt, M.M.; Mushtaq, S.; Afzal, A.; Khong, K.W.; Ong, F.S.; Ng, P.F. Integrating Behavioural and Branding Perspectives to Maximize Green Brand Equity: A Holistic Approach. Bus. Strateg. Environ. 2017, 26, 507–520. [Google Scholar] [CrossRef]
- Esmaeli, A.; Sepahvand, A.; Rostamzadeh, R.; Joksiene, I.; Antucheviciene, J. Effect of Integration of Green Contructs and Traditional Constructs of Brand on Green Purchase Intention of Customers. Mark. Trade 2017, 20, 219–237. [Google Scholar]
- Bekk, M.; Spörrle, M.; Hedjasie, R.; Kerschreiter, R. Greening the competitive advantage: Antecedents and consequences of green brand equity. Qual. Quant. 2016, 50, 1727–1746. [Google Scholar] [CrossRef]
- Farquhar, P.H. Managing Brand Equity. J. Advert. Res. 1990, 30, 7–12. [Google Scholar]
- Aaker, D.A. Managing Brand Equity: Capitalizing on the Value of a Brand Name; Free Press: New York, NY, USA; Maxwell Macmillan International: Toronto, ON, Canada, 1991. [Google Scholar]
- Keller, K.L. Conceptualizing, Measuring, and Managing Customer-Based Brand Equity. J. Mark. 1993, 57, 1–22. [Google Scholar] [CrossRef]
- Jalilvand, M.; Jalilvand, M.R.; Samiei, N.; Mahdavinia, S.H. The Effect of Brand Equity Components on Purchase Intention: An Application of Aaker’s Model in the Automobile Industry. Int. Bus. Manag. 2011, 2, 149–158. [Google Scholar]
- Juga, J.; Juntunen, J.; Paananen, M. Impact of value-adding services on quality, loyalty and brand equity in the brewing industry. Int. J. Qual. Serv. Sci. 2018, 10, 61–71. [Google Scholar] [CrossRef]
- Tong, X.; Hawley, J.M. Measuring customer-based brand equity: Empirical evidence from the sportswear market in China. J. Prod. Brand Manag. 2009, 18, 262–271. [Google Scholar] [CrossRef]
- Ulfat, S.; Muzaffar, A.; Shoaib, M. To Examine the Application and Practicality of Aakers’ Brand Equity Model in Relation with Recurrent Purchases Decision for Imported Beauty Care Products (A Study of Female Customers’ of Pakistan). Online. 2014, Volume 6. Available online: https://www.iiste.org/Journals/index.php/EJBM/article/view/12223/12576 (accessed on 12 August 2021).
- Dwivedi, A.; Merrilees, B. Retail brand extensions: Unpacking the link between brand extension attitude and change in parent brand equity. Australas. Mark. J. 2013, 21, 75–84. [Google Scholar] [CrossRef]
- Çifci, S.; Ekinci, Y.; Whyatt, G.; Japutra, A.; Molinillo, S.; Siala, H. A cross validation of Consumer-Based Brand Equity models: Driving customer equity in retail brands. J. Bus. Res. 2016, 69, 3740–3747. [Google Scholar] [CrossRef]
- Raiya Umar, T.; Nik Kamariah Nik Mat, P.; Alfa Tahir, F.; Mohammed Alekam, J. The Practicality and Application of Aaker’s Customer Based Brand Equity Model in the Nigerian Banking Sector. Am. J. Econ. 2012, 2, 149–152. [Google Scholar] [CrossRef]
- Kimpakorn, N.; Tocquer, G. Service brand equity and employee brand commitment. J. Serv. Mark. 2010, 24, 378–388. [Google Scholar] [CrossRef]
- Nyadzayo, M.W.; Matanda, M.J.; Ewing, M.T. Franchisee-based brand equity: The role of brand relationship quality and brand citizenship behavior. Ind. Mark. Manag. 2016, 52, 163–174. [Google Scholar] [CrossRef]
- Hyun, S.S.; Kim, W. Dimensions of Brand Equity in the Chain Restaurant Industry. CORNELL Hosp. Q. 2011, 52, 429–437. [Google Scholar] [CrossRef]
- Yoo, B.; Donthu, N. Developing and validating a multidimensional consumer-based brand equity scale. J. Bus. Res. 2001, 52, 1–14. [Google Scholar] [CrossRef]
- Pappu, R.; Cooksey, R.W.; Quester, P.G. Consumer-based brand equity: Improving the measurement—Empirical evidence. J. Prod. Brand Manag. 2005, 14, 143–154. [Google Scholar] [CrossRef]
- Šerić, M.; Gil-Saura, I. ICT, IMC, and Brand Equity in High-Quality Hotels of Dalmatia: An Analysis from Guest Perceptions. J. Hosp. Mark. Manag. 2012, 21, 821–851. [Google Scholar] [CrossRef]
- Seric, M.; Gil-Saura, I. Perceptual and relational approach to hotel brand equity Measurement, criticism, and challenges. In Routledge Handbook of Hospitality Marketing; Gursoy, D., Ed.; Routledge Handbooks: London, UK, 2018; pp. 234–244. ISBN 978-1-315-44552-6/978-1-138-21466-8. [Google Scholar]
- Liu, M.T.; Wong, I.K.A.; Tseng, T.H.; Chang, A.W.Y.; Phau, I. Applying consumer-based brand equity in luxury hotel branding. J. Bus. Res. 2017, 81, 192–202. [Google Scholar] [CrossRef]
- Hanifah, R.D.; Wahyudi, A.S.; Nurbaeti, N. Influence of Brand Equity Towards Perceived Value in 5 Star Hotel at Jakarta. In Proceedings of the International Conference on Tourism, Gastronomy, and Tourist Destination (ICTGTD 2016), South Jakarta, Indonesia, 14–15 November 2016; Abdullah, A.G., Rahmanita, M., Ingkadijaya, R., Suprina, R., Pramanik, P.D., Nahdlah, Z., Sugeng, N.W., Eds.; Atlantis Press: South Jakarta, Indonesia, 2016; Volume 28, pp. 235–241. [Google Scholar] [CrossRef]
- Kayaman, R.; Arasli, H. Customer based brand equity: Evidence from the hotel industry. Manag. Serv. Qual. 2007, 17, 92–109. [Google Scholar] [CrossRef]
- Ishaq, M.I.; Hussain, N.; Asim, A.I.; Cheema, L.J. Brand equity in the Pakistani hotel industry. RAE Rev. Adm. Empres. 2014, 54, 284–295. [Google Scholar] [CrossRef]
- Surucu, O.; Ozturk, Y.; Okumus, F.; Bilgihan, A. Brand awareness, image, physical quality and employee behavior as building blocks of customer-based brand equity: Consequences in the hotel context. J. Hosp. Tour. Manag. 2019, 40, 114–124. [Google Scholar] [CrossRef]
- Kim, H.-B.; Kim, W.G. The relationship between brand equity and firms’ performance in luxury hotels and chain restaurants. Tour. Manag. 2005, 26, 549–560. [Google Scholar] [CrossRef]
- Kam Fung so, K.; King, C. “When experience matters”: Building and measuring hotel brand equity: The customers’ perspective. Int. J. Contemp. Hosp. Manag. 2010, 22, 589–608. [Google Scholar] [CrossRef]
- Vatankhah, S.; Darvishi, M. An empirical investigation of antecedent and consequences of internal brand equity: Evidence from the airline industry. J. Air Transp. Manag. 2018, 69, 49–58. [Google Scholar] [CrossRef]
- de Oliveira, D.S.; Caetano, M. Market strategy development and innovation to strengthen consumer-based equity: The case of Brazilian airlines. J. Air Transp. Manag. 2019, 75, 103–110. [Google Scholar] [CrossRef]
- Chen, C.-F.; Tseng, W.-S. Exploring Customer-based Airline Brand Equity: Evidence from Taiwan. Transp. J. 2010, 49, 24–34. [Google Scholar]
- Han, S.H.; Nguyen, B.; Lee, T.J. Consumer-based chain restaurant brand equity, brand reputation, and brand trust. Int. J. Hosp. Manag. 2015, 50, 84–93. [Google Scholar] [CrossRef]
- Bihamta, H.; Jayashree, S.; Rezaei, S.; Okumus, F.; Rahimi, R. Dual pillars of hotel restaurant food quality satisfaction and brand loyalty. Br. Food J. 2017, 119, 2597–2609. [Google Scholar] [CrossRef]
- Majid, M.A.A.; Alias, M.A.M.; Samsudin, A.; Chik, C.T. Assessing Customer-based Brand Equity Ratings in Family Restaurant. Procedia Econ. Financ. 2016, 37, 183–189. [Google Scholar] [CrossRef]
- El-Adly, M.I.; Abu ELSamen, A. Guest-based hotel equity: Scale development and validation. J. Prod. Brand Manag. 2018, 27, 615–633. [Google Scholar] [CrossRef]
- Lee, J.-S.; Back, K.-J. Attendee-based brand equity. Tour. Manag. 2008, 29, 331–344. [Google Scholar] [CrossRef]
- Lee, J.-S.; Back, K.-J. Reexamination of attendee-based brand equity. Tour. Manag. 2010, 31, 395–401. [Google Scholar] [CrossRef]
- Ferns, B.H.; Walls, A. Enduring travel involvement, destination brand equity, and travelers’ visit intentions: A structural model analysis. J. Destin. Mark. Manag. 2012, 1, 27–35. [Google Scholar] [CrossRef]
- Cristovao Verissimo, J.M.; Borges Tiago, M.T.; Tiago, F.G.; Jardim, J.S. Tourism destination brand dimensions: An exploratory approach. Tour. Manag. Stud. 2017, 13, 1–8. [Google Scholar] [CrossRef]
- Kim, H.-K.; Lee, T.J. Brand equity of a tourist destination. Sustainability 2018, 10, 431. [Google Scholar] [CrossRef]
- Andéhn, M.; Kazeminia, A.; Lucarelli, A.; Sevin, E. User-generated place brand equity on Twitter: The dynamics of brand associations in social media. Place Brand. Public Dipl. 2014, 10, 132–144. [Google Scholar] [CrossRef]
- Florek, M.; Kavaratzis, M. From brand equity to place brand equity and from there to the place brand. Place Brand. Public Dipl. 2014, 10, 103–107. [Google Scholar] [CrossRef]
- Florek, M. City brand equity as one of the city sustainable development indicator. Transform. Bus. Econ. 2012, 11, 385–405. [Google Scholar]
- Górska-Warsewicz, H. Factors determining city brand equity-A systematic literature review. Sustainability 2020, 12, 7858. [Google Scholar] [CrossRef]
- Gómez, M.; Fernández, A.C.; Molina, A.; Aranda, E. City branding in European capitals: An analysis from the visitor perspective. J. Destin. Mark. Manag. 2018, 7, 190–201. [Google Scholar] [CrossRef]
- Chen, Y.S. The drivers of green brand equity: Green brand image, green satisfaction, and green trust. J. Bus. Ethics 2010, 93, 307–319. [Google Scholar] [CrossRef]
- Ishaq, M.I. Multidimensional green brand equity: A cross-cultural scale development and validation study. Int. J. Mark. Res. 2020, 63, 560–575. [Google Scholar] [CrossRef]
- Suryawan, I.N. Effect of Utilitarian Benefit on Green Brand Equity with Green Brand Image. J. Manaj. 2019, 23, 306–320. [Google Scholar] [CrossRef]
- Li, G.; Li, J.; Sun, X. Measuring green brand equity in relationship interactions and its impact on brand loyalty. Rev. Cercet. Interv. Soc. 2019, 66, 278–297. [Google Scholar] [CrossRef]
- Liberati, A.; Altman, D.G.; Tetzlaff, J.; Mulrow, C.; Gøtzsche, P.C.; Ioannidis, J.P.A.; Clarke, M.; Devereaux, P.J.; Kleijnen, J.; Moher, D. The PRISMA statement for reporting systematic reviews and meta-analyses of studies that evaluate health care interventions: Explanation and elaboration. PLoS Med. 2009, 6, e1000100. [Google Scholar] [CrossRef]
- Hedin, B.; Katzeff, C.; Eriksson, E.; Pargman, D. A systematic review of digital behaviour change interventions for more sustainable food consumption. Sustainability 2019, 11, 2638. [Google Scholar] [CrossRef]
- García-Feijoo, M.; Eizaguirre, A.; Rica-Aspiunza, A. Systematic Review of Sustainable-Development-Goal Deployment in Business Schools. Sustainability 2020, 12, 440. [Google Scholar] [CrossRef]
- Yoopetch, C.; Nimsai, S. Science mapping the knowledge base on sustainable tourism development. 1990–2018. Sustainability 2019, 11, 3631. [Google Scholar] [CrossRef]
- Lemus-Aguilar, I.; Morales-Alonso, G.; Ramirez-Portilla, A.; Hidalgo, A. Sustainable business models through the lens of organizational design: A systematic literature review. Sustainability 2019, 11, 5379. [Google Scholar] [CrossRef]
- Merhabi, M.A.; Petridis, P.; Khusainova, R. Gamification for Brand Value Co-Creation: A Systematic Literature Review. Information 2021, 12, 345. [Google Scholar] [CrossRef]
- Tremmel, M.; Gerdtham, U.G.; Nilsson, P.M.; Saha, S. Economic burden of obesity: A systematic literature review. Int. J. Environ. Res. Public Health 2017, 14, 435. [Google Scholar] [CrossRef]
- Manoharan, A.; Singal, M. A systematic literature review of research on diversity and diversity management in the hospitality literature. Int. J. Hosp. Manag. 2017, 66, 77–91. [Google Scholar] [CrossRef]
- Kutzschbach, J.; Tanikulova, P.; Lueg, R. The Role of Top Managers in Implementing Corporate Sustainability—A Systematic Literature Review on Small and Medium-Sized Enterprises. Adm. Sci. 2021, 11, 44. [Google Scholar] [CrossRef]
- Tang, A.K.Y. A systematic literature review and analysis on mobile apps in m-commerce: Implications for future research. Electron. Commer. Res. Appl. 2019, 37, 100885. [Google Scholar] [CrossRef]
- Saikat, S.; Dhillon, J.S.; Wan Ahmad, W.F.; Jamaluddin, R.A. A Systematic Review of the Benefits and Challenges of Mobile Learning during the COVID-19 Pandemic. Educ. Sci. 2021, 11, 459. [Google Scholar] [CrossRef]
- Górska-Warsewicz, H.; Kulykovets, O. Hotel Brand Loyalty—A Systematic Literature Review. Sustainability 2020, 12, 4810. [Google Scholar] [CrossRef]
- Balasubramanian, M. Economic value of regulating ecosystem services: A comprehensive at the global level review. Environ. Monit. Assess. 2019, 191, 1–27. [Google Scholar] [CrossRef]
- Bhati, R.; Verma, H.V. Antecedents of customer brand advocacy: A meta-analysis of the empirical evidence. J. Res. Interact. Mark. 2020, 14, 153–172. [Google Scholar] [CrossRef]
- Petruccelli, K.; Davis, J.; Berman, T. Negatywne doświadczenia w dzieciństwie i związane z nimi skutki zdrowotne—Przegląd systematyczny i metaanaliza. Dziecko Skrzywdzone Teor. Bad. Prakt. 2019, 18, 175–206. [Google Scholar]
- Harcombe, Z.; Baker, J.S.; Davies, B. Evidence from prospective cohort studies does not support current dietary fat guidelines: A systematic review and meta-analysis. Br. J. Sports Med. 2017, 51, 1743–1749. [Google Scholar] [CrossRef]
- Aune, D.; Giovannucci, E.; Boffetta, P.; Fadnes, L.T.; Keum, N.N.; Norat, T.; Greenwood, D.C.; Riboli, E.; Vatten, L.J.; Tonstad, S. Fruit and vegetable intake and the risk of cardiovascular disease, total cancer and all-cause mortality-A systematic review and dose-response meta-analysis of prospective studies. Int. J. Epidemiol. 2017, 46, 1029–1056. [Google Scholar] [CrossRef] [PubMed]
- De Souza, R.J.; Mente, A.; Maroleanu, A.; Cozma, A.I.; Ha, V.; Kishibe, T.; Uleryk, E.; Budylowski, P.; Schünemann, H.; Beyene, J.; et al. Intake of saturated and trans unsaturated fatty acids and risk of all cause mortality, cardiovascular disease, and type 2 diabetes: Systematic review and meta-analysis of observational studies. BMJ 2015, 351, h3978. [Google Scholar] [CrossRef] [PubMed]
- Abelha, M.; Fernandes, S.; Mesquita, D.; Seabra, F.; Ferreira-Oliveira, A.T. Graduate employability and competence development in higher education-A systematic literature review using PRISMA. Sustainability 2020, 12, 5900. [Google Scholar] [CrossRef]
- Bimbo, F.; Bonanno, A.; Nocella, G.; Viscecchia, R.; Nardone, G.; De Devitiis, B.; Carlucci, D. Consumers’ acceptance and preferences for nutrition-modified and functional dairy products: A systematic review. Appetite 2017, 113, 141–154. [Google Scholar] [CrossRef]
- Akhtar, N.; Khan, N.; Mahroof Khan, M.; Ashraf, S.; Hashmi, M.S.; Khan, M.M.; Hishan, S.S. Post-covid 19 tourism: Will digital tourism replace mass tourism? Sustainability 2021, 13, 5352. [Google Scholar] [CrossRef]
- Wohlin, C. Guidelines for snowballing in systematic literature studies and a replication in software engineering. ACM Int. Conf. Proceeding Ser. 2014. [Google Scholar] [CrossRef]
- VOSviewer—Visualizing Scientific Landscapes. Available online: https://www.vosviewer.com/ (accessed on 12 August 2021).
- Borenstein, M.; Hedges, L.V.; Higgins, J.P.T.; Rothstein, H.R. When Does it Make Sense to Perform a Meta-Analysis? In Introduction to Meta-Analysis; Borenstein, M., Hedges, L.V., Higgins, J.P.T., Rothstein, H.R., Eds.; John Wiley & Sons, Ltd.: London, UK, 2009; ISBN 9780470057247. Available online: https://chb.bmn.ir/Asset/files/Introduction-to-Meta-Analysis.pdf (accessed on 12 August 2021).
- Moher, D.; Liberati, A.; Tetzlaff, J.A.D. PRISMA 2009 Flow Diagram. Prism. Statement 2009, 6, 1000097. [Google Scholar]
- Ha, M.T. Investigating green brand equity and its driving forces. Manag. Sci. Lett. 2020, 10, 2379–2384. [Google Scholar] [CrossRef]
- Liu, H.T.; Tsaur, R.C. The theory of reasoned action applied to green smartphones: Moderating effect of government subsidies. Sustainability 2020, 12, 5979. [Google Scholar] [CrossRef]
- Sozer, E.G. The effects of green marketing practices on green equity and customer tolerance. Pressacademia 2020, 7, 102–111. [Google Scholar] [CrossRef]
- Gupta, A.; Dash, S.; Mishra, A. Self/other oriented green experiential values: Measurement and impact on hotel-consumer relationship. Int. J. Hosp. Manag. 2019, 83, 159–168. [Google Scholar] [CrossRef]
- Ho, T.N.; Wu, W.Y.; Nguyen, P.T.; Chen, H.C. The moderating effects for the relationships between green customer value, green brand equity and behavioral intention. Acad. Strateg. Manag. J. 2019, 18, 1–21. [Google Scholar]
- Deniz, A.; Onder, L. Determinants of Brand Equity in Green Products: The Relationships among Green Brand Image, Green Trust and Green Satisfaction. Int. J. Arts Humanit. Soc. Sci. 2017, 2, 1–8. [Google Scholar]
- Vijay MallikRaj, S.; Karthikeyan, M.R.; Sekar, P.C. Antecedents of Green Brand Equity: An Empirical Approach. Asia Pac. J. Res. 2017, 1, 98–102. [Google Scholar]
- Chen, M.F.; Lee, C.L. The impacts of green claims on coffee consumers’ purchase intention. Br. Food J. 2015, 117, 195–209. [Google Scholar] [CrossRef]
- Chang, C.H.; Chen, Y.S. Managing green brand equity: The perspective of perceived risk theory. Qual. Quant. 2014, 48, 1753–1768. [Google Scholar] [CrossRef]
- Kazmi, S.H.A.; Shahbaz, M.S.; Mubarik, M.S.; Ahmed, J. Switching behaviors toward green brands: Evidence from emerging economy. Environ. Dev. Sustain. 2021, 23, 11357–11381. [Google Scholar] [CrossRef]
- Konuk, F.A.; Rahman, S.U.; Salo, J. Antecedents of green behavioral intentions: A cross-country study of Turkey, Finland and Pakistan. Int. J. Consum. Stud. 2015, 39, 586–596. [Google Scholar] [CrossRef]
- Adnan, M.; Naveed, R.T.; Ahmad, N. Predicting Green Brand Equity through Green Brand Credibility. J. Manag. Sci. 2006, 13, 144–157. [Google Scholar]
- Dolatabadi, H.R.; Tabaeeian, R.A.; Tavakoli, H. Integral model of green brand equity: A study among customers of online shopping websites. EuroMed J. Manag. 2016, 1, 185–199. [Google Scholar] [CrossRef]
- Delafrooz, N.; Goli, A. The factors affecting the green brand equity of electronic products: Green marketing. Cogent Bus. Manag. 2015, 2, 1079351. [Google Scholar] [CrossRef]
- Namkung, Y.; Jang, S. Effects of restaurant green practices on brand equity formation: Do green practices really matter? Int. J. Hosp. Manag. 2013, 33, 85–95. [Google Scholar] [CrossRef]
- Ng, P.F.; Butt, M.M.; Khong, K.W.; Ong, F.S. Antecedents of Green Brand Equity: An Integrated Approach. J. Bus. Ethics 2014, 121, 203–215. [Google Scholar] [CrossRef]
- Pechyiam, C.; Jaroenwanit, P. The Macrotheme Review A multidisciplinary journal of global macro trends The Factors Affecting Green Brand Equity of Electronic Products in Thailand. Macrotheme Rev. 2014, 3, 1–12. [Google Scholar]
- Kang, S.; Hur, W.M. Investigating the Antecedents of Green Brand Equity: A Sustainable Development Perspective. Corp. Soc. Responsib. Environ. Manag. 2012, 19, 306–316. [Google Scholar] [CrossRef]
- Assael, H. Consumer Behavior and Marketing Action; Kent Pub. Co.: Boston, MA, USA, 1987; ISBN 0534075304. [Google Scholar]
- Kotler, P. A Framework for Marketing Management; Prentice Hall: Upper Saddle River, NJ, USA, 2001; ISBN 0130185256. [Google Scholar]
- Wang, C.-Y. Service quality, perceived value, corporate image, and customer loyalty in the context of varying levels of switching costs. Psychol. Mark. 2010, 27, 252–262. [Google Scholar] [CrossRef]
- Doney, P.M.; Cannon, J.P. An examination of the nature of trust in buyer-seller relationships. J. Mark. 1997, 61, 35–51. [Google Scholar]
- Sirdeshmukh, D.; Singh, J.; Sabol, B. Consumer Trust, Value, and Loyalty in Relational Exchanges. J. Mark. 2018, 66, 15–37. [Google Scholar] [CrossRef]
- Sweeney, J.C.; Soutar, G.N. Consumer perceived value: The development of a multiple item scale. J. Retail. 2001, 77, 203–220. [Google Scholar] [CrossRef]
- Oliver, R. Satisfaction: A Behavioral Perspective on the Consumer; Irwin/McGraw-Hill: Boston, MA, USA, 1997; ISBN 9780070480254. [Google Scholar]
- Paulssen, M.; Birk, M.M. Satisfaction and repurchase behavior in a business-to-business setting: Investigating the moderating effect of manufacturer, company and demographic characteristics. Ind. Mark. Manag. 2007, 7, 983–997. [Google Scholar] [CrossRef]
- Martenson, R. Corporate brand image, satisfaction and store loyalty: A study of the store as a brand, store brands and manufacturer brands. Int. J. Retail Distrib. Manag. 2007, 35, 544–555. [Google Scholar] [CrossRef]
- Sheth, J.N.; Park, C.W. A Theory of Multidimensional Brand Loyalty; Scott, W., Peter, W., Eds.; Association for Consumer Research: Ann Abor, MI, USA, 1974; Volume 1, pp. 449–459. [Google Scholar]
- Oliver, R.L. Whence Consumer Loyalty. J. Mark. 1999, 63, 33–44. [Google Scholar] [CrossRef]
- Unurlu, C.; Uca, S. The effect of culture on brand loyalty through brand performance and brand personality. Int. J. Tour. Res. 2017, 19, 672–681. [Google Scholar] [CrossRef]
- Huang, M.-H.; Cheng, Z.-H.; Chen, I.-C. The importance of CSR in forming customer–company identification and long-term loyalty. J. Serv. Mark. 2017, 31, 63–72. [Google Scholar] [CrossRef]
- Rather, R.A. Investigating the Impact of Customer Brand Identification on Hospitality Brand Loyalty: A Social Identity Perspective. J. Hosp. Mark. Manag. 2018, 27, 487–513. [Google Scholar]
- Nastasoiu, A.; Vandenbosch, M. Competing with loyalty: How to design successful customer loyalty reward programs. Bus. Horiz. 2019, 62, 207–214. [Google Scholar] [CrossRef]
- Zakir Hossain, M.; Kibria, H.; Farhana, S. Do Customer Loyalty Programs Really Work in Airlines Business?—A Study on Air Berlin. J. Serv. Sci. Manag. 2017, 10, 360–375. [Google Scholar] [CrossRef][Green Version]
- Noyan, F.; Şimşek, G. The antecedents of customer loyalty Selection and peer review under responsibility of Organizing Committee of BEM 2013. Procedia-Soc. Behav. Sci. 2014, 109, 1220–1224. [Google Scholar] [CrossRef]
- Zeithaml, V.A. Consumer Perceptions of Price, Quality, and Value: A Means-End Model and Synthesis of Evidence. J. Mark. 1988, 52, 2. [Google Scholar] [CrossRef]
- Hoeffler, S.; Keller, K.L. The marketing advantages of strong brands. J. Brand Manag. 2003, 10, 421–445. [Google Scholar] [CrossRef]
- Huang, R.; Sarigöllü, E. How brand awareness relates to market outcome, brand equity, and the marketing mix. J. Bus. Res. 2012, 65, 92–99. [Google Scholar] [CrossRef]
- Building Strong Brands—David A. Aaker—Google Książki. Available online: https://books.google.pl/books?hl=pl&lr=&id=OLa_9LePJlYC&oi=fnd&pg=PT11&ots=sCRePScGd8&sig=AWpyVXbDon9IRnyPoBzywCmt2po&redir_esc=y#v=onepage&q&f=false (accessed on 26 April 2020).
- Petty, R.E.; Wegener, D.T.; Fabrigar, L.R. Attitudes and Attitude Change. Annu. Rev. Psychol. 2003, 48, 609–647. [Google Scholar] [CrossRef] [PubMed]
- Kanchanapibul, M.; Lacka, E.; Wang, X.; Chan, H.K. An empirical investigation of green purchase behaviour among the young generation. J. Clean. Prod. 2014, 66, 528–536. [Google Scholar] [CrossRef]
- Erdem, T.; Swait, J. Brand credibility, brand consideration, and choice. J. Consum. Res. 2004, 31, 191–198. [Google Scholar] [CrossRef]
- Kotler, P.; Keller, K.L. Marketing Management; Pearson Education Limited: London, UK, 2016; ISBN 9781292092737. [Google Scholar]
- Peter, J.P.; Ryan, M.J. An Investigation of Perceived Risk at the Brand Level. J. Mark. Res. 1976, 13, 184–188. [Google Scholar] [CrossRef]
- Nathan, R.J.; Soekmawati; Victor, V.; Popp, J.; Fekete-Farkas, M.; Oláh, J. Food Innovation Adoption and Organic Food Consumerism—A Cross National Study between Malaysia and Hungary. Foods 2021, 10, 363. [Google Scholar] [CrossRef] [PubMed]


| Factor | Description |
|---|---|
| Image | Definitions:
|
| Trust | Definitions:Analyzed as green trust, green brand trust, and consumer trust. |
| Value | Definitions:
|
| Satisfaction | Definitions:
|
| Loyalty | Definitions:
|
| Quality | Definitions:
|
| Awareness | Definitions:
|
| Attitude | Definitions:Analyzed as general attitude, brand attitude, consumer attitude, green brand attitude, green products attitude, and pro-environmental attitude. |
| Credibility | Definition:
|
| Association | Definitions:
|
| Risk | Definition:
|
| Study | Author, Year | Factors/Variables | Items and Scales (Number of Items Total and Per Factor/Type of Scale) | Hypotheses (Verified or Not Verified/Path Coefficient) | Statistical Methods and Indicators |
|---|---|---|---|---|---|
| [114] 30 | Kazmi, Shahbaz, Mubarik, Ahmed, 2021 | Green Brand Experiential Risk (GBER) Green Brand Experiential Quality (GBEQ) Green Customer Value (GCV) Green Brand Experience (GBEx) Green Brand Switching Intention (GBSI) Green Brand Purchase Intention (GBPI) Green Brand Equity (GBE) | 24 items in 5-point Likert scale: GBER—5 items GBEQ—3 items GCV—5 items GBEx—3 items GBE—3 items GBSI—2 items GBPI—3 items | GBER → GCV (+): 0.147 GBEQ → GCV (+): −0.508 GBEx → GCV (+): 0.158 GCV → GBE (+): 0.647 GBE → GBSI (+): 0.675 GBE → GBPI (+): 0.189 GBSI → GBPI (+): 0.520 | CFA: Loadings: 0.631–0.899; CR = 0.783–0.885; AVE = 0.511–0.793 SEM: SRMR = 0.086; D_ULS = 2.217; D_G=0.611 |
| [105] 1 | Ha, 2020 | Green Brand Image (GBI) Green Trust (GT) Green Satisfaction (GS) Green Brand Equity (GBE) | 17 items in 5-point Likert scale: GS—4 items GT—3 items GBI—6 items GBE—4 items | GBI → GBE (+): 0.516 GT → GBE (+): 0.490 GS →GBE (+): 0.252 GS → GT (+): 0.380 GBI → GT (−): −0.077 GBI → GS (+): 0.407 | CFA: Loadings: 0.765–0.863; CR = 0.879–0.935; AVE = 0.654–0.826 SEM: χ2/df = 1.994; RMSEA = 0.058; TLI = 0.963; CFI = 0.970; SRMR = 0.034 |
| [106] 2 | Liu, Tsaur, 2020 | Purchase Intention (PI) Attitude (AT) Green Marketing (GM) Green awareness (GAW) Government Subsidies (GSU) Brand Equity (BE) | 14 items in 7-point Likert scale: BE—3 items GM—2 items GAW—3 items GAT—2 items PI—3 items GS—1 item | BE → PI (+): 0.369 BE → AT (+): 0.807 GM →GAW (+): 0.959 GAW → PI (−): 0.116 GAW → AT (+): 0.260 AT → PI (+): 0.649 GSU → AT, PI (+): 0.050 | CFA: Loadings: 0.86–0.99; CR = 0.91–0.99; AVE = 0.84–0.97 SEM: χ2/df = 2.282; RMSEA = 0.059; AGFI = 0.90; CFI = 0.999; IFI = 0.99 |
| [25] 3 | Javed, Yang, Gilal, Gilal, 2020 | GBE and factors: Green Brand Image (GBI) Green Loyalty (GL) Green Trust (GT) Green Satisfaction (GS) Green Purchase Intention (GPI) Green Claims (GC) Green Brand Equity (GBE) | 5-point Likert scale; items n.a. | n.a. | ANOVA: social claims significantly influence GBI, GBE, GS, GPI |
| [24] 4 | Tsai, Lin, Zheng, Chen, Chen, Su, 2020 | Brand Management (BM) Green Brand Image (GBI) Green Brand Relationships (GBR) Green Brand Equity (GBE) | 14 items in 5-point scale (0—negligible, 1—minor, 2—moderate, 3—major, and 4—severe): BM—4 items GBI—4 items GBR—3 items GBE—3 items | n.a. | DEMATEL—method to combine expert knowledge and clarify causal relationships between variables DANP—analytic hierarchy process: weights: BM= 0.241 (rank 4), GBI = 0.253 (rank 2), GBR = 0.251 (rank 3), GBE = 0.254 (rank 1) |
| [77] 5 | Ishaq, 2020 | Social Influence (SI) Sustainability (Sus) Perceived Quality (PQ) Brand Awareness (BA) Brand Association (BAss) Brand Leadership (BL) Green Brand Equity (GBE) | 27 items in 5-point Likert scale: SI—5 items Sus—5 items PQ—5 items BA—4 items BAss—4 items BL—4 items | To propose an unique and validated scale to measure GBE | CFA: loadings above 0.79 (for Pakistan and Italy, telecommunication, and home appliance) SEM: Cross-cultural: χ2/df = 2.82; RMSEA = 0.07; GFI = 0.93; NFI = 0.97; IFI = 0.92; CFI= 0.93 |
| [107] 31 | Sozer, 2020 | Green Brand Image (GBI) Green Brand Satisfaction (GBS) Green Brand Trust (GBT) Performance Toleration (PT) Price Toleration (PrT) Communication Toleration (CT) Green Brand Equity (GBE) | 26 items in 5-point Likert scale: GBI—6 items GBS—4 items GBT—3 items GBE—4 items PT—3 items PrT—3 items CT—3 items | GBI → GBE (−): 0.049 GBS → GBE (+): 0.729 GBT → GBE (+): 0.246 GBE → PT (+): 0.392 GBE → PrT (+): 0.318 GBE → CT (+): 0.278 | CFA: Loadings: 0.534–0.968; CR = 0.745–0.975; AVE= 0.501–0.928 SEM: χ2/df = 1.071; RMSEA = 0.22; IFI = 0.937; CFI= 0.930 |
| [28] 6 | Khandelwal, Kulshreshtha, Tripathi, 2019 | Green Brand Image (GBI) Green Brand Satisfaction (GBS) Green Brand Trust (GBT) Green Brand Loyalty (GL) Green Reference Group (GRG) Green Advertisement (GAD) Green Brand Equity (GBE) | 35 items in 7-point Likert scale: GBI—5 items GBS—4 items GBT—5 items GBL—4 items GRG—BI 8 items GAD—5 items CAT—4 items | Metro/non-metro city GBI → CAT (+/+) GBS → CAT (+/+) GBT → CAT (+/+) GBL → CAT (+/−) GRG → CAT (+/+) GAD → CAT (+/+) | Regression analysis: Metro city: R2= 0.801 CAT as GBE = 1.692 + 0.038 × GBI + 0.194 × GBS + 0.113 × GBT + 0.181 × GBL + 0.193 × GRG + 0.122 × GAD Non-metro city: R2= 0.636; CAT as GBE = 1.67 + 0.258 × GBI + 0.082 × GBS + 0.109 × GBT + 0.151 × GBL + 0.19 × GRG +0.106 × GAD |
| [108] 7 | Gupta, Dash, Mihra, 2019 | Green Utilitarian Value (GUtV) Green Hedonic Value (GHdV) Green Trust (GRT) Green Social Value (GScV) Green Altruistic Value (GAlV) Pro-environmental Attitude (PEA) Travel Purpose (TP) Re-patronage Intention (RPI) Green Brand Equity (GBE) | 31 items in 5-point Likert scale: GUtV—3 items GHdV—3 items GRT—5 items GScV—3 items GAlV—3 items GBE—4 items PEA—6 items RPI—4 items | GUtV → GRT (+): 0.395 GHdV → GRT (+): 0.338 GScV → GRT (−): 0.046 GAlV → GRT (−): 0.164 GRT → GBE (+): 0.690 GBE → RPI (+): 0.801 | CFA: Loadings: 0.537–0.904; CR = 0.885–0.954; AVE= 0.568–0.874 SEM: χ2/df = 1.851; RMSEA = 0.06; IFI = 0.95; CFI= 0.94; TLI = 0.93; NFI = 0.88 |
| [109] 8 | Ho, Wu, Nguyen, Chen, 2019 | Green Brand Image (GBI) Green Perceived Quality (GPQ) Altruistic Value (AV) Relationship Quality (RQ) Price Premium (PP) Brand Equity (BE) Customer Values (CV) as BGI, GPQ, AV, RQ, PP Behavioral intentions (BI): PI and WOMI Purchase Intentions (PI) Green Promotion (GPR) Green Marketing awareness (GMA) Word-of-mouth Intention (WOMI) Green Brand Loyalty (GBL) Self-expressive Benefit (SEB) Brand Social Responsibility (BSR) | 64 items in 5-point Likert scale: CBI—5 items GPQ—3 items AV—3 items RQ—8 items PP—3 items BE—8 items PI—3 items WOMI—3 items GPR—5 items GMA—5 items GBL—6 items SEB—6 items BSR—4 items | CV → BE (+/−): RQ, GPQ, GBI, PP → BE (+) and AV → BE (−) BE → BI (+) GPR → CV/BE (+) GMA → CV/BE (+) GBL → CV/BE (+) SEB → BE/BI (+) BSR → BE/BI (+) | Regression Analysis: Model 1: CV—independent factors and BE dependent factors: R2= 0.681; Beta: PP = 0.094; GBI = 0.128; GPQ = 0.157; RQ = 0.445 Model 2: BE—independent factor, PI—dependent factor R2= 0.568; Beta = 0.754 Model 2: BE—independent factor, WOMI—dependent factor R2= 0.582; Beta = 0.763 |
| [29] 9 | Lee, Chen, 2019 | Green Attributes Transparency (GAT) Corporate Social Responsibility (CSR) Green Brand Image (GBI) Green Brand Trust (GBT) Willingness to Adopt (WTA) Green Brand Equity (GBE) | 25 items in 7-point Likert scale: GAT—4 items CSR—5 items GBI—4 items GBT—5 items GBE—3 items WTA—4 items | GAT → CSR (+): 0.695 GAT → GBI (+): 0.708 CSR → GBT (+): 0.289 CSR → GBE (+): 0.297 GBI → GBT (+): 0.649 GBI → GBE (+): 0.500 GBT → WTA (+): 0.316 GBE → WTA (+): 0.365 | CFA: Loadings: 0.74–0.92; CR = 0.89–0.95; AVE= 0.68–0.80 SEM: χ2/df = 5.10; RMSEA = 0.075; IFI = 0.94; CFI= 0.94; TLI = 0.93; NFI = 0.93; SRMR = 0.09 |
| [79] 10 | Li, Li, Sun, 2019 | Green Brand Image (GBI) Green Brand Reciprocity (GBR) Green Brand Attachment (GBA) Green Brand Trust (GBT) Green Brand Satisfaction (GBS) Brand Loyalty (BL) Green Brand Equity (GBE) | 21 items in 7-point Likert scale: GBI—4 items GBR—4 items GBA—4 items GBT—5 items GBS—4 items | GBE → BL (+): 0.867 GBI → BL (−):−0.205 GBR → BL (+): 0.234 GBA → BL (+): 0.417 GBS → BL (+): 0.252 GBT → BL (+): 0.277 | EFA: variance explained 69.948% CFA: Loadings: 0.616–0.910; CR = 0.742–0.844; AVE= 0.502–0.590 SEM: χ2/df = 1.518; RMSEA = 0.071; IFI = 0.949; CFI= 0.965; NFI = 0.904; SRMR = 0.09 |
| [78] 11 | Suryawan, 2019 | Utilitarian Benefit (UB) Green Brand Image (GBI) Green Brand Equity (GBE) | 11 items in 5-point Likert scale: UB—3 items GBI—4 items GBE—4 items | UB → GBI (+) GBI → GBE (+) UB → GBE (+) | Reliability test results for male gender: 0.820–0.875; for female gender 0.865–0.917 |
| [31] 12 | Avcılar, Demirgünes, 2017 | Greenwash (GW) Green Consumer Confusion (GCC) Green Perceived Risk (GPR) Green Trust (GT) Green Brand Equity (GBE) | 24 items in 7-point Likert scale: GW—5 items GCC—5 items GPR—5 items GT—5 items GBE—4 items | GW → GCC (+): 0.292 GW → GPR (+): 0.617 GCC → GT (+): −0.308 GPR → GT (+): −0.415 GT → GBE (+): 0312 | CFA = 0.849–0.923; CR = 0.935–0.963; AVE= 0.720–0.867 SEM: Fit model indicators acceptable |
| [30] 13 | Akturan, 2017 | Purchase intentions (PI) Brand credibility (BC) Greenwashing (GW) Green brand associations (GBA) Green Brand Equity (GBE) | 25 items in 5-point Likert scale: BC—7 items GBE—4 items GW—5 items GBA—4 items PI—5 items | GBE → PI (+): 0.516 and 0.664 BC → GBE (+): 0.810 and 0.686 GW → BC (+): −0.336 and −0.727 GBA → GBE (+): 0.341 and 0.342 GW → GBA (+): −0.152 and −0.664 | CFA—low-involvement brand: loadings: 0.44–0.83; CR = 0.83–0.90; AVE= 0.70–0.71 CFA—high-involvement brand: loadings: 0.49–0.86; CR = 0.82–0.89; AVE= 0.42–0.63 SEM= low-involvement brand χ2/df = 2.257; RMSEA = 0.071; IFI = 0.899; CFI= 0.897; GFI = 0.846 SEM= high-involvement brand χ2/df = 2.200; RMSEA = 0.069; IFI = 0.908; CFI= 0.907; GFI = 0.846 |
| [32] 14 | Butt, Mushtaq, Afzal, Khong, Ong, Ng, 2017 | Consumer Environmental Values (CEV) Attitude Towards Green Products (ATGP) Green Brand Image (GBI) Greer Brand Trust (GBT) Consumer Trust (CT) Green Brand Equity (GBE) | 17 items in 5-point Likert scale: ATGP—4 items CEV—3 items GBI—3 items GBT—4 items GBE—3 items | CEV → ATGP (+): 0.451 CEV → GBI (+) 0.40 ATGP → GBI (+): 0.281 GBI → GBT (+): 0.782 GBI → GBE (−): −0.110 GBT → GBE (+): 0.770 | CFA: Loadings: 0.612–0.836; CR = 0.928–0.977; AVE= 0.813–0.934 SEM: χ2/df = 1.106; RMSEA = 0.027; IFI = 0.990; CFI= 0.989; TLI = 0.987 |
| [110] 28 | Deniz, Onder, 2017 | Green Brand Image (GBI) Green Customer Satisfaction (GCS) Green Trust (GT) Green Brand Equity (GBE) | 12 items in 5-point Likert scale: GBI—4 items GCS—2 items GBT—3 items GBE—3 items | GBI → GCS (+): 0.58 GBI → GBT (+): 0.57 GBI → GBE (−) GCS → GBE (+): 0.19 GBT→ GBE (+): 0.53 | SEM: χ2/df = 4.09; RMSEA = 0.106; GFI = 0.88; NFI = 0.87; CFI= 0.92; AGFI=0.82 |
| [33] 15 | Esmaeili, Sepahvand, Rostamzadeh, Joksiene, Autucheviciene, 2017 | Perceived Brand Quality (PBQ) Green Brand Image (GBI) Green Brand Value (GBV) Brand Credibility (BC) Green Brand Perceived Value (GBPV) Special Green Brand Value (SGBV) Green Brand Purchase Intention (GBPI) Brand Equity (BE) | 26 items in 5-point Likert scale: PBQ—5 items BC—6 items GBI—4 items GBPV—4 items GBE—4 items GBPI—3 items | PBQ → GBI (+): 0.36 PBQ → BC (+): 0.65 PBQ → GBPV (+) 0.76 BC → GBI (+): 0.57 BC → GBE (−): 0.04 GBPV → GBE (+): 0.76 GBPV → BC (+): 0.19 GBI → GBE (+): 0.49 GBE → GBPI (+): 0.89 | SEM: χ2/df = 2.563; RMSEA = 0.086; GFI = 0.810; NFI = 0.950; CFI= 0.970 |
| [111] 33 | Vijay MallikRaj, Karthikeyan, Sekar, 2017 | Green Product (GProd) Green Price (GPr) Green Place (GPl) Green Promotion (GP) Green Brand Equity (GBE) | 16 items in 5-point Likert scale: GBE—3 items GProd—3 items GPr—3 items GPl—4 items GP—3 items | Hypothesis/Path coefficient GProd → GBE (−): 0.296 GPr → GBE (+): 0.447 GPl → GBE (−): −0.102 GP → GBE (+): 0.454 | CFA: Standardized loadings: 0.603–0.934; CR = 0.803–0.927; AVE = 0.578–0.810 SEM: χ2/df = 1.571; GFI = 0.915; RMSEA = 0.056; AGFI = 0.876; TLI = 0.956; CFI = 0.966; RMR = 0.042 |
| [34] 16 | Bekk, Sporrle, Hedjasie, Kerschreiter, 2016 | Green Brand Image (GBI) Brand Attitude (BA) Word-of-mouth communication (WOM) Green Trust (GT) Green Satisfaction (GS) Green Brand Equity (GBE) | 22 items in 5-point Likert scale: GBI 5 items GS—4 items GT—5 items GBE—4 items BA—4 items 4 items in 8-point Likert scale WOM—4 items | GBI → GBE (+) without mediators (GA and GT) GBI → GBE (−) with GAmediators GBE → BA (+) GBE → WOM (+) | Regression based mediation analyses: Regression coefficient within model: Beta = 0.13–0.66 |
| [26] 17 | Amegbe, Hanu, 2016 | Green Orientation (GO) Competitive Performance (CP) Brand awareness (BAW) Perceived Quality (PQ) Brand Loyalty (BL) Brand Association (BA) Consumer based Green Equity (CBGE) | n.a. | GO → BL (+) GO → PQ (−) GO → BAW (−) GO → BA (+) GO → CP (+) | Regression analysis GBE = 1.014 + 0.289 × BL + 0.049 × BAW + 0.201 × BA |
| [117] 29 | Dolatabadi, Tabaeeian, Tavakoli, 2016 | Green Perceived Value (GPV) Green Image (GI) Green Trust (GT) Green Satisfaction (GS) Green Loyalty (GL) Green Brand Equity (GBE) | 25 items in 5-point Likert scale: GPV—4 items GI—5 items GS—4 items GT—4 items GL—4 items GBE—4 items | GPV → GT (+): 0.398 GI → GT (+): 0.407 GI → GS (+): 0.636 GS → GT (+): 0.427 GT → GL (+): 0.61 GT → GBE (+): 0.311 GS → GBE (+): 0.527 GL → GBE (+): 0.579 | SEM Fit model indicators acceptable |
| [112] 18 | Chen, Lee 2015 | Green Brand Image (GBI) Green Satisfaction (GS) Green Trust (GT) Green purchase intentions (GPI) Green Brand Equity (GBE) | 18 items in 5-point Likert scale: GBI 5 items GS—4 items GT—5 items GBE—4 items | n.a. | ANOVA |
| [118] 19 | Delafrooz, Goli 2015 | Green Brand Image (GBI) Perceived Quality (PQ) Perceived Green Brand Value (PGBV) Brand Credibility (BC) Green Brand Equity (GBE) | 23 items in 5-point Likert scale: PQ—5 items BC—6 items GBI—4 items PGBV—4 items GBE—4 items | PQ → GBI (+): 0.16 PQ → PGBV (−): 0.05 PQ → BC (+): 0.34 BC → PGBV (+): 0.61 BC → GBI (+): 0.35 BC → GBE (−) 0.02 PGBV → GBE (+): 0.15 GBI → GBE (+): 0.33 | SEM: χ2/df = 2.64; GFI = 0.92; RMSEA = 0.06; NFI = 0.94; CFI = 0.95; IFI = 0.95; RMR = 0.04 |
| [115] 20 | Konuk, 2015 | Green Satisfaction (GS) Green Trust (GT) Green Purchase Intention (GPI) WOM Intention (WOM) Willingness to Pay Premium (WTP) Green Brand Equity (GBE) | 21 items in 5-point Likert scale: GS—4 items GT—4 items GBE—4 items GPI—3 items WOM—3 items WTP—3 items | Turkey and GS → GT (+/+/+): 0.81/0.77/0.78 GS → GBE (+/+/+): 0.54/0.47/0.28 GT → GBE (+/+/+): 0.25/0.39/0.62 GT → GPI: (+/+/+): 0.40/0.60/0.55 GT → WOM: (+/+/−): 0.55/0.28/- GT → WTP (+/−/−): 0.16/-/- GBE → GPI (+/+/+): 0.53/0.30/0.33 GBE → WOM (+/+/+): 0.37/0.30/0.33 GBE → WTP (+/+/+): 0.31/0.59/0.51 | CFA: Turkey: loadings: 0.89–0.93; CR = 0.90–0.93; AVE = 0.68–0.80 Finland: loadings: 0.77–0.91; CR = 0.77–0.90; AVE = 0.53–0.78 Pakistan: loadings: 0.77–0.83; CR = 0.77–0.90; AVE = 0.46–0.63 SEM: Turkey: χ2/df = 3.1; cFI = 0.94; IFI = 0.94 RMSEA = 0.08 Finland: χ2/df = 3.2; cFI = 0.90; IFI = 0.90 RMSEA = 0.09 Pakistan: χ2/df = 1.95; cFI = 0.92; IFI = 0.92 RMSEA = 0.07 |
| [113] 21 | Chang, Chen, 2014 | Green Perceived Quality (GPQ) Green Perceived Risk (GPR) Green Brand Awareness (GBA) Green Brand Equity (GBE) | 19 items in 5-point Likert scale: GPQ—5 items GBA—5 items GPR—5 items GBE—4 items | GPG → GPR (+): −0.327 GBA → GPR (+): −0.303 GPR → GBE (+): −0.284 GPQ → GBE (+): 0.316 GBA → GBE (+): 0.283 | CFA: Loadings: 0.819–0.924; AVE = 0.730–0.737 SEM: χ2/df = 2.012; GFI = 0.887; NFI = 0.902; CFI = 0.906; RMSEA = 0.051 |
| [121] 22 | Pechyiam, Jaroenwanit, 2014 | Green Brand Image (GBI) Green Brand Perceived Value (GBPV) Green Brand Trust (GBT) Green Brand Loyalty (GBL) Green Brand Equity (GBE) | 25 items in 5-point Likert scale: GBI—6 items GBPV—6 items GBT—5 items GBL—4 items GBE—4 items | GBI, GBPV, GBT, GBL → GBE (+) Standardized regression coefficients (Beta) GBL = 0343 GBT = 0.267 GBPV = 0.129 GBI = 0.096 | Regression Analysis R2= 0.508 GBE = 0.424 + 0.097 × GBI + 0.129 × GBPV + 0.289 × GBT + 0.365 × GBL |
| [120] 23 | Ng, Butt, Khong, Ong, 2014 | Perceived Quality of Brand (BQ) Green Brand Perceived Value (GBPV) Brand Credibility (BC) Green Brand Image (GBI) Green Brand Equity (GBE) | 19 items in 7-point Likert scale: BQ—4 items GBI—4 items BC—5 items GBPV—3 items GBE—3 items | BQ → GBI (+): 0.361 BQ → GBPV (−): 0.180 BQ → BC (+): 0.478 BC → GBPV (+): 0.342 BC → GBI (+): 0.282 BC → GBE (−): 0.028 GBPV → GBE (+): 0.331 GBI → GBE (+): 0.352 | EFA: loadings: 0.462–0.879, variance explained = 67.55% CFA loadings: 0.492–0.910; CR = 0.735–0.861; AVE = 0.505–0.611 SEM: χ2/df = 1.447; CFI = 0.916; IFI = 0.919 RMSEA = 0.068 |
| [119] 32 | Namkung, Jang 2013 | Perceived Quality (PQ) Green Brand Image (GBI) Green Behavioral Intention (GBIn) Health consciousness (HC) Environmental consciousness (EC) Brand Equity (GBE) | 13 items in 7-point Likert scale: PQ—3 items GBI—3 items GBIn—3 items HC—2 items EC—2 items | Hypothesis n/a Division of restaurant practices into 3 types: green practices focused on food, environment, or no green practices) in accordance with type of restaurant | Mean analysis |
| [122] 24 | Kang, Hur, 2012 | Green Satisfaction (GS) Green Trust (GT) Green Affect (GA) Green Loyalty (GL) Green Brand Equity (GBE) | 15 items in 7-point Likert scale: GS—3 items GT—3 items GA—3 items GL—3 items GBE—3 items | GS → GL (+): 0.72 GS → GT (+): 0.13 GS → GA (+): 0.63 GT → GL (+): 0.21 GA → GL (+): 0.71 GL → GBE (+): 0.50 | CFA: loadings: 0.71–0.94; AVE = 0.62–0.74; CR = 0.77–0.92 SEM: χ2/df = 3.71; GFI = 0.91; CFI = 0.98; NFI = 0.97; RMSEA = 0.08, SRMR = 0.07 |
| [7] 25 | Mourad, 2012 | Green Brand Image (GBI) Green Brand Satisfaction (GBS) Green Brand Trust (GBT) Green Brand Awareness (GBA) Green Brand Preference (GBP) Green Brand Equity (GBE) | 23 items in 5-point Likert scale: GBI—5 items GBS—4 items GBT—5 items GBA—5 items GBP—4 items | GBI → GBP (+) GBS → GBP (+) GBT → GBP (+) GBA → GBP (−) | Regression Analysis R2= 0.508 GBP as GBE = 1.379 + 0.101 × GBI + 0.143 × GBS + 0.152 × GBT |
| [76] 26 | Chen, 2010 | Green Brand Image (GBI) Green Satisfaction (GS) Green Trust (GT) Green Brand Equity (GBE) | 16 items in 5-point Likert scale: GBI—5 items GS—4 items GT—5 items GBE—4 items | GBI → GS (+): 0.266 GBI → GT (+): 0.297 GBI → GBE (+): 0.294 GS → GBE (+): 0.238 GT → GBE (+): 0.203 | CFA: loadings: 0.771–0.911; AVE = 0.641–0.734 SEM: GFI = 0.880; CFI = 0.906; NFI = 0.902; RMSEA = 0.058 |
| [116] 27 | Adnan, Naveed, Ahmad, Hamid, 2006 | Green Brand Credibility (GBC) Green Brand Attitude (GBA) Green Brand Equity (GBE) | 26 items in 5-point Likert scale: GBC—20 items GBA—3 items GBE—3 items | GBC → GBE (+): 0.27 GBC → GBA (+): 0.201 GBA → GBE (+): 0.124 GBA → GBE and GBC (+): 0.129 | CFA: loadings: 0.609–0.871; AVE = 0.593–0.647; CR = 0.758–0.861 SEM: χ2/df = 1.421; GFI = 0.933; CFI = 0.924; NFI = 0.937; AGFI = 0.921; TLI = 0.871; RMSEA = 0.043, RMR = 0.041 |
| Factor/Variable | Variants of Factors/Variables | Factor/Variable Frequency |
|---|---|---|
| Image | 21 | |
| green brand image | 20 | |
| green image | 1 | |
| Trust | 20 | |
| green trust | 12 | |
| green brand trust | 7 | |
| consumer trust | 1 | |
| Value | 15 | |
| green brand perceived value | 3 | |
| consumer environmental values | 1 | |
| customer value | 1 | |
| green altruistic value | 1 | |
| altruistic value | 1 | |
| green brand value | 1 | |
| green customer value | 1 | |
| green hedonic value | 1 | |
| special green brand value | 1 | |
| green social value | 1 | |
| green utilitarian value | 1 | |
| green perceived value | 1 | |
| perceived green brand value | 1 | |
| Satisfaction | 13 | |
| green satisfaction | 8 | |
| green brand satisfaction | 4 | |
| green customer satisfaction | 1 | |
| Loyalty | 11 | |
| green brand loyalty | 3 | |
| green loyalty | 3 | |
| brand loyalty | 2 | |
| green brand attachment | 1 | |
| relationship quality | 1 | |
| green brand relationships | 1 | |
| Purchase | 10 | |
| green purchase intention | 3 | |
| purchase intention | 3 | |
| green brand purchase intention | 2 | |
| green behavioral intention | 1 | |
| behavioral intentions | 1 | |
| Quality | 9 | |
| perceived quality | 4 | |
| green perceived quality | 2 | |
| green brand experiential quality | 1 | |
| perceived quality of brand | 1 | |
| perceived brand quality | 1 | |
| Awareness | 7 | |
| green brand awareness | 3 | |
| brand awareness | 2 | |
| green awareness | 1 | |
| green marketing awareness | 1 | |
| Promotion | 7 | |
| word-of-mouth communication | 3 | |
| green promotion | 2 | |
| communication toleration | 1 | |
| green advertisement | 1 | |
| Attitude | 6 | |
| general attitude | 1 | |
| brand attitude | 1 | |
| consumer attitude | 1 | |
| green brand attitude | 1 | |
| green products attitude | 1 | |
| pro-environmental attitude | 1 | |
| Marketing | 6 | |
| green marketing | 1 | |
| green place | 1 | |
| green price | 1 | |
| green product | 1 | |
| price premium | 1 | |
| price tolerance | 1 | |
| Credibility | 5 | |
| brand credibility | 4 | |
| green brand credibility | 1 | |
| Association | 3 | |
| brand association | 2 | |
| green brand associations | 1 | |
| Risk | 3 | |
| green perceived risk | 2 | |
| green brand experiential risk | 1 | |
| Social responsibility | 3 | |
| brand social responsibility | 1 | |
| corporate social responsibility | 1 | |
| social influence | 1 | |
| Greenwashing | 2 | |
| Benefits | 2 | |
| self-expressive benefits | 1 | |
| utilitarian benefits | 1 | |
| Others | each variable occurs once | |
| brand leadership, brand management | ||
| green affect, environmental consciousness | ||
| green claims, health consciousness | ||
| competitive performance, governmental subsidies | ||
| green brand experience, sustainability | ||
| green orientation, green consumer confusion | ||
| green attributes transparency | ||
| willingness to adopt, green brand reciprocity | ||
| green reference group green brand switching intention |


Publisher’s Note: MDPI stays neutral with regard to jurisdictional claims in published maps and institutional affiliations. |
© 2021 by the authors. Licensee MDPI, Basel, Switzerland. This article is an open access article distributed under the terms and conditions of the Creative Commons Attribution (CC BY) license (https://creativecommons.org/licenses/by/4.0/).
Share and Cite
Górska-Warsewicz, H.; Dębski, M.; Fabuš, M.; Kováč, M. Green Brand Equity—Empirical Experience from a Systematic Literature Review. Sustainability 2021, 13, 11130. https://doi.org/10.3390/su132011130
Górska-Warsewicz H, Dębski M, Fabuš M, Kováč M. Green Brand Equity—Empirical Experience from a Systematic Literature Review. Sustainability. 2021; 13(20):11130. https://doi.org/10.3390/su132011130
Chicago/Turabian StyleGórska-Warsewicz, Hanna, Maciej Dębski, Michal Fabuš, and Marián Kováč. 2021. "Green Brand Equity—Empirical Experience from a Systematic Literature Review" Sustainability 13, no. 20: 11130. https://doi.org/10.3390/su132011130
APA StyleGórska-Warsewicz, H., Dębski, M., Fabuš, M., & Kováč, M. (2021). Green Brand Equity—Empirical Experience from a Systematic Literature Review. Sustainability, 13(20), 11130. https://doi.org/10.3390/su132011130