
Targeting Oxidative Stress with Antioxidant Duotherapy after Experimental Traumatic Brain Injury

 , , , , , , and
Abstract
:1. Introduction
2. Results
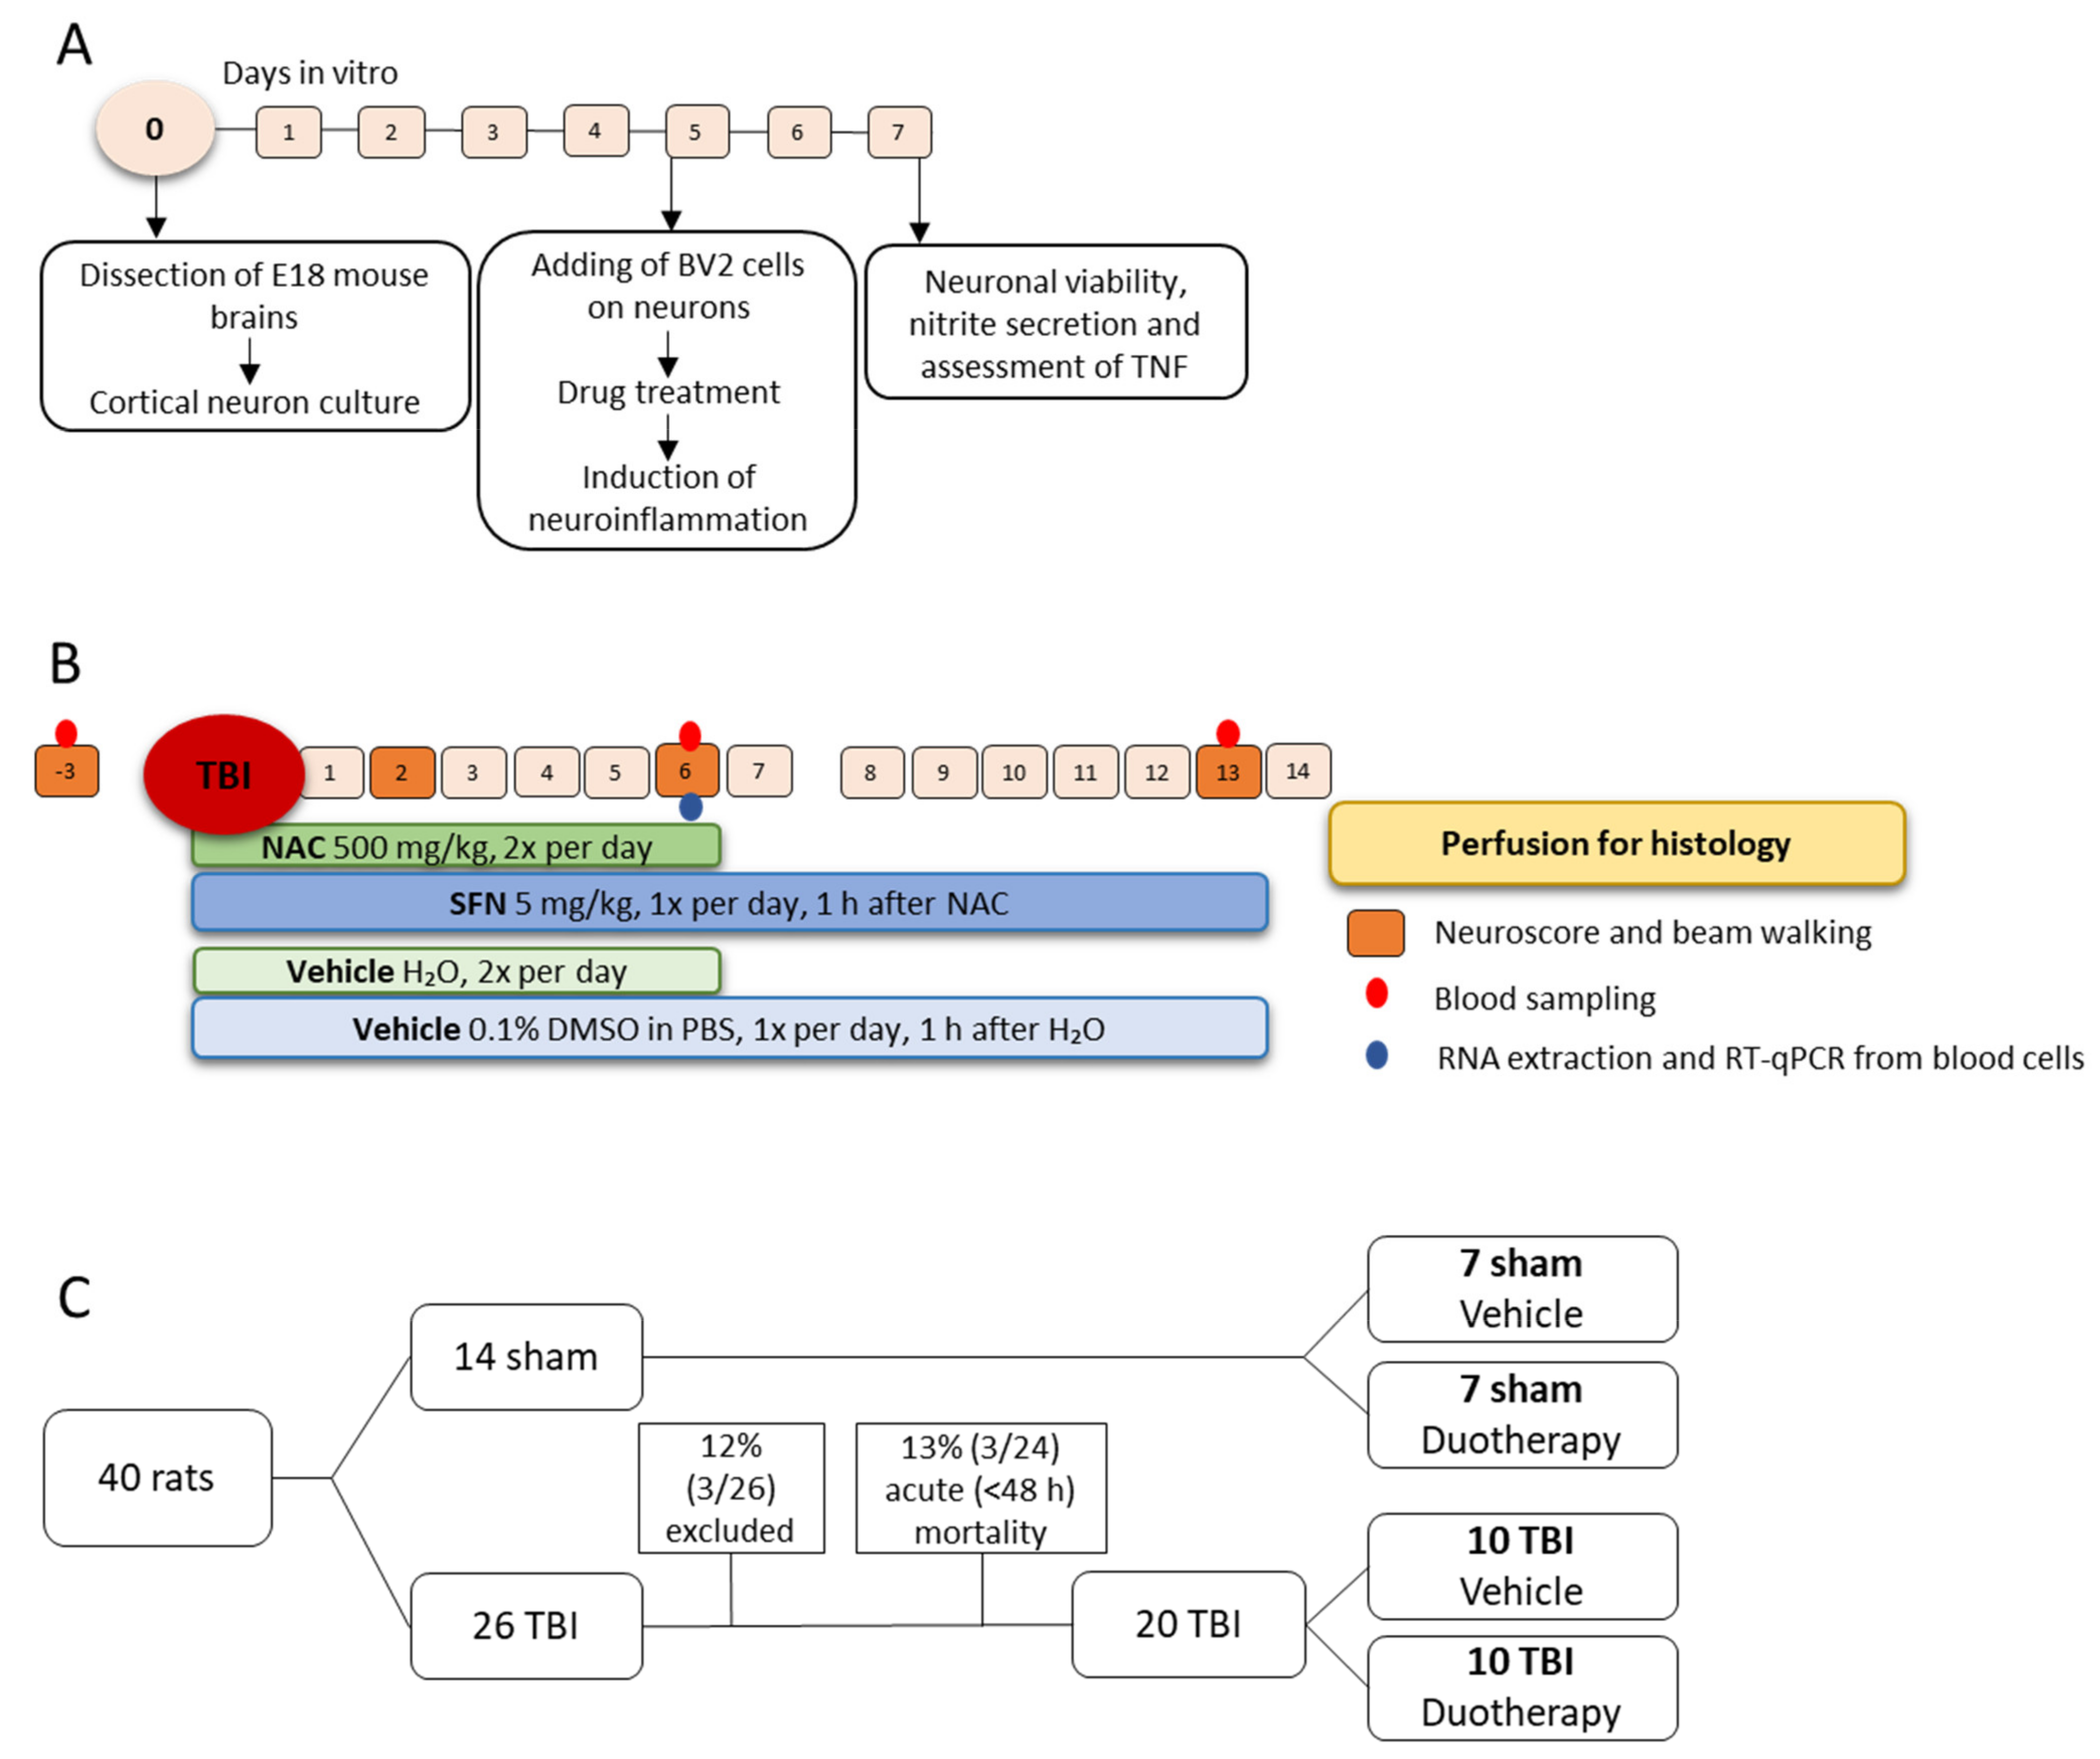
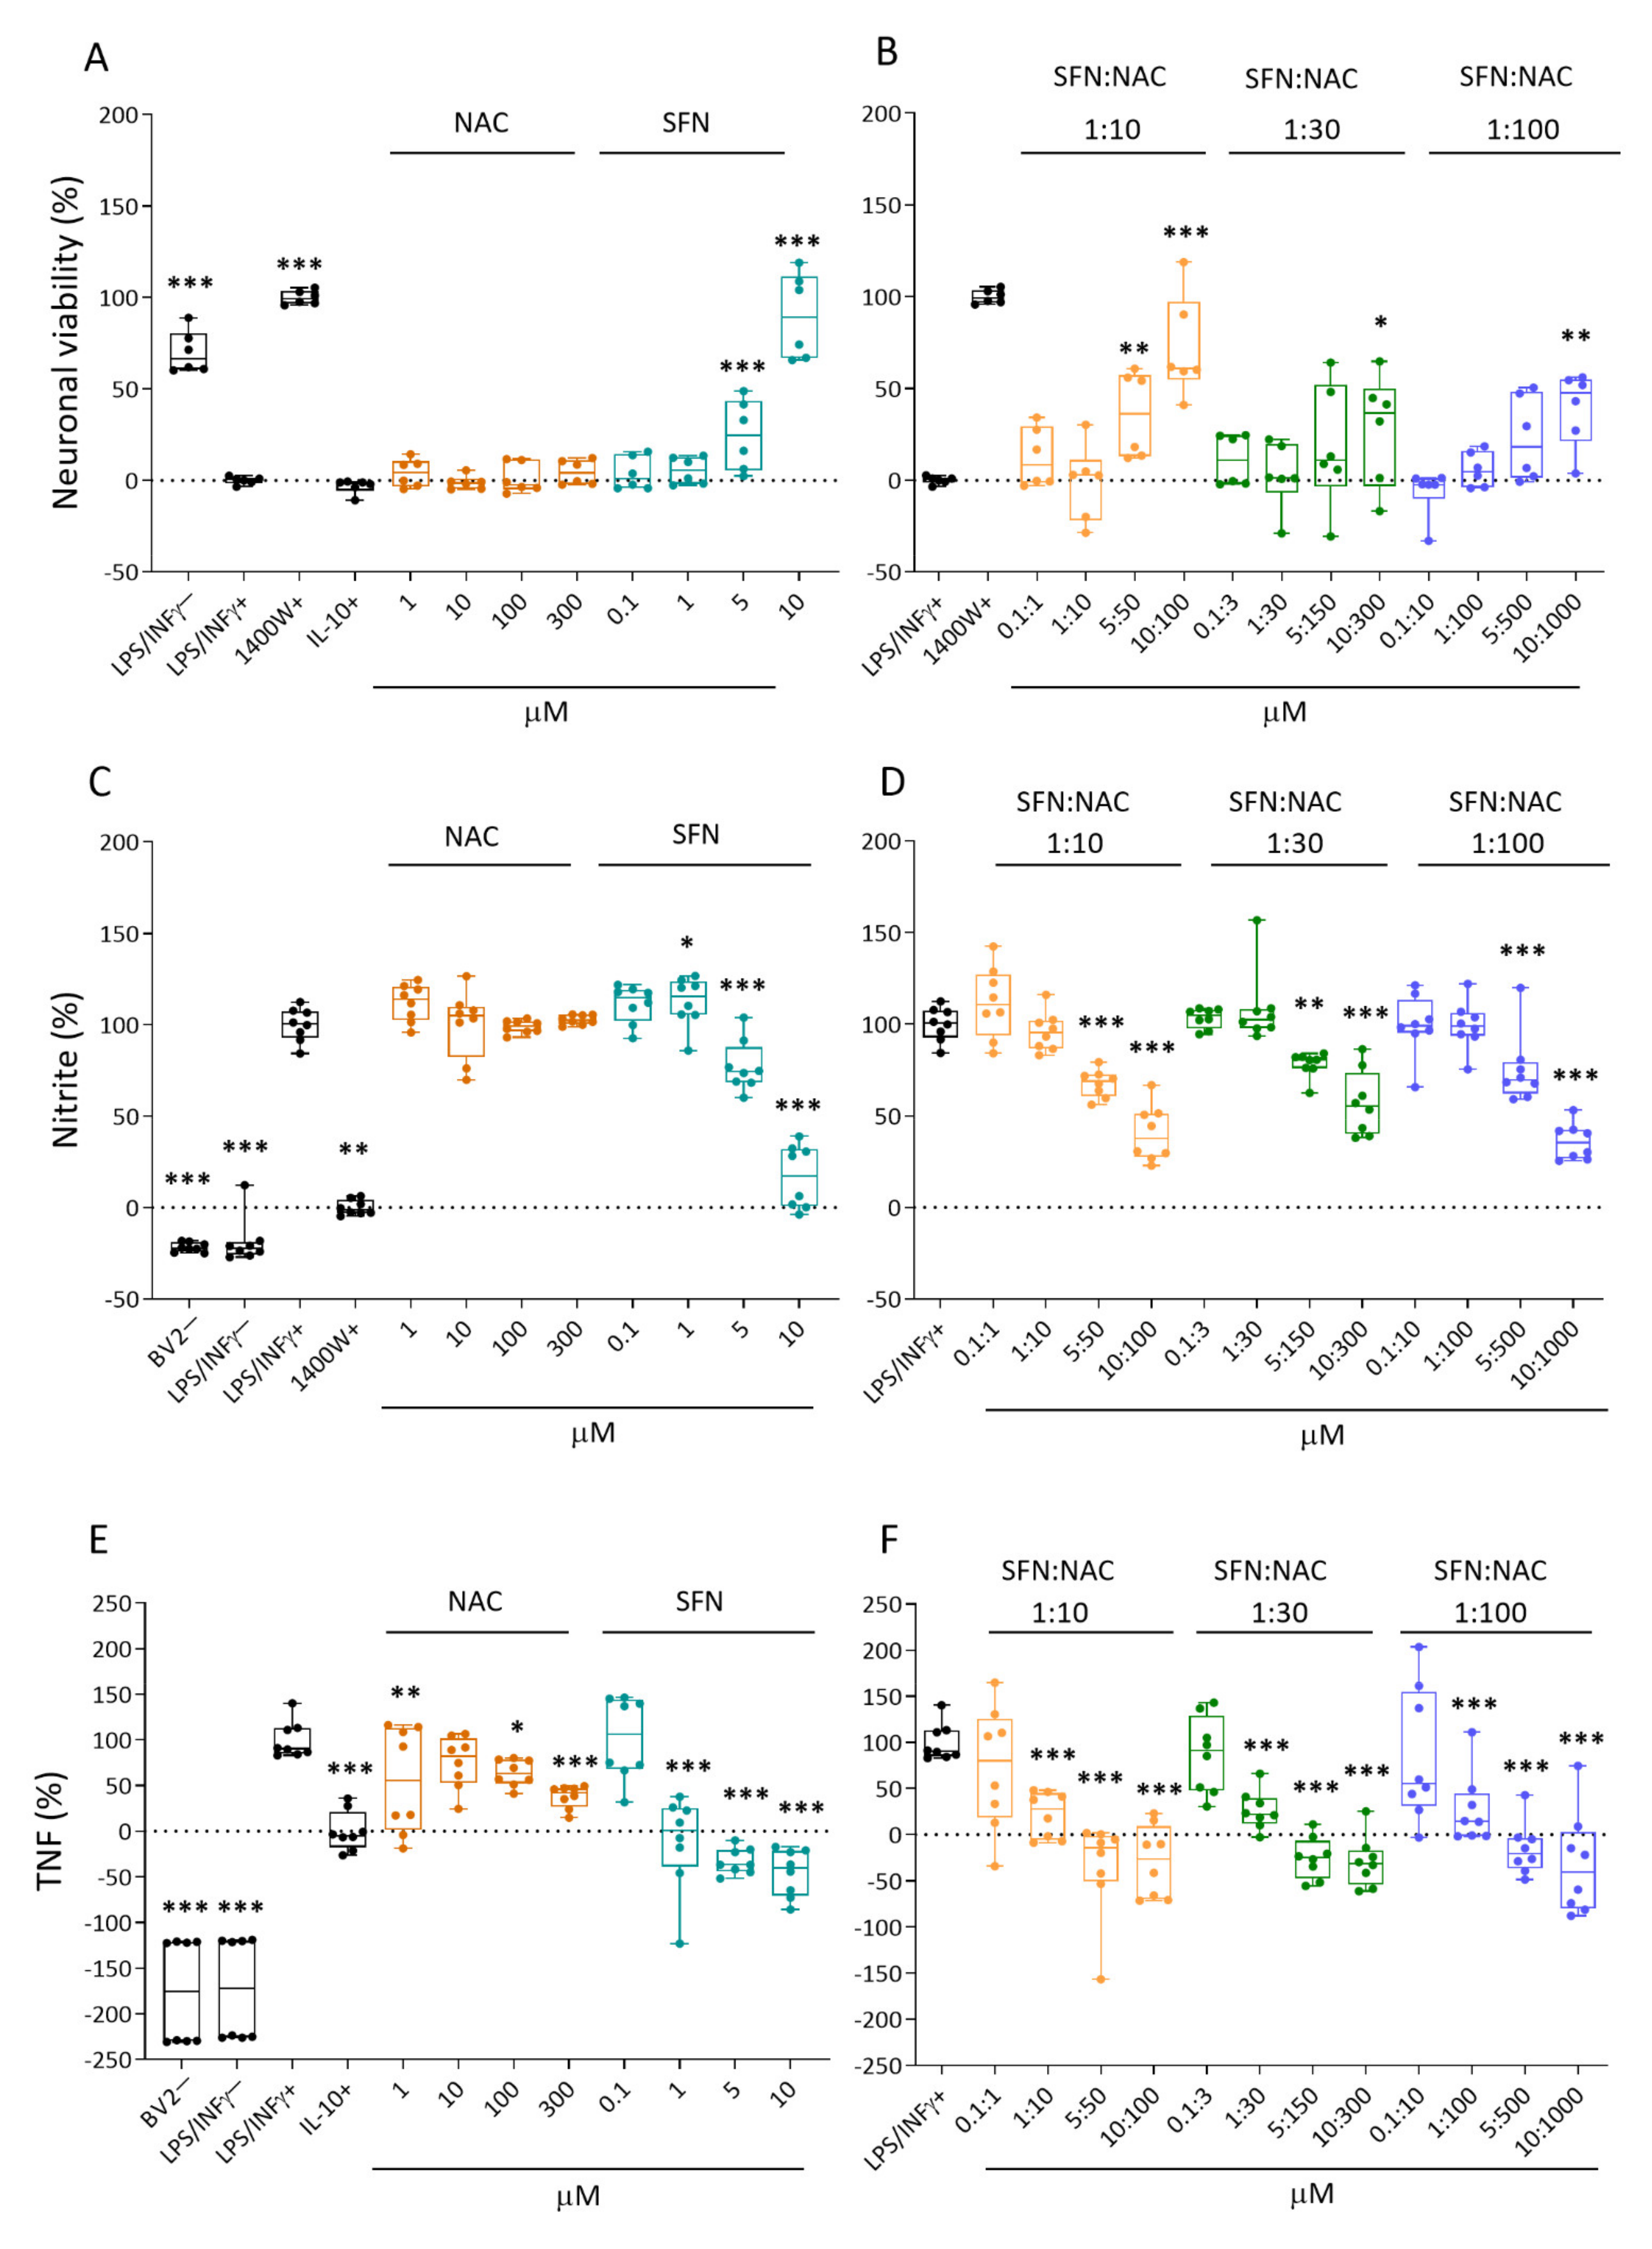
2.1. Effect of Treatments on In Vitro Response Biomarkers
2.1.1. Neuronal Viability
2.1.2. Nitrite Levels
2.1.3. Tumor Necrosis Factor (TNF) Secretion
2.2. In Vivo Efficacy on TBI Outcome
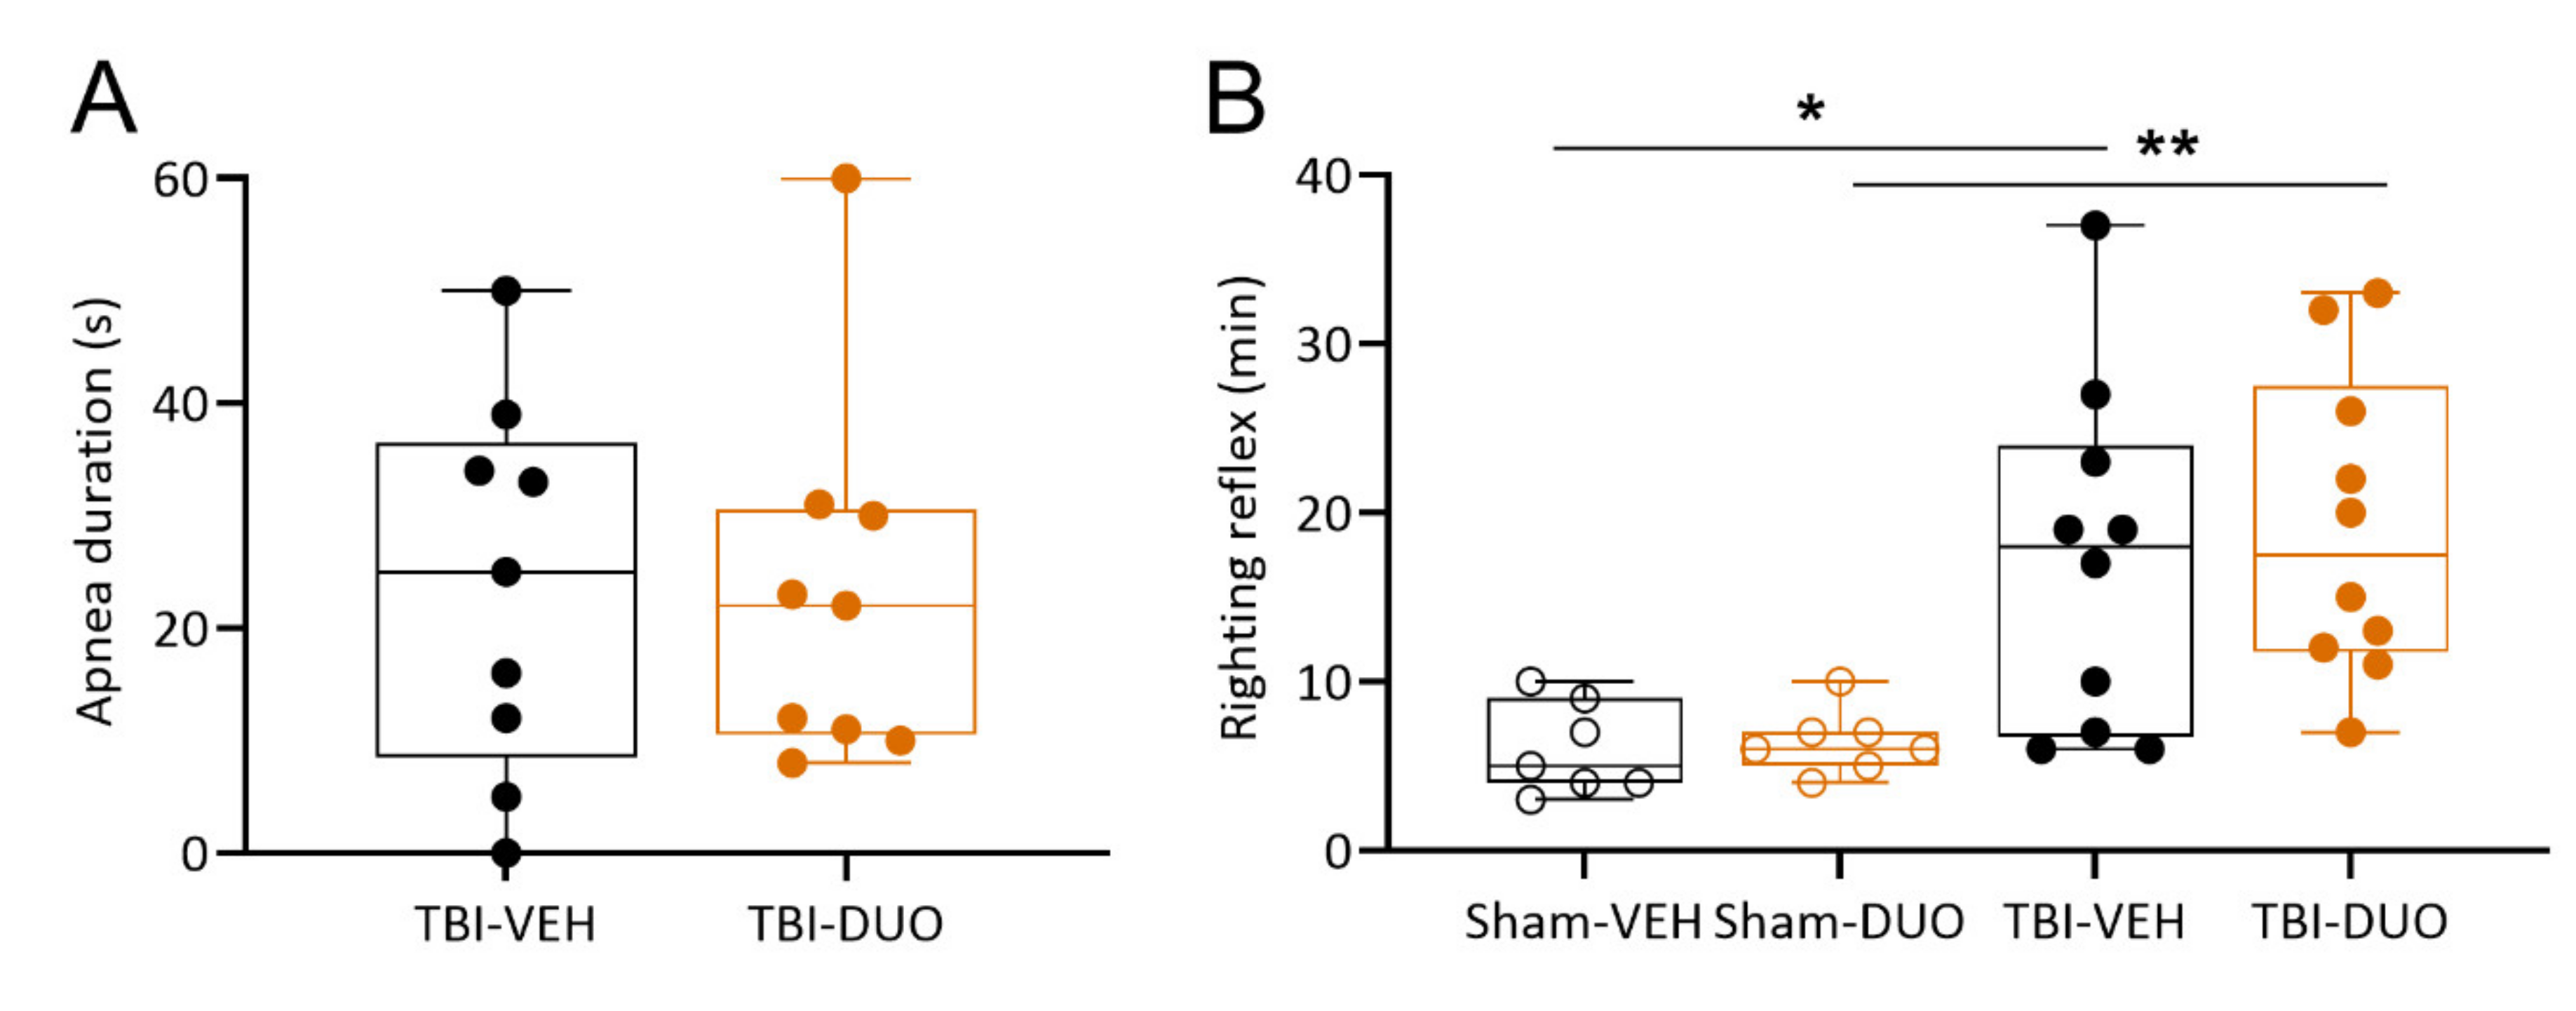
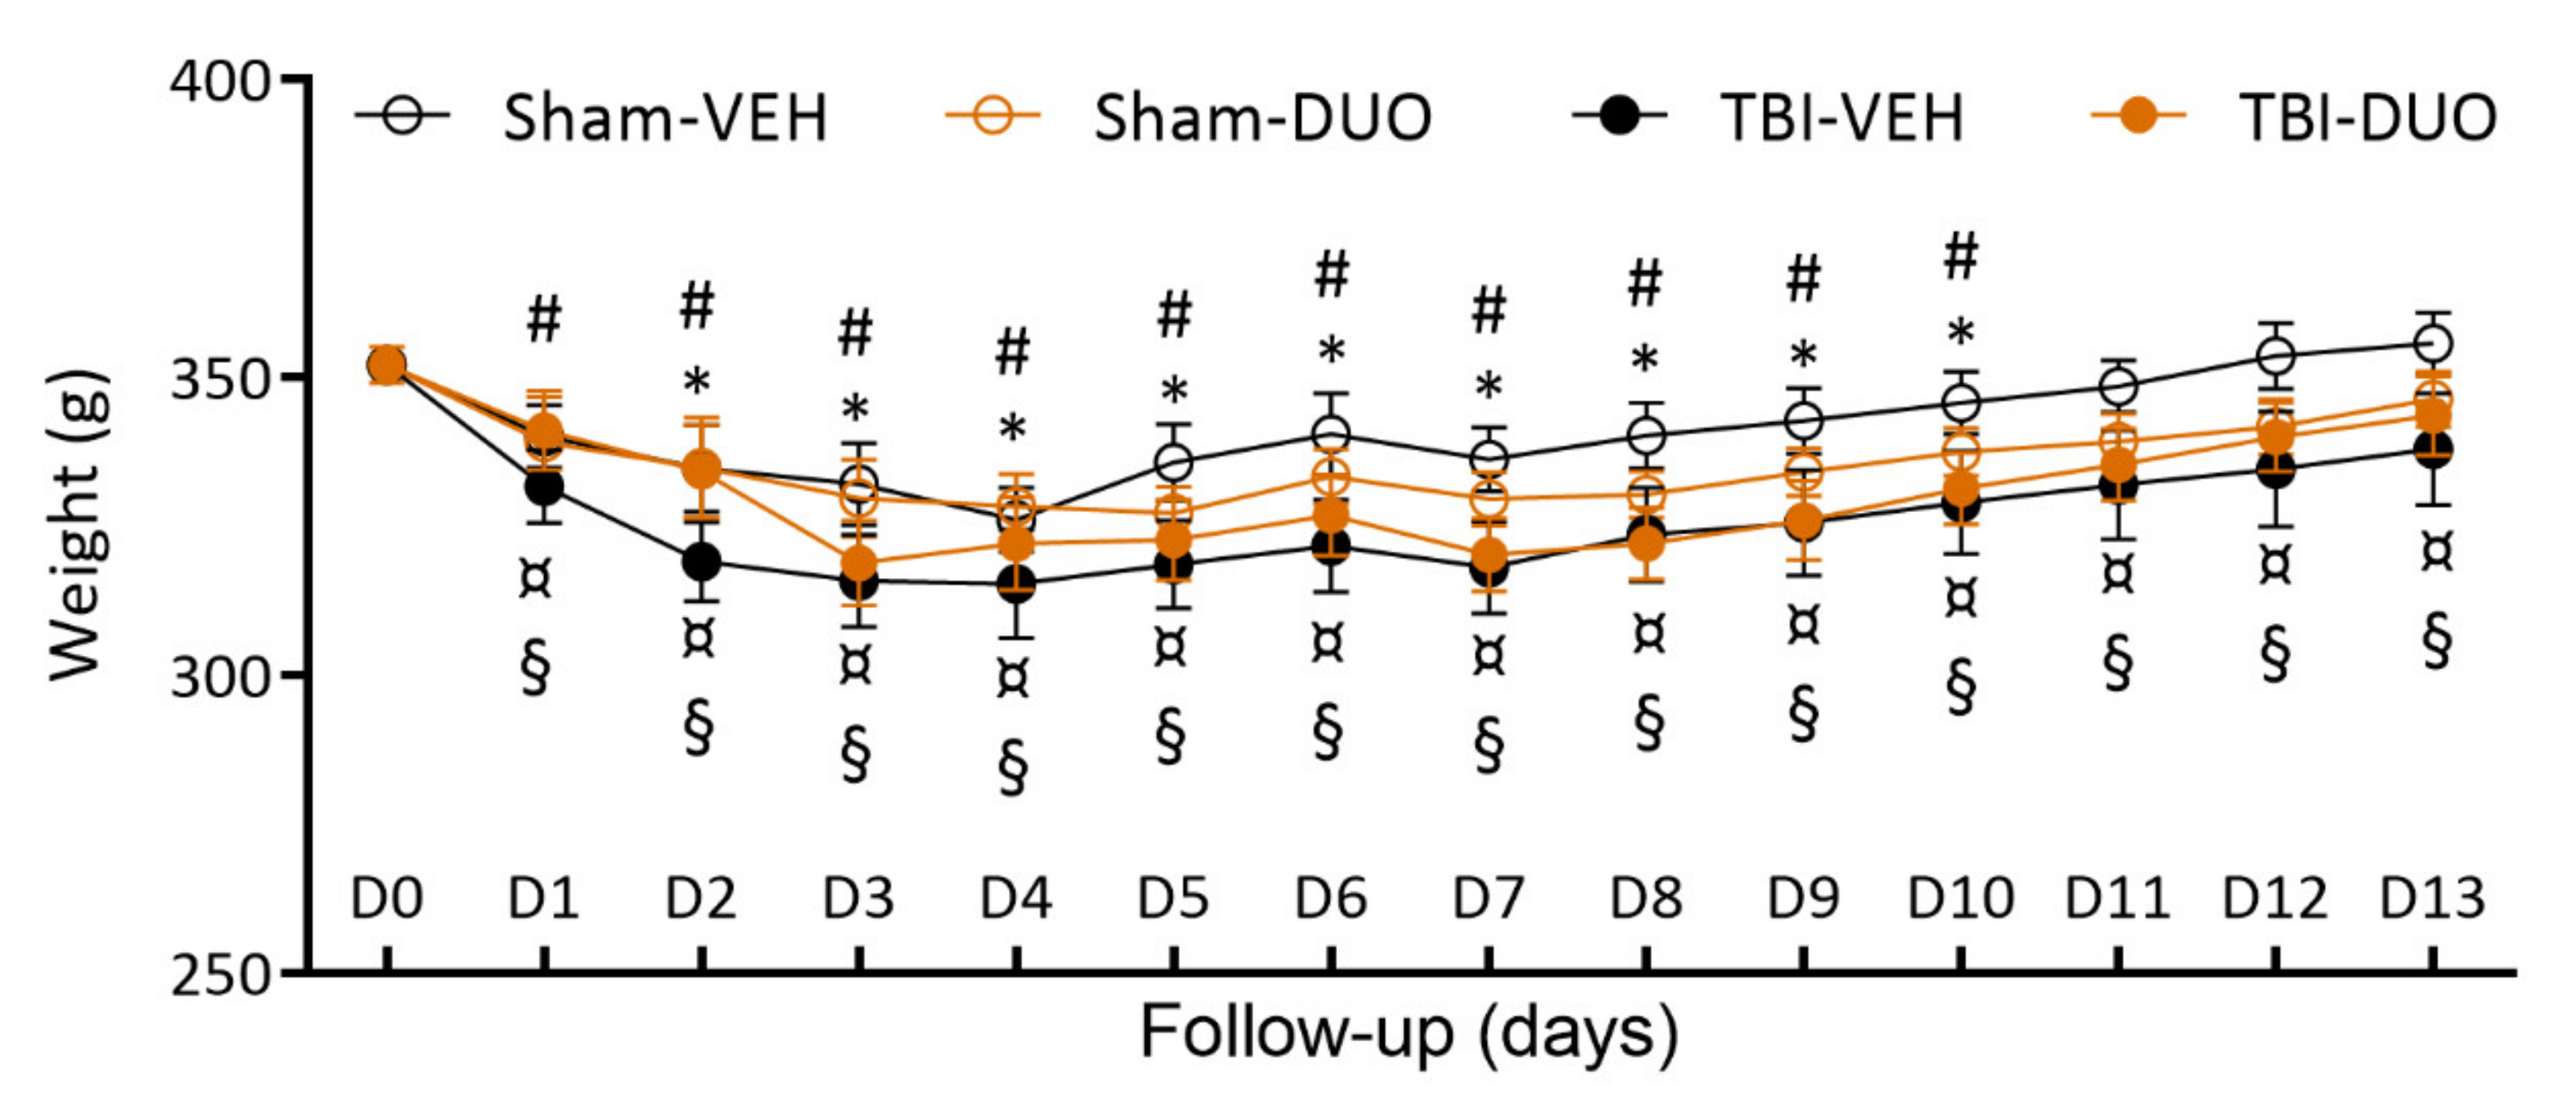
2.2.1. Acute Post-Impact Mortality, Exclusions, Apnea Time, Time to Righting, Occurrence of Acute Seizure-like Behavior and Weight
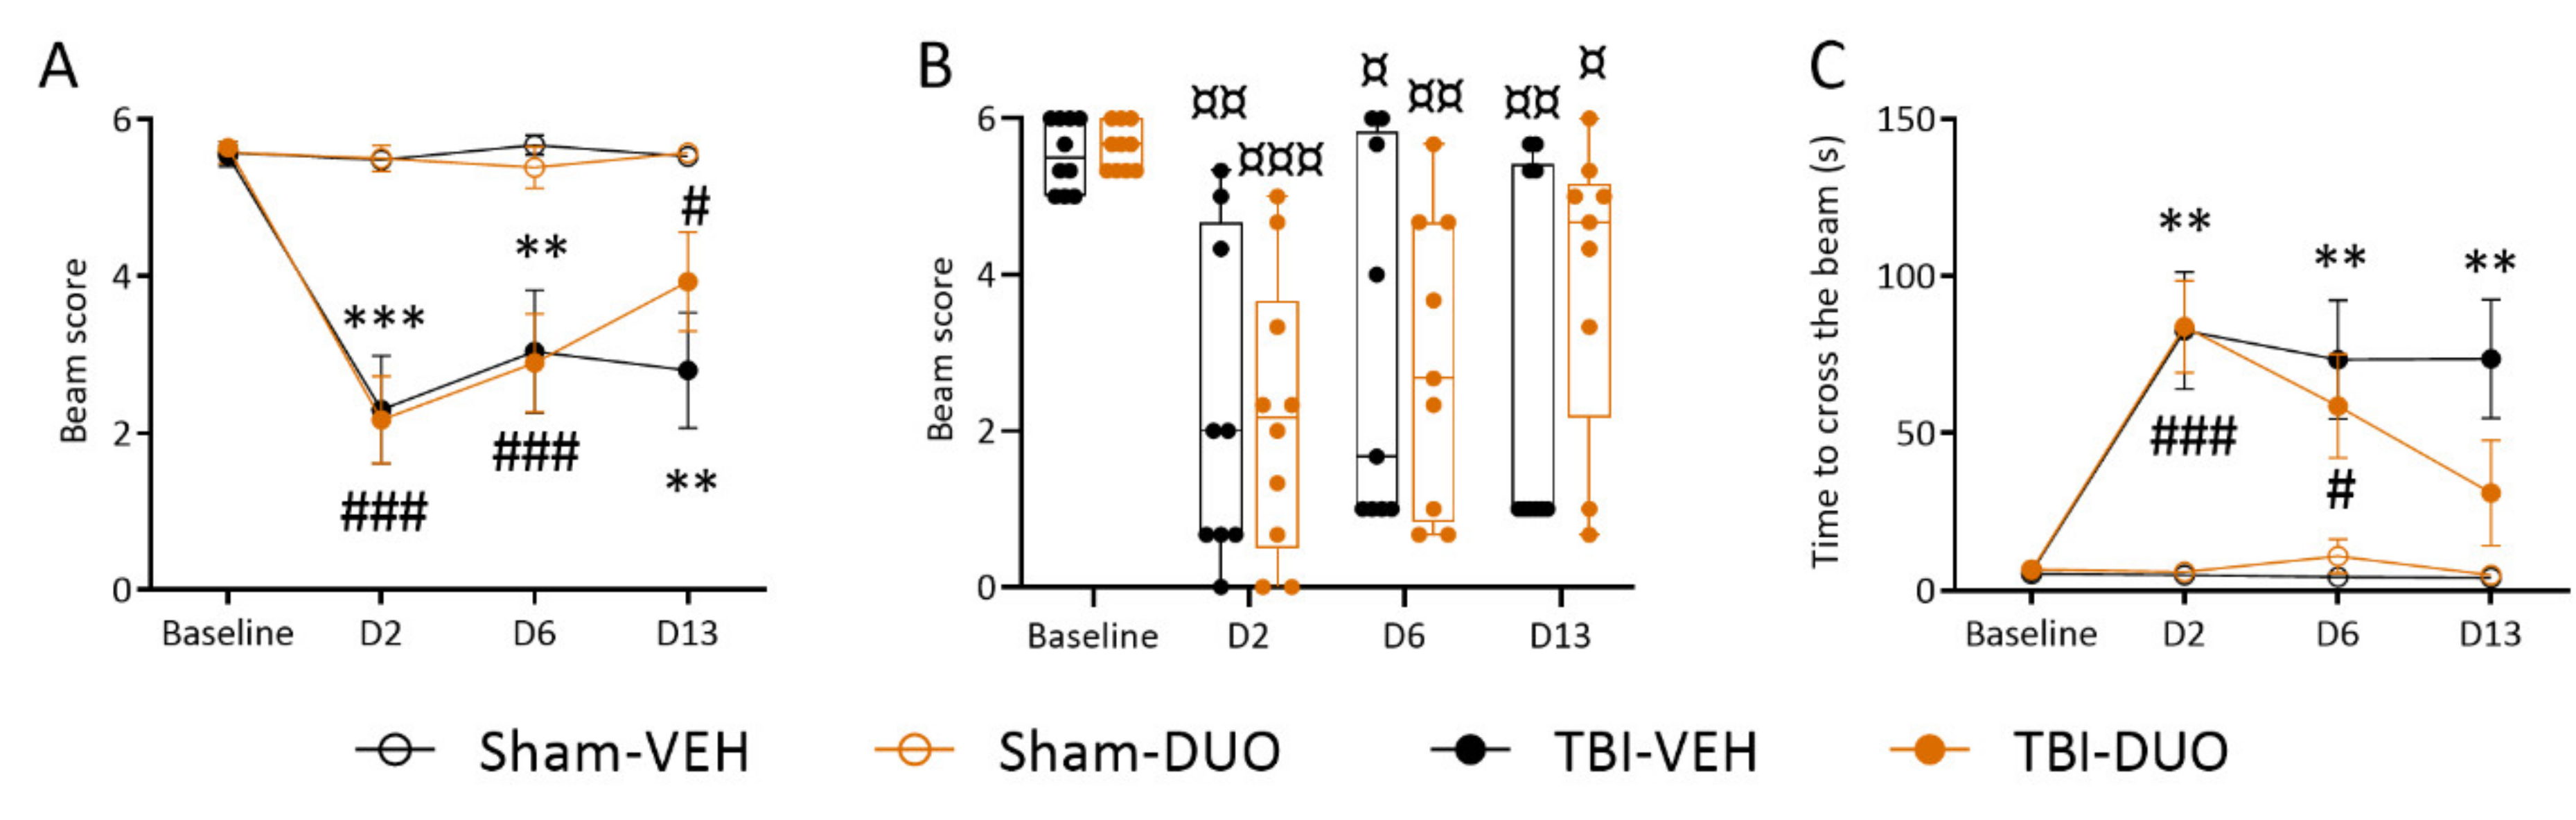
2.2.2. Effect of Treatment on Behavior
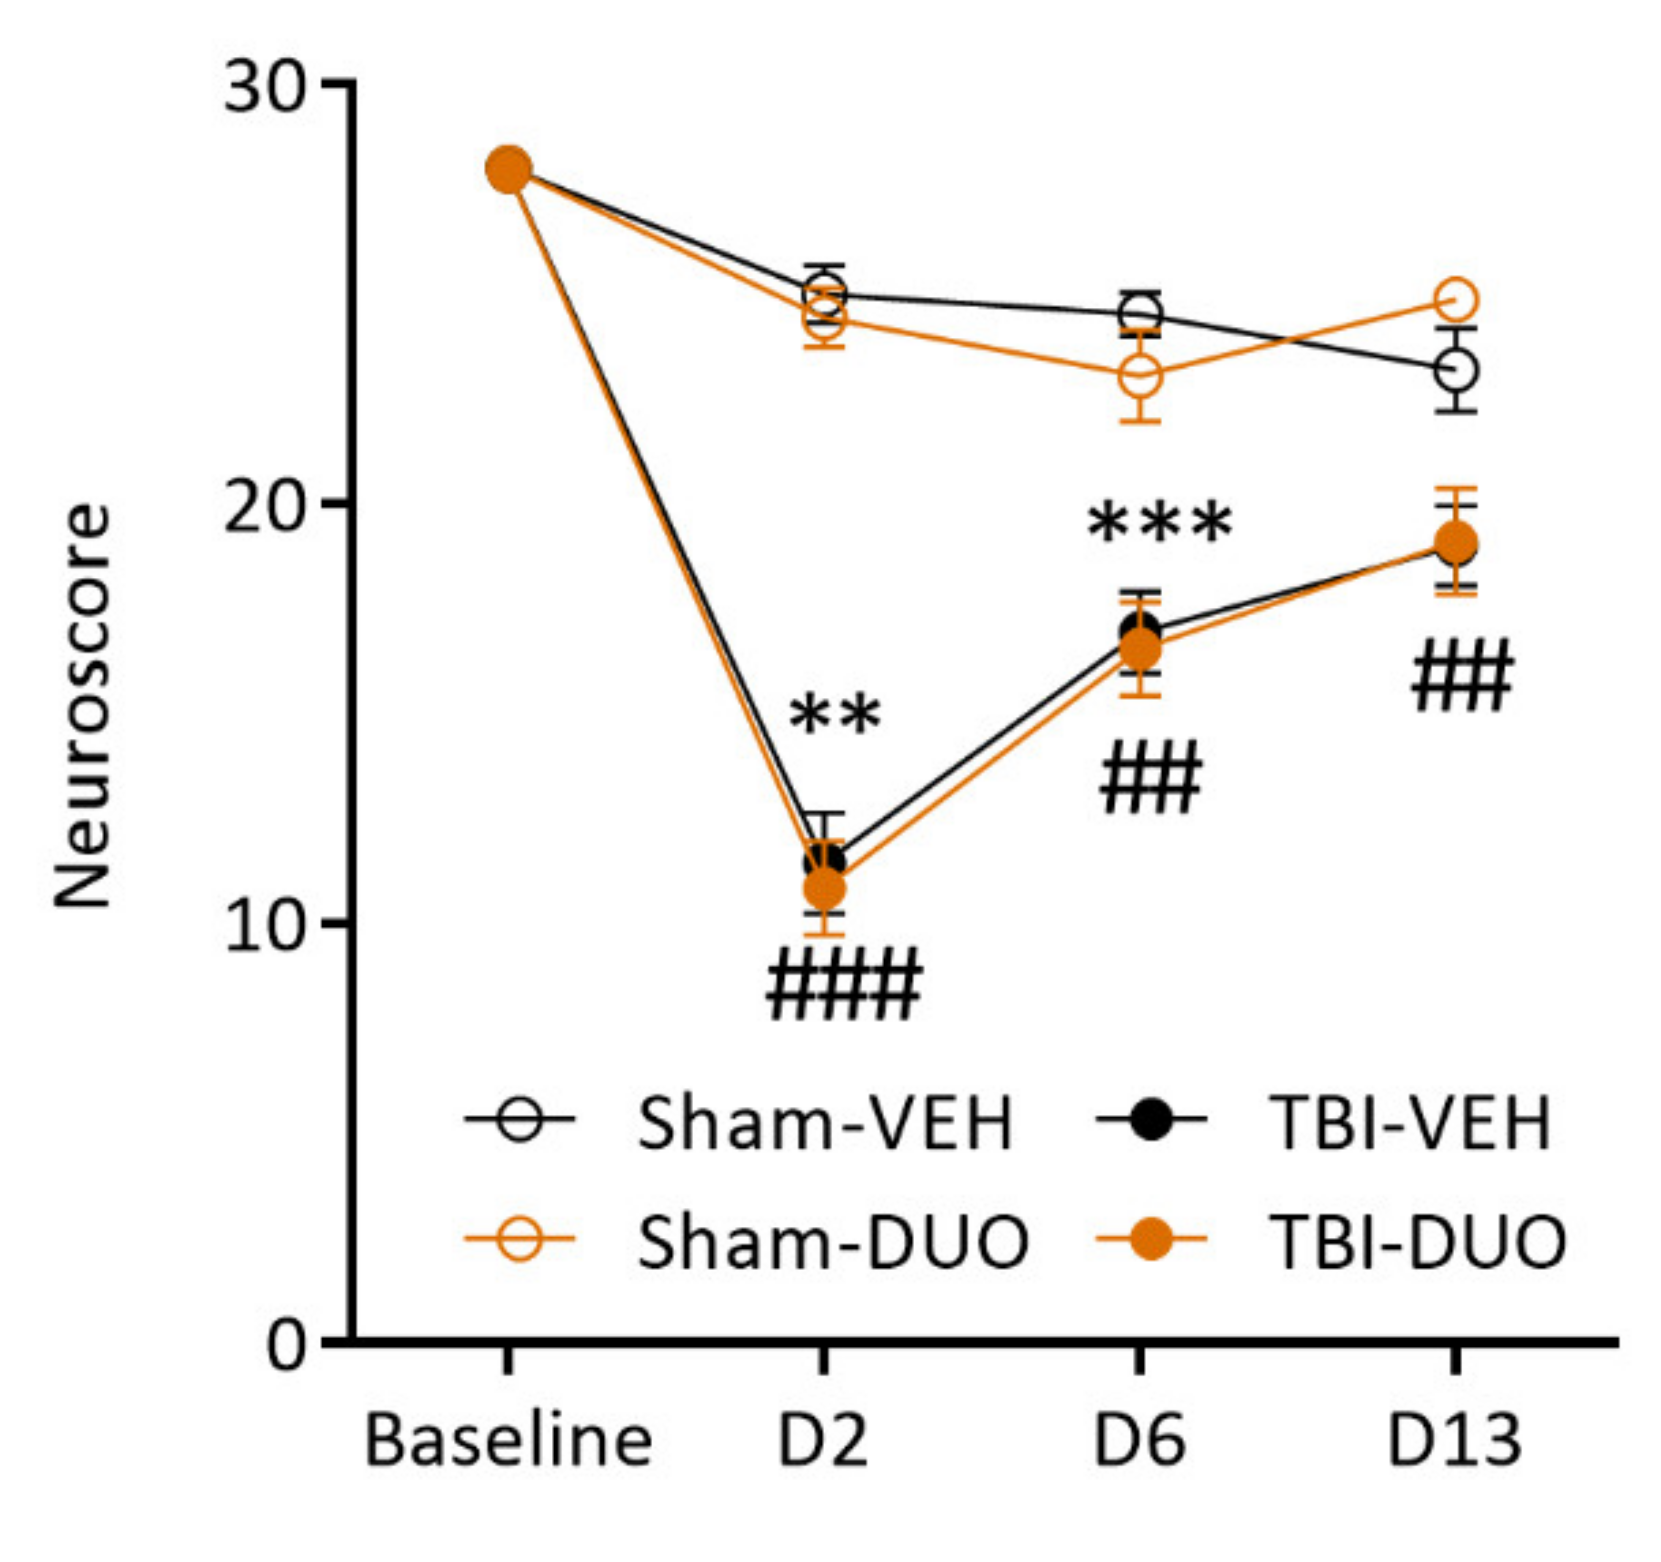
Neuroscore
Beam Walking
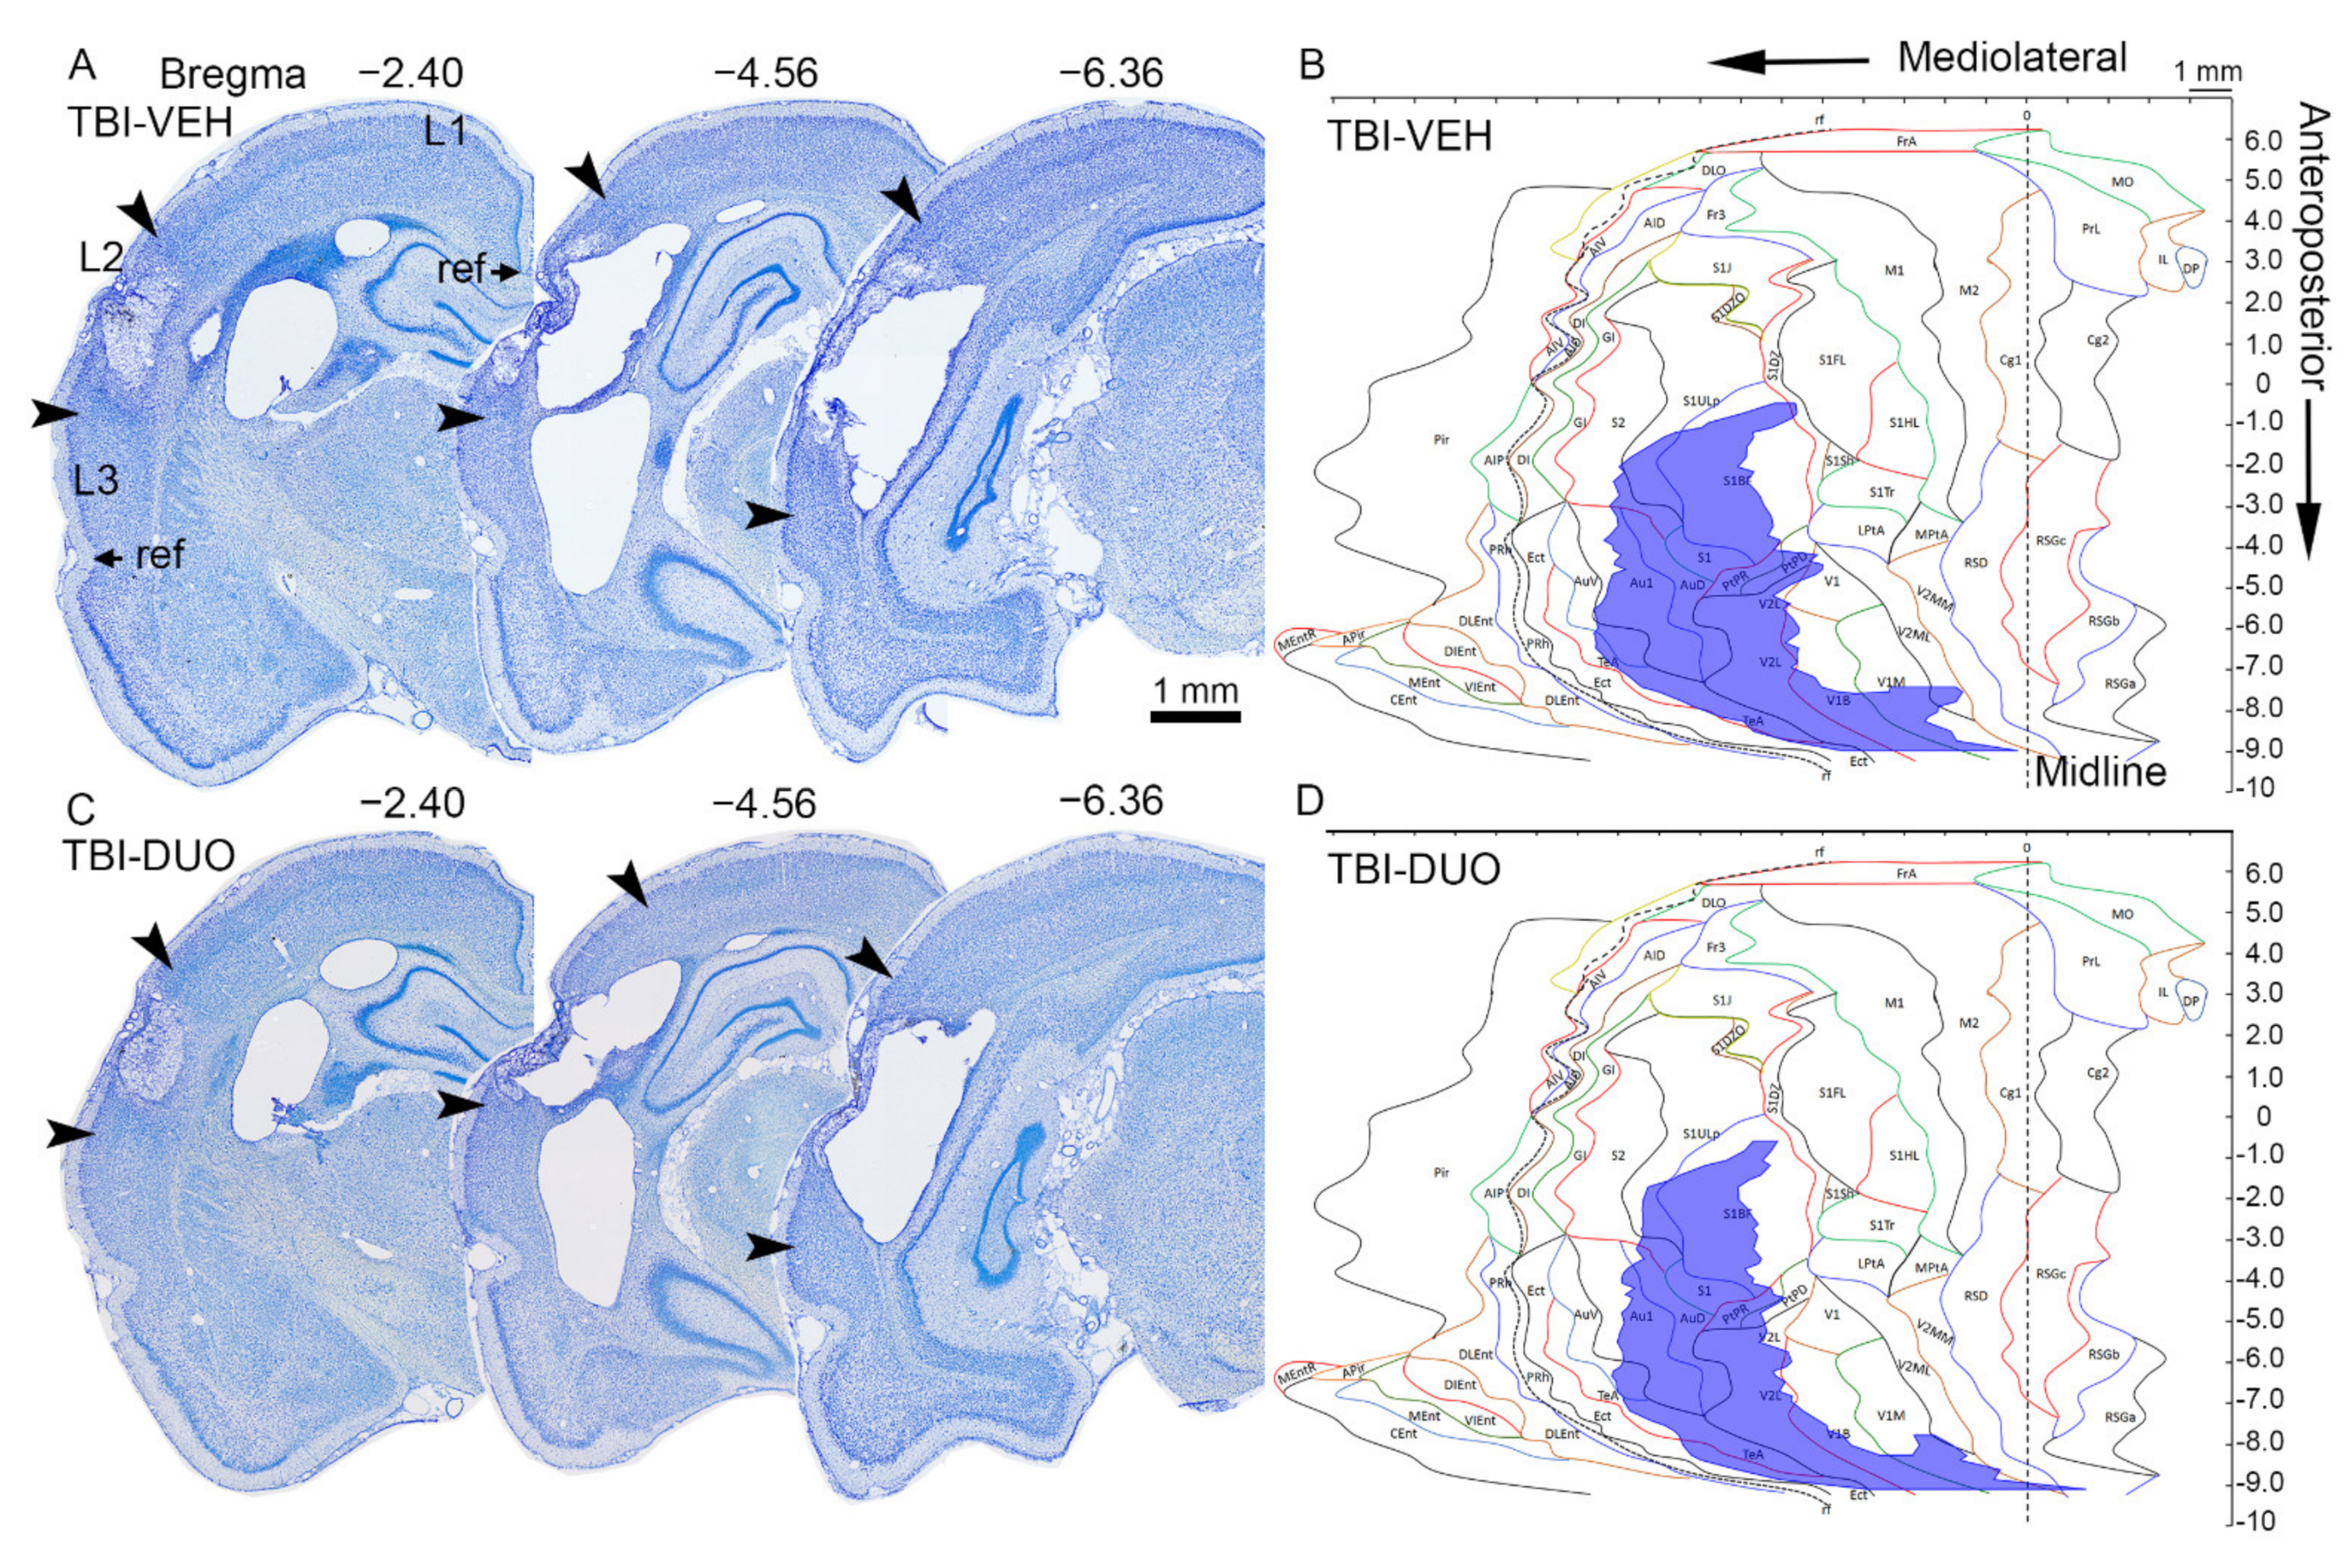
2.2.3. Effect of Treatment on Cortical Lesion Area
2.2.4. Blood Cell, Plasma, and Brain Tissue Response Biomarkers
Blood Cells
Plasma Markers
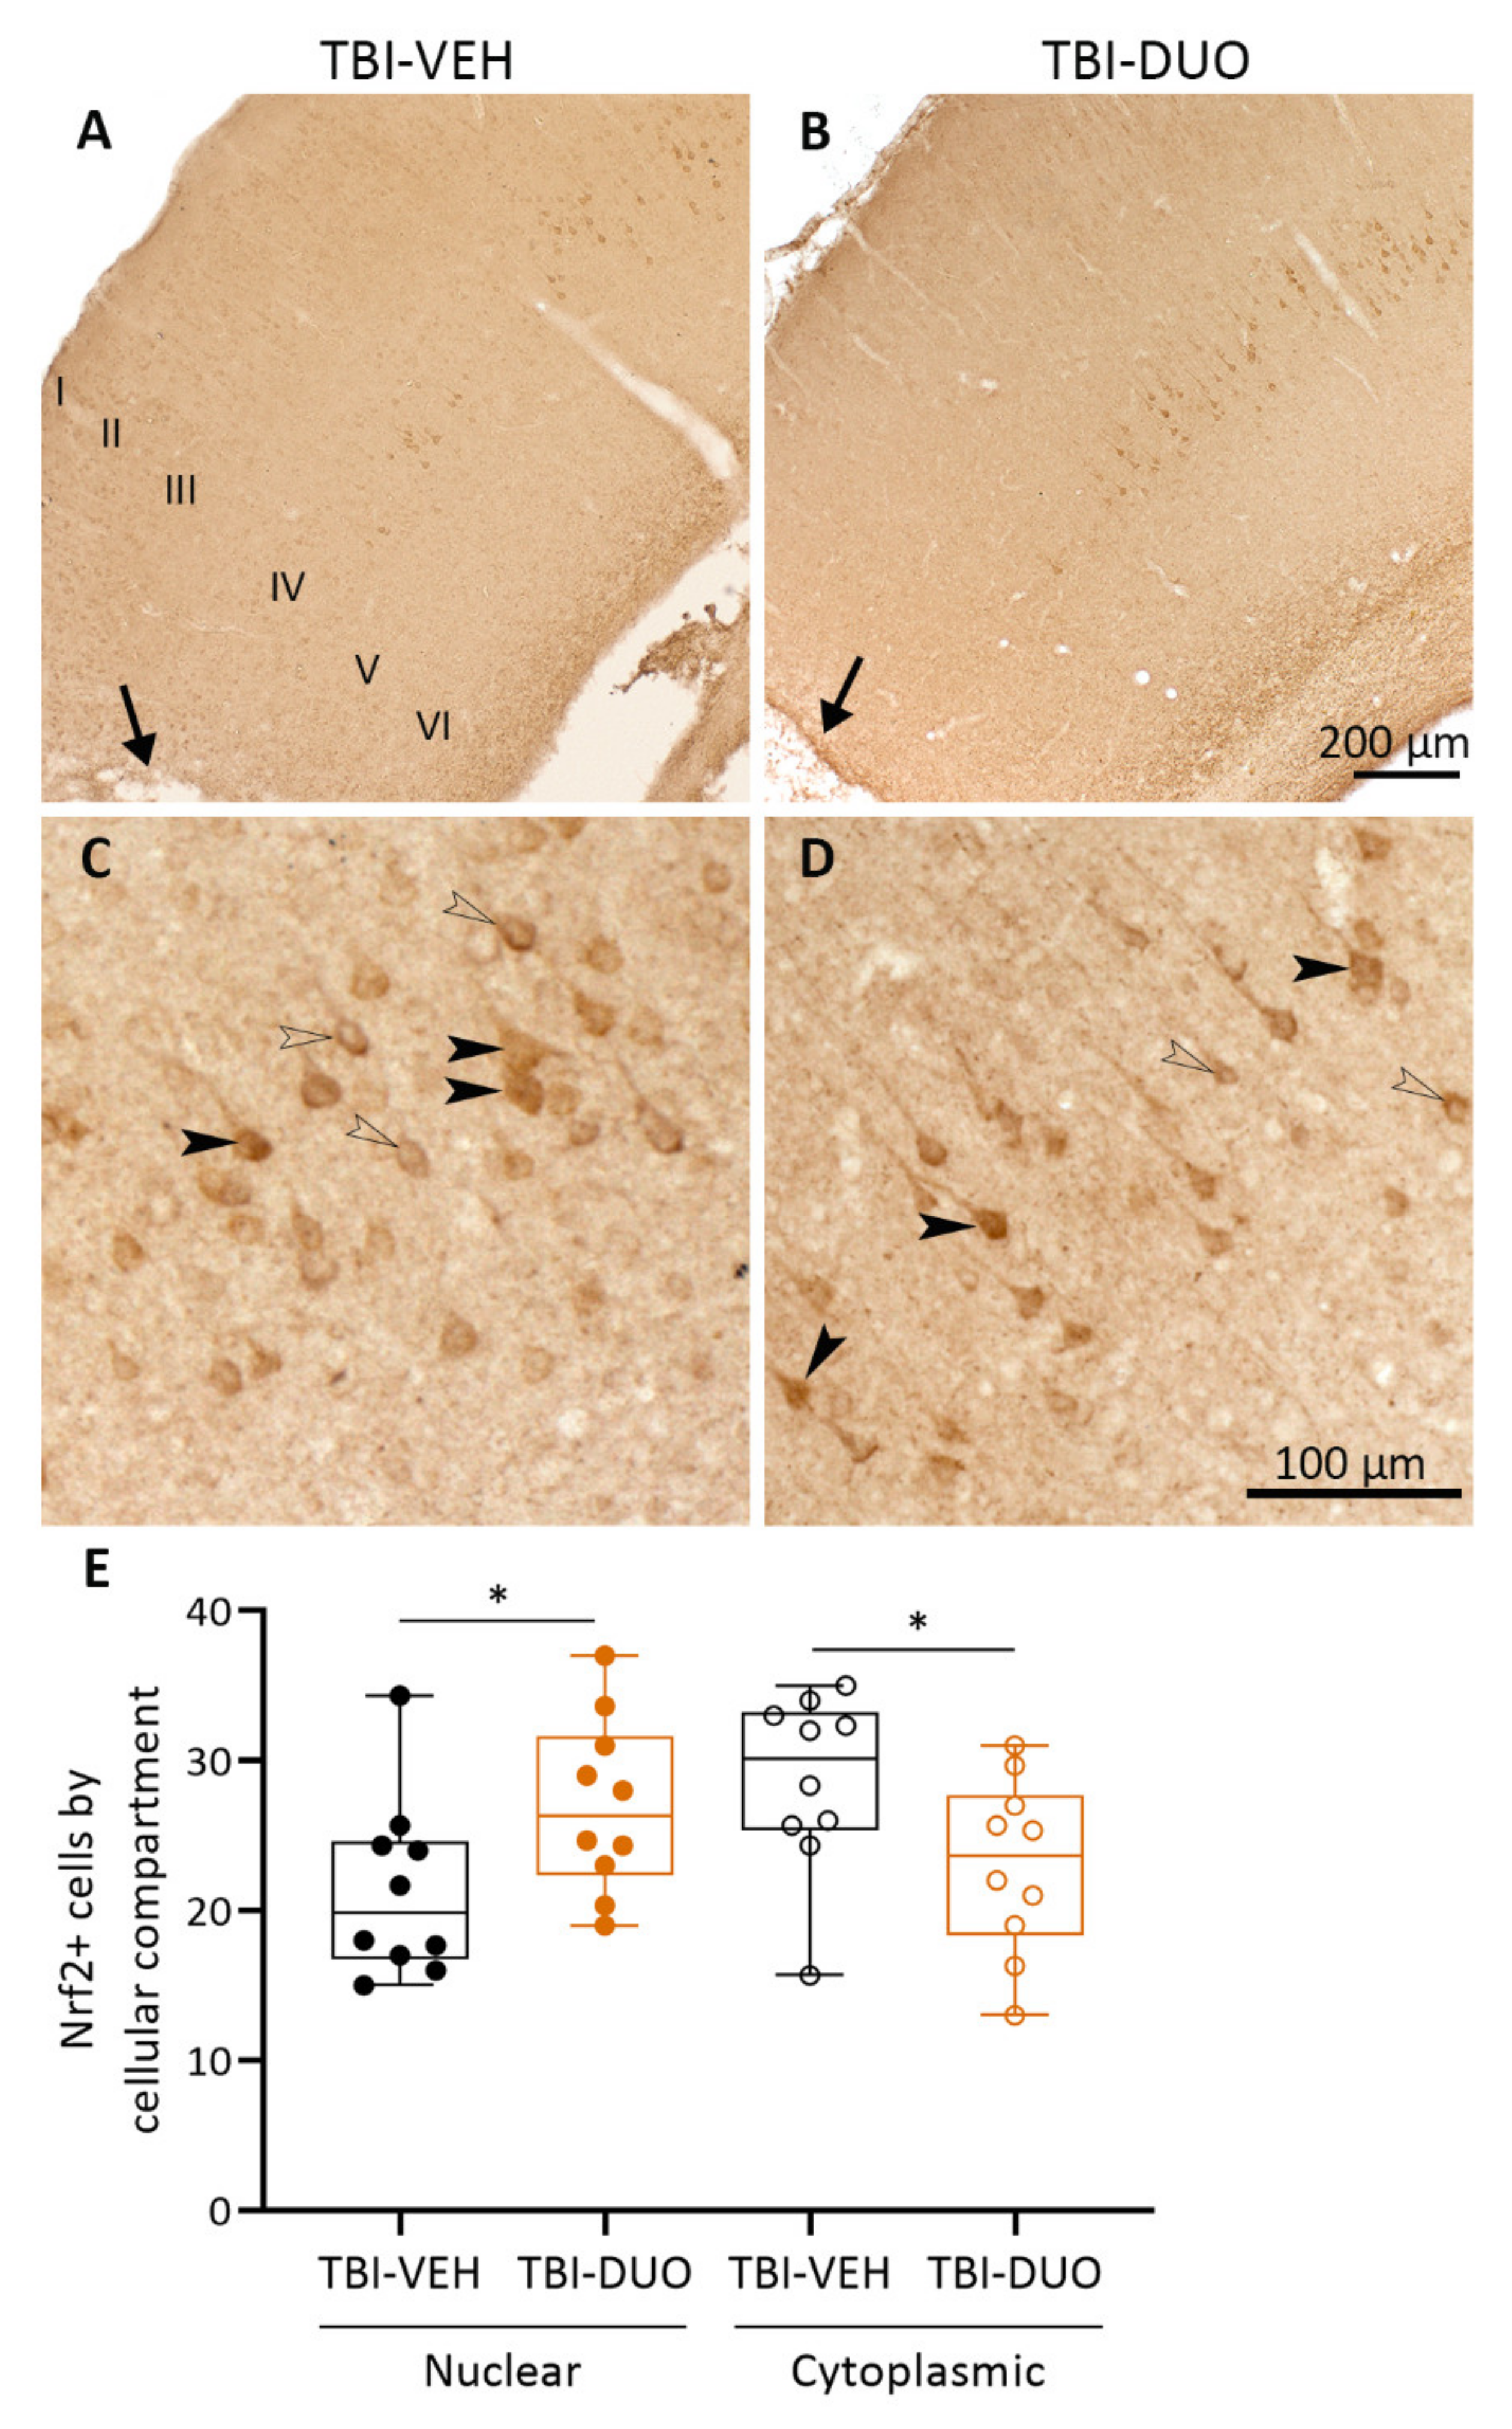
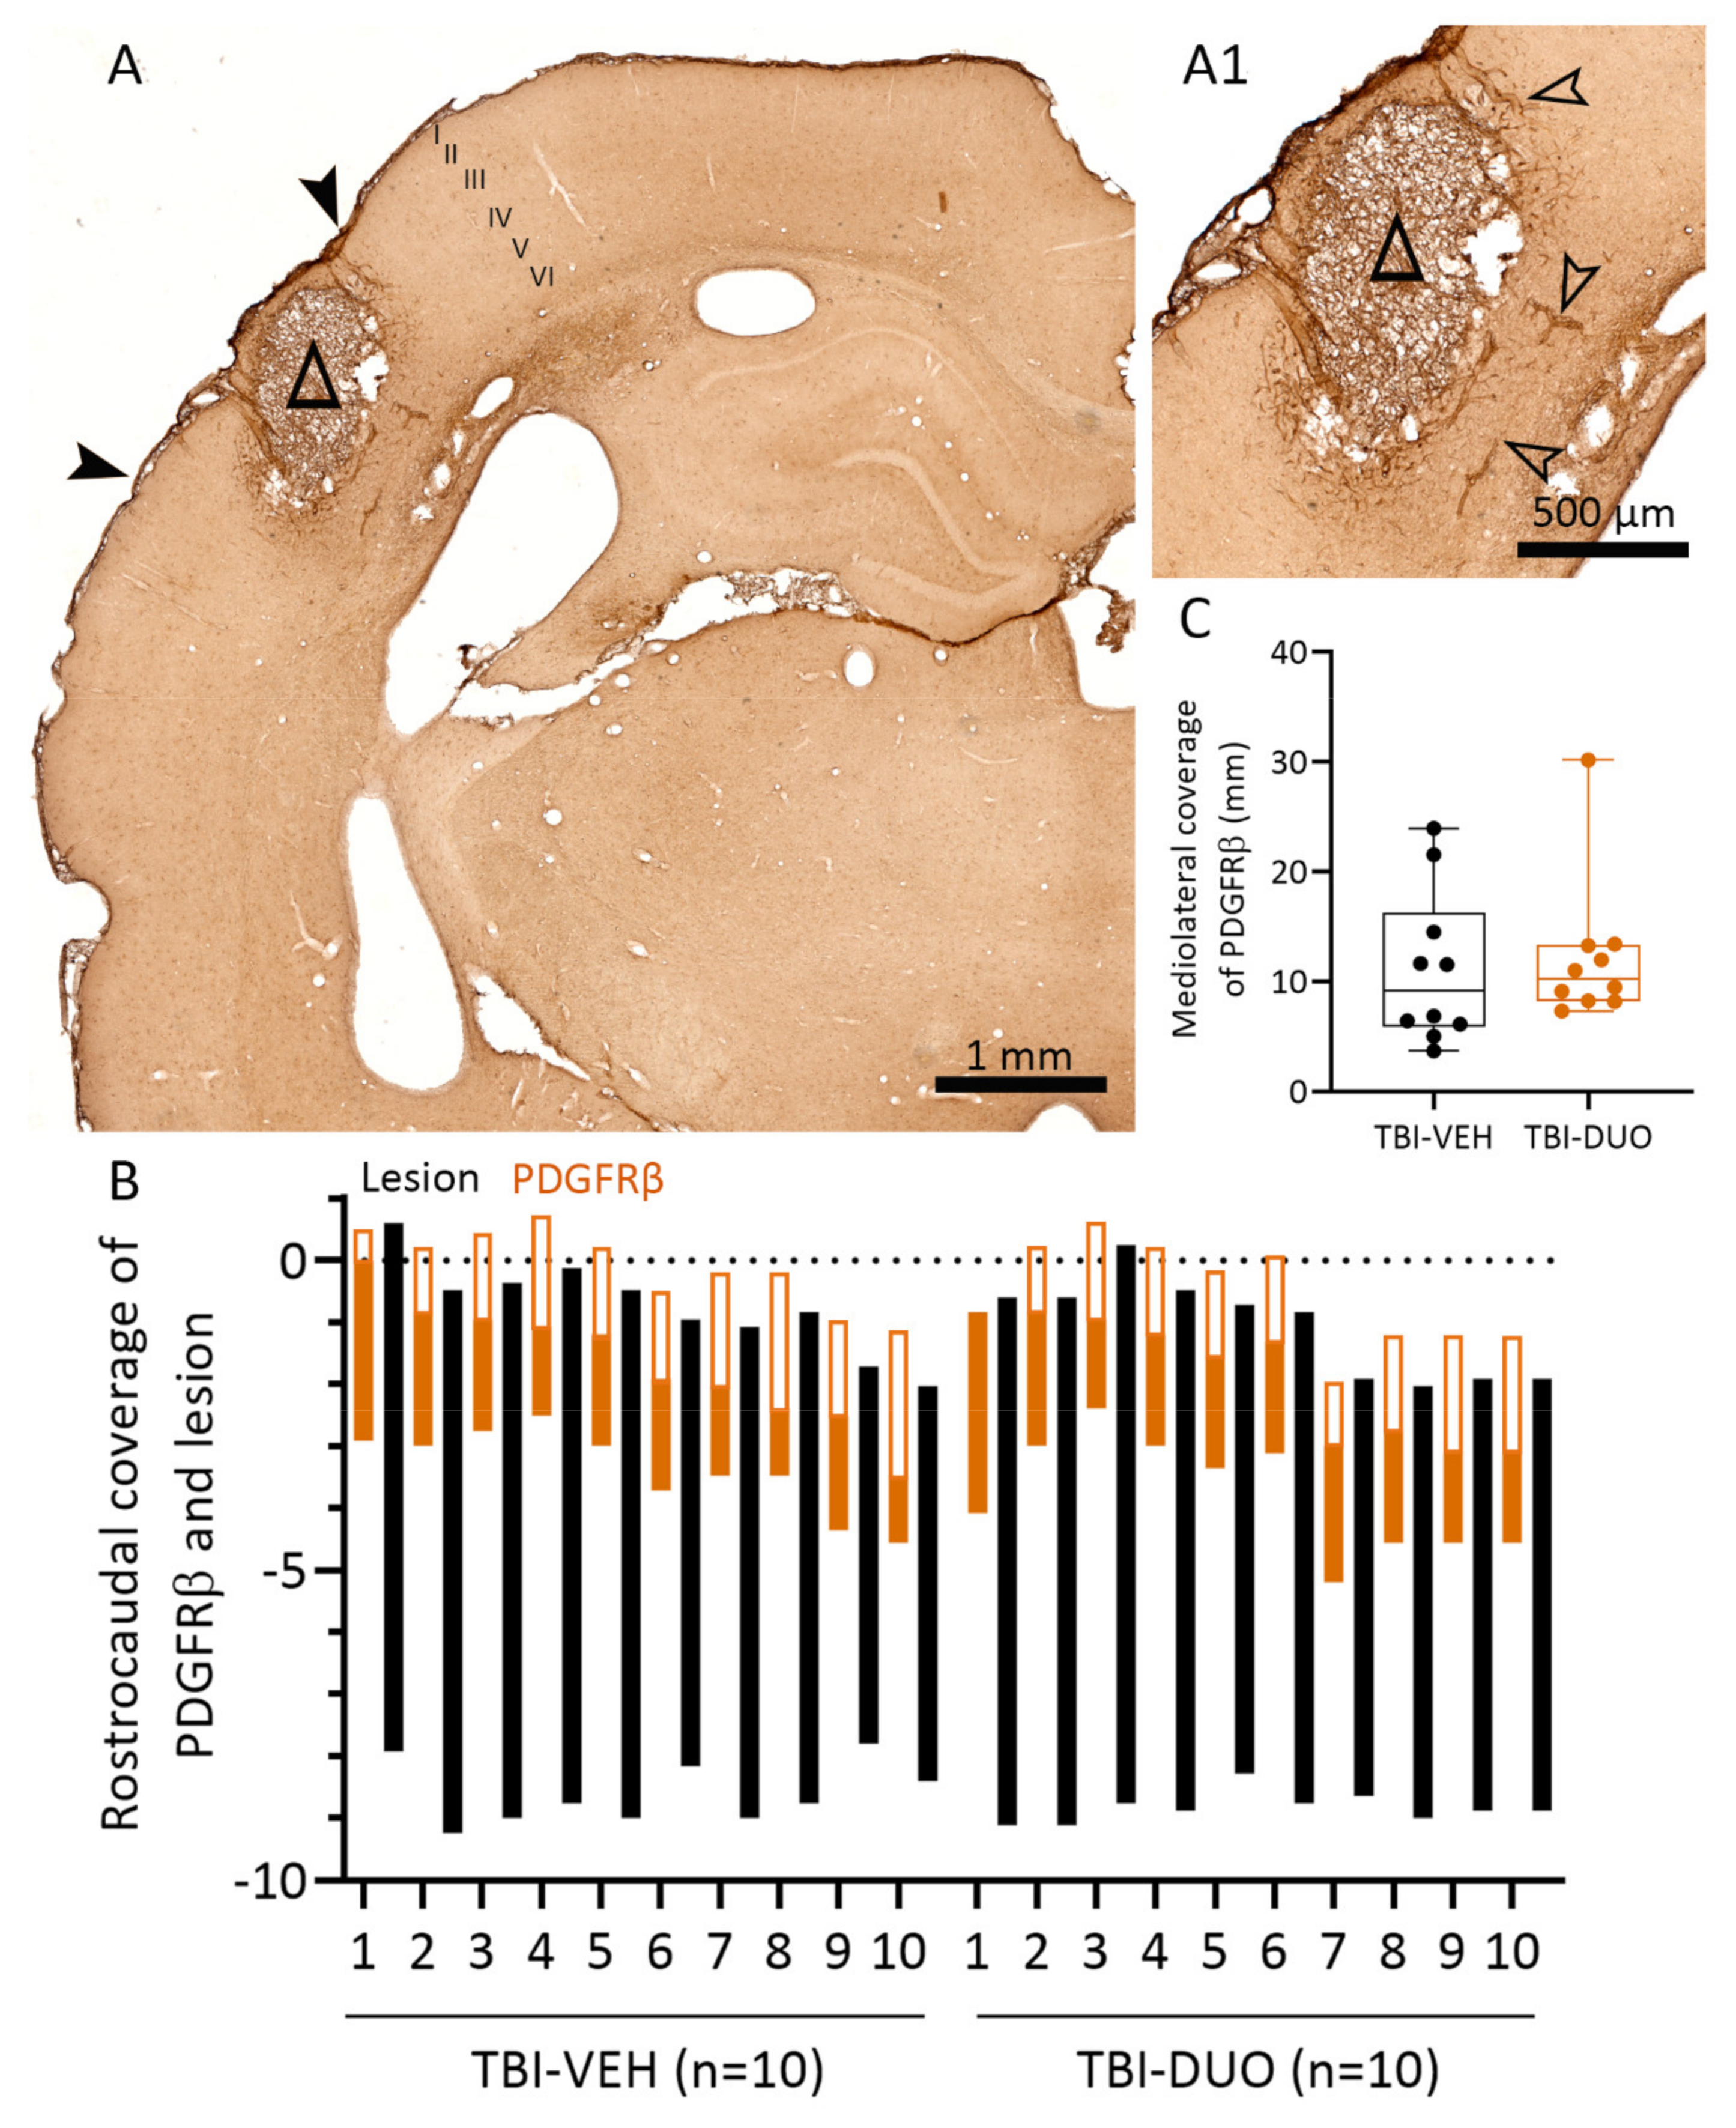
Tissue Response Biomarkers
3. Discussion
3.1. In Vitro Analysis Showed Comparable Efficacy of NAC+SFN Duotherapy and SFN Monotherapy
3.2. In Vivo Analysis Demonstrated Mild Mitigation of Post-TBI Functional Impairment by NAC+SFN Duotherapy
3.3. Effect on Tissue Response Biomarkers
3.4. Effect on Plasma Response Biomarkers
3.5. Caveats
4. Materials and Methods
4.1. In Vitro Assessment of Neuroprotective, Antioxidant, and Anti-Inflammatory Effects of SFN, NAC, and Their Combinations
4.1.1. Preparation of Mouse Primary Cortical Neurons and BV-2 Cell Co-Culture
4.1.2. In Vitro Assessment of the Treatment Effects
4.1.3. In Vitro Outcome Measures
Neuronal Viability Assay
Nitrite Assay
TNF Enzyme-Linked Immunosorbent Assay (ELISA) from Cell Culture Medium
4.2. In Vivo Assessment of Treatment Effects
4.2.1. Lateral Fluid-Percussion Induced TBI
4.2.2. Treatment Groups
4.2.3. Behavioral Analysis
4.2.4. Blood and Plasma Biomarker Analysis
Blood Sampling
RNA Extraction and Reverse Transcription Quantitative Polymerase Chain Reaction (RT-qPCR)
Multiplex Analysis of Plasma Cytokine Levels
ELISA for Plasma High-Mobility Group Box 1 (HMGB1) Levels
4.2.5. Processing of Brain for Histology
Perfusion
Nissl Staining
Cortical Unfolded Maps
Immunohistochemistry
4.2.6. Statistical Analysis
5. Conclusions
Supplementary Materials
Author Contributions
Funding
Institutional Review Board Statement
Acknowledgments
Conflicts of Interest
References
- Menon, D.K.; Schwab, K.; Wright, D.W.; Maas, A.I. Demographics and Clinical Assessment Working Group of the International and Interagency Initiative toward Common Data Elements for Research on Traumatic Brain Injury and Psychological Health. Position Statement: Definition of Traumatic Brain Injury. Arch. Phys. Med. Rehabil. 2010, 91, 1637–1640. [Google Scholar] [CrossRef] [PubMed]
- CENTER-TBI Website. Available online: https://www.center-tbi.eu/ (accessed on 25 August 2021).
- Center for Disease Control and Prevention Website. Available online: https://www.cdc.gov/traumaticbraininjury/ (accessed on 25 August 2021).
- Vaishnavi, S.; Rao, V.; Fann, J.R. Neuropsychiatric Problems After Traumatic Brain Injury: Unraveling the Silent Epidemic. Psychosomatics 2009, 50, 198–205. [Google Scholar] [CrossRef] [PubMed]
- Juengst, S.B.; Wagner, A.K.; Ritter, A.C.; Szaflarski, J.P.; Walker, W.C.; Zafonte, R.D.; Brown, A.W.; Hammond, F.M.; Pugh, M.J.; Shea, T.; et al. Post-Traumatic Epilepsy Associations with Mental Health Outcomes in the First Two Years After Moderate to Severe TBI: A TBI Model Systems Analysis. Epilepsy Behav. 2017, 73, 240–246. [Google Scholar] [CrossRef] [PubMed] [Green Version]
- Pearn, M.L.; Niesman, I.R.; Egawa, J.; Sawada, A.; Almenar-Queralt, A.; Shah, S.B.; Duckworth, J.L.; Head, B.P. Pathophysiology Associated with Traumatic Brain Injury: Current Treatments and Potential Novel Therapeutics. Cell. Mol. Neurobiol. 2017, 37, 571–585. [Google Scholar] [CrossRef] [PubMed]
- Joseph, B.; Khan, M.; Rhee, P. Non-Invasive Diagnosis and Treatment Strategies for Traumatic Brain Injury: An Update. J. Neurosci. Res. 2018, 96, 589–600. [Google Scholar] [CrossRef] [Green Version]
- Kurland, D.; Hong, C.; Aarabi, B.; Gerzanich, V.; Simard, J.M. Hemorrhagic Progression of a Contusion After Traumatic Brain Injury: A Review. J. Neurotrauma 2012, 29, 19–31. [Google Scholar] [CrossRef]
- Karve, I.P.; Taylor, J.M.; Crack, P.J. The Contribution of Astrocytes and Microglia to Traumatic Brain Injury. Br. J. Pharmacol. 2016, 173, 692–702. [Google Scholar] [CrossRef] [Green Version]
- McGinn, M.J.; Povlishock, J.T. Cellular and Molecular Mechanisms of Injury and Spontaneous Recovery. Handb. Clin. Neurol. 2015, 127, 67–87. [Google Scholar]
- Hall, E.D.; Wang, J.A.; Miller, D.M.; Cebak, J.E.; Hill, R.L. Newer Pharmacological Approaches for Antioxidant Neuroprotection in Traumatic Brain Injury. Neuropharmacology 2019, 145, 247–258. [Google Scholar] [CrossRef]
- European Framework 7-Funded Consortium EPITARGET Website. Available online: https://www.epitarget.eu/ (accessed on 25 August 2021).
- Pauletti, A.; Terrone, G.; Shekh-Ahmad, T.; Salamone, A.; Ravizza, T.; Rizzi, M.; Pastore, A.; Pascente, R.; Liang, L.P.; Villa, B.R.; et al. Targeting Oxidative Stress Improves Disease Outcomes in a Rat Model of Acquired Epilepsy. Brain 2019, 142, e39. [Google Scholar] [CrossRef]
- Yi, J.H.; Hazell, A.S. N-Acetylcysteine Attenuates Early Induction of Heme Oxygenase-1 Following Traumatic Brain Injury. Brain Res. 2005, 1033, 13–19. [Google Scholar] [CrossRef]
- Yi, J.H.; Hoover, R.; McIntosh, T.K.; Hazell, A.S. Early, Transient Increase in Complexin I and Complexin II in the Cerebral Cortex Following Traumatic Brain Injury is Attenuated by N-Acetylcysteine. J. Neurotrauma 2006, 23, 86–96. [Google Scholar] [CrossRef]
- Chen, G.; Shi, J.; Hu, Z.; Hang, C. Inhibitory Effect on Cerebral Inflammatory Response Following Traumatic Brain Injury in Rats: A Potential Neuroprotective Mechanism of N-Acetylcysteine. Mediat. Inflamm. 2008, 2008, 716458. [Google Scholar] [CrossRef] [PubMed] [Green Version]
- Senol, N.; Nazıroğlu, M.; Yürüker, V. N-Acetylcysteine and Selenium Modulate Oxidative Stress, Antioxidant Vitamin and Cytokine Values in Traumatic Brain Injury-Induced Rats. Neurochem. Res. 2014, 39, 685–692. [Google Scholar] [CrossRef] [PubMed]
- Nazıroğlu, M.; Senol, N.; Ghazizadeh, V.; Yürüker, V. Neuroprotection Induced by N-Acetylcysteine and Selenium Against Traumatic Brain Injury-Induced Apoptosis and Calcium Entry in Hippocampus of Rat. Cell. Mol. Neurobiol. 2014, 34, 895–903. [Google Scholar] [CrossRef] [PubMed]
- Xiong, Y.; Peterson, P.L.; Lee, C.P. Effect of N-Acetylcysteine on Mitochondrial Function Following Traumatic Brain Injury in Rats. J. Neurotrauma 1999, 16, 1067–1082. [Google Scholar] [CrossRef] [PubMed]
- Hoffer, M.E.; Balaban, C.; Slade, M.D.; Tsao, J.W.; Hoffer, B. Amelioration of Acute Sequelae of Blast Induced Mild Traumatic Brain Injury by N-Acetyl Cysteine: A Double-Blind, Placebo Controlled Study. PLoS ONE 2013, 8, e54163. [Google Scholar] [CrossRef] [PubMed] [Green Version]
- Townsend, B.E.; Johnson, R.W. Sulforaphane Induces Nrf2 Target Genes and Attenuates Inflammatory Gene Expression in Microglia from Brain of Young Adult and Aged Mice. Exp. Gerontol. 2016, 73, 42–48. [Google Scholar] [CrossRef] [Green Version]
- Huang, C.; Wu, J.; Chen, D.; Jin, J.; Wu, Y.; Chen, Z. Effects of Sulforaphane in the Central Nervous System. Eur. J. Pharmacol. 2019, 853, 153–168. [Google Scholar] [CrossRef]
- Kobayashi, E.H.; Suzuki, T.; Funayama, R.; Nagashima, T.; Hayashi, M.; Sekine, H.; Tanaka, N.; Moriguchi, T.; Motohashi, H.; Nakayama, K.; et al. Nrf2 Suppresses Macrophage Inflammatory Response by Blocking Proinflammatory Cytokine Transcription. Nat. Commun. 2016, 7, 11624. [Google Scholar] [CrossRef]
- Cuadrado, A.; Rojo, A.I.; Wells, G.; Hayes, J.D.; Cousin, S.P.; Rumsey, W.L.; Attucks, O.C.; Franklin, S.; Levonen, A.L.; Kensler, T.W.; et al. Therapeutic Targeting of the NRF2 and KEAP1 Partnership in Chronic Diseases. Nat. Rev. Drug Discov. 2019, 18, 295–317. [Google Scholar] [CrossRef] [PubMed] [Green Version]
- Vomund, S.; Schäfer, A.; Parnham, M.J.; Brüne, B.; von Knethen, A. Nrf2, the Master Regulator of Anti-Oxidative Responses. Int. J. Mol. Sci. 2017, 18, 2772. [Google Scholar] [CrossRef] [PubMed] [Green Version]
- Soane, L.; Li Dai, W.; Fiskum, G.; Bambrick, L.L. Sulforaphane Protects Immature Hippocampal Neurons Against Death Caused by Exposure to Hemin Or to Oxygen and Glucose Deprivation. J. Neurosci. Res. 2010, 88, 1355–1363. [Google Scholar] [CrossRef] [PubMed] [Green Version]
- Hong, Y.; Yan, W.; Chen, S.; Sun, C.R.; Zhang, J.M. The Role of Nrf2 Signaling in the Regulation of Antioxidants and Detoxifying Enzymes After Traumatic Brain Injury in Rats and Mice. Acta Pharmacol. Sin. 2010, 31, 1421–1430. [Google Scholar] [CrossRef] [Green Version]
- Brooke, S.M.; Bliss, T.M.; Franklin, L.R.; Sapolsky, R.M. Quantification of Neuron Survival in Monolayer Cultures using an Enzyme-Linked Immunosorbent Assay Approach, rather than by Cell Counting. Neurosci. Lett. 1999, 267, 21–24. [Google Scholar] [CrossRef]
- Kyyriäinen, J.; Ekolle Ndode-Ekane, X.; Pitkänen, A. Dynamics of PDGFRβ Expression in Different Cell Types After Brain Injury. Glia 2017, 65, 322–341. [Google Scholar] [CrossRef]
- Werner, C.; Engelhard, K. Pathophysiology of Traumatic Brain Injury. Br. J. Anaesth. 2007, 99, 4–9. [Google Scholar] [CrossRef] [Green Version]
- Kraft, A.D.; Johnson, D.A.; Johnson, J.A. Nuclear Factor E2-Related Factor 2-Dependent Antioxidant Response Element Activation by Tert-Butylhydroquinone and Sulforaphane Occurring Preferentially in Astrocytes Conditions Neurons Against Oxidative Insult. J. Neurosci. 2004, 24, 1101–1112. [Google Scholar] [CrossRef] [Green Version]
- Wu, X.; Zhao, J.; Yu, S.; Chen, Y.; Wu, J.; Zhao, Y. Sulforaphane Protects Primary Cultures of Cortical Neurons Against Injury Induced by Oxygen-Glucose deprivation/reoxygenation Via Antiapoptosis. Neurosci. Bull. 2012, 28, 509–516. [Google Scholar] [CrossRef] [Green Version]
- Brandenburg, L.O.; Kipp, M.; Lucius, R.; Pufe, T.; Wruck, C.J. Sulforaphane Suppresses LPS-Induced Inflammation in Primary Rat Microglia. Inflamm. Res. 2010, 59, 443–450. [Google Scholar] [CrossRef]
- Qin, S.; Yang, C.; Huang, W.; Du, S.; Mai, H.; Xiao, J.; Lü, T. Sulforaphane Attenuates Microglia-Mediated Neuronal Necroptosis through Down-Regulation of MAPK/NF-κB Signaling Pathways in LPS-Activated BV-2 Microglia. Pharmacol. Res. 2018, 133, 218–235. [Google Scholar] [CrossRef]
- Chao, M.W.; Chen, C.P.; Yang, Y.H.; Chuang, Y.C.; Chu, T.Y.; Tseng, C.Y. N-Acetylcysteine Attenuates Lipopolysaccharide-Induced Impairment in Lamination of Ctip2-and Tbr1-Expressing Cortical Neurons in the Developing Rat Fetal Brain. Sci. Rep. 2016, 6, 32373. [Google Scholar] [CrossRef] [PubMed] [Green Version]
- Markoutsa, E.; Xu, P. Redox Potential-Sensitive N-Acetyl Cysteine-Prodrug Nanoparticles Inhibit the Activation of Microglia and Improve Neuronal Survival. Mol. Pharm. 2017, 14, 1591–1600. [Google Scholar] [CrossRef] [PubMed] [Green Version]
- Hicdonmez, T.; Kanter, M.; Tiryaki, M.; Parsak, T.; Cobanoglu, S. Neuroprotective Effects of N-Acetylcysteine on Experimental Closed Head Trauma in Rats. Neurochem. Res. 2006, 31, 473–481. [Google Scholar] [CrossRef] [PubMed]
- Eakin, K.; Baratz-Goldstein, R.; Pick, C.G.; Zindel, O.; Balaban, C.D.; Hoffer, M.E.; Lockwood, M.; Miller, J.; Hoffer, B.J. Efficacy of N-Acetyl Cysteine in Traumatic Brain Injury. PLoS ONE 2014, 9, e90617. [Google Scholar] [CrossRef] [Green Version]
- Sangobowale, M.A.; Grin’kina, N.M.; Whitney, K.; Nikulina, E.; St Laurent-Ariot, K.; Ho, J.S.; Bayzan, N.; Bergold, P.J. Minocycline Plus N-Acetylcysteine Reduce Behavioral Deficits and Improve Histology with a Clinically Useful Time Window. J. Neurotrauma 2018, 35, 907–917. [Google Scholar] [CrossRef]
- Sekhon, B.; Sekhon, C.; Khan, M.; Patel, S.J.; Singh, I.; Singh, A.K. N-Acetyl Cysteine Protects Against Injury in a Rat Model of Focal Cerebral Ischemia. Brain Res. 2003, 971, 1–8. [Google Scholar] [CrossRef]
- Khan, M.; Sekhon, B.; Jatana, M.; Giri, S.; Gilg, A.G.; Sekhon, C.; Singh, I.; Singh, A.K. Administration of N-Acetylcysteine After Focal Cerebral Ischemia Protects Brain and Reduces Inflammation in a Rat Model of Experimental Stroke. J. Neurosci. Res. 2004, 76, 519–527. [Google Scholar] [CrossRef]
- Abdel Baki, S.G.; Schwab, B.; Haber, M.; Fenton, A.A.; Bergold, P.J. Minocycline Synergizes with N-Acetylcysteine and Improves Cognition and Memory Following Traumatic Brain Injury in Rats. PLoS ONE 2010, 5, e12490. [Google Scholar] [CrossRef] [Green Version]
- Haber, M.; Abdel Baki, S.G.; Grin’kina, N.M.; Irizarry, R.; Ershova, A.; Orsi, S.; Grill, R.J.; Dash, P.; Bergold, P.J. Minocycline Plus N-Acetylcysteine Synergize to Modulate Inflammation and Prevent Cognitive and Memory Deficits in a Rat Model of Mild Traumatic Brain Injury. Exp. Neurol. 2013, 249, 169–177. [Google Scholar] [CrossRef]
- Pandya, J.D.; Readnower, R.D.; Patel, S.P.; Yonutas, H.M.; Pauly, J.R.; Goldstein, G.A.; Rabchevsky, A.G.; Sullivan, P.G. N-Acetylcysteine Amide Confers Neuroprotection, Improves Bioenergetics and Behavioral Outcome Following TBI. Exp. Neurol. 2014, 257, 106–113. [Google Scholar] [CrossRef] [Green Version]
- Thomale, U.W.; Griebenow, M.; Kroppenstedt, S.N.; Unterberg, A.W.; Stover, J.F. The Effect of N-Acetylcysteine on Posttraumatic Changes After Controlled Cortical Impact in Rats. Intensive Care Med. 2006, 32, 149–155. [Google Scholar] [CrossRef]
- Zhao, J.; Moore, A.N.; Clifton, G.L.; Dash, P.K. Sulforaphane Enhances Aquaporin-4 Expression and Decreases Cerebral Edema Following Traumatic Brain Injury. J. Neurosci. Res. 2005, 82, 499–506. [Google Scholar] [CrossRef]
- Zhao, J.; Moore, A.N.; Redell, J.B.; Dash, P.K. Enhancing Expression of Nrf2-Driven Genes Protects the Blood Brain Barrier After Brain Injury. J. Neurosci. 2007, 27, 10240–10248. [Google Scholar] [CrossRef] [Green Version]
- Dash, P.K.; Zhao, J.; Orsi, S.A.; Zhang, M.; Moore, A.N. Sulforaphane Improves Cognitive Function Administered Following Traumatic Brain Injury. Neurosci. Lett. 2009, 460, 103–107. [Google Scholar] [CrossRef] [PubMed] [Green Version]
- Zhao, J.; Kobori, N.; Aronowski, J.; Dash, P.K. Sulforaphane Reduces Infarct Volume Following Focal Cerebral Ischemia in Rodents. Neurosci. Lett. 2006, 393, 108–112. [Google Scholar] [CrossRef] [PubMed]
- Porritt, M.J.; Andersson, H.C.; Hou, L.; Nilsson, Å.; Pekna, M.; Pekny, M.; Nilsson, M. Photothrombosis-Induced Infarction of the Mouse Cerebral Cortex is Not Affected by the Nrf2-Activator Sulforaphane. PLoS ONE 2012, 7, e41090. [Google Scholar] [CrossRef] [Green Version]
- Samuni, Y.; Goldstein, S.; Dean, O.M.; Berk, M. The Chemistry and Biological Activities of N-Acetylcysteine. Biochim. Biophys. Acta 2013, 1830, 4117–4129. [Google Scholar] [CrossRef]
- Farr, S.A.; Poon, H.F.; Dogrukol-Ak, D.; Drake, J.; Banks, W.A.; Eyerman, E.; Butterfield, D.A.; Morley, J.E. The Antioxidants Alpha-Lipoic Acid and N-Acetylcysteine Reverse Memory Impairment and Brain Oxidative Stress in Aged SAMP8 Mice. J. Neurochem. 2003, 84, 1173–1183. [Google Scholar] [CrossRef] [PubMed] [Green Version]
- Clark, R.S.B.; Empey, P.E.; Bayır, H.; Rosario, B.L.; Poloyac, S.M.; Kochanek, P.M.; Nolin, T.D.; Au, A.K.; Horvat, C.M.; Wisniewski, S.R.; et al. Phase I Randomized Clinical Trial of N-Acetylcysteine in Combination with an Adjuvant Probenecid for Treatment of Severe Traumatic Brain Injury in Children. PLoS ONE 2017, 12, e0180280. [Google Scholar] [CrossRef]
- Yan, W.; Wang, H.D.; Hu, Z.G.; Wang, Q.F.; Yin, H.X. Activation of Nrf2-ARE Pathway in Brain After Traumatic Brain Injury. Neurosci. Lett. 2008, 431, 150–154. [Google Scholar] [CrossRef]
- He, Y.; Yan, H.; Ni, H.; Liang, W.; Jin, W. Expression of Nuclear Factor Erythroid 2-Related Factor 2 Following Traumatic Brain Injury in the Human Brain. Neuroreport 2019, 30, 344–349. [Google Scholar] [CrossRef]
- Zhao, X.; Sun, G.; Zhang, J.; Strong, R.; Dash, P.K.; Kan, Y.W.; Grotta, J.C.; Aronowski, J. Transcription Factor Nrf2 Protects the Brain from Damage Produced by Intracerebral Hemorrhage. Stroke 2007, 38, 3280–3286. [Google Scholar] [CrossRef]
- Miller, D.M.; Wang, J.A.; Buchanan, A.K.; Hall, E.D. Temporal and Spatial Dynamics of nrf2-Antioxidant Response Elements Mediated Gene Targets in Cortex and Hippocampus After Controlled Cortical Impact Traumatic Brain Injury in Mice. J. Neurotrauma 2014, 31, 1194–1201. [Google Scholar] [CrossRef] [Green Version]
- Göritz, C.; Dias, D.O.; Tomilin, N.; Barbacid, M.; Shupliakov, O.; Frisén, J. A Pericyte Origin of Spinal Cord Scar Tissue. Science 2011, 333, 238–242. [Google Scholar] [CrossRef]
- Peltz, E.D.; Moore, E.E.; Eckels, P.C.; Damle, S.S.; Tsuruta, Y.; Johnson, J.L.; Sauaia, A.; Silliman, C.C.; Banerjee, A.; Abraham, E. HMGB1 is Markedly Elevated within 6 Hours of Mechanical Trauma in Humans. Shock 2009, 32, 17–22. [Google Scholar] [CrossRef] [Green Version]
- Cohen, M.J.; Brohi, K.; Calfee, C.S.; Rahn, P.; Chesebro, B.B.; Christiaans, S.C.; Carles, M.; Howard, M.; Pittet, J.F. Early Release of High Mobility Group Box Nuclear Protein 1 After Severe Trauma in Humans: Role of Injury Severity and Tissue Hypoperfusion. Crit. Care 2009, 13, R174. [Google Scholar] [CrossRef] [PubMed] [Green Version]
- Au, A.K.; Aneja, R.K.; Bell, M.J.; Bayir, H.; Feldman, K.; Adelson, P.D.; Fink, E.L.; Kochanek, P.M.; Clark, R.S. Cerebrospinal Fluid Levels of High-Mobility Group Box 1 and Cytochrome C Predict Outcome After Pediatric Traumatic Brain Injury. J. Neurotrauma 2012, 29, 2013–2021. [Google Scholar] [CrossRef] [PubMed] [Green Version]
- Webster, K.M.; Shultz, S.R.; Ozturk, E.; Dill, L.K.; Sun, M.; Casillas-Espinosa, P.; Jones, N.C.; Crack, P.J.; O’Brien, T.J.; Semple, B.D. Targeting High-Mobility Group Box Protein 1 (HMGB1) in Pediatric Traumatic Brain Injury: Chronic Neuroinflammatory, Behavioral, and Epileptogenic Consequences. Exp. Neurol. 2019, 320, 112979. [Google Scholar] [CrossRef]
- Ahn, M.J.; Sherwood, E.R.; Prough, D.S.; Lin, C.Y.; DeWitt, D.S. The Effects of Traumatic Brain Injury on Cerebral Blood Flow and Brain Tissue Nitric Oxide Levels and Cytokine Expression. J. Neurotrauma 2004, 21, 1431–1442. [Google Scholar] [CrossRef] [PubMed]
- Kamm, K.; Vanderkolk, W.; Lawrence, C.; Jonker, M.; Davis, A.T. The Effect of Traumatic Brain Injury upon the Concentration and Expression of Interleukin-1beta and Interleukin-10 in the Rat. J. Trauma 2006, 60, 152–157. [Google Scholar] [CrossRef]
- Kumar, R.G.; Boles, J.A.; Wagner, A.K. Chronic Inflammation After Severe Traumatic Brain Injury: Characterization and Associations with Outcome at 6 and 12 Months Postinjury. J. Head Trauma Rehabil. 2015, 30, 369–381. [Google Scholar] [CrossRef] [Green Version]
- Olesen, S.P. Leakiness of Rat Brain Microvessels to Fluorescent Probes Following Craniotomy. Acta Physiol. Scand. 1987, 130, 63–68. [Google Scholar] [CrossRef]
- Cole, J.T.; Yarnell, A.; Kean, W.S.; Gold, E.; Lewis, B.; Ren, M.; McMullen, D.C.; Jacobowitz, D.M.; Pollard, H.B.; O’Neill, J.T.; et al. Craniotomy: True Sham for Traumatic Brain Injury, Or a Sham of a Sham? J. Neurotrauma 2011, 28, 359–369. [Google Scholar] [CrossRef] [PubMed] [Green Version]
- Lagraoui, M.; Latoche, J.R.; Cartwright, N.G.; Sukumar, G.; Dalgard, C.L.; Schaefer, B.C. Controlled Cortical Impact and Craniotomy Induce Strikingly Similar Profiles of Inflammatory Gene Expression, but with Distinct Kinetics. Front. Neurol. 2012, 3, 155. [Google Scholar] [CrossRef] [PubMed] [Green Version]
- Oka, S.; Kamata, H.; Kamata, K.; Yagisawa, H.; Hirata, H. N-Acetylcysteine Suppresses TNF-Induced NF-kappaB Activation through Inhibition of IkappaB Kinases. FEBS Lett. 2000, 472, 196–202. [Google Scholar] [CrossRef] [Green Version]
- Xu, C.; Shen, G.; Chen, C.; Gélinas, C.; Kong, A.N. Suppression of NF-kappaB and NF-kappaB-Regulated Gene Expression by Sulforaphane and PEITC through IkappaBalpha, IKK Pathway in Human Prostate Cancer PC-3 Cells. Oncogene 2005, 24, 4486–4495. [Google Scholar] [CrossRef] [Green Version]
- Checker, R.; Gambhir, L.; Thoh, M.; Sharma, D.; Sandur, S.K. Sulforaphane, a Naturally Occurring Isothiocyanate, Exhibits Anti-Inflammatory Effects by Targeting GSK3β/Nrf-2 and NF-κB Pathways in T Cells. J. Funct. Foods 2015, 19, 426–438. [Google Scholar] [CrossRef]
- Lipponen, A.; Natunen, T.; Hujo, M.; Ciszek, R.; Hämäläinen, E.; Tohka, J.; Hiltunen, M.; Paananen, J.; Poulsen, D.; Kansanen, E.; et al. In Vitro and in Vivo Pipeline for Validation of Disease-Modifying Effects of Systems Biology-Derived Network Treatments for Traumatic Brain Injury-Lessons Learned. Int. J. Mol. Sci. 2019, 20, 5395. [Google Scholar] [CrossRef] [Green Version]
- Krügel, U.; Fischer, J.; Bauer, K.; Sack, U.; Himmerich, H. The Impact of Social Isolation on Immunological Parameters in Rats. Arch. Toxicol. 2014, 88, 853–855. [Google Scholar] [CrossRef]
- Alshammari, T.K.; Alghamdi, H.; Alkhader, L.F.; Alqahtani, Q.; Alrasheed, N.M.; Yacoub, H.; Alnaem, N.; AlNakiyah, M.; Alshammari, M.A. Analysis of the Molecular and Behavioral Effects of Acute Social Isolation on Rats. Behav. Brain Res. 2020, 377, 112191. [Google Scholar] [CrossRef]
- Pitkänen, A.; Lukasiuk, K. Mechanisms of Epileptogenesis and Potential Treatment Targets. Lancet Neurol. 2011, 10, 173–186. [Google Scholar] [CrossRef]
- Eastman, C.L.; D’Ambrosio, R.; Ganesh, T. Modulating Neuroinflammation and Oxidative Stress to Prevent Epilepsy and Improve Outcomes After Traumatic Brain Injury. Neuropharmacology 2020, 172, 107907. [Google Scholar] [CrossRef]
- Pitkänen, A. Therapeutic Approaches to Epileptogenesis--Hope on the Horizon. Epilepsia 2010, 51 (Suppl. 3), 2–17. [Google Scholar] [CrossRef] [PubMed]
- Gresa-Arribas, N.; Viéitez, C.; Dentesano, G.; Serratosa, J.; Saura, J.; Solà, C. Modelling Neuroinflammation in Vitro: A Tool to Test the Potential Neuroprotective Effect of Anti-Inflammatory Agents. PLoS ONE 2012, 7, e45227. [Google Scholar] [CrossRef] [Green Version]
- Martiskainen, H.; Paldanius, K.M.A.; Natunen, T.; Takalo, M.; Marttinen, M.; Leskelä, S.; Huber, N.; Mäkinen, P.; Bertling, E.; Dhungana, H.; et al. DHCR24 Exerts Neuroprotection upon Inflammation-Induced Neuronal Death. J. Neuroinflamm. 2017, 14, 1–16. [Google Scholar] [CrossRef] [PubMed] [Green Version]
- Natunen, T.A.; Gynther, M.; Rostalski, H.; Jaako, K.; Jalkanen, A.J. Extracellular Prolyl Oligopeptidase Derived from Activated Microglia is a Potential Neuroprotection Target. Basic Clin. Pharmacol. Toxicol. 2019, 124, 40–49. [Google Scholar] [CrossRef]
- Chang, G.; Guo, Y.; Jia, Y.; Duan, W.; Li, B.; Yu, J.; Li, C. Protective Effect of Combination of Sulforaphane and Riluzole on Glutamate-Mediated Excitotoxicity. Biol. Pharm. Bull. 2010, 33, 1477–1483. [Google Scholar] [CrossRef] [PubMed] [Green Version]
- Wu, W.; Liu, B.H.; Xie, C.L.; Xia, X.D.; Zhang, Y.M. Neuroprotective Effects of N-Acetyl Cysteine on Primary Hippocampus Neurons Against Hydrogen Peroxide-Induced Injury are Mediated Via Inhibition of Mitogen-Activated Protein Kinases Signal Transduction and Antioxidative Action. Mol. Med. Rep. 2018, 17, 6647–6654. [Google Scholar] [CrossRef] [PubMed] [Green Version]
- Wang, H.; Lin, W.; Shen, G.; Khor, T.O.; Nomeir, A.A.; Kong, A.N. Development and Validation of an LC-MS-MS Method for the Simultaneous Determination of Sulforaphane and its Metabolites in Rat Plasma and its Application in Pharmacokinetic Studies. J. Chromatogr. Sci. 2011, 49, 801–806. [Google Scholar] [CrossRef] [PubMed] [Green Version]
- McIntosh, T.K.; Vink, R.; Noble, L.; Yamakami, I.; Fernyak, S.; Soares, H.; Faden, A.L. Traumatic Brain Injury in the Rat: Characterization of a Lateral Fluid-Percussion Model. Neuroscience 1989, 28, 233–244. [Google Scholar] [CrossRef]
- Paxinos, G.; Watson, C. The Rat Brain in Stereotaxic Coordinates, 6th ed.; Elsevier: Amsterdam, The Netherlands, 2007. [Google Scholar]
- Nissinen, J.; Andrade, P.; Natunen, T.; Hiltunen, M.; Malm, T.; Kanninen, K.; Soares, J.I.; Shatillo, O.; Sallinen, J.; Ndode-Ekane, X.E.; et al. Disease-Modifying Effect of Atipamezole in a Model of Post-Traumatic Epilepsy. Epilepsy Res. 2017, 136, 18–34. [Google Scholar] [CrossRef] [Green Version]
- Ohlsson, A.L.; Johansson, B.B. Environment Influences Functional Outcome of Cerebral Infarction in Rats. Stroke 1995, 26, 644–649. [Google Scholar] [CrossRef]
- Van Vliet, E.A.; Puhakka, N.; Mills, J.D.; Srivastava, P.K.; Johnson, M.R.; Roncon, P.; Das Gupta, S.; Karttunen, J.; Simonato, M.; Lukasiuk, K.; et al. Standardization Procedure for Plasma Biomarker Analysis in Rat Models of Epileptogenesis: Focus on Circulating microRNAs. Epilepsia 2017, 58, 2013–2024. [Google Scholar] [CrossRef]
- Schwochow, D.; Serieys, L.E.; Wayne, R.K.; Thalmann, O. Efficient Recovery of Whole Blood RNA—A Comparison of Commercial RNA Extraction Protocols for High-Throughput Applications in Wildlife Species. BMC Biotechnol. 2012, 12, 33. [Google Scholar] [CrossRef] [PubMed] [Green Version]
- Livak, K.J.; Schmittgen, T.D. Analysis of Relative Gene Expression Data using Real-Time Quantitative PCR and the 2(-Delta Delta C(T)) Method. Methods 2001, 25, 402–408. [Google Scholar] [CrossRef] [PubMed]
- Ekolle Ndode-Ekane, X.; Kharatishvili, I.; Pitkänen, A. Unfolded Maps for Quantitative Analysis of Cortical Lesion Location and Extent After Traumatic Brain Injury. J. Neurotrauma 2017, 34, 459–474. [Google Scholar] [CrossRef]
- Web Application for Creating Two Dimentional Unfolded Maps. Available online: https://unfoldedmap.org/ (accessed on 26 August 2021).
- Heldin, C.H.; Westermark, B. Mechanism of Action and in Vivo Role of Platelet-Derived Growth Factor. Physiol. Rev. 1999, 79, 1283–1316. [Google Scholar] [CrossRef] [PubMed]
- The R Project for Statistical Computing Website. Available online: https://www.r-project.org/ (accessed on 26 August 2021).


| TBI-VEH (n =10) | TBI-DUO (n = 10) | |||
|---|---|---|---|---|
| Area | mm2 ± SEM | % (n) | mm2 ± SEM | % (n) |
| PRh | 0.35 | 10% (1/10) | 1.02 | 29% (1/10) |
| Ect | 0.95 ± 0.43 | 18% (6/10) | 1.88 ± 1.08 | 14% (9/10) |
| TeA | 1.93 ± 0.27 | 49% (9/10) | 6.99 ± 5.01 | 45% (9/10) |
| Au1 | 3.62 ± 0.48 | 62% (10/10) | 6.62 ± 3.51 | 48% (10/10) |
| AuD | 2.40 ± 0.09 | 92% (10/10) | 9.12 ± 6.88 | 78% (10/10) |
| AuV | 0.71 ± 0.20 | 27% (9/10) | 2.11 ± 1.43 | 24% (8/10) |
| S1 | 1.19 ± 0.02 | 97% (10/10) | 10.19 ± 8.98 | 89% (10/10) |
| S1BF | 5.55 ± 0.63 | 49% (10/10) | 6.79 ± 1.61 | 43% (10/10) |
| S1DZ | 0.12 ± 0.07 | 7% (3/10) | 0.08 ± 0.05 | 4% (2/10) |
| S1FL | 0.10 | 1% (1/10) | 0 | 0% (0/10) |
| S1ULp | 1.17 ± 0.23 | 13% (9/10) | 0.84 ± 0.18 | 8% (8/10) |
| S2 | 0.76 ± 0.20 | 11% (9/10) | 0.79 ± 0.25 | 7% (7/10) |
| PtPD | 0.25 ± 0.09 | 26% (6/10) | 0.32 ± 0.08 | 33% (10/10) |
| PtPR | 0.50 ± 0.056 | 67% (10/10) | 0.64 ± 0.038 | 86% (10/10) |
| V1 | 0.11 ± 0 | 5% (2/10) | 0.66 ± 0.62 | 31% (3/10) |
| V1B | 1.45 ± 0.36 | 28% (8/10) | 1.86 ± 0.41 | 37% (10/10) |
| V1M | 1.21 ± 0.52 | 21% (5/10) | 0.92 ± 0.35 | 16% (6/10) |
| V2L | 4.46 ± 0.40 | 69% (10/10) | 5.21 ± 0.30 | 80% (10/10) |
| V2ML | 0.29 ± 0.17 | 9% (2/10) | 0.19 ± 0.05 | 6% (3/10) |
| V2MM | 0.75 | 18% (1/10) | 0.32 ± 0.09 | 8% (2/10) |
| RSD | 1.02 | 10% (1/10) | 0 | 0% (0/10) |
| Total lesion area | 24.65 ± 3.21 | 5% (10/10) | 24.87 ± 3.24 | 5% (10/10) |
Publisher’s Note: MDPI stays neutral with regard to jurisdictional claims in published maps and institutional affiliations. |
© 2021 by the authors. Licensee MDPI, Basel, Switzerland. This article is an open access article distributed under the terms and conditions of the Creative Commons Attribution (CC BY) license (https://creativecommons.org/licenses/by/4.0/).
Share and Cite
Kyyriäinen, J.; Kajevu, N.; Bañuelos, I.; Lara, L.; Lipponen, A.; Balosso, S.; Hämäläinen, E.; Das Gupta, S.; Puhakka, N.; Natunen, T.; et al. Targeting Oxidative Stress with Antioxidant Duotherapy after Experimental Traumatic Brain Injury. Int. J. Mol. Sci. 2021, 22, 10555. https://doi.org/10.3390/ijms221910555
Kyyriäinen J, Kajevu N, Bañuelos I, Lara L, Lipponen A, Balosso S, Hämäläinen E, Das Gupta S, Puhakka N, Natunen T, et al. Targeting Oxidative Stress with Antioxidant Duotherapy after Experimental Traumatic Brain Injury. International Journal of Molecular Sciences. 2021; 22(19):10555. https://doi.org/10.3390/ijms221910555
Chicago/Turabian StyleKyyriäinen, Jenni, Natallie Kajevu, Ivette Bañuelos, Leonardo Lara, Anssi Lipponen, Silvia Balosso, Elina Hämäläinen, Shalini Das Gupta, Noora Puhakka, Teemu Natunen, and et al. 2021. "Targeting Oxidative Stress with Antioxidant Duotherapy after Experimental Traumatic Brain Injury" International Journal of Molecular Sciences 22, no. 19: 10555. https://doi.org/10.3390/ijms221910555