Article

Nutraceutical and Functional Properties of Peel, Pulp, and Seed Extracts of Six ‘Köhnü’ Grape Clones

1
Department of Horticulture, Faculty of Agriculture, Atatürk University, Erzurum 25240, Turkey
2
Department of Nutrition and Dietetics, Faculty of Health Sciences, Ataturk University, Erzurum 25240, Turkey
3
Department of Horticulture, Faculty of Agriculture, Sirnak University, Sirnak 73000, Turkey
4
Department of Viticulture and Enology, Faculty of Horticulture, Mendel University in Brno, Valticka 337, 691 44 Brno, Czech Republic
*
Author to whom correspondence should be addressed.
Horticulturae 2021, 7(10), 346; https://doi.org/10.3390/horticulturae7100346
Submission received: 31 August 2021 / Revised: 24 September 2021 / Accepted: 27 September 2021 / Published: 29 September 2021
(This article belongs to the Special Issue Bioactive Compound Levels of Medicinal Plants)

Abstract

:
Grape production has a long history in the Elazig province and surrounding vicinity and produced grapes have been used for table consumption and also processed into traditional beverages, Şıra (special non-alcoholic grape juice) and wine. In the Elazig province, the main grape cultivars are ‘Ağın Beyazı’, ‘Öküzgözü’, ‘Boğazkere’, ‘Şilfoni’, ‘Tahannebi’, and ‘Köhnü’. Among them, ‘Köhnü’ cultivar is highly preferred by consumers due to its black color and perfect berry characteristics. The cultivar has grown for centuries in different parts of Elazig and shows a great variability for most of its morphological and biochemical characteristics. In the present study, we aimed to determine morphological and biochemical traits in six ‘Köhnü’ clones sampled from Elazığ. The cluster weight of six clones was found between 334–394 g. The highest total phenolic content was observed in seeds followed by peel and pulp samples. The seed extract of Clone 2 had the highest total phenolic content at 254 mg gallic acid equivalent/100 g fresh weight. The results also showed that peel, pulp, and seed samples of ‘Köhnü’ grape clones had considerable amounts of antioxidant components determined by DPPH (1,1-Diphenyl-2-picryl-hydrazyl), FRAP (ferric reducing antioxidant power), and TEAC assays and might be rich sources of natural antioxidants. Among the six ‘Köhnü’ clones, Clone 3, and Clone 6 differed from the others in respect to the highest cluster weight, the highest concentrations of total phenolic content, and antioxidant activity. The results also implied that all clones could be used potentially as a readily accessible source of natural antioxidants and as a possible pharmaceutical supplement.

1. Introduction

Turkey, a bridge between Asia and Europe, is one of the most important countries for horticulture. Turkey ranks first in terms of production amount in some fruit species such as hazelnut, sweet cherry, apricot, sour cherry, and quince. The country has nine agricultural regions with different climate and soil conditions. This situation is quite remarkable for a country that does not have a large area. Each region has its own special fruit species, and more than 100 fruit species can be grown easily in Turkey. In terms of grape production, the country is the 6th most important grape producer in the world with a production value of approximately 4,000,000 tons [1,2,3,4].
Grapevine and viticulture have a culture that is as old as human history and can be found in mythologies and religious texts. In this sense, vineyard cultivation is not only an economic endeavor for Anatolian lands but also a factor ensuring cultural continuity. Anatolia is a central point in the journey of Vitis species. The South Caucasus (Georgia–Azerbaijan–Armenia) and the Fertile Crescent regions are accepted as the vine’s homeland [5,6].
Grapes have a very important place in Turkey’s agriculture. It is accepted as one of the most important and economic horticultural crops. Almost all agricultural regions have grape production in Turkey, and each region has its own characteristic production system. In Turkey, grape berries are traditionally processed into several very special products such as ‘pestil’, ‘pekmez’, ‘sucuk’, ‘koruk’, ‘köfter’, etc. All these products are unique to Turkey. The used cultivars and obtained products from grapes also differ from one region to the other. Approximately 30% of the grapes produced in Turkey are used in fresh (table) production, 37% are dried, 30% are processed into molasses, juice (şıra in Turkish), cider, etc., and 3% are used for wine production. Around 27% of grape production consists of seedless grapes. Seedless raisins are common in the Aegean region, and table and wine grapes are common in the Marmara and Mediterranean region [7,8,9,10,11].
Grape species can be classified as the species used commercially only for fruit production, the species used only for rootstocks, and the species used for ornamental purposes. Among the species used for fruit production, the most common in the world contains the Vitis vinifera L. ssp. sativa. There are more than 10,000 grape cultivars that belong to this species and more than 90% of the production in the world is obtained from Vitis vinifera. It is believed that the species is obtained from its wild ancestor Vitis vinifera L. ssp. sylvestris Gmel [12].
Scientific studies conducted around the world in recent years have revealed that plants, especially horticultural crops (fruits, vegetables, and grapes), have very important functions in terms of human health. They include a high content of non-nutritive, nutritive, and bioactive compounds such as flavonoids, phenolics, anthocyanins, phenolic acids, as well as nutritive compounds such as sugars, essential oils, carotenoids, vitamins, and minerals. They also have distinct flavor and taste, excellent medicinal value, and health care functions. Grape (Vitis vinifera) is a symbol of health, longevity, stamina, and spiritual resolve in particular in Mediterranean countries and its fruits have been traditionally used as a food and medicine dating back centuries, due to their unique flavors, nutritional properties, and health benefits. More recently, grape fruits have received increased attention among consumers worldwide. Grape fruits are well-known for their nutrition and health-promoting value as a source of phenolic acids, flavonoids, anthocyanins, amino acids, etc. Peel, pulp, and seeds of grape berries play an important role in human nutrition and health because of their nutritional and bioactive principles. In the last decades, compelling evidence has suggested that regular consumption of these products may contribute to reducing the incidence of chronic illnesses, such as cancer, cardiovascular diseases, ischemic stroke, neurodegenerative disorders, and aging [13,14,15,16,17,18,19,20]. Therefore, grape berries have been broadly studied due to their composition in phenolic substances and antioxidant compounds and their potential beneficial effects on human health. Studies have shown that grapes and their derivative products are a rich source of bioactive molecules, including flavonoid compounds (flavonols, monomeric catechins, proanthocyanidins, anthocyanins, anthocyanidins) and non-flavonoid phenolic compounds (resveratrol), as well as their metabolites. Grape cultivars differ from each other based on their phenolic substances and antioxidant capacity. Moreover, different plant parts such as leaves, seeds, berry peel, and berry pulp show differences in biologically active substances. Among grapes, black colored ones and their products contain rich nutritional and phenolic substances. The growing conditions, cultural applications, etc., also affect the biological activity of grape berries [20,21,22,23,24,25,26,27,28,29].
Elazığ province is located in eastern Anatolia and viticulture has a long tradition in the province. ‘Köhnü’ cultivar is one of the most important black grape cultivars grown in Elazığ (particularly in Hoşköy village) and used both for the production of high-quality table grapes and for wine production. Viticulture is carried out on an area of approximately 10.000 decares in Hoşköy, Elazığ in eastern Anatolia and is the main branch of agriculture in this village. Although many different grape cultivars (‘Ağın Beyazı’, ‘Öküzgözü’, ‘Boğazkere’, ‘Şilfoni’, ‘Tahannebi’) are grown throughout the village, ‘Köhnü’ is mostly preferred as a black table grape cultivar. In addition to its high average yield, ‘Köhnü’ has the characteristic of being the most grown dark-colored cultivar in the region for many years, due to its superior berry quality (balanced sugar-acid ratio, high juice yield, uniform peel color, distinct berry attractiveness, high yield capacity, etc.). It is a dark black-blue colored table cultivar with a long storage and high transportation capacity. The clusters of the cultivar are medium size and, in general, range from 300 to 400 gr with an average yield of 1.2–1.5 tons per decare. The cultivar is sensitive to powder sulphur application. High-dose sulphur applications damage the berries of this cultivar and cause yield loss. ‘Köhnü’, which is a medium-late maturated cultivar, has a long harvest period between 1st September and 15th November, although it varies according to the years. The cultivar is generally pruned over 9–12 buds. The plantations of this cultivar in Elazığ have a heterogeneous population and show great morphological diversity even in the same vineyard [30]. Therefore, the determination of morphological and bioactive contents of different clones could be important for obtaining clones with better characteristics than the population. The complex selection criteria encompass traits such as grape yield, sugar and organic acid content, and polyphenolic compounds in the grape [31,32].
Considering that there is limited information available on some important plant horticultural characteristics and bioactive content of peel, pulp, and seed extracts of ‘Köhnü’ clones, providing further data on these morphological and biochemical parameters will be useful for assessing the potential biological effects of these products in the future. In addition, obtained data will be helpful in further exploitation of different clones for food processing and breeding program. In addition, the development of novel products and innovative value chains, particularly in the context of being healthy, to determine bioactive content of different plant parts of this cultivar are promising strategies for the further valorization of grape.
Thus, the aim of this study is to obtain substantial knowledge on morphological traits, bioactive content, and in vitro antioxidant activity of different ‘Köhnü’ grape clones widely produced in Elazig province in Turkey.

2. Materials and Methods

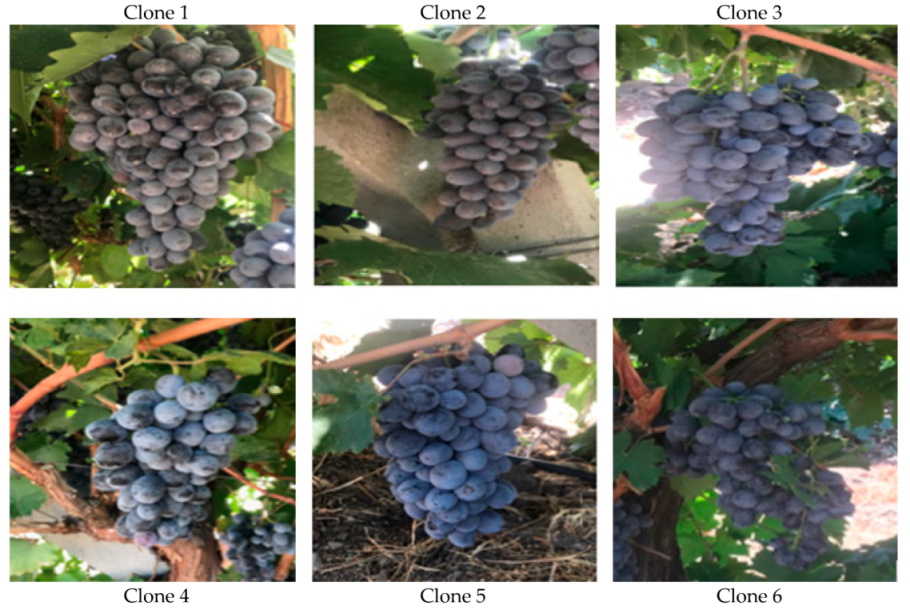
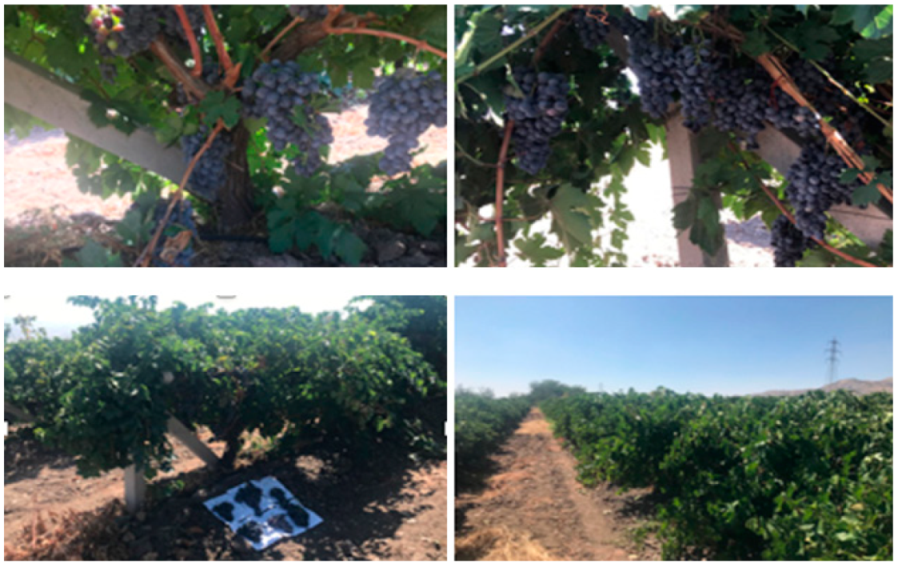
2.1. Plant Material, Sampling and Location

In this study, six different ‘Köhnü’ clones were harvested from different vineyards in Hoşköy village of Elazığ province in 2019 growing season. The coordinates of the village are 38.6833° N latitude, 39.3945° E longitude. The sampling vineyards are around 10 years old with trellis wire training system. The cluster samples were picked homogenously, and their laboratory analyses were conducted after the morphological measurements.

2.2. Morphological Traits

Cluster weight, cluster form, berry weight, and berry color were performed in the full ripening period on a representative 10 clusters per clone. Characterization of the berries (weight and skin color) was performed in a representative sample of 40 berries taken randomly from the middle part of clusters [33].

2.3. Extraction

The fresh grape pulp, skin, and seed extracts were carried out according to Contreras-Calderón [34] with slight modifications. Two grams of sample was placed in a capped centrifuge tube and 8 mL of acidic methanol-water (60:40, v/v pH 2) was added, after which the tube was vortexed for 1 min at normal atmosphere in a vortex mixer and shaken at room temperature in a shaker for 1 h. The tube was then centrifuged at 9000 rpm/10 min at 4 °C and the supernatant was recovered. Eight milliliters of acetone-water (70:30) was added to the residue, followed by stirring and sonication for 1 and 15 min, respectively, and centrifuged at 4° C and 9000 rpm/10 min. The last extraction was repeated without sonication. The supernatants were combined and transferred to a 25 mL volumetric flask, and acetone-water (70:30) was added to reach a final volume of 25 mL. Finally, the extract was stored at −80 °C until analysis.

2.4. Total Phenol Folin-Ciocalteu Assay

The total phenolic content was determined by the Folin–Ciocalteau method [35]. The analysis was conducted with a UV spectrophotometer (Thermo Fisher Scientific, Waltham, MA, USA) and was estimated as mg gallic acid equivalent (GAE)/100 g fresh weight (FW). Briefly, 9 mL of 80% methanol was added to 1 mL of sample. The mixture was centrifuged at 5500 rpm for 10 min. Fifty microliters of supernatant was added to 250 µL of Folin–Ciocalteu reagent. Then, 750 µL of 20% (w/v) Na2CO3 was supplemented and incubated for 2 h at room temperature. Then, the absorbance was measured at 760 nm against a blank. Quantifications were calculated through a calibration curve prepared daily with known concentrations of gallic acid (GA) standards, and the results are expressed as milligrams of GAE (Gallic acid equivalent) per 100 g of fresh weight (FW).

2.5. Total Antioxidant Capacity Measurement

2.5.1. DPPH Method

The DPPH (1,1-diphenyl-2-picryl-hydrazyl) assay was carried out according to Brand-Williams et al. [36]. The working DPPH solution was obtained by dissolving DPPH powder in methanol to obtain an absorbance of 0.7 ± 0.02 at 517 nm. Twenty microliters of the test sample, diluted appropriately with water, or Trolox standard or blank (distilled water), was placed in each well of a 96-well polystyrene microplate, after which 280 μL of working DPPH solution was added. After 30 min at 30 °C, the absorbance was measured at 517 nm using a microplate reader. Aqueous solutions of Trolox concentrations (50–500 μM) were used for calibration and the results are expressed as micromoles of Trolox equivalent (TE) per 100 g of fresh weight (μmol of TE/100 g of FW).

2.5.2. FRAP Method

The FRAP (Ferric reducing antioxidant power) assay was performed as previously described by Benzie and Strain [37]. Twenty microliters of test sample, diluted appropriately with water, or Trolox standard, or ferrous sulphate standard or blank (distilled water) was placed in each well of a 96-well polystyrene microplate, after which 280 μL of the FRAP reagent (containing TPTZ, FeCl3 and acetate buffer) freshly prepared and warmed at 37 °C was added. The absorbance values at 595 nm after 30 min were measured using a Fluostart Omega microplate reader thermostatted at 37 °C. The standard curves were constructed using FeSO4 (115–1150 μM) and Trolox solutions (20–400 μM) and the results are expressed as micromoles of Trolox equivalent (TE) per 100 g of fresh weight (μmol of TE/100 g of FW).

2.5.3. TEAC Method

The TEAC (ABTS), Trolox equivalent antioxidant capacity assay was carried out according to Re et al. [38]. TEAC (ABTS) stock solution was prepared from 7 mM ABTS and 2.45 mM potassium persulphate in a volume ratio of 1:1, and then incubated in the dark for 16 h at room temperature. The radical ABTS solution was obtained by diluting ABTS stock solution with phosphate buffer 5 mM at pH = 7.4 to obtain an absorbance of 0.7 ± 0.02 at 730 nm. Thirty microliters of the test sample, diluted appropriately with water, or Trolox standard or blank (distilled water) was placed in each well of a 96-well polystyrene microplate, after which 270 μL of radical ABTS was added. After 30 min at 30 °C, the absorbance was measured at 730 nm using a microplate reader. Aqueous solutions of Trolox concentrations (20–200 μM) were used for calibration and the results are expressed as micromoles of Trolox equivalent (TE)/ 100 g of fresh weight (μmol of TE/100 g of FW).

2.6. Specific Sugars

Sugar (fructose, sucrose, and glucose) analysis was performed with the methods described by Melgarejo et al. [39]. One milliliter of whole berry extract was centrifuged at 10,000 rev per min for 2 min at 4 °C. Supernatants were passed by SEP-PAK C18 cartridge. HPLC readings were made with μbondapak-NH2 column using 85% acetonitrile as the liquid phase with a refractive index detector (IR). The chromatographic separation in Agilent 1100 series HPLC took place in a DAD detector (Agilent, Waldbronn, Germany). Fructose, glucose, and sucrose standards were used for the calculations of the sugar contents. Results were given as g/100 g fresh weight.

2.7. Organic Acids

The organic acid composition of the berries was determined by Bevilacqua and Califano [40]. Whole berry extracts were obtained by crushing the berries in a cheesecloth. H2SO4 (0.009 N) was then homogenized with a shaker for 1 h. The mixture was then centrifuged at 15,000 rpm for 15 min and the supernatants were filtered twice through a 0.45 μm membrane filter with a coarse filter (Millipore Millex-HV Hydrophilic PVDF, Millipore, Burlington, MA, USA) and passed through an SEP-PAK C18 cartridge. Organic acid readings were performed by HPLC using the Aminex column (HPX-87 H, 300 mm × 7.8 mm, Bio-Rad Laboratories, Richmond, CA, USA) at 214 and 280 nm wavelengths in the Agilent package program (Agilent, Santa Clara, CA, USA). Results were given as g/100 g fresh weight.

2.8. Statistical Analysis

The study was planned as four replicates including 10 samples per replicate. In the statistical evaluations, Windows SPSS 20 was used and the differences between the means were evaluated by ANOVA variance analysis and determined with Duncan’s multiple comparison test (p < 0.05).

3. Results and Discussion

3.1. Morphological Traits

The morphological traits of the six clones of ‘Köhnü’ grape cultivar grown in same ecology and altitude in Hoşköy village of Elazığ province are shown in Table 1. The clones presented statistically significant differences in cluster and berry weight (p < 0.05).
Cluster form has been recorded as winged conical in Clone 1, Conical in Clone 2, Clone 4, and Clone 5, and irregular winged conical in Clone 3 and Clone 6 (Table 1, Figure 1). The cluster weight was found between 334–394 g. Among the clones, the highest berry weight was observed in Clone 3 as 4.45 g and followed by, in descending order, Clone 1 (4.33 g) > Clone 6 (4.26 g) > Clone 5 (4.12 g) > Clone 4 (4.04 g) > Clone 2 (3.92 g), respectively (Table 1). All six ‘Köhnü’ clones had black-blue berry color and all of them are used for table consumption and also processed into juice (Şıra) and wine. The cultivar was grown in a trellis wire system in all vineyards in the village (Figure 2).
In the Elazığ province, the cultivar is preferred by farmers and consumers due to its suitability for fresh consumption and processing. In fact, the cultivar has perfect fresh berry characteristics (bigger berries, attractive color, unique sugar-acid balance, medium-thick peel). Keskin [41] reported the average berry and cluster weight of ‘Köhnü’ grape cultivar in Elazığ province to be 5.40 g and 338 g. Koc et al. [42] also studied the ‘Köhnü’ cultivar in Malatya conditions in Turkey and reported the average berry and cluster weight to be 4.16 g and 349 g, respectively. Both studies indicated that the morphological data could be changed according to the growing site. According to OIV [33], the cluster weight of all clones was found to be over 300 g and classified as big. Good quality in table grapes represents a combination of medium-sized clusters of uniformly large, perfect berries with the characteristic color, pleasing flavor, and texture of the cultivar. Uniform color formation and suitability for transportation are also desirable traits for table grapes [43].
In the literature, there are studies that determined morphological characteristics of grape cultivars and these studies indicate a wide variability on cluster weight, cluster form, berry color, and berry weight according to cultivars and treatments [44,45]. We found great diversity within the ‘Köhnü’ clones, in particular, clusters from even the same vineyard.

3.2. Total Phenolic Content

The total phenolic content of peel, pulp, and seed samples of six clones ‘Köhnü’ grape cultivar is shown in Table 2. The results clearly indicate statistically significant differences among clones considering peel, pulp, and seed parts (p < 0.05) (Table 2)
For all used clones, total phenolic content was the highest in seed samples and followed by peel and the lowest values were obtained from pulp samples (Table 2). Overall pulp samples exhibited the lowest total phenolic content (Table 2). Clone 3 showed the highest amount of total phenolic content for peel and pulp samples (139 mg GAE/100 g FW in peel and 35.11 mg GAE/100 g FW in pulp) among the six ‘Köhnü’ clones. However, the highest total phenolic content in seeds was determined in Clone 2 as 254 mg GAE/100 g FW. Overall, the lowest total phenolic content was obtained from Clone 5 (96 mg GAE/100 g FW for peel, 27.73 mg GAE/100 g FW for pulp, and 193 mg GAE/100 g FW for seed), respectively (Table 2).
The results showed that there was clonal variation for total phenolic content among six clones. In the literature, not many studies have been conducted on the total phenolic content of peel, pulp, and seed samples of different grape cultivars and even a very limited number of studies have been conducted on different clones of a single cultivar.
Yi et al. [46] observed great variability in total phenolic content in whole berries for grape cultivars between 44 and 184 mg GAE/100 g fresh samples which is in accordance with our results. In Spain, Ruiz-Torralba et al. [47] used whole berries of two white and red grape cultivars and reported total phenolic content values between 124–151 mg GAE/g FW. A large number of grape cultivars (whole berries) were used in a total phenol content analysis in Italy and great variation has been observed among cultivars in terms of total phenolic content 92–468 mg GAE/100 g FW [48]. In China, Liu et al. [49] reported variable total phenolic content ranging from 29 to 140 mg GAE/100 g FW. Total phenolic content was found to be the highest in seeds, followed by skins and pulps indicating similarities with our study [50]. Yilmaz et al. [51] reported total phenolic contents of grape pulp, seed, and peel parts ranged from 9.26 to 62.29, from 162.29 to 326.18, and from 96.61 to 167.42 mg gallic acid equivalents/100 g fresh weight among cultivars, respectively. Our findings coincide with the results of Yilmaz et al. [51]. Previous studies have indicated that total phenolic content varies among plant organs of grape cultivars and clones. Growing location, climate, soil, temperature, cultural practices, ripening stage, training system, etc., affect the total phenolic content [51,52,53,54,55]. Phenolic compounds contribute color and taste characteristics of grape berries and they have also significantly contributed antiradical and antioxidant properties of grape berries [56]. Black and Red grape cultivars in general contain higher amounts of polyphenols than white ones [57]. Karaman et al. [23] reported that the total phenolic content in grape berries cultivar dependent and seeds was found to be richer than peels of all grape cultivars used.

3.3. Total Antioxidant Capacity

3.3.1. DPPH Assay

Table 3 shows the DPPH scavenging against peel, pulp, and seed fraction of six clones of ‘Köhnü’. The results revealed significant differences in terms of DPPH scavenging capacity among the samples considering all berry sections (peel, pulp, and seed extracts). (p < 0.05). Among the berry sections, seed extracts were found to have a higher DPPH scavenging effect, followed by peel and pulp. Among the clones, the highest activity was obtained from Clone 1 seed, peel, and pulp parts. Berry parts were found in descending order: seed > skin > pulp for DPPH activity (Table 3). The highest DPPH radical scavenging of seed samples was observed in Clone 6 as 1622 μmol Trolox/100 g FW, followed by Clone 3 with 1511 μmol Trolox/100 g FW and Clone 2 with 1478 μmol Trolox/100 g FW, respectively. The lowest values were seen in Clone 5 with 1290 μmol Trolox/100 g FW (Table 3). For peel and pulp samples, the DPPH activity was found between 873–970 μmol Trolox/100 g FW for peel and 210–269 μmol Trolox/100 g FW for pulp, respectively (Table 3). The results strongly indicate that ‘Köhnü’ grape seed and skin extracts belong to different clones, significantly (p < 0.05) inhibited DPPH free radicals’ generation.
In fact, in the literature, grape seeds were found more effective than peel and pulp for radical scavenging. In a study conducted on Campbell Early seeds, a strong DPPH radical scavenging activity was observed compared to pulps [58]. In another study, it was found that grape cultivars and berry parts exhibited quite different DPPH scavenging effects and concluded that cultivar is the main factor for DPPH scavenging to estimate antioxidant activity in grapes [59]. Six grape cultivars were used in the DPPH activity analysis and seed parts of all cultivars showed stronger DPPH scavenging effects than pulp [60]. Mandić, et al. [61] found that the total phenolic content and antioxidant activity of grape could explain cultivar differences (genetic background), and also cultivation techniques, maturation stage, and harvest period may affect phenolic biosynthesis and antioxidant capacity in grape seed, skin, and pulp. In Turkey, a number of different colored grape cultivars were analyzed by the DPPH assay and it was found that seeds of grape cultivars are the best source of antioxidants than peel and pulp [51]. Anastasiadi et al. [62] indicated that grape seeds have the best antioxidant activity compared to skin and pulp by using all antioxidant-determining methods. Shen et al. [50] analyzed seeds, pulp, and peel of grape cultivars and found that the DPPH scavenging effects of the seeds were remarkably higher than those of peels and pulps.

3.3.2. FRAP Assay

The FRAP antioxidant activity results for seed, pulp, and seeds of six ‘Köhnü’ clones are shown in Table 4. As indicated in Table 4 statistically clonal variation in antioxidant activity, determined by the FRAP assay, was evident (p < 0.05).
As indicated in Table 4, seed samples of all six grape clones showed the highest FRAP values followed by peel samples. Overall, the pulp samples had the lowest antioxidant activity. Considering seed sample, the antioxidant activity in the FRAP assay was in descending order: 45,200 μmol Trolox/100 g FW (Clone 6) > 44,310 μmol Trolox/100 g F (Clone 2) > 42,365 μmol Trolox/100 g (Clone 3) > 40,200 μmol Trolox/100 g (Clone 1) > 38,600 μmol Trolox/100 g (Clone 4) > 36,548 μmol Trolox/100 g (Clone 5), respectively (Table 4). The second highest antioxidant activity was observed in peel samples which varied from 3389 μmol Trolox/100 g (Clone 5) to 4018 μmol Trolox/100 g (Clone 6) indicating great differences among clones. In terms of pulp samples, the FRAP values were very low and determined in the range of 65 μmol Trolox/100 g (Clone 5) and 98 μmol Trolox/100 g (Clone 6), respectively (Table 4). Liu et al. [49] used pulp samples of 30 common grape cultivars with white, red, and black peel color in China and found FRAP values in the range of 59–612 μmol Trolox/100 g FW, respectively. Our FRAP results showed some similarities to this study.
In a previous study, FRAP values of whole berries of a large number of grape cultivars were found to be quite variable ranging from 173 to 1012 μmol Fe (II)/100 g FW [63]. Sochorova et al. [64] used seeds of different well-known international grape cultivars and found that cultivar shows different FRAP values and seeds had stronger antioxidant activity. In another study [50], seeds of six grape cultivars exhibited higher FRAP values than pulp which is in agreement with our present result. Yilmaz et al. [51] used a large number of grape seed, pulp, and peel extracts and found that FRAP values were the highest in seed samples. The majority of studies showed that grape seed contains higher FRAP values than peels and, in addition, peels had higher FRAP values than pulps [23,65,66].

3.3.3. TEAC Assay

TEAC antioxidant-determining assay results of peel, pulp, and the seed of six clones of ‘Köhnü’ are given in Table 5. We found statistically significant differences among clones based on peel, pulp, and seed extracts (p < 0.05). As obtained in the other antioxidant-determining methods (DPPH and FRAP), the highest antioxidant activity was obtained in seeds, followed by peel and the lowest TEAC values are evident in pulp samples (Table 5). The TEAC values were found between 1195–1468 μmol Trolox/100 g FW for seed samples, 286–365 μmol Trolox/100 g FW for peel samples, and 42–69 μmol Trolox/100 g FW for pulp samples, respectively (Table 5). Previous studies, using the TEAC method, also indicated that among horticultural crops, grape berries were rich in antioxidants [20,47]. Liu et al. [49] used 30 grape cultivars grown in China and determined TEAC values of whole berries in the range of 339–4839 μmol TE/100 g FW, respectively, indicating similarities with our study.
Weidner et al. [67] studied phenolic compounds isolated from seeds of European and Japanese species of grapevine (Vitis vinifera and Vitis coignetiae) and found that seeds contained great amounts of tannins and detectable levels of catechins and p-coumaric, ferulic, and caffeic acids that have antioxidant effects. Yilmaz et al. [51] used a large number of grape cultivars with different berry peel colors and found great variability both among cultivars and berry parts (peel, pulp, and seeds) in terms of antioxidant activity by using the TEAC assay. They also indicated that DPPH, FRAP, and TEAC assays were useful to determine the antioxidant activity of different plant parts of grapes.
Our results are clearly showed that high DPPH, FRAP, and TEAC values in peel, pulp, and seed samples of ‘Köhnü’ grape clones corresponded to high total phenolic content, while plants with low antioxidant activity exhibited low total phenolic content. These findings suggest that total phenolic content could be used as an indicator of antioxidant properties for ‘Köhnü’ grape clones.

3.4. Sugar Content

The sugar content in whole berries of six clones of ‘Köhnü’ is given in Table 6. As presented in Table 6, six clones showed statistically significant differences from each other for sugar content at p < 0.05 level. Glucose was found higher than fructose for all samples and changed from 12.8 (Clone 4) to 14.1% g/100 g FW (Clone 3). Fructose content was in the range of 12.7 (Clone 4) and 13.6 g/100 g FW (Clone 3). Sucrose content was found in negligible amounts in all six ‘Köhnü’ clones and changed between 0.05–0.08 g/100 g FW.
Grape berries are well known for their sugar and organic acid content. In the literature, those phenomena are frequently searched parameters for grape berry quality evaluation. Previous studies have indicated that grape berries are rich in glucose and fructose, and the values of these major sugars, were found to be closer to each other. Studies have also indicated that glucose and fructose content and their ratio greatly changed according to cultivar, growing conditions, etc., in grapes [2,68,69], and both dominant sugars account for 96.00–98.00 of the total sugar content in grape berries. Petrisor and Chirecanu [68] also reported that sucrose content was very low (even nondetectable) in all grape cultivars and they found the ratio of glucose/fructose in grape berries varied in range from 1.0 to 1.06. They also found that some cultivars had slightly higher fructose content than glucose. Sugar in grapes is mainly accumulated in the form of glucose and fructose [70]; during harvest, fructose and glucose are close to each other [71], which is consistent with the results obtained in this study. At the same time, the content of sucrose in grape berry was relatively low because most of the sucrose was hydrolyzed during the transportation from grape leaves to fruits, which was converted into a reducing sugar, resulting in a low sucrose content in grape berries [72]. The content and composition of sugar have great influences on the flavor, color, and other nutritional components of grapes. As an important nutrient in grapes, sugar is also an important sign that shows the ripeness of grapes [68,69].

3.5. Organic Acid Content

Table 7 shows organic acids in juices of six ‘Köhnü’ grape clones. The results indicate statistically significant differences among clones (p < 0.05) for tartaric and malic acid content (Table 7).
For all ‘Köhnü’ clones, tartaric acid was the main organic acid, followed by malic acid. Overall, oxalic acid content was lower—even in negligible amounts. The highest tartaric acid content was obtained from Clone 3 and Clone 2 as 11.25 and 11.06 g/100 g FW while the lowest value was observed in juices of Clone 4 as 10.04 g/100 g FW. Malic acid concentrations were found between 5.10 g/100 g FW (Clone 6) and 6.23 g/100 g FW (Clone 5) (Table 7). Previous studies have also indicated that tartaric acid was the main and dominant organic acid in grape juices followed by malic acid, and both organic acids accounted for 55–60% and 30–39% of the total organic acids in grape, respectively [2,68,69,73]. In Brazil, Couelho et al. [74] found that tartaric acid was the main acid present in wines and juices representing over 50% of the total acids quantified. Zhang et al. [69] showed that among the five cultivars of table grapes in China, tartaric acid and malic acid were the main organic acids. Organic acids are the major metabolites that exist in grapes whose compositions and concentrations are the main parameters related to grape processing and quality evaluation [75,76]. The content can directly affect the taste balance, chemical stability, and pH value. Previous studies have indicated great biochemical differences in horticultural crops [76,77,78,79,80,81,82,83].

4. Conclusions

‘Köhnü’ grape cultivar is cultivated in Elazig province for centuries and during the long cultivation period new clones are likely to arise due to mutation. This study is the first to report on the total phenolic content, antioxidant activity, specific sugars, and organic acids, which revealed significant differences between the corresponding clones. We found great versatility in particular in the total phenolic content among the studied clones. Clone 3 and Clone 6 differed from the other clones in respect to the highest cluster weight, the highest concentrations of total phenolic content, and antioxidant activity. The findings point to a possible better viticultural potential of these two clones.

Author Contributions

Conceptualization, M.S.U., N.K., M.K. and S.E.; data curation, M.S.U., N.K., S.E. and M.K.; formal analysis, S.E., M.S.U. and N.K.; methodology, S.E. and M.K.; project administration, M.S.U., M.K. and S.E.; visualization, M.K., M.B. and J.S.; writing—original draft, S.E., M.B. and J.S.; writing—review and editing, S.E., M.B. and J.S. All authors have read and agreed to the published version of the manuscript.

Funding

This study supported by the project CZ.02.1.01/0.0/0.0/16_017/0002334 Research Infrastructure for Young Scientists; this is co-financed by Operational Programme Research, Development and Education.

Data Availability Statement

All-new research data were presented in this contribution.

Conflicts of Interest

The authors declare that they have no conflict of interest.

References

  1. Engin, S.P.; Mert, C. The effects of harvesting time on the physicochemical components of aronia berry. Turk. J. Agric. For. 2020, 44, 361–370. [Google Scholar] [CrossRef]
  2. Eyduran, S.P.; Akin, M.; Ercisli, S.; Eyduran, E.; Maghradze, D. Sugars, organic acids, and phenolic compounds of ancient grape cultivars (Vitis vinifera L.) from lgdir province of Eastern Turkey. Biol. Res. 2015, 48, 2. [Google Scholar] [CrossRef] [Green Version]
  3. Ozdemir, A.E.; Didin, O.; Candir, E.; Kaplankiran, M.; Yildiz, E. Effects of rootstocks on storage performance of Nova mandarins. Turk. J. Agric. For. 2019, 43, 307–317. [Google Scholar] [CrossRef]
  4. Çelik, H.; Köse, B.; Cangi, R. Determination of Fox grape genotypes (Vitis labrusca L.) grown in Northeastern Anatolia. Hort. Sci. 2008, 35, 162–170. [Google Scholar]
  5. Korkutal, I.; Bahar, E.; Kök, D.; Şahin, N.; Uysal, T.; Özalp, Z.O.; Yaşasın, A.S.; Candar, S.; Alço, T.; Işın, M.A. Collecting genetic materials and isolating DNAs of grapevine (Vitis spp.) as naturally grown in Ganos Mountains (in Turkish with English abstract). Mediterr. Agric. Sci. 2018, 31, 5–15. [Google Scholar]
  6. Candar, S.; Uysal, T.; Ayaz, A.; Akdemir, U.; Korkutal, I.; Bahar, E. Viticulture tradition in Turkey. Vitic. Stud. 2021, 1, 39–54. [Google Scholar]
  7. Soylemezoglu, G.; Atak, A.; Boz, Y.; Unal, A.; Saglam, M. Viticulture in Turkey. Chronica Hortic. 2016, 56, 27–31. [Google Scholar]
  8. Isci, B.; Kacar, E.; Altındisli, A. The effects of some exogenous applications on quality in ‘Crimson Seedless’ grape. Erwerbs-Obstbau 2020, 62, 87–100. [Google Scholar] [CrossRef]
  9. Kara, Z.; Yazar, K.; Doğan, O.; Vergili, E. Sodium nitroprusside and gibberellin effects on seed germination and seedling development of grapevine (Vitis vinifera L.) cvs. Ekşi Kara and Gök Üzüm. Erwerbs-Obstbau 2020, 62, 61–68. [Google Scholar] [CrossRef]
  10. Tangolar, S.; Tangolar, S.; Turan, M.; Ateş, F. Determination of phytochemical and mineral contents of seeds from ‘Semillon’and ‘Carignane’ wine grape cultivars grown under different irrigation conditions. Erwerbs-Obstbau 2020, 62, 115–123. [Google Scholar] [CrossRef]
  11. Kaya, E.D.; Bagci, O. Purification and biochemical characterization of polyphenol oxidase extracted from Kirmizi Kismis grape (Vitis vinifera L.). J. Food Biochem. 2021, 45, e13627. [Google Scholar] [CrossRef]
  12. Ağaoğlu, Y.S. Scientific and Experimental Viticulture; Kavaklıdere Publication: Ankara, Turkey, 2002; Volume 2. [Google Scholar]
  13. Hassan, H.A.; Al-Rawi, M.M. Grape seeds proanthocyanidin extract as a hepatic-reno-protective agent against gibberellic acid induced oxidative stress and cellular alterations. Cytotechnology 2013, 65, 567–576. [Google Scholar] [CrossRef] [Green Version]
  14. Teixeira, A.; Baenas, N.; Dominguez-Perles, R.; Barros, A.; Rosa, E.; Moreno, D.A.; Garcia-Viguera, C. Natural bioactive compounds from winery by-products as health promoters: A review. Int. J. Mol. Sci. 2014, 15, 15638–15678. [Google Scholar] [CrossRef] [PubMed] [Green Version]
  15. Bakhshabadi, H.; Mirzaei, H.; Ghodsvali, A.; Jafari, S.M.; Ziaiifar, A.M.; Farzaneh, V. The effect of microwave pretreatment on some physico-chemical properties and bioactivity of black cumin seeds. Ind. Crops. Prod. 2017, 97, 1–9. [Google Scholar] [CrossRef]
  16. Farzaneh, V.; Ghodsvali, A.; Bakhshabadi, H.; Dolatabadi, Z.; Farzaneh, F.; Carvalho, I.S.; Sarabandi, K. Screening of the alterations in qualitative characteristics of grape under the impacts of storage and harvest times using artificial neural network. Evol. Syst. 2018, 9, 81–89. [Google Scholar] [CrossRef]
  17. Yousef, M.I.; Mahdy, M.A.; Abdou, H.M. The potential protective role of grape seed proanthocyanidin extract against the mixture of carboplatin and thalidomide induced hepatotoxicity and cardiotoxicity in male rats. Prev. Med. Commun. Health 2020, 2, 1–7. [Google Scholar] [CrossRef]
  18. Ali, K.; Maltese, F.; Choi, Y.; Verpoorte, R. Metabolic constituents of grapevine and grape-derived products. Phytochem. Rev. 2010, 9, 357–378. [Google Scholar] [CrossRef] [Green Version]
  19. Xu, C.; Zhang, Y.; Cao, L.; Lu, J. Phenolic compounds and antioxidant properties of different grape cultivars grown in China. Food Chem. 2010, 119, 1557–1565. [Google Scholar] [CrossRef]
  20. Costa, E.; Cosme, F.; Jordão, A.M.; Mendes-Faia, A. Anthocyanin profile and antioxidant activity from 24 grape varieties cultivated in two Portuguese wine regions. J. Int. Sci. Vigne Vin 2014, 48, 51–62. [Google Scholar] [CrossRef]
  21. Pantelić, M.M.; Dabić Zagorac, D.Č.; Davidović, S.M.; Todić, S.R.; Bešlić, Z.S.; Gašić, U.M.; Tešić, Ž.L.; Natić, M.M. Identification and quantification of phenolic compounds in berry skin, pulp, and seeds in 13 grapevine varieties grown in Serbia. Food Chem. 2016, 211, 243–252. [Google Scholar] [CrossRef]
  22. Kök, D.; Bal, E.; Bahar, E. Physical and biochemical traits of selected grape varieties cultivated in Tekirdağ, Turkey. Int. J. Sustain. Agric. Manag. Inform. 2017, 3, 215–223. [Google Scholar] [CrossRef]
  23. Karaman, H.T.; Küskü, D.Y.; Söylemezoğlu, G. Phenolic compounds and antioxidant capacities in grape berry skin, seed and stems of six wine grape varieties grown in Turkey. Acta Sci. Pol. Hortorum 2021, 20, 15–25. [Google Scholar] [CrossRef]
  24. Rombaldi, C.V.; Bergamasqui, M.; Lucchetta, L.; Zanuzo, M.; Silva, J.A. Vineyard yield and grape quality in two different cultivation systems. Rev. Bras. Frutic. 2004, 26, 89–91. [Google Scholar] [CrossRef]
  25. Pantelić, M.; Dabić Zagorac, D.; Natić, M.; Gasić, U.; Jović, S.; Vujović, D.; Djordjevic, J.P. Impact of clonal variability on phenolics and radical scavenging activity of grapes and wines: A study on the recently developed Merlot and Cabernet Franc clones (Vitis vinifera L.). PLoS ONE 2016, 11, e0163823. [Google Scholar] [CrossRef] [PubMed] [Green Version]
  26. Král, M.; Ošťádalová, M.; Pokorná, J.; Tremlová, B.; Rohrerová, E.; Šnirs, M.; Fekete, T. Quality of wine grape cultivars grown in Czech Republic. Erwerbs-Obstbau 2018, 60, 29–35. [Google Scholar] [CrossRef]
  27. Ferraz da Costa, D.C.; Pereira Rangel, L.; Quarti, J.; Santos, R.A.; Silva, J.L.; Fialho, E. Bioactive compounds and metabolites from grapes and red wine in breast cancer chemoprevention and therapy. Molecules 2020, 25, 3531. [Google Scholar] [CrossRef] [PubMed]
  28. Mucalo, A.; Maleti’c, E.; Zduni´c, G. Extended harvest date alter flavonoid composition and chromatic characteristics of Plavac Mali (Vitis vinifera L.) grape berries. Foods 2020, 9, 1155. [Google Scholar] [CrossRef]
  29. Allegro, G.; Pastore, C.; Valentini, G.; Filippetti, I. The evolution of phenolic compounds in Vitis vinifera L. red berries during ripening: Analysis and role on wine sensory—A review. Agronomy 2021, 11, 999. [Google Scholar] [CrossRef]
  30. Ünal, M.S.; Ergenoglu, F. Viticulture in Malatya and Elazığ provinces and ampelographic characteristics of grape cultivars grown in Malatya province. J. Cukurova Univ. Agric. 2001, 16, 1–8. [Google Scholar]
  31. Ibáñez, J.; Carreño, J.; Yuste, J.; Martínez-Zapater, J.M. Grapevine breeding and clonal selection programmes in Spain. In Grapevine Breeding Programs for the Wine Industry; Reynolds, A., Ed.; Woodhead Publishing: Cambridge, UK, 2015; pp. 183–209. [Google Scholar]
  32. Medrano, H.; Tortosa, I.; Montes, E.; Pou, A.; Balda, P.; Bota, J.; Escalona, J.M. Genetic improvement of grapevine (Vitis vinifera L.) water use efficiency: Variability among varieties and clones. In Water Scarcity and Sustainable Agriculture in Semiarid Environment; García-Tejero, I.F., Duran, V.H.I., Eds.; Academic Press: London, UK, 2018; pp. 377–401. [Google Scholar]
  33. OIV. Organisation Internationale de la Vigne et du Vin. In OIV Descriptor List for Grape Varieties and Vitis Species, 2nd ed.; Organization Intergouvernementale crée par l’Accord Internationa: Paris, France, 2001; Available online: https://www.oiv.int/public/medias/2274/code-2e-edition-finale.pdf (accessed on 15 April 2020).
  34. Contreras-Calderón, J.; Calderón-Jaimes, L.; Guerra-Hernández, E.; García-Villanova, B. Antioxidant capacity, phenolic content and vitamin C in pulp, peel and seed from 24 exotic fruits from Colombia. Food Res. Int. 2011, 44, 2047–2053. [Google Scholar] [CrossRef]
  35. Krawitzky, M.; Arias, E.; Peiro, J.M.; Negueruela, A.I.; Val, J.; Oria, R. Determination of color, antioxidant activity, and phenolic profile of different fruit tissue of Spanish ‘Verde Doncella’ apple cultivar. Int. J. Food Prop. 2014, 17, 1532–2386. [Google Scholar] [CrossRef] [Green Version]
  36. Brand-Williams, W.; Cuvelier, M.; Berset, C. Use of a free radical method to evaluate antioxidant activity. LWT-Food Sci. Technol. 1995, 28, 25–30. [Google Scholar] [CrossRef]
  37. Benzie, I.F.F.; Strain, J.J. The ferric reducing ability of plasma (FRAP) as a measure of “Antioxidant power”: The FRAP assay. Anal. Biochem. 1996, 239, 70–76. [Google Scholar] [CrossRef] [PubMed] [Green Version]
  38. Re, R.; Pellegrini, N.; Proteggente, A.; Pannala, A.; Yang, M.; Rice-Evans, C. Antioxidant activity applying an improved ABTS radical cation decolorization assay. Free Radic. Biol. Med. 1999, 26, 1231–1237. [Google Scholar] [CrossRef]
  39. Melgarejo, P.; Salazar, D.M.; Artes, F. Organic acids and sugars composition of harvested pomegranate fruits. Eur. Food Res. Technol. 2000, 211, 185–190. [Google Scholar] [CrossRef]
  40. Bevilacqua, A.E.; Califano, A.N. Determination of organic acids in dairy products by high performance liquid chromatography. J. Food Sci. 1989, 54, 1076–1079. [Google Scholar] [CrossRef]
  41. Keskin, N. Determination of relationships between yield and quality characteristics with some native grape cultivars grown in Elazığ. Turk. J. Appl. Sci. Technol. 2017, 1, 25–30. [Google Scholar]
  42. Koc, H.; Cocen, E.; Kokargul, R.; Saritepe, Y.; Saglam, H. Phenological, ampelographic and quality properties of ‘Köhnü’ (Vitis vinifera L.) grape cultivar. Agric. Eng. 2021, 372, 16–24. [Google Scholar]
  43. Dardeniz, A. Effects of cluster tipping on yield and quality of Uslu and Cardinal table grape cultivars. COMU J. Agric. Fac. 2014, 2, 21–26. [Google Scholar]
  44. Sabir, A.; Tangolar, S.; Buyukalaca, S.; Kafkas, S. Ampelographic and molecular diversity among grapevine (Vitis spp.) cultivars. Czech. J. Genet. Plant Breed. 2009, 45, 160–168. [Google Scholar] [CrossRef] [Green Version]
  45. Korkutal, I.; Bahar, E.; Ozge, K. The effect of altitude on grape quality. Trakya Univ. Eng. Sci. J. 2012, 13, 17–29. [Google Scholar]
  46. Yi, O.S.; Meyer, A.S.; Frankel, E.N. Antioxidant activity of grape extracts in a lecithin liposome system. JAOCS 1997, 74, 1301–1307. [Google Scholar] [CrossRef]
  47. Ruiz-Torralba, A.; Guerra-Hernández, E.J.; García-Villanova, B. Antioxidant capacity, polyphenol content and contribution to dietary intake of 52 fruits sold in Spain. CyTA-J. Food 2018, 16, 1131–1138. [Google Scholar] [CrossRef] [Green Version]
  48. Revilla, E.; Carrasco, D.; Benito, A.; Arroyo-Garcia, R. Anthocyanin composition of several wild grape accessions. Am. J. Enol. Vitic. 2010, 61, 536–543. [Google Scholar] [CrossRef]
  49. Liu, Q.; Tang, G.-Y.; Zhao, C.-N.; Feng, X.-L.; Xu, X.-Y.; Cao, S.-Y.; Meng, X.; Li, S.; Gan, R.-Y.; Li, H.-B. Comparison of antioxidant activities of different grape varieties. Molecules 2018, 23, 2432. [Google Scholar] [CrossRef] [Green Version]
  50. Shen, Y.; Cheng, X.; Gu, H.; Zhou, G.; Xia, H.; Liang, D. Determination of antioxidant compounds and antioxidant activity of six table grapes with red skin. E3S Web Conf. 2020, 145, 01004. [Google Scholar] [CrossRef] [Green Version]
  51. Yilmaz, Y.; Göksel, Z.; Erdogan, S.S.; Özturk, A.; Atak, A.; Ozer, C. Antioxidant activity and phenolic content of seed, skin and pulp parts of 22 grape (Vitis vinifera l.) cultivars (4 common and 18 registered or candidate for registration). J. Food Process. Preserv. 2015, 39, 1682–1691. [Google Scholar] [CrossRef]
  52. Marinova, D.; Ribarova, F.; Atanassova, M. Total phenolics and total flavonoids in Bulgarian fruits and vegetables. J. Univ. Chem. Technol. Met. 2005, 40, 255–260. [Google Scholar]
  53. Gokturk-Baydar, N.; Babalik, Z.; Turk, F.H.; Cetin, E.S. Phenolic composition and antioxidant activities of wines and extracts of some grape varieties grown in Turkey. J. Agric. Sci. 2011, 17, 67–76. [Google Scholar]
  54. Cetin, E.S.; Babalik, Z.; Gokturk Baydar, N. Determination of total carbohydrates, phenolic substance, anthocyanin, β-Caroten and Vitamine C content in berries of grape cultivars. In Proceedings of the IV National Small Fruit Symposium, Antalya, Turkey, 3–5 October 2012; pp. 151–159. [Google Scholar]
  55. Shiraishi, M.; Shinomiya, R.; Chijiwa, H. Varietal differences in polyphenol contents, antioxidant activities and their correlations in table grape cultivars bred in Japan. Sci. Hortic. 2018, 227, 272–277. [Google Scholar] [CrossRef]
  56. Sridhari, K.; Charles, A.L. In vitro antioxidant activity of Kyoho grape extracts in DPPH and ABTS assays: Estimation methods for EC50 using advanced statistical programs. Food Chem. 2019, 275, 41–49. [Google Scholar] [CrossRef]
  57. Ivanišová, E.; Terentjeva, M.; Kántor, A.; Frančáková, H.; Kačániová, M. Phytochemical and antioxidant profile of different varieties of grape from the small Carpathians wine region of Slovakia. Erwerbs-Obstbau 2019, 61, 553–559. [Google Scholar] [CrossRef]
  58. Choi, S.-Y.; Lee, Y.-M.; Lee, P.-J.; Kim, K.-T. Comparison of the antioxidative effects and content of anthocyanin and phenolic compounds in different varieties of Vitis vinifera ethanol extract. Prev. Nutr. Food Sci. 2011, 16, 24–28. [Google Scholar] [CrossRef] [Green Version]
  59. Fahmi, A.I.; Nagaty, M.A.; El-Shehawi, A.M. Fruit quality of Taif grape (Vitis vinifera L.) cultivars. Am. J. Sci. 2012, 8, 590–599. [Google Scholar]
  60. Farhadi, K.; Esmaeilzadeh, F.; Hatami, M.; Forough, M.; Molaie, R. Determination of phenolic compounds content and antioxidant activity in skin, pulp, seed, cane and leaf of five native grape cultivars in West Azerbaijan province, Iran. Food Chem. 2016, 199, 847–855. [Google Scholar] [CrossRef] [PubMed]
  61. Mandić, A.I.; Đilas, S.M.; Čanadanović-Brunet, J.M.; Ćetković, G.S.; Vulić, J.J. Antioxidant activity of white grape seed extracts on DPPH radicals. Acta Period. Technol. 2009, 40, 53–61. [Google Scholar] [CrossRef]
  62. Anastasiadi, M.; Pratsinis, H.; Kletsas, D.; Skaltsounis, A.; Haroutounian, S.A. Bioactive non-coloured polyphenols content of grapes, wines and vinification by-products: Evaluation of the antioxidant activities of their extracts. Food Res. Int. 2010, 43, 805–813. [Google Scholar] [CrossRef]
  63. Fu, L.; Xu, B.T.; Xu, X.R.; Gan, R.Y.; Zhang, Y.; Xia, E.Q.; Li, H.B. Antioxidant capacities and total phenolic contents of 62 fruits. Food Chem. 2011, 129, 345–350. [Google Scholar] [CrossRef]
  64. Sochorova, L.; Prusova, B.; Jurikova, T.; Mlcek, J.; Adamkova, A.; Baron, M.; Sochor, J. The Study of Antioxidant Components in Grape Seeds. Molecules 2020, 25, 3736. [Google Scholar] [CrossRef] [PubMed]
  65. Yegin, A.B.; Uzun, H.I. Some chemical phenolic content and antioxidant activity variations in different parts of grape berry. Derim 2018, 35, 1–10. [Google Scholar]
  66. Gokturk Baydar, N.; Ozkan, G.; Yasar, S. Evaluation of the antiradical and antioxidant potential of grape extracts. Food Control 2007, 18, 1131–1136. [Google Scholar] [CrossRef]
  67. Weidner, S.; Rybarczyk, A.; Karamac, M.; Krol, A.; Mostek, A.; Grebosz, J.; Amarowicz, E. Differences in the phenolic composition and antioxidant properties between Vitis coignetiae and Vitis vinifera seeds extracts. Molecules 2013, 18, 3410–3426. [Google Scholar] [CrossRef]
  68. Petrisor, C.; Chirecanu, C. Organic acids and sugars profile of some grape cultivars affected by grapevine yellows symptoms. Rom. Biotechnol. Lett. 2019, 24, 1027–1033. [Google Scholar] [CrossRef]
  69. Zhang, D.; Zhang, Y.; Lin, K.; Wang, B.; Shi, X.; Cheng, W. Comparison of sugars, organic acids and aroma components of five table grapes in Xinjiang. IOP Conf. Series: Earth Environ. Sci. 2021, 792, 012029. [Google Scholar] [CrossRef]
  70. Meng, J.-F.; Xu, T.-F.; Song, C.-Z.; Yu, Y.; Hu, F.; Zhang, L.; Zhang, Z.-W.; Xi, Z.-M. Melatonin treatment of pre-veraison grape berries to increase size and synchronicity of berries and modify wine aroma components. Food Chem. 2015, 185, 127–134. [Google Scholar] [CrossRef] [PubMed]
  71. Davies, C. Sugar accumulation in grape berries. Cloning of two putative vacuolar invertase cDNAs and their expression in grapevine tissues. Plant. Physiol. 1996, 111, 275–283. [Google Scholar] [CrossRef] [Green Version]
  72. Xie, Z.; Li, B.; Forney, C.F.; Xu, W.; Wang, S. Changes in sugar content and relative enzyme activity in grape berry in response to root restriction. Sci. Hortic. 2009, 123, 39–45. [Google Scholar] [CrossRef]
  73. Zheng, L.; Nie, J.; Yan, Z. Advances in research on sugars, organic acids and their effects on taste of fruits. J. Fruit Sci. 2015, 32, 304–312. [Google Scholar]
  74. Coelho, E.M.; Padilha, C.V.S.; Miskinis, G.A.; de Sa, A.G.B.; Pereira, G.E.; Azavedo, L.C.; Lima, M.S. Simultaneous analysis of sugars and organic acids in wine and grape juices by HPLC: Method validation and characterization of products from northeast Brazil. J. Food Comp. Anal. 2018, 66, 160–167. [Google Scholar] [CrossRef] [Green Version]
  75. Jediyi, H.; Naamani, K.; Elkoch, A.A.; Dihazi, A.; El Fels, E.A.; Arkize, W. First study on technological maturity and phenols composition during the ripeness of five Vitis vinifera L grape varieties in Morocco. Sci. Hortic. 2019, 246, 390–397. [Google Scholar] [CrossRef]
  76. Gokturk-Baydar, N. Organic acid, tocopherol and phenolic compositions of some Turkish grape cultivars. Chem. Nat. Compd. 2006, 42, 56–59. [Google Scholar] [CrossRef]
  77. Farzaneh, V.; Carvalho, I.S. Modelling of microwave assisted extraction (MAE) of anthocyanins (TMA). J. Appl. Res. Med. Aromat. Plants 2017, 6, 92–100. [Google Scholar] [CrossRef]
  78. Ozkan, G. Phenolic compounds, organic acids, vitamin C and antioxidant capacity in Prunus spinose L. Comptes Rendus de l'Academie Bulgare des Sciences 2019, 72, 267–273. [Google Scholar]
  79. Bozhuyuk, M.R.; Ercisli, S.; Orhan, E.; Koc, A. Determination of the genetic diversity of walnut (Juglans regia L.) cultivar candidates from Northeastern Turkey using SSR markers. Mitt. Klost. 2020, 70, 269–277. [Google Scholar]
  80. Gecer, M.K.; Kan, T.; Gundogdu, M.; Ercisli, S.; Ilhan, G.; Sagbas, H.I. Physicochemical characteristics of wild and cultivated apricots (Prunus armeniaca L.) from Aras valley in Turkey. Genet. Resour. Crop. Evol. 2020, 67, 935–945. [Google Scholar] [CrossRef]
  81. Ozkan, G.; Ercisli, S.; Sagbas, H.I.; Ilhan, G. Diversity on fruits of wild grown European cranberrybush from Coruh valley in Turkey. Erwerbs-Obstbau 2020, 62, 275–279. [Google Scholar] [CrossRef]
  82. Bujdosó, G.; Cseke, K. The Persian (English) walnut (Juglans regia L.) assortment of Hungary: Nut characteristics and origin. Sci. Hortic. 2021, 283, 110035. [Google Scholar] [CrossRef]
  83. Bozhuyuk, M.R.; Ercisli, S.; Fidan, H.; Ersoy, N.; Ilhan, G.; Sagbas, H.I. Morphological and biochemical characteristics of selected local chestnut genotypes. Erwerbs-Obstbau 2021, 63, 313–318. [Google Scholar] [CrossRef]
Figure 1. Different cluster forms (conical, irregular winged conical and winged conical) in ‘Köhnü’ grape clones.
Horticulturae 07 00346 g001
Figure 2. ‘Köhnü’ grapevines in the trellis wire system in Hoşköy, Elazığ.
Horticulturae 07 00346 g002
Table 1. Some morphological traits of the six ‘Köhnü’ clones.
LocationsClonesCluster FormCluster Weight (g)Berry Weight (g)Berry Skin ColorUsage
HoşköyClone 1Winged conical388 ± 14 ab4.33 ± 0.5 bBlack-BlueTable, Juice, Wine
HoşköyClone 2Conical341 ± 12 cd3.92 ± 0.3 eBlack-BlueTable, Juice, Wine
HoşköyClone 3Irregular winged conical394 ± 16 a4.45 ± 0.3 aBlack-BlueTable, Juice, Wine
HoşköyClone 4Conical334 ± 11 d4.04 ± 0.4 deBlack-BlueTable, Juice, Wine
HoşköyClone 5Conical357 ± 14 c4.12 ± 0.3 dBlack-BlueTable, Juice, Wine
HoşköyClone 6Irregular winged conical378 ± 13 b4.26 ± 0.4 cBlack-BlueTable, Juice, Wine
Different letters in the same column indicate significant differences (p < 0.05).
Table 2. Total phenolic content of six ‘Köhnü’ grape clones.
ClonesTotal Phenolic Content (mg GAE/100 g FW)
PeelPulpSeed
Clone 1118 ± 6 c30.15 ± 0.6 c224 ± 11 d
Clone 2128 ± 8 b33.67 ± 0.6 b254 ± 14 a
Clone 3139 ± 7 a35.11 ± 0.7 a242 ± 10 b
Clone 4110 ± 5 cd29.38 ± 0.4 cd212 ± 9 e
Clone 596 ± 4 d27.73 ± 0.3 d193 ± 8 f
Clone 6133 ± 7 ab32.06 ± 0.5 bc233 ± 10 c
Different letters in the same column indicate significant differences (p < 0.05).
Table 3. DPPH assay results of six ‘Köhnü’ grape clones.
ClonesDPPH (μmol Trolox/100 g FW)
PeelPulpSeed
Clone 1939 ± 14 b229 ± 7 bc1432 ± 10 c
Clone 2958 ± 16 ab244 ± 8 b1478 ± 11 bc
Clone 3987 ± 21 a269 ± 9 a1511 ± 16 b
Clone 4911 ± 9 c221 ± 5 c1378 ± 10 bcd
Clone 5873 ± 8 d210 ± 6 c1290 ± 11 d
Clone 6970 ± 10 ab255 ± 8 ab1622 ± 15 a
Different letters in the same column indicate significant differences (p < 0.05).
Table 4. FRAP assay results of ‘Köhnü’ grape clones.
ClonesFRAP (μmol Trolox/100 g FW)
PeelPulpSeed
Clone 13620 ± 37 c76 ± 2.3 bc40,200 ± 450 b
Clone 23805 ± 41 b90 ± 3.1 ab44,310 ± 386 ab
Clone 33911 ± 51 ab84 ± 3.3 b42,365 ± 515 ab
Clone 43470 ± 48 d70 ± 1.3 bc38,600 ± 313 bc
Clone 53389 ± 69 de65 ± 2.0 c36,548 ± 430 c
Clone 64018 ± 60 a98 ± 4.3 a45,200 ± 538 a
Different letters in the same column indicate significant differences (p < 0.05).
Table 5. TEAC assay results of ‘Köhnü’ grape clones.
ClonesTEAC (μmol Trolox/100 g FW)
SkinPulpSeed
Clone 1330 ± 11 bc51 ± 1.4 bc1284 ± 21 bc
Clone 2348 ± 13 b69 ± 1.3 a1468 ± 19 a
Clone 3365 ± 16 a63 ± 1.6 ab1340 ± 16 b
Clone 4302 ± 9 d47 ± 1.1 bc1210 ± 18 bc
Clone 5286 ± 10 e42 ± 1.2 c1195 ± 13 c
Clone 6315 ± 12 c55 ± 1.3 b1260 ± 14 bc
Different letters in the same column indicate significant differences (p < 0.05).
Table 6. Sugar content (g/100 g FW) in juices of six ‘Köhnü’ clones.
ClonesGlucoseFructoseSucrose
Clone 113.3 ± 0.5 b12.8 ± 0.4 ab0.07 ± 0.0 NS
Clone 213.9 ± 0.4 ab13.4 ± 0.4 ab0.08 ± 0.0
Clone 314.1 ± 0.5 a13.6 ± 0.3 a0.05 ± 0.0
Clone 412.8 ± 0.3 b12.7 ± 0.4 b0.06 ± 0.0
Clone 513.7 ± 0.2 ab13.5 ± 0.5 ab0.05 ± 0.0
Clone 613.0 ± 0.2 bc12.8 ± 0.2 b0.07 ± 0.0
The ‘Köhnü’ samples from six clones compared in same columns and different letters shows statistically significant differences (p < 0.05) NS: Non-Significant.
Table 7. Organic acid content (g/100 g FW) in juices of six ‘Köhnü’ clones.
ClonesTartaricMalicOxalic
Clone 110.67 ± 0.3 ab5.34 ± 0.2 bc0.24 ± 0.04 NS
Clone 211.06 ± 0.4 ab5.96 ± 0.3 b0.18 ± 0.07
Clone 311.25 ± 0.5 a6.44 ± 0.2 a0.20 ± 0.05
Clone 410.04 ± 0.3 ab5.24 ± 0.3 bc0.16 ± 0.03
Clone 510.86 ± 0.2 ab6.23 ± 0.2 ab0.27 ± 0.08
Clone 610.46 ± 0.2 b5.10 ± 0.2 c0.15 ± 0.04
The ‘Köhnü’ samples from six clones compared in same columns and different letters shows statistically significant differences (p < 0.05) NS: Non-Significant.
Publisher’s Note: MDPI stays neutral with regard to jurisdictional claims in published maps and institutional affiliations.

