Article

Evaluation of Seaport Service Quality in Tanzania: From the Dar es Salaam Seaport Perspective

by
Msabaha Juma Mwendapole
* and
Zhihong Jin
Management Building, Transportation Engineering College, Dalian Maritime University, Ganjingzi District, Dalian 116026, China
*
Author to whom correspondence should be addressed.
Sustainability 2021, 13(18), 10076; https://doi.org/10.3390/su131810076
Submission received: 10 August 2021 / Revised: 2 September 2021 / Accepted: 6 September 2021 / Published: 8 September 2021

Abstract

:
Many countries rely heavily on seaports to promote their well-being and economy. Unreliability of seaport services can considerably impact cargo owners, seaport customers and shipping lines resulting to their dissatisfaction. This study aimed to evaluate service quality of Tanzanian seaports considering Dar es Salaam seaport as a study area. The study discovered the negative gap on the service quality after evaluating seaport user’s perceptions and expectations of delivered seaport services, meanwhile the service quality of Dar es Salaam seaport is poor. Opinions of seaport user’s concerning seaport service quality were computed based on the SERVQUAL model which developed by Parasuraman by considering the essential measurements of Tangibility, Empathy, Reliability, Assurance and Responsiveness. Senior administrators and managers employed in numerous shipping lines in Tanzania were interviewed to check the model validity, then 314 members of Tanzania shipping and logistics associations were engaged in a study survey. Partial Least Squares Structural Equation Modelling (PLS-SEM) was applied to validate the seaport service quality measurements and to observe their association with satisfaction of seaport customers using Amos Graphics software version 26. It found that seaport service quality is a five-measure construct; responsiveness was significantly influence customer satisfaction while empathy and assurance could insignificantly influence customer satisfaction. Reliability was found significantly to cause customer dissatisfaction and tangibility was insignificantly to cause customer dissatisfaction. Academically, this research donates to management practice as seaport administrators, managers and executives can utilize the seaport service quality measurements to evaluate their customer’s satisfaction and defending for seaport service quality investments as a relational marketing strategy.

1. Introduction

Service quality has been a primary criterion for acquiring customers’ satisfaction in a wide range of industries including seaport. Others are supply chains, logistics structures, seaport charges and associated government taxes [1]. According to Onyemechi, et al., 2017, service quality variables are the important seaport performance factors in the maritime transport. As seaborne trade grows it is compounded by terminal rivalry; seaport operators are facing the increasing challenge of retaining and improving market share and delivering effective seaport services to vessels (cargo loading/discharging), freight owners, shipping agents, sea freight agents, ship cleaners and other users of the seaport [2]. In order to gain large share of the seaborne trade, seaports have to address service performance through better quality management so as to meet customers’ expectation [3].
Seaport services include any service offered by a seaport. Seaport services are associated with exploiting and serving which including pilotage services, repairing services, towage services, stevedoring services, counting services, ship chandler services, ship sanitary services, marine brokerage services etc. [3]. Unreliability of the seaport services results in the dissatisfaction of the customers; this is because any failure in the seaport operation results to the interruption in the orderly passage of the cargo in the next step of the logistics and supply chain [4]. Therefore, proper management of seaport service quality adds more value in supply chain processes.
Assessment of the factors that affect level of users’ satisfaction in the seaport is recently increasing and being viewed in both management practices and academic literature in the field of logistics and supply chain [2]. Service quality dimensions forms a major influence on customers’ satisfaction evaluation; hence, playing an important role in business growth and development [4,5]. Therefore, studying about service quality measures and their influence on customer satisfaction in different seaports across the world is important for the success and competitive advantage of each seaport. According to Bae and Park (2018) practice and applicability of service quality dimensions differs from industry to industry, from market to market and even from country to country depending on socio-economic and political values. In the same vein, the effects of service quality dimensions to the seaport users depend much to the seaport administration and governance [6].
Increased global economic growth and international shipping have brought competition in the seaport industry. Seaports are competing to gain superior market share in maritime business operations [7]. African seaports have increased integration into land supply chain than what they used to be as part of the maritime transport chain. This is the reason for the escalated efforts to invest in improving the service quality of African seaports with the aim of enhancing their competitiveness through customer’s satisfaction [8].
Seaport industry in East Africa has been growing at a remarkable speed, especially since privatization of seaports and terminals which started in the early 2000. As a result of this expansion, there is more competition for consumers who had previously experienced decreased customer loyalty [9]. Expansion of seaport industry in this region suggested the seaport authority to shift the focus from ordinary service delivery to the quality of service offered to their customers. Nowadays, they are many maritime seaports along the coast of East Africa; but the four that are highly competitive are Mombasa seaport in Kenya, Djibouti seaport in Djibouti, Dar es Salaam seaports in Tanzania and Maputo seaport in Mozambique [10].
For many years Mombasa seaport had been ahead of all major seaports along the coast of East Africa. There was a huge gap between Mombasa seaport and Dar es Salaam seaport in terms of Container Throughput (TEU) and tons of cargoes imported and exported. However, currently, that gap has been narrowed and Dar es Salaam seaport has been ranked as the fastest growing seaport with moderate efficiency in the region [8,11]. The import capacity in Dar es Salaam seaport has increased from 13.8 million metric tons in 2015 to 22.7 million metric tons of dry cargo in 2019 excluding bulk liquid cargo [12]. This increase has been accelerated by the on-going construction of new docks, the increased length and depth of berths, the increased number of handling facilities, the reduction of handling time and availability of all seaport and shipping services (i.e., seaport charges, tax clearance, goods inspections) at one place. Kahyarara and Simon (2020) reported that the recent expansion of Dar es Salaam seaport has provided more holding cargoes spaces and the seaport has attracted large-scale corporate customers from neighboring countries [12].
More notably, seaport authority is faced with the responsibility of retaining its customers and t the same time to attracts more customers through improvement of service quality measures. There are also contemporary seaport operational challenges which do not provide essential assurance to customers such as high tariffs, increased bribery level within the seaport, poor seaport-hinterland connectivity, draft capacity limit of Dar es Salaam seaport, seaport congestion, poor skills of maritime field by some employees at Dar es Salaam seaport [13]. Identified contemporary seaport operational challenges need to be mitigated by the management of this seaport in order for it to remain competitive in the region. On-going efficiency improvement of this seaport brings significant income to Tanzania. However, there is a need to keep evaluating what factors constitutes seaport service quality and its effects to the customer satisfaction in Dar es Salaam seaport. Considering customer’s expectations and perceptions on service quality at this seaport is the critical factor in designing strategies for bringing more wealth to Tanzania through the seaport industry. It is demonstrated in the exiting literature that, apart from substantial investment in advancing seaport facilities and infrastructure, scientific studies on how service quality dimensions have been improved in developing countries such as Tanzania is relatively scant.
The remaining segments of this article were structured as follows. Section two provides a previous work survey of the service quality, the customer satisfaction and application of service quality in the seaport. Section three focuses on the methodology used in the development of this paper including the conceptual framework and hypotheses, data collection and analysis methods. Section four presents analysis and findings of the paper. Section five includes conclusions, implications, limitations and recommendations based on the findings of the paper.

2. Previous Work Survey

2.1. Quality and Service Quality Model

Globally there is no recognized definition for the concept “quality” [14,15]. Therefore, various meanings have been brought to the concept of quality by different scholars. Duc et al. (2020) viewed quality as the products features that bring pleasure to the customers [1]. Bae and Park (2018) asserted that quality in Japanese production philosophy implies zero imperfection and making things in the correct way the first time [6]. Dale (2003) pointed out that quality is the general term which used to distinguish one process, service, goods, event, result, person or organization from another [16].
In the service business, providing high service quality is critical and has a significant effect on the success of the company. Scholars have argued that high service quality is positively correlated with high marginal income in the business company [5,17,18]. Hence, the business ability to maintain high service quality in order to satisfy the demands of its customers becomes critical to its survival.
The SERVQUAL model which was used in this paper is one of the first and most widely used methods for evaluating quality of service in the business. Theoretically according to Parasuraman et al. (1988) as cited by Duc Nha le and Thi Nguyen (2020) they defined SERVQUAL model in five dimensions namely assurance, empathy, tangibility, reliability and responsiveness [1,18]. The SERVQUAL model uses the mentioned five variables to calculate the difference between the actual service quality rendered (perception) and customers’ expectations of service quality (expectation). Parasuraman et al. (1988, p. 23) defined variables of service quality as follows:
i.
Tangibility means the physical facilities, equipment and staff appearance. Good appearance of seaport facilities is an indication of the best service quality of a seaport;
ii.
Responsiveness is referred to as employees’ willingness to assist consumers and offering timely services;
iii.
Assurance pertains employees’ understanding and courtesy, as well as their ability to express faith and confidence in performing work;
iv.
Reliability means the ability of the company to provide the promised service consistently without fail in the proper ways;
v.
Empathy refers to providing consumers with compassionate and personalized service.
Parasuraman et al. (1985) validated instruments of SERVQUAL model in four different service industries which are credit cards, securities brokerage, retail banking as well as product repair and maintenance. However, it was mentioned that the model could be used in many other industries with or without minor modification [17]. Several researchers have applied dimensions of SERVQUAL model in different service settings and acknowledged their confidence and importance in assessing customer satisfaction. However, the five dimensions of SERVQUAL can be interpreted differently when applied in different industries [4,8,15]. Several researchers also indicated that the importance and trustworthiness of SERVQUAL instruments may be appreciated by their widespread use in a variety of service settings (i.e., hotel, health, air transport, marine transport, tourism and so on) [19,20,21,22].
On the other hand, there are researchers who argue that the SERVQUAL model was not appropriate for some fields, for instance, supply chain [23,24,25]. They suggested the use of industrial-specific factors rather than applying dimensions of this model because they cannot precisely reflect the level of service quality in all industries at once. Lee et al. (2013) claimed the SERVQUAL model can be applied in evaluating seaport service quality without including seaport management and operational specifications [26]. Additionally, Cronin and Taylor (1992) criticized the use of SERVQUAL framework in supply chain. They suggested the SERVPERF model which takes into account only actual performance and thus excludes the SERVQUAL model’s anticipation component [27].

2.2. Customer Satisfaction and Service Quality

Customers’ satisfaction is first thought of as customer’s assessment on a considered purchase. It is known as the condition of positive fulfilment when evaluating a purchased service or product [11,28]. Specifically, customer satisfaction is thought to be an inherent variable that describes repeat consumers and their subsequent shopping habits. In the maritime industry, customer satisfaction may explain customers’ choice of the seaport after comparing its standard with near possible seaports [7].
Generally, the concept of customer’s satisfaction has two components, which are pre-event expectations and post-event evaluations [29]. Customer’s satisfaction with the service or goods they bought is determined by the difference between these two components. Customers’ satisfaction arises when the value of post event evaluations outweighs pre-event expectations and the service has been given to the customer in a beneficial way [1]. A study conducted by Yeo et al. (2015) in logistic sector using SERVQUAL model noted that customers were satisfied when their expectations were met. Therefore, meeting customers’ expectation was mentioned to be primary requirement for judging quality of the service and all influences of customer’s satisfaction [5].
For long time service quality variables have been considered as the driver for company’s performance since they positively influence customer’s satisfaction which in turn brings financial and non-financial rewards to the company [11,30]. Meeting or surpasses customers’ expectation is critical because consumers who are pleased with the quality of the services/goods offered are more likely to not only to return, but also to inspire others to do so [8]. Onyemechi, et al. (2017) confirmed that customers are more likely to be happy if the service quality of the products supplied is high [2]. Anderson et al. (2009) in their scholarly works argued that there was a positive correlation between service quality and customer’s satisfaction in high-speed railway, aviation and maritime transports, particularly in the context of seaports [31].

2.3. Applications of Service Quality Model in the Seaport

In the competitive environment of the seaports, quality is critical. Several scholars have noted its significance in their studies. Among of them, Kalgora (2019) stated that seaport has to pursue service quality in order to remain at the top of the sector within its region, which later affects the improvement of a nation’s economy [10]. A similar view was also reported by Bae and Park, 2018; Pham and Yeo, 2019 who argued that advancement of service quality is one way to gain a competitive edge in maritime transportation for the seaports [6,7]. Among scarce studies which have been conducted to assess service quality in African seaport; Ugboma et al. (2009) noted that all five dimensions of the SERVQUAL model were valid [21].
Other variables are reported to contribute to the seaport quality were security and timeliness [20]. Additionally, Nguyen and Tran (2018) contended that aspects of service quality in the seaport involve physical environmental quality (seaport location and facilities available), result quality (includes the size of free trade zones, seaport turnaround time and the volume of cargo flows) and rational quality (distribution network, seaport management, customer relations, customer convenience and seaport sales/costs) [3].
Aside from theoretical considerations, it is worth noting that some observational researches have been conducted to assess service quality of seaports in both developing and developed nations. These include a comparative study conducted by Ha (2003) in the 15 major seaports in the Asian region (Busan, Kwangyang, Shanghai, Osaka, Hong Kong, Kaohsiung, Singapore and Kobe), Europe (Valencia, Hamburg, Felixstowe, and Rotterdam) and in America (New York, Long Beach and Seattle). The study selected 157 shipping operators and logistic managers from these seaports. Questionnaires and interviews were used to obtain data from these individuals. Duncan and variance test techniques were applied and the results indicated that, service quality in Korean seaport was better related to Singapore and Shanghai. It was also noted that seaports on the Asia continent were lagging behind the seaports in America and Europe in terms of service quality [32].
Ugboma et al. (2009) examined service quality in the Lagos and Port Harcourt seaports in Nigeria. The study selected 40 customers from these seaports and they applied SERVQUAL dimensions. Compared to the Lagos seaport, Harcourt seaport was found to have a favorable influence on the perception of service quality. Further, all two seaports were rated to have high level of tangibility among the five dimensions of the SERVQUAL model. The least rated dimension was empathy in both seaports. It was concluded that Port Harcourt seaport was better than Lagos seaport in terms of overall service quality [21].
In a related study, Lee and Hu (2012) evaluated service quality in five major seaports namely Kaohsiung, Hong Kong, Shanghai, Singapore and Busan. The study selected 25 major seaport users in Asia. The five dimensions of the SERVQUAL model, namely tangibility, responsiveness, empathy, assurance and reliability were employed and Importance Performance Analysis (IPA) was adopted. The overall results revealed that Singapore seaport was providing the best service quality relative to the other seaports in the study. Meanwhile, Kaohsiung was graded the worst seaport in terms of service quality rendered. It was added that Shanghai seaport had low level of customers’ satisfactions in terms of assurance and responsiveness relatively to other seaports but it was rated to have the best tangibility [26]. Humphreys et al. (2019) evaluated service quality in the container terminals of Durban seaport in South Africa. Their study used a sample of 120 seaport users. SERVQUAL model was employed and all five variables of this model were considered. The study revealed the existence of significant gap between customers’ expectations and perceptions in all container terminals. However, tangibility was the main factors that could highly affect customers’ satisfaction [8].
Regardless of several studies conducted in numerous sectors globally concerning service quality and its correlation with customer’s satisfaction, researches concerning the service quality of seaports is scant and justifies further investigation especially in developing countries such as Tanzania in East Africa.

3. Methodology

3.1. Research Design

The research design adopted was a descripto-explanatory design which enabled the evaluation of service quality of cargo terminal at Dar es Salaam seaport in terms of tangibility, responsiveness, empathy, assurance and reliability as well as relating these measures of service quality with level of customer’s satisfaction. Through this design the paper was able to explain the present condition of cargo services; that how the cargoes had been handled in this seaport. Additionally, the paper was able to distinctly explain how cargo services offered could affect customer’s satisfaction for the management to set accurate strategies for the improvement.

3.2. Participants and Data Collections

The study population was the deliberately picked 314 officers from local shipping agencies that normally used the mentioned seaport. Purposive sampling technique which is also known as a non-probability sampling technique was used to select them.
The data collection method used in this study was survey. Seaport’s customers like cargo owners, shipping lines and their agents such as logistics service companies and freight forwarders are well covered in the mailing list. Questionnaires were posted via email to all companies presented in the mailing list from January 2021 to February 2021. The questionnaire was attached with a covering letter explaining about the study aim and authors’ institutions. The questionnaire had two parts in which the first part tackled particulars of the respondents and profile of their companies; while the second part captured their opinions concerning quality of the service offered at the Dar es Salaam seaport and their level of satisfaction.
Respondent’s opinions were measured using the following five response points {Strongly Disagree (SD = 1), Disagree (D = 2), Satisfactory (S = 3), Agree (A = 4) and Strongly Agree (SA = 5)} in responding the given indicators. If respondent chose 5 it meant that he/she strongly agreed that the seaport has those features and if respondent chose 1 it meant he/she strongly disagreed. If respondents felt less strong, they were free to choose one of the numbers in the middle to show how strong their expectations and perceptions were. There were no right or wrong answers, all we were interested in were just numbers that truly reflected their opinions regarding the quality of the seaport services.
Senior administrators and managers employed in numerous shipping lines in Tanzania were interviewed and pre-tested the questionnaire to check the model validity and language clarity before being sent to the respondents. The questionnaire survey final was sent by email and follow-up reminders were sent just 14 days after being received. By the desired deadline, 347 respondents sent back their filled questionnaires. Among the 347 received responses, 314 (90.4%) were valid and applied for further analysis.

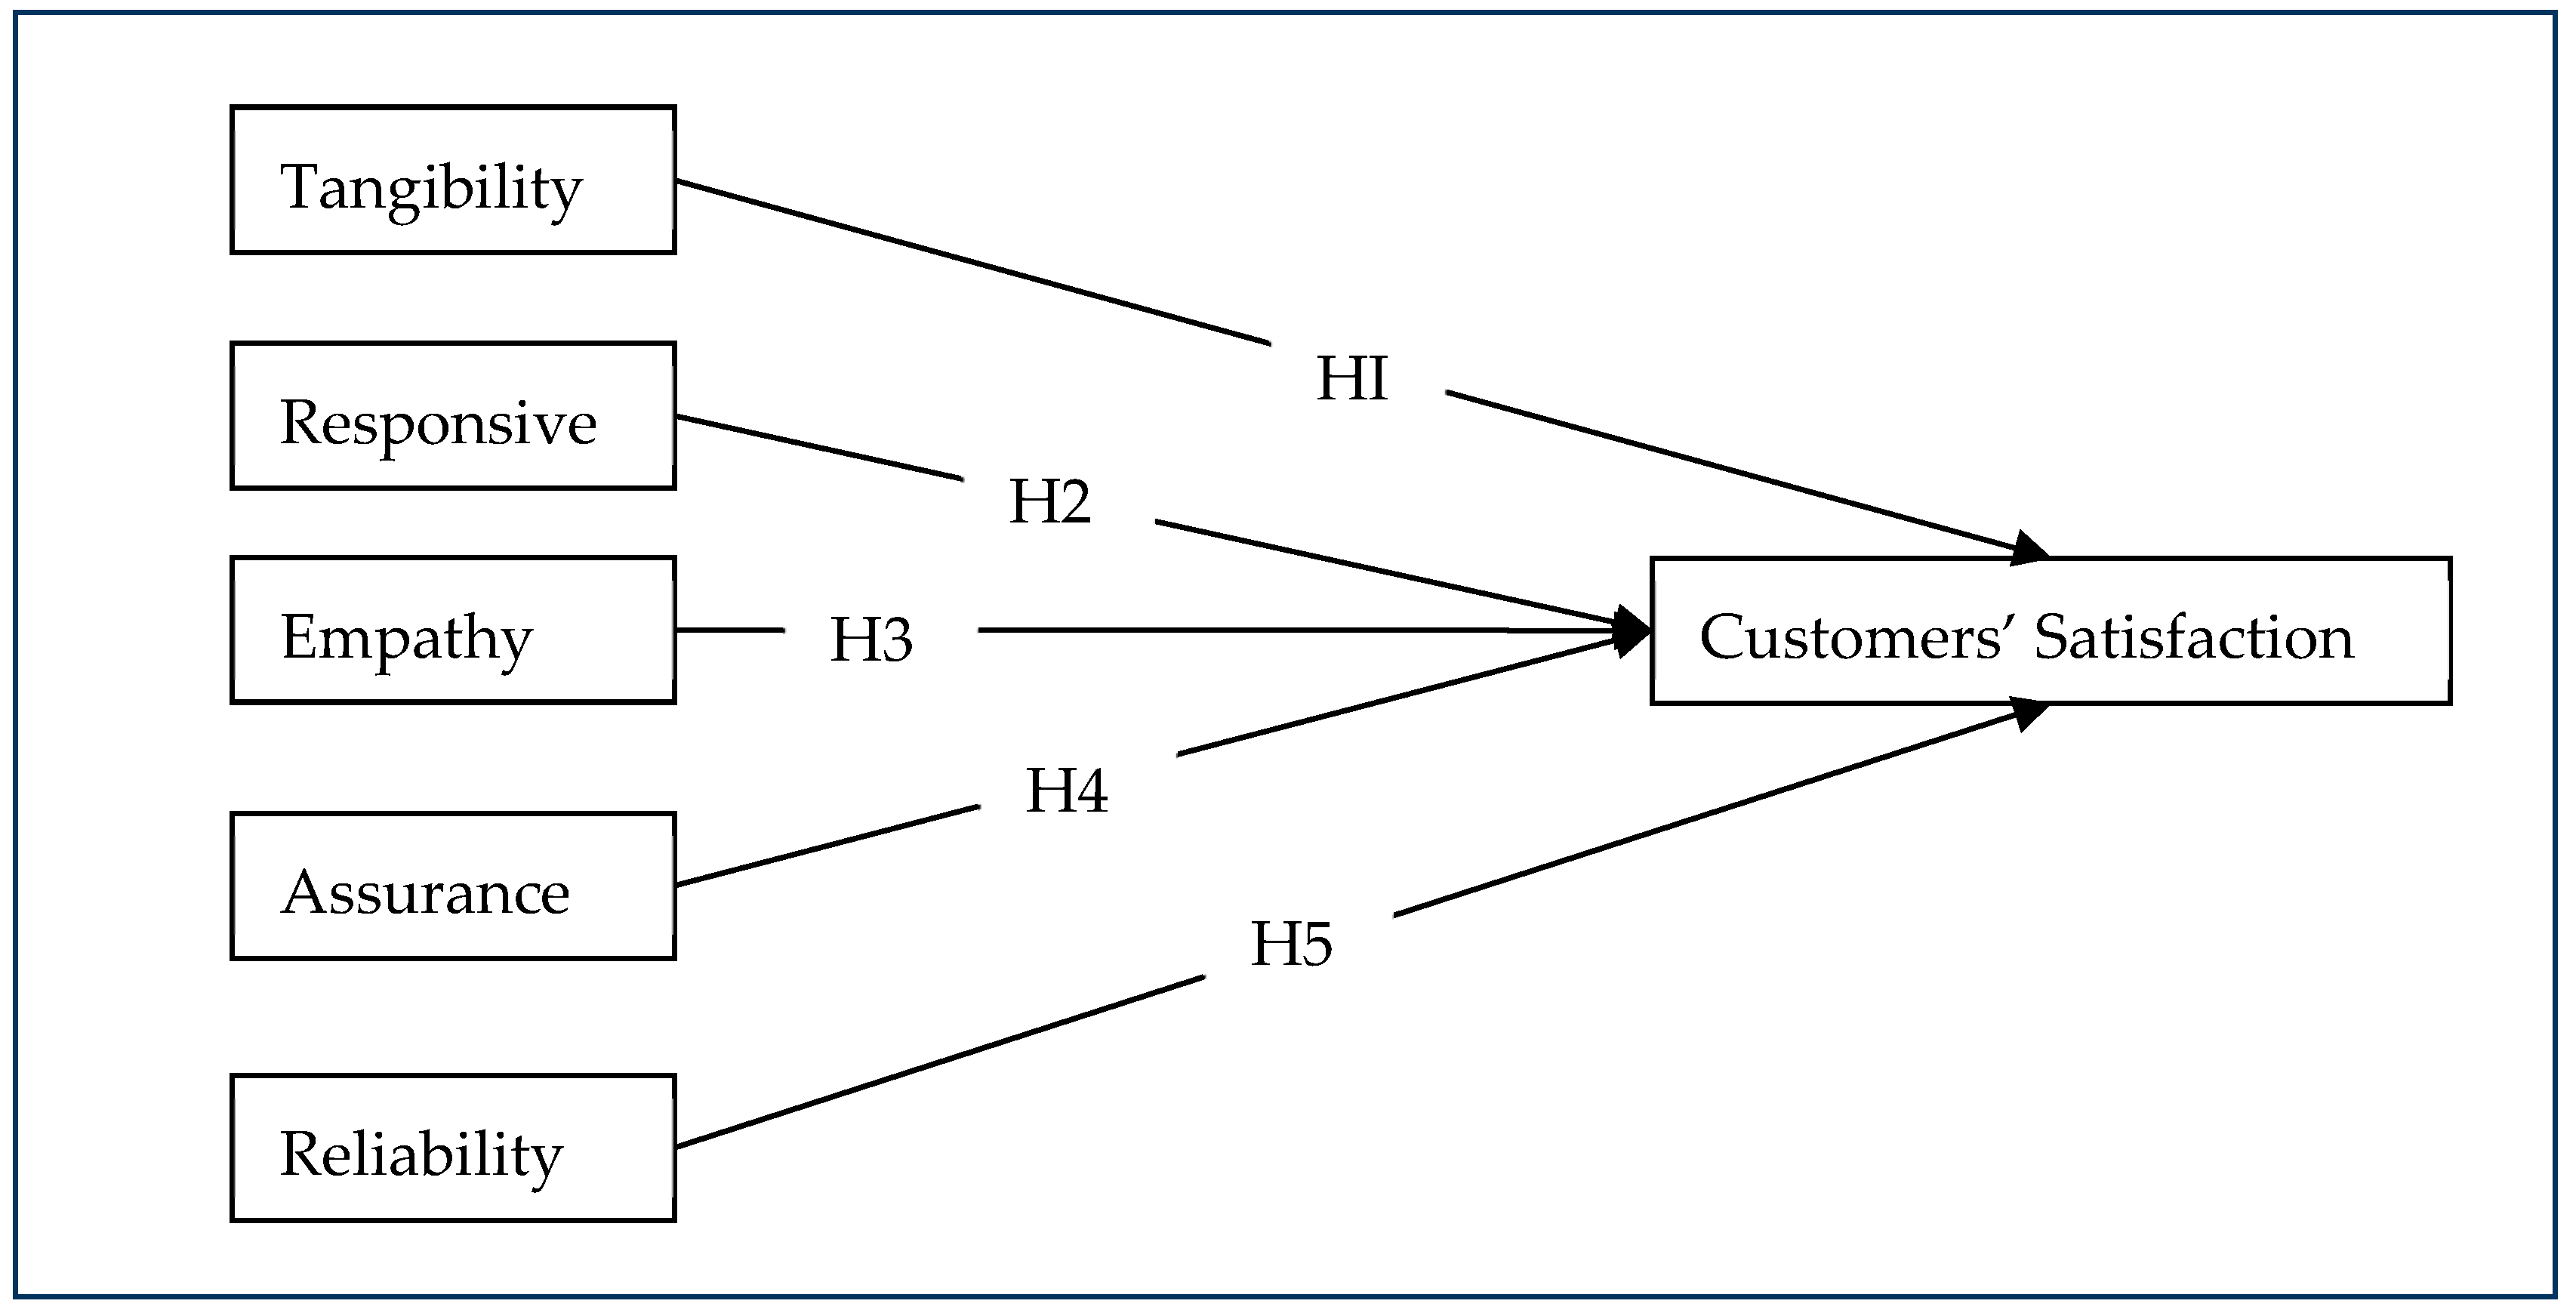
3.3. Conceptual Framework and Measures

The study aimed to measure how customer’s satisfaction at the seaport is influenced by the service quality. Therefore, the five primary variables of service quality proposed by Parasuraman et al. (1988, p.23) were used as the predictor variables to predict level of customers’ satisfaction in the seaport of Dar es Salaam. Therefore, researchers related the independent variables with a dependent variable. Independent variables were dimensions taken from the SERVIQUAL model which are reliability, assurance, responsiveness, empathy and tangibility, while the dependent variable was customer satisfaction. Conceptual framework to model the whole idea of this paper was given as shown in the Figure 1 below.

3.4. Research Hypotheses

The correlation between service quality and customer satisfaction in the seaport sector is still under research, this study attempted to examine how seaport service quality as a five-measure construct influence the satisfaction of seaport customers. Taking reviewed literatures and the conceptual model of the study into consideration; the following hypotheses were developed:
Hypothesis 1 (H1).
Tangibility-related seaport service quality positively influences customers’ satisfaction in the Dar es Salaam seaport.
Hypothesis 2 (H2).
Responsiveness-related seaport service quality positively influences customers’ satisfaction in the Dar es Salaam seaport.
Hypothesis 3 (H3).
Empathy-related seaport service quality positively influences customers’ satisfaction in the Dar es Salaam seaport.
Hypothesis 4 (H4).
Assurance-related seaport service quality positively influences customers’ satisfaction in the Dar es Salaam seaport.
Hypothesis 5 (H5).
Reliability-related seaport service quality positively influences customers’ satisfaction in the Dar es Salaam seaport.

3.5. Instrument and Research Variables

The standard method for collecting information for the descripto-explanatory paper is a questionnaire. SERVQUAL’s questions were adopted from the research works reviewed in the literature section. The questions had been validated by the previous researchers who conducted their studies within the seaport (Table 1).

3.6. Data Analysis

All collected data were coded, analyzed and interpreted. Profile information of respondents (age, gender, business experience and frequency use of Dar es Salaam seaport) were analyzed through a frequency distribution table. Service quality and customer’s satisfaction levels were determined by weighted mean. The scale which was used to interpret the results was given as 1.00–1.49 = very poor service quality and very low customer’s satisfaction; 1.50–2.49 = poor service quality and low customer satisfaction; 2.50–3.49 = good service quality and high customer’s satisfaction; 3.50–4.49= very good service quality and very high customer satisfaction. Furthermore, Partial Least Squares Structural Equation Modelling (PLS-SEM) was used to establish correlation between dimensions of service quality and customer’s satisfaction. The level of significant was determined by probability value; whereby, predictor factor (tangibility, responsiveness, empathy, assurance and reliability) with probability value of less than 0.05 was considered significant.

4. Findings and Discussion

Study findings followed by discussion are well presented in this section. Service quality gap was estimated by subtracting the Perceived Quality (P) from Expected Quality (E) and then determining the percentage gap. Perceived customer satisfaction was also established through a descriptive analysis of the mean scores. A structural model was developed using the Partial Least Squares Structural Equation Modelling (PLS-SEM) analysis, which significantly determined the impact of the service quality variables on the customer satisfaction at the Dar es Salaam seaport.

4.1. Respondents Profile

Profile data of respondents as disclosed in Table 2 below depict that the majority (69.4%) of respondents were male. This reflected that in Tanzania, males are more involved in the maritime and shipping business compared to females. According to the age distribution data, most of the respondents were in the young-elder age (30–49 years old constituting about 58.6% of the sample). These are the people who were economically oriented and have sufficient knowledge about Tanzanian society in terms of social, economic and political aspects of life. Most of respondents had university degrees (tertiary level of education); among them, 42.7% had bachelor degrees as a higher level of education and 25.5% had postgraduate degrees (masters’ degrees and PhD). On the other hand, respondents who had been in the shipping business for 1–5 years presented 9.8% of all respondents, 6-10 years presented 15.3%, 11–15 years presented 29.9%, 16–20 years presented 28.7% and for more than 20 years presented 16.2%. Therefore, the results were fetched from informed and educated respondents.

4.2. SERQUAL Analysis

Table 3 below highlights the expectation, perception and gap score for all service variables.
A closer look at Table 3 above shows that under the tangibility, all the variables (seven items) scored negative values in gap analysis and the average value of the service quality for tangibility was −0.34. This indicates that customers’ expectations of tangibility were higher than the actual services they received. Additionally, this negative value directly implies that the existing seaport facilities at Dar es Salaam seaport are not in good appearance. Hence, there is a greater need to invest in the newer and more efficient physical facilities and equipment. Similarly, other dimensions of service quality variables got negative values in the gap analysis. This included reliability (11 items) with an average value of −0.98, which means Dar es Salaam seaport is not consistently providing all the promised services to its customers. Responsiveness (eight items) scored the highest average value of −1.27; this means employees at Dar es Salaam seaport do not have full willingness in assisting customers and offering timely seaport services. Assurance (six items) scored the average value of −0.33, this implies the employees understanding, courtesy together with their ability to express faith and confidence in performing work at Dar es Salaam seaport is poor. Lastly empathy (seven items) scored the average value of −0.33; means there is poor provision of compassionate and personalized service to customers at Dar es Salaam seaport.
By looking further on the perception mean scores (without consider the gaps identified), it can be acknowledged that respondents perceived very good the level of tangibility (weighted mean 3.65) although it had not met their expectations. Additionally, level of empathy (weighted mean 3.68), and assurance (weighted mean 3.78) received very good perceptions. Level of responsiveness was perceived to be just good (weighted mean 2.76) and level of reliability (weighted mean 3.03) was also perceived to be good. This generally implies that the management of Dar es Salaam seaport should implement strategies so as to meet customers’ expectations towards receiving the best service quality from this seaport.
The study further analyzed the quality gap across all five service quality dimensions and developed a percentage gap as shown in the Table 4 below,
As shown in Table 4 above, all the service dimensions have negative gap values that indicated customers’ expectations were higher than the actual experiences. The gaps were expressed in terms of percentages so as to provide full meaning to the management about the gap compensation needed to meet customers’ expectations in percentage wise. In doing so, the dimensions were rated according to the order in which the management of the examined seaport had to pay immediate attention so as to advance the quality of the service provided. They were arranged as follows: assurance (−8.0%), empathy (−8.2%), tangibility (−8.5%), reliability (−24.5%) and responsiveness (−31.5%).
From the list above, responsiveness of the officials needs urgent reforms. After responsiveness, urgency reforms need to be given to the reliability dimension of service delivery. Dimensions which seemed to require least attention were assurance, followed by empathy. This means that, although the Dar es Salaam seaport needed to improve its service delivered to the customers, the customers did not consider too urgent improvements for assurance and empathy variables.

4.3. Perceived Customer Satisfaction

Perceived customer satisfaction with services delivering of Dar es Salaam seaport is well presented in Table 5 below:
Table 5 above shows that customers had very high perceived satisfaction with the procedures used in delivering the services (mean 3.96), management and officials (mean 4.14) as well as facilities, equipment and other infrastructures of the Dar es Salaam seaport (mean 4.11). In general, customers had very high satisfaction with the services delivering in this seaport (weighted mean 4.07). Regardless of the positive weighted mean of perceived customer satisfaction, the negative gap scores in service dimensions indicates that on average customer’s perception regarding service quality had not yet reached their expectation. That gap however was not very big and this impacted to their high perceived satisfaction. This result can be attributed to the removal of challenges previously informed by customers (according to existing literature) related to delayed cargo inspection and inadequate clearance equipment, and some other contemporary seaport operational challenges.

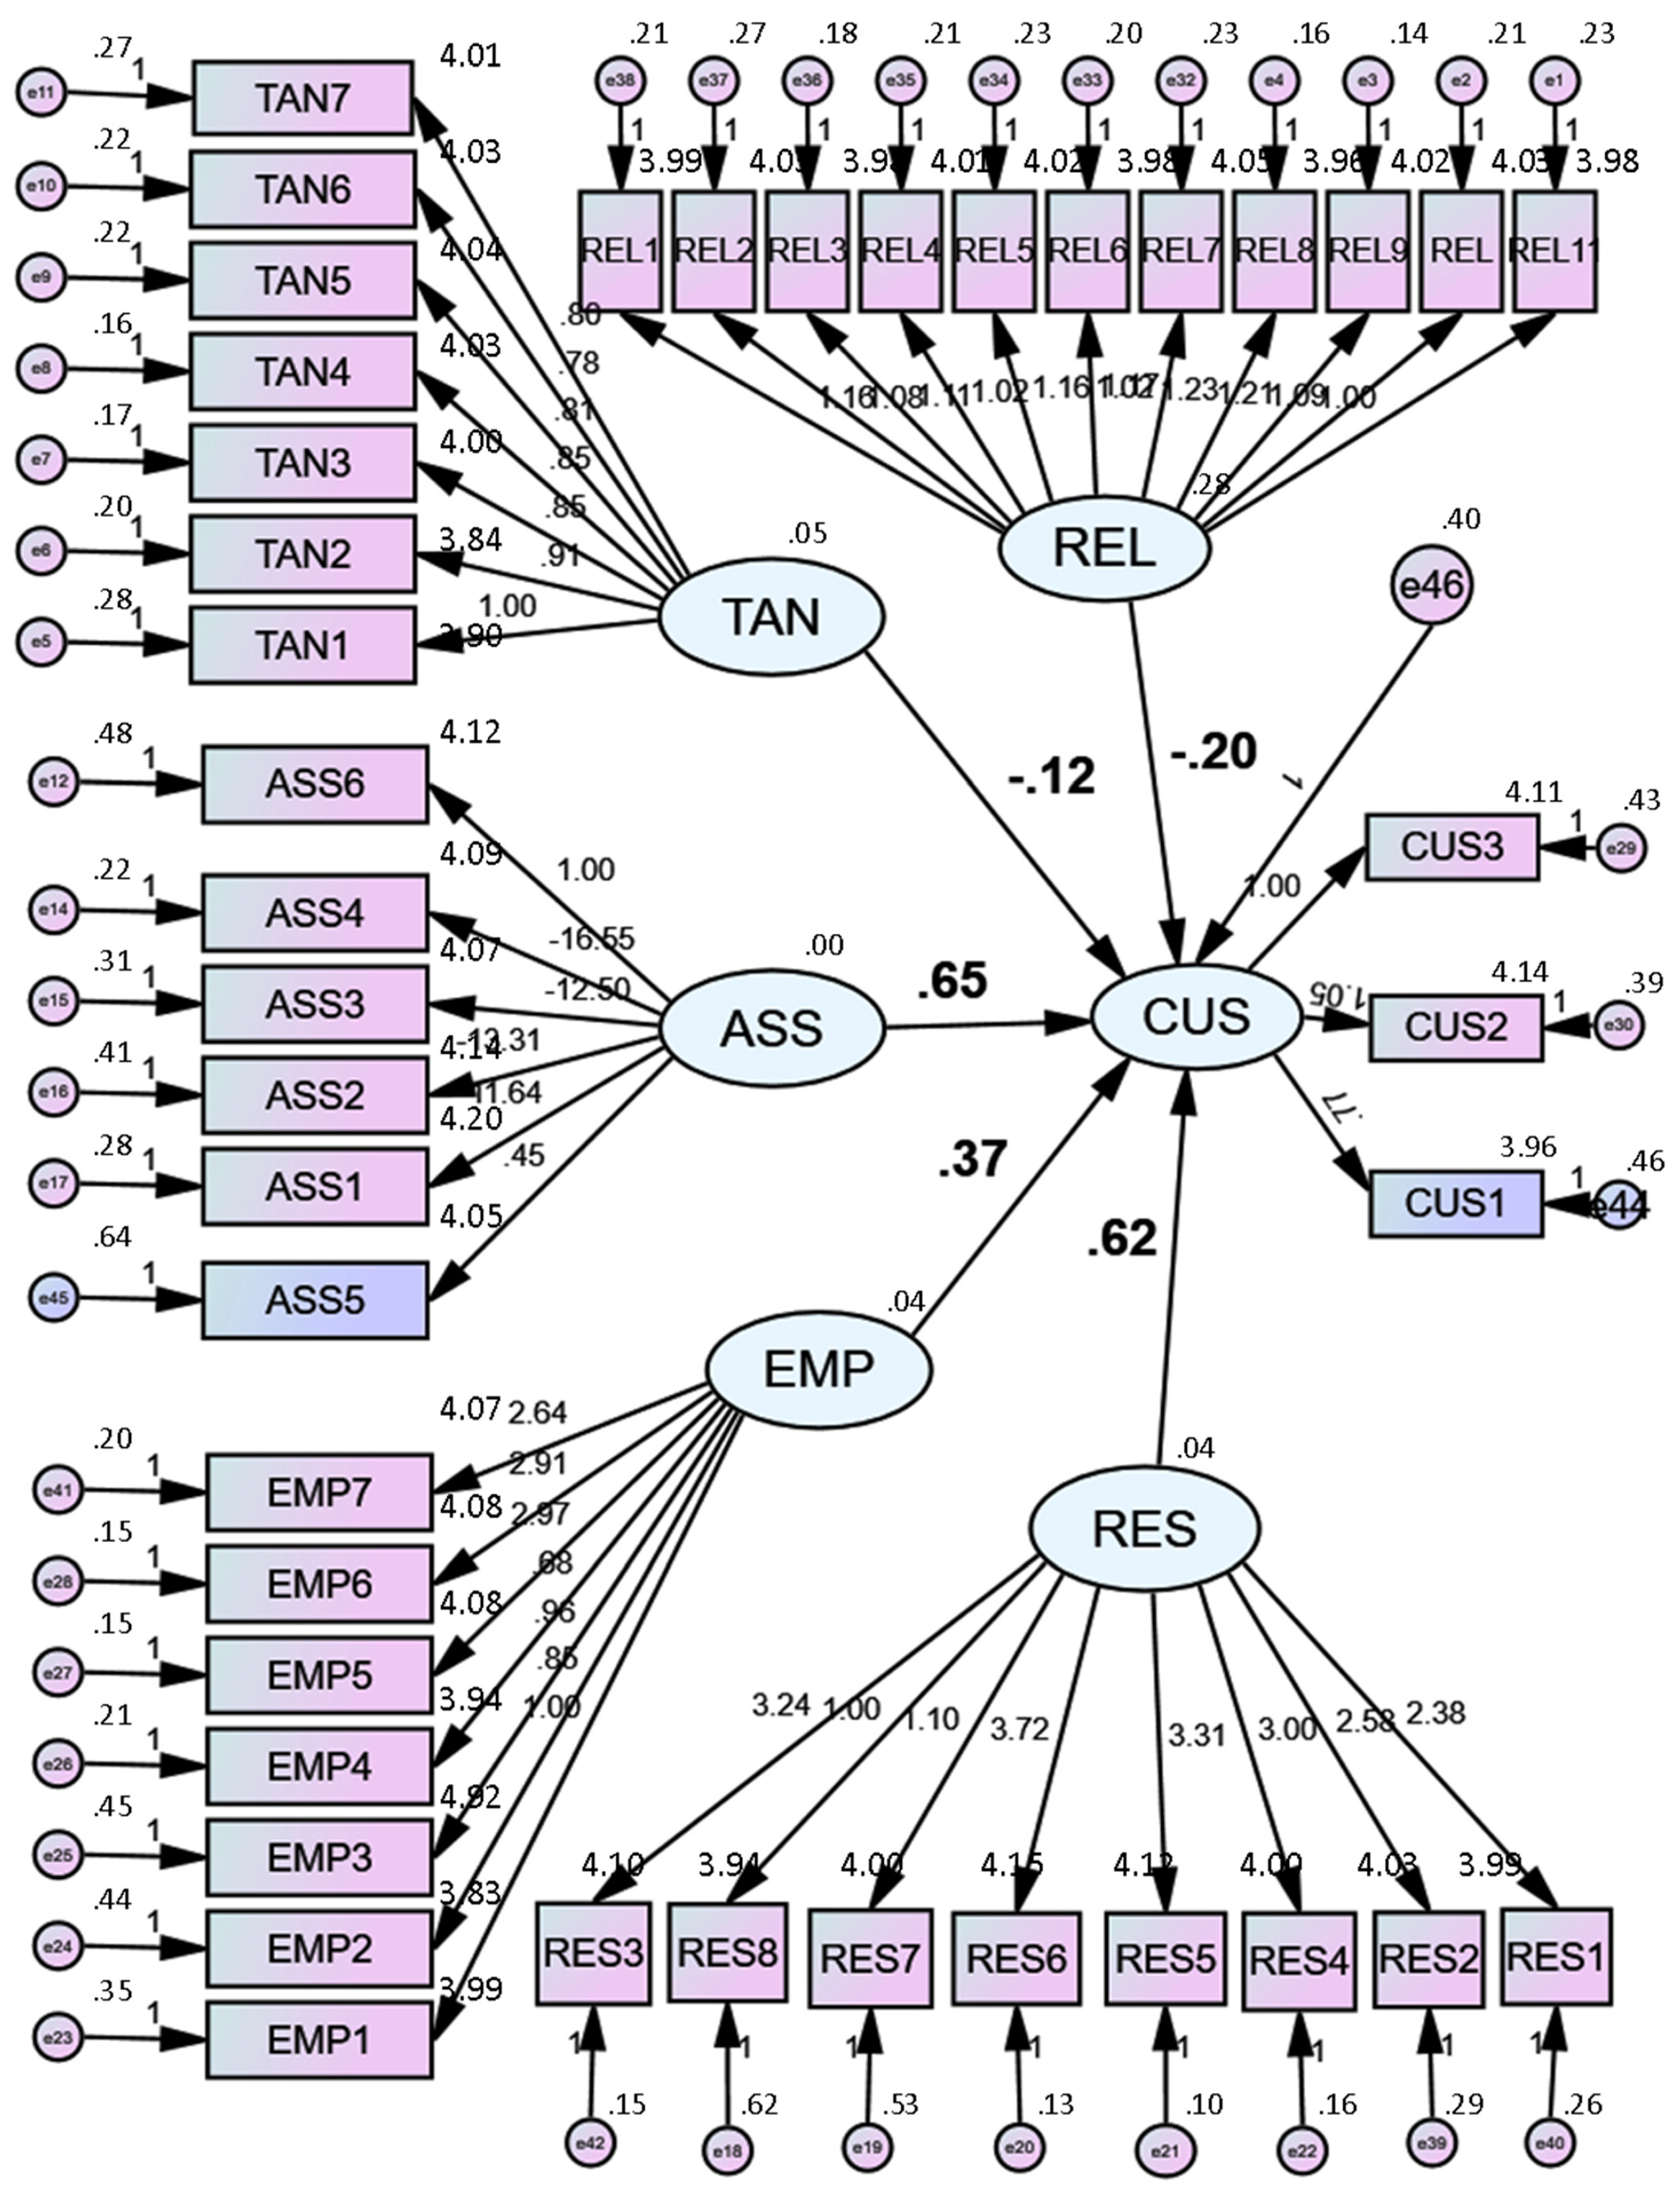
4.4. Partial Least Squares Structural Equation Modelling (PLS-SEM) Analysis

Amos Graphics software version 26 was used to perform PLS-SEM as shown in Figure 2 below. The aim was to find out how customer’s satisfaction is affected by service quality dimensions in the Dar es Salaam seaport.
From Figure 2 above, the model shows that high preference was given on assurance (β = 0.65) followed by responsiveness (β = 0.62). All hypotheses were tested using the model at a 5% level of significance and a 95% level of confidence, whereby Table 6 below shows the results of hypotheses testing.
Analysis from Table 6 above shows that the first hypothesis (H1) was partially rejected, and therefore, it can be accepted that the level of tangibility at Dar es Salaam seaport was insignificantly (β = −0.12; p = 0.056) to cause customers’ dissatisfaction. This means seaport customer satisfaction can be boosted by other factors apart from up-to date equipment, staff appearance, physical infrastructures and facilities for the seaport customer to deliver the fundamental seaport services. The second hypothesis (H2) was totally accepted. This means that responsiveness of the official was significantly influencing customers’ satisfaction (β = 0.62; p = 0.016). In this study, customers are found to care about the quick response from the Dar es Salaam seaport officials after delivery service and staff willingness to help customers and documentation procedures at Dar es Salaam seaport. With its highest average value of −1.27, this is a very good indicator that responsiveness-related seaport service quality is positively affecting customer satisfaction.
The third (H3) and fourth (H4) hypotheses were partially accepted; both had positive beta values (estimate) and insignificant p-values. Hence, the study held that the levels of empathy (β = 0.37; p = 0.136) and assurance (β = 0.65; p = 0.524) at Dar es Salaam seaport are insignificantly (just by chance) stimulate positive customers’ satisfaction. This implies that effective security system, rate of cargo damage, staff skills and knowledge, politeness and friendliness of staff in handling complaints, officials sympathetic in case of problem also had the ability to influence customer satisfaction
Moreover, the fifth hypothesis (H5) was completely rejected. The study accepted that the existing level of reliability at Dar es Salaam seaport was insignificantly cause customers’ dissatisfaction (β = −0.20; p = 0.020). This means that it is important for seaport managers to note that the seaport customers’ dissatisfaction is not only due to frequent changes of storage charges, unreasonable storage time, little problems in network system and challenges in accessing integrated electronic payment system. This is because Tanzania is a developing country and is not well established in information and other technological systems, which is well known by the seaport customers, especially Tanzanian residents. This is the reason why they did not consider it positively in affecting the customers satisfaction. However, this should be taken into consideration by the government of Tanzania so that the level of ICT applications in all operations at Dar es Salaam seaport can be improved to enhance management processes and customer-oriented operations. By doing this, reliability in Dar es Salaam seaport will have a positive influence on the satisfaction of seaport customers.

5. Conclusions, Implications, Limitations and Recommendations

5.1. Conclusions

The paper focused on assessing the service quality provided by Dar es Salaam seaport and the influence of service quality dimensions on the customers’ satisfaction. To this end, the study noted the existence of negative gap in all service quality dimensions in Dar es Salaam seaport (assurance, empathy, tangibility, reliability, and responsiveness). This indicates that customers want Dar es Salaam seaport to enhance the quality of its services in general. This implies that, the management of Dar es Salaam seaport should make efforts to improve their service quality in all five dimensions of the service quality; specifically in responsiveness and reliability which are areas that received comparatively high negative gap values.
The officials of Dar es Salaam seaport should increase the speed in handling customer’s complaints, respond quickly to shipping services requirements, provide after delivery services, collect customers’ feedback about services delivery, reduce time taken in documentation procedures and increase accuracy by letting customers know when the services will be performed/provided. These should be hand in hand with increased frequency of ship-calls, delivering the services on time as promised, in order to meet the promised deadlines, having more stable storage charges which do not change frequently, resolve technological problems immediately whenever they have occurred, increase automation and integration of the systems at the seaport, proper keeping of the seaport records, and increasing accuracy in issuing invoices and other workable documents.
Concerning satisfaction, the paper noted a high level of customer satisfaction with the services offered at this seaport. Responsiveness could significantly influence customers’ satisfaction while empathy and assurance had insignificant positive impact on the customers’ satisfaction. Logically, tangibility and reliability undermined customer satisfaction.

5.2. Implications

As seen above, there was a disparity between expected and the experienced service quality as rated by seaport users in Dar es Salaam seaport. In every evaluated element of SERVQUAL, their expectations were greater than the experienced service quality. This suggested that Dar es Salaam seaport customers are dissatisfied with the seaport’s service quality. In such instances, management’s duty is to devise and implement new strategies to close the gap that has been identified. The officers, managers and executives in the Dar es Salaam seaport should collect ideas from all seaport users on what they need; and to learn from other successful seaports across the globe so as to decrease the gap between the expectation and perception of the service quality. Additionally, seaport management should improve logistics facilities and security at the seaport, minimize tariff and seaport charges. On the other hand the management of Dar es Salaam seaport should think about the implementation of a new strategic management model, modernization of infrastructures, seaport operating systems together with the provision of regular training to seaport staff
Finally, and most importantly, management of Dar es Salaam seaport should invest in improving the levels of official responsiveness because it was the only factor which had significant power to influence customer satisfaction. It was also the one that customers wanted the most, as seen by the huge disparity between customer expectations and perceptions. This can be achieved through the provision of regular customer care seminars to the employees, and establishment of active employees’ performance management and appraisal system.

5.3. Limitation and Recommendation for Future Study

The COVID 19-pandemic was found to be the greatest limitation during the data collection process. Additionally, the findings of this study were applicable in Dar es Salaam seaport and the remaining seaport in Tanzanian. They could not be generalized to other seaports across East African region without additional papers. The paper was limited only to the five elements of SEVQUAL model (i.e., assurance, empathy, tangibility, reliability and responsiveness); variables of other models that have influence on the service quality and customer satisfaction were not included in this paper. Therefore, there is a need of conducting similar studies at Dar es Salaam seaport using other models. For similar future studies, upcoming researchers should use one of the following models; functional and technical quality model (functional quality; image; and technical quality), the SERVPERF model and the antecedents and mediator model.

Author Contributions

Conceptualization, aim, methodology and scope are designed by Z.J.; M.J.M. collected the required data and analyzed accordingly. Original draft written by M.J.M. and revised by Z.J. Both authors have read and agreed to the published version of the manuscript.

Funding

The Chinese Scholarship Council, which provided the first author with a PhD scholarship, financed this research.

Informed Consent Statement

All subjects who took part in the study provided informed consent.

Data Availability Statement

Data for this study are available when needed. The privacy of respondents is respected thus why data are not publicly available.

Acknowledgments

Authors owe thanks to all respondents who participated in filling questionnaires of this study, also special thanks go to Steven Mwelele who coordinated the whole program for data collection.

Conflicts of Interest

Both authors declare no conflict of interest.

References

  1. Duc, L.; Hong, N.; Phuc, T. Port logistics service quality and customer satisfaction: Empirical evidence from Vietnam. Asian J. Shipp. Logist. 2020, 36, 89–103. Available online: www.elsevier.com/locate/ajsl (accessed on 10 April 2021).
  2. Onyemechi, C.; Amanze, A.; Igboanusi, C.; Sule, A. Port Service Quality Study of Nigerian Sea Ports. J. Shipp. Ocean Eng. 2017, 7, 59–64. [Google Scholar] [CrossRef] [Green Version]
  3. Nguyen, N.; Trans, T. Raising opportunities in strategic alliance by evaluating efficiency of logistics companies in Vietnam: A case of Cat Lai Port. Neural Comput. Appl. 2019, 31, 7963–7974. [Google Scholar] [CrossRef]
  4. Thao, V.; David, G.; David, M. Exploring logistics service quality in Hai Phong, Vietnam. Asian J. Shipp. Logist. 2020, 36, 54–64. Available online: www.elsevier.com/locate/ajsl (accessed on 13 April 2020).
  5. Yeo, G.; Thai, V.; Roh, S. An Analysis of Port Service Quality and Customer Satisfaction: The Case of Korean Container Ports. Asian J. Shipp. Logist. 2015, 31, 437–447. [Google Scholar] [CrossRef] [Green Version]
  6. Bae, H.; Park, D. Gaps in performance between the levels of inter-corporate relationships in port logistics processes. Asian J. Shipp. Logist. 2018, 34, 209–217. [Google Scholar] [CrossRef]
  7. Pham, Y.; Yeo, G. Evaluation of transshipment container terminals’service quality in Vietnam: From the shipping companies’ perspective. J. Sustain. 2019, 11, 15–23. [Google Scholar]
  8. Humphreys, M.; Stokenberga, A.; Dappe, M.; Atsushi, I.; Hartmann, O. Port Development and Competition in East and Southern Africa; Prospects and Challenges; World Bank Group: Washington, DC, USA, 2019. [Google Scholar]
  9. Ngangaji, M. An Assessment of Container Terminal Efficiency in East Africa Ports Using Data Envelopment Analysis (DEA): The Case of Dar es Salaam & Mombasa Ports. Master’s Dissertation, World Maritime University, Malmö, Sweden, 2019. Available online: https://commons.wmu.se/all_dissertations/1197 (accessed on 10 April 2021).
  10. Kalgora, B.; Goli, S.; Damigou, B.; Abdoulkarim, H.; Amponsem, K. Measuring West-Africa Ports Efficiency Using Data Envelopment Analysis. J. Transp. Technol. 2019, 9, 287–308. [Google Scholar] [CrossRef] [Green Version]
  11. Maneno, F. Assessment of Factors Causing Port Congestion: A Case of the Port Dar es Salaam; The Maritime Commons: Digital Repository of the World Maritime University; World Maritime University: Malmö, Sweden, 2019. [Google Scholar]
  12. Kahyarara, G.; Simon, D. Opportunity and Growth Diagnostic of Maritime Transportation in the Eastern and Southern Africa; UNCTAD: Geneva, Switzerland, 2020. [Google Scholar]
  13. Mwendapole, M.J.; Zhihong, J. Status, Challenges and Strategies of Dar es Salaam Seaport-Hinterland Connectivity. In Proceedings of the 8th International Conference on Traffic and Logistic Engineering (ICTLE), MATEC Web of Conferences, Shenzhen, China, 28–30 August 2020; Volume 325, pp. 1–8. [Google Scholar] [CrossRef]
  14. Oliver, R. Satisfaction: A Behavioral Perspective on the Customer; McGraw-Hill: Boston, MA, USA, 1997. [Google Scholar]
  15. Vishuen, M.; Veena, M.; Boopen, S.; Sawkut, R. An Empirical Study of the Quality of Service of a Port Operator: The Case of Port-Louis, Mauritius. J. Acad. Bus. Econ. 2010, 10, 160–166. [Google Scholar]
  16. Dale, B. Managing Quality, 4th ed.; Blackwell Publishing Ltd.: Hoboken, NJ, USA, 2003. [Google Scholar]
  17. Parasuraman, A.; Zeithaml, V.A.; Berry, L. A Conceptual Model of Service Quality and Its Implications for Future Research. J. Mark. 1985, 49, 12–40. [Google Scholar] [CrossRef]
  18. Parasuraman, A.; Zeithaml, V.; Berry, L. SERVQUAL: A Multi-item Scale for Measuring Consumer Perceptions of the Service Quality. J. Retail. 1988, 64, 41–50. [Google Scholar]
  19. Gabbie, O.; O’Neill, M. SERVQUAL and the Northern Ireland Hotel Sector: A Comparative Analysis. Manag. Serv. Qual. 1997, 7, 43–49. [Google Scholar] [CrossRef]
  20. Newman, K. Interrogating SERVQUAL: A Critical Assessment of Service Quality Measurement in a High Street Retail Bank. Int. J. Bank Mark. 2001, 19, 126–139. [Google Scholar] [CrossRef]
  21. Ugboma, C.; Ugboma, O.; Damachi, B. A Comparative Assessment of Service Quality Perspectives and Satisfaction in Ports: Evidence from Nigeria. Int. J. Shipp. Transp. Logist. 2009, 1, 172–193. [Google Scholar] [CrossRef]
  22. Miremadi, A.; Ghalamkari, S.; Sadeh, F. Customer Satisfaction in Port Industry. In Proceedings of the International Conference on Sociality and Economics Development, Kuala Lumpur, Malaysia, 4–5 June 2011; IACSIT Press: Singapore, 2011; Volume 10, pp. 58–62. [Google Scholar]
  23. Seth, N.; Deshmukh, S.; Vrat, P. A framework for measurement of quality of service in supply chains. Supply Chain Manag. 2006, 11, 82–94. [Google Scholar] [CrossRef]
  24. Chowdhary, N.; Prakash, M. Prioritizing service quality dimensions. Manag. Serv. Qual. 2007, 17, 493–509. [Google Scholar] [CrossRef] [Green Version]
  25. Guo, X.; Duff, A.; Hair, M. Service quality measurement in the Chinese corporate banking market. Int. J. Bank Mark. 2008, 26, 305–327. [Google Scholar] [CrossRef]
  26. Lee, W.; Hu, C. Novel 3D model for prioritizing the attributes of port service quality: Cases involving major container ports in Asia. Int. J. Shipp. Transp. Logist. 2017, 9, 673–695. [Google Scholar]
  27. Cronin, J.J., Jr.; Taylor, S. Measuring Service Quality: A Reexamination and Extension. J. Mark. 1992, 56, 55–68. [Google Scholar] [CrossRef]
  28. Farrelly, F.; Quester, P. Examining important relationship quality constructs of the focal sponsorship exchange. Ind. Mark. Manag. 2005, 34, 211–219. [Google Scholar] [CrossRef]
  29. Shin, Y.; Thai, V.; Yuen, K. The impact of supply chain relationship quality on performance in the maritime logistics industry in light of firm characteristics. Int. J. Logist. Manag. 2018, 29, 1077–1097. [Google Scholar] [CrossRef]
  30. Chang, C.; Thai, V. Do port security quality and service quality influence customer satisfaction and loyalty? Marit. Policy Manag. 2016, 43, 720–736. [Google Scholar] [CrossRef]
  31. Anderson, S.; Baggett, L.; Widener, S. The impact of service operations failures on customer satisfaction: Evidence on how failures and their source affect what matters to customers. Manuf. Serv. Oper. Manag. 2009, 11, 52–69. [Google Scholar] [CrossRef] [Green Version]
  32. Ha, M.S. 2A comparison of service quality at major container ports: Implications for Korean ports. J. Transp. Geogr. 2003, 11, 131–137. [Google Scholar] [CrossRef]
Figure 1. Conceptual model.
Sustainability 13 10076 g001
Figure 2. Correlation between Customer Satisfaction and Service Quality Dimensions.
Sustainability 13 10076 g002
Table 1. Service Dimensions and Research Variables.
Service Dimensions Research VariablesCode
TANGIBILITYDar es Salaam seaport has good accessTAN1
A wide range of ships call at Dar es Salaam seaportTAN2
All physical facilities at the Dar es Salaam seaport are visually appealingTAN3
Dar es Salaam seaport official appearance is appealingTAN4
Dar es Salaam seaport has up-to date equipment and facilities that always function properlyTAN5
Dar es Salaam seaport has outstanding physical infrastructure such as yards, sheds, berths, distribution centres, warehouses, accesiblle hinterland linksTAN6
There is always an electronic single window system to simplify clearance process at Dar es Salaam seaportTAN7
RELIABILITYThere is frequency ship-calls at the Dar es Salaam seaportREL1
Dar es Salaam seaport officials provide fast and efficient services as promisedREL2
The storage charges do not change frequently at Dar es Salaam seaportREL3
Dar es Salaam seaport storage time is reasonableREL4
The network system at Dar es Salaam seaport has few problemsREL5
Integrated electronic payment system enables customers to access bills and invoices at Dar es Salaam seaportREL6
Records are kept accurate at Dar es Salaam seaportREL7
Service providers at Dar es Salaam seaport are dependableREL8
Dar es Salaam seaport always provide services in a consistent mannerREL9
Dar es Salaam seaport consistently generates error-free invoices and related papersREL10
Dar es Salaam seaport constantly provides competitive service pricesREL11
RESPONSIVENESSOfficials of Dar es Salaam seaport respond quickly to shipping services requirementsRES1
Officials of Dar es Salaam seaport give after delivery servicesRES2
Officials of Dar es Salaam seaport routinely collect client input on service delivery and use it to enhance the seaportRES3
Level of management at the Dar es Salaam seaport is comprehensiveRES4
Officials of Dar es Salaam Seaport handle customers complains very fastRES5
Officials of Dar es Salaam seaport are willing to help customers at any timeRES6
Documentation procedures at Dar es Salaam seaport take little timeRES7
Officials of Dar es Salaam seaport inform consumers of the exact time the services will be performed/provided.RES8
ASSURANCEThere is an effective security system at Dar es Salaam seaportASS1
Dar es Salaam seaport employees are reassuring when problems ariseASS2
Rate of cargo damage at Dar es Salaam seaport is minimalASS3
Customers trust officials at Dar es Salaam seaportASS4
Goods are handled well with modern equipment at the Dar es Salaam seaportASS5
Officials of Dar es Salaam seaport possess the required skills and knowledge relating to seaport service deliveryASS6
EMPATHYOfficials of Dar es Salaam seaport are polite and friendly in handling complaintsEMP1
Officials of Dar es Salaam seaport give customers individual attentionEMP2
Officials of Dar es Salaam seaport are sympathetic when problems ariseEMP3
Officials of Dar es Salaam seaport demonstrate good understanding of customer needsEMP4
Management of Dar es Salaam seaport prepares seminars and workshops for seaport users on how they are performing their servicesEMP5
Facilities such as cranes at the Dar es Salaam seaport are 24/7 working to satisfy many customers at the same hoursEMP6
Dar es Salaam seaport users are immediately informed on every change introducedEMP7
CUSTOMER SATISFACTIONGenerally, I am satisfied with the procedures employed in the delivery of services at the Dar es Salaam seaportCUS1
Generally, I am satisfied with the Dar es Salaam seaport’s management and officialsCUS2
Generally, I am satisfied with the equipment, facilities and other infrastructure available at the Dar es Salaam seaportCUS3
Table 2. Percentage distribution of the respondents’ profile.
Profile Variables FrequenciesPercent (%)
GenderMale21869.4
Female9830.6
Total314100.0
Age <20 years72.2
20–29 years4815.3
30–39 years9429.9
40–49 years9028.7
50–59 years5116.2
60 years and above247.6
Total314100.0
Education qualificationsCertificate and diploma 10031.8
Bachelor degree 13442.7
Postgraduate (masters and PhD)8025.5
Total314100.0
Experience in using Dar es Salaam seaport1–5 years319.8
6–10 years4815.3
11–15 years9429.9
16–20 years9028.7
>20 years5116.2
Total314100.0
Table 3. Service Quality Perception and Expectation Scores.
Service DimensionsResearch VariablesExpectation Scores
[Expected Quality (E)]
Perception Scores
[Perceived Quality (P)]
Gap Scores
(P-E)
12345Mean12345Mean∆Mean
TANGIBILITYTAN132353157783.9059550581063.53−0.37
TAN221550181663.94115055141573.58−0.36
TAN301150181724.0009333591293.71−0.29
TAN401145183754.03371655891173.74−0.29
TAN511239184794.04243950113883.64−0.4
TAN611236192734.0367438104923.64−0.39
TAN721340180754.01144258106943.71−0.3
Weighted Mean 3.99 3.65−0.34
RELIABILITYREL131142189693.99194354133653.58−0.41
REL211731187784.0358012560443.18−0.85
REL311339198633.98175815168203.05−0.93
REL401240195674.01123414792293.29−0.72
REL501838178804.02144116082173.15−0.87
REL631046185703.98213710199563.42−0.56
REL711038187784.05123288145373.52−0.53
REL851230209583.96991207312102.09−1.87
REL911337190734.02561011015062.52−1.5
REL1021232196724.033019103117453.41−0.62
REL1111240199623.981091156117122.07−1.91
Weighted Mean 4.00 3.03−0.98
RESPONSIVENESSRES111140200623.9969906960262.63−1.36
RES231231194744.031351109108333.31−0.72
RES321535191714.0060100945552.51−1.49
RES411339193684.00476213757112.75−1.25
RES501333172964.12536713844122.67−1.45
RES6510321531144.1573789148212.55−1.6
RES701837185744.00266710795193.04−0.96
RES831648177703.9461899747202.61−1.33
Weighted Mean 4.03 2.76−1.27
ASSURANCEASS135431391244.201443441031103.80−0.4
ASS2126361151364.14201979132643.64−0.5
ASS3021401481054.07131683971053.84−0.23
ASS4421501071324.09342350921153.74−0.35
ASS53269142984.0510882149653.80−0.25
ASS60835181904.121926391301003.85−0.27
Weighted Mean 4.11 3.78−0.33
EMPATHYEMP11444213523.99132273136703.73−0.26
EMP20473177603.93122568156533.68−0.25
EMP30364171764.0292784135593.66−0.36
EMP40240248243.94132167150633.73−0.21
EMP51833194784.08122292145433.59−0.49
EMP61734195774.08152266157543.68−0.4
EMP71638193764.07162561148643.70−0.37
Weighted Mean 4.02 3.68−0.33
Table 4. Analysis of Quality Gap across Service Quality Dimensions.
Service Quality DimensionsWeighted Means% GAP
[(P-E)/E] ∗ 100
EPService Quality Gap (P-E)
Tangibility3.993.65−0.34−8.5%
Reliability4.003.03−0.98−24.5%
Responsiveness4.032.76−1.27−31.5%
Assurance4.113.78−0.33−8.0%
Empathy4.023.68−0.33−8.2%
Composite (Overall Average)−0.65−16.14%
Table 5. Perceived Customer Satisfaction.
VariablesFrequenciesNMeanSTD
12345
CUS1104047131863143.961.083
CUS2219451161323144.140.920
CUS3023471171273144.110.915
Weighted Mean4.07
Table 6. Model Summary and Hypotheses Testing.
Path Estimate (β)S.E.C.R.PHypotheses
CUS<---TAN−0.120.063−1.9120.056H1 partially rejected
CUS<---RES0.620.2572.4190.016H2 totally accepted
CUS<---EMP0.370.2481.4900.136H3 partially accepted
CUS<---ASS0.651.0170.6370.524H4 partially accepted
CUS<---REL−0.200.084−2.3280.020H5 total rejected
Publisher’s Note: MDPI stays neutral with regard to jurisdictional claims in published maps and institutional affiliations.

