Article

An Assessment of Air Quality within Facilities of Municipal Solid Waste Management (MSWM) Sites in Lahore, Pakistan

1
Yunnan Key Laboratory of Plant Reproductive Adaptation and Evolutionary Ecology, Yunnan University, Kunming 650500, China
2
Key Laboratory of Soil Ecology and Health in Universities of Yunnan Province, College of Ecology and Environmental Sciences, Yunnan University, Kunming 650500, China
3
Key Laboratory of Mountain Surface Processes and Ecological Regulation, Institute of Mountain Hazards and Environment, Chinese Academy of Sciences, Chengdu 610041, China
4
Environmental Health and Wildlife, Department of Zoology, University of the Punjab, Lahore 54590, Pakistan
5
School of Water, Energy and Environment, Cranfield University, Cranfield MK43 0AL, UK
6
School of Business and Economics, Department of Economics and Statistics, University of Management and Technology, Lahore 54590, Pakistan
*
Authors to whom correspondence should be addressed.
Processes 2021, 9(9), 1604; https://doi.org/10.3390/pr9091604
Submission received: 8 August 2021 / Revised: 30 August 2021 / Accepted: 31 August 2021 / Published: 7 September 2021

Abstract

:
The pollutants emission during the process of municipal solid waste management (MSWM) is of great concern due to its hazardous effect on the environment and living organisms. An assessment of the air quality of MSWM sites was made after having 16 repetitive visits at solid waste disposal sites and transfer stations of Lahore during wet and dry seasons. Pollution parameters such as fine particulate matter (PM2.5) and greenhouse gases (GHG) were measured along with meteorological parameters. PM2.5 measurement was made by using particle counter Dylos and TSI’s Dust Trak. Both of these instruments were positioned simultaneously at the source site and downwind (50 m). CH4 and meteorological parameters were measured by Aeroqual 500 series, while the Extech CO220 monitor was used to measure CO2 concentration. An assessment of air quality showed the levels of their mean values as CH4 and CO2 ranged between 1.5–13.7 ppm and 443.4–515.7 ppm, respectively. The PM2.5 ranged between 127.1 and 307.1 µg/m3 at sources and 172.3 and 403.8 µg/m3 downwind (50 m). GHG showed lower levels than the proposed limit value, which could not cause any health issues, while PM2.5 was 6–10 times higher than the Pak-EPA established standards. Higher pollutant concentration was recorded in the dry season than the wet season. Regression analysis was performed to predict correlation of PM2.5 with GHG and meteorological parameters. GHG as well as meteorological parameters also exhibited a correlation with PM2.5. It was estimated that the ambient air of such sites is not safe for public health. So, it is necessary to use safe practices for MSWM and its emission control to prevent nearby communities and the environment.

1. Introduction

Solid waste management (SWM) has come to be a major challenging issue in urban areas of developing countries due to urbanization and industrialization. It is becoming an increasing threat to living organisms and environment [1]. According to an estimate, 2.6 million tons per day of municipal solid waste is produced globally, and the amount may reach up to 4.5 million tons per day by 2050, according to the international solid waste association (ISWA) [2]. Improper and inadequate SWM activities can impair the air, soil and water quality since maximum biotas are added through the food chain or enter into the body via nasal cavity [3]. The management of solid waste is in association with the control of its production, collection and storage and finally is transferred to disposal sites by following the best principles of health, finances, aesthetics and ecological aspects [4,5]. The life-cycle assessment for MSWM related to resources and emissions has been studied in detail [6].
In developing countries, SWM sites are located near water bodies and urban areas causing deterioration of the water and air quality of that region by emitting hazardous pollutants [7]. Burning of municipal solid waste is also a common practice due to convenience and low finances resulting from the emission of pollutants, GHG, heavy metals and non-methane volatile organic compounds (NMVOCs) [8,9]. Recently, studies evaluating the indoor environmental quality (IEQ) performance of a two-sided wind catcher [10] have been carried out and comprehensive details on the capture and reuse of CO2 for a plastics have been revealed [11]. The emission of GHG is a serious concern, causing global warming [12]. Among them, CH4 is a potent GHG having 25 times greater global warming potential than CO2, and annually its concentration is increasing (1–2%) [13]. Anaerobic decomposition of organic contents at solid waste dumping sites and disposal sites generates 40% CO2 and 60% CH4, along with other trace gases. Solid waste changes into its components based on waste age, density, composition and moisture conditions at the period of decomposition [14,15].
Pollutants emission at SWM sites causes adverse effects on public health and the environment. These enter into the human body via inhalation; penetrate the lungs; and produce various diseases such as pulmonary and cardiovascular diseases, gastrointestinal diseases, asthma and premature birth [16]. Specifically, the increased levels of PM2.5 cause acute and chronic lung diseases. People living close to SWM sites have a high risk of disease [17]. The fate of pollutants in ambient air of a specific area is determined by the metrological parameters [18]. A study was conducted in Taichung Harbor, Taiwan to observe the effect of meteorological conditions on pollutants. The correlation analysis of PM and meteorology showed that meteorological parameters have an impact on the concentration of PM [19]. In the tropical conditions of Malaysia, a study was made to measure gas emissions in wet and dry seasons. Higher emissions of GHG were observed in the wet season than the dry season [20]. Another study was made to measure the air quality of a dumping site in Ubakala, Southeastern Nigeria. The path of pollution dispersion pattern and its impact from source site to adjacent populations was studied. The mean temperature, humidity and wind speed were measured, and the mean concentration of PM at source and 3.6 km away from the source were measured during the wet and dry seasons. Pollutants including volatile organic compounds, NH3, H2S and SO2 were above the standard limits as compared to GHG [21]. Peter and Nagendra [22] studied the metrological effect on the dispersal of PM2.5 from an old dumping site in Chennai, India. Monitoring was conducted in and around the dumping site to observe the effect of MSWM activities on the air quality of a residential area. The average concentration was 50, 44 and 34 µg/m3 during inactivity, recirculation and ventilation measures, respectively. Spearman’s correlation analysis showed an inverse relationship between PM2.5 and meteorological conditions.
Pakistan has population of about 216.6 million and is the fifth most populated country in world. Urbanization has increased the present fragile infrastructure and services stimulating serious conservational challenges. Additionally, there has also been an increase in the number of MSWM sites. In various cities of Pakistan, solid waste production rate is different and overall production is 0.28–0.61 kg capita−1day−1 [23]. In Lahore, the expected production is 0.65 kg capita−1day−1 [24,25]. Collected waste (60%) is dumped in solid waste disposal sites and uncollected waste (40%) lies along roads and empty plots or in drains. The recyclable material from solid waste is not appropriately collected and put in storage [26]. The government is seeking to improve the MSWM facilities. These management processes have increased, resulting in health hazards due to the emission of pollutants, i.e., harmful gases, heavy metals, particulates and bio-aerosols. There is limited data present related to the air quality within the facilities of MSWM sites. Water pollution has been the key concern at MSWM sites, but the ambient air pollution as a result of emission of gaseous and PM has not been measured completely.
The current study is carried out to understand pollutants’ emission, which will assist in making as well as regulating policies for waste management at the state level and certifying public and environmental protection. Meteorological effects were also measured regarding the concentration of PM and GHG. Our hypothesis is to study the levels of PM2.5 and GHG at MSWM sites, in Lahore, Pakistan, since collecting and quantifying the fractioned data for particulate matter helps us to understand that exceeding standard limits is hazardous to workers and public health.

2. Materials and Methods

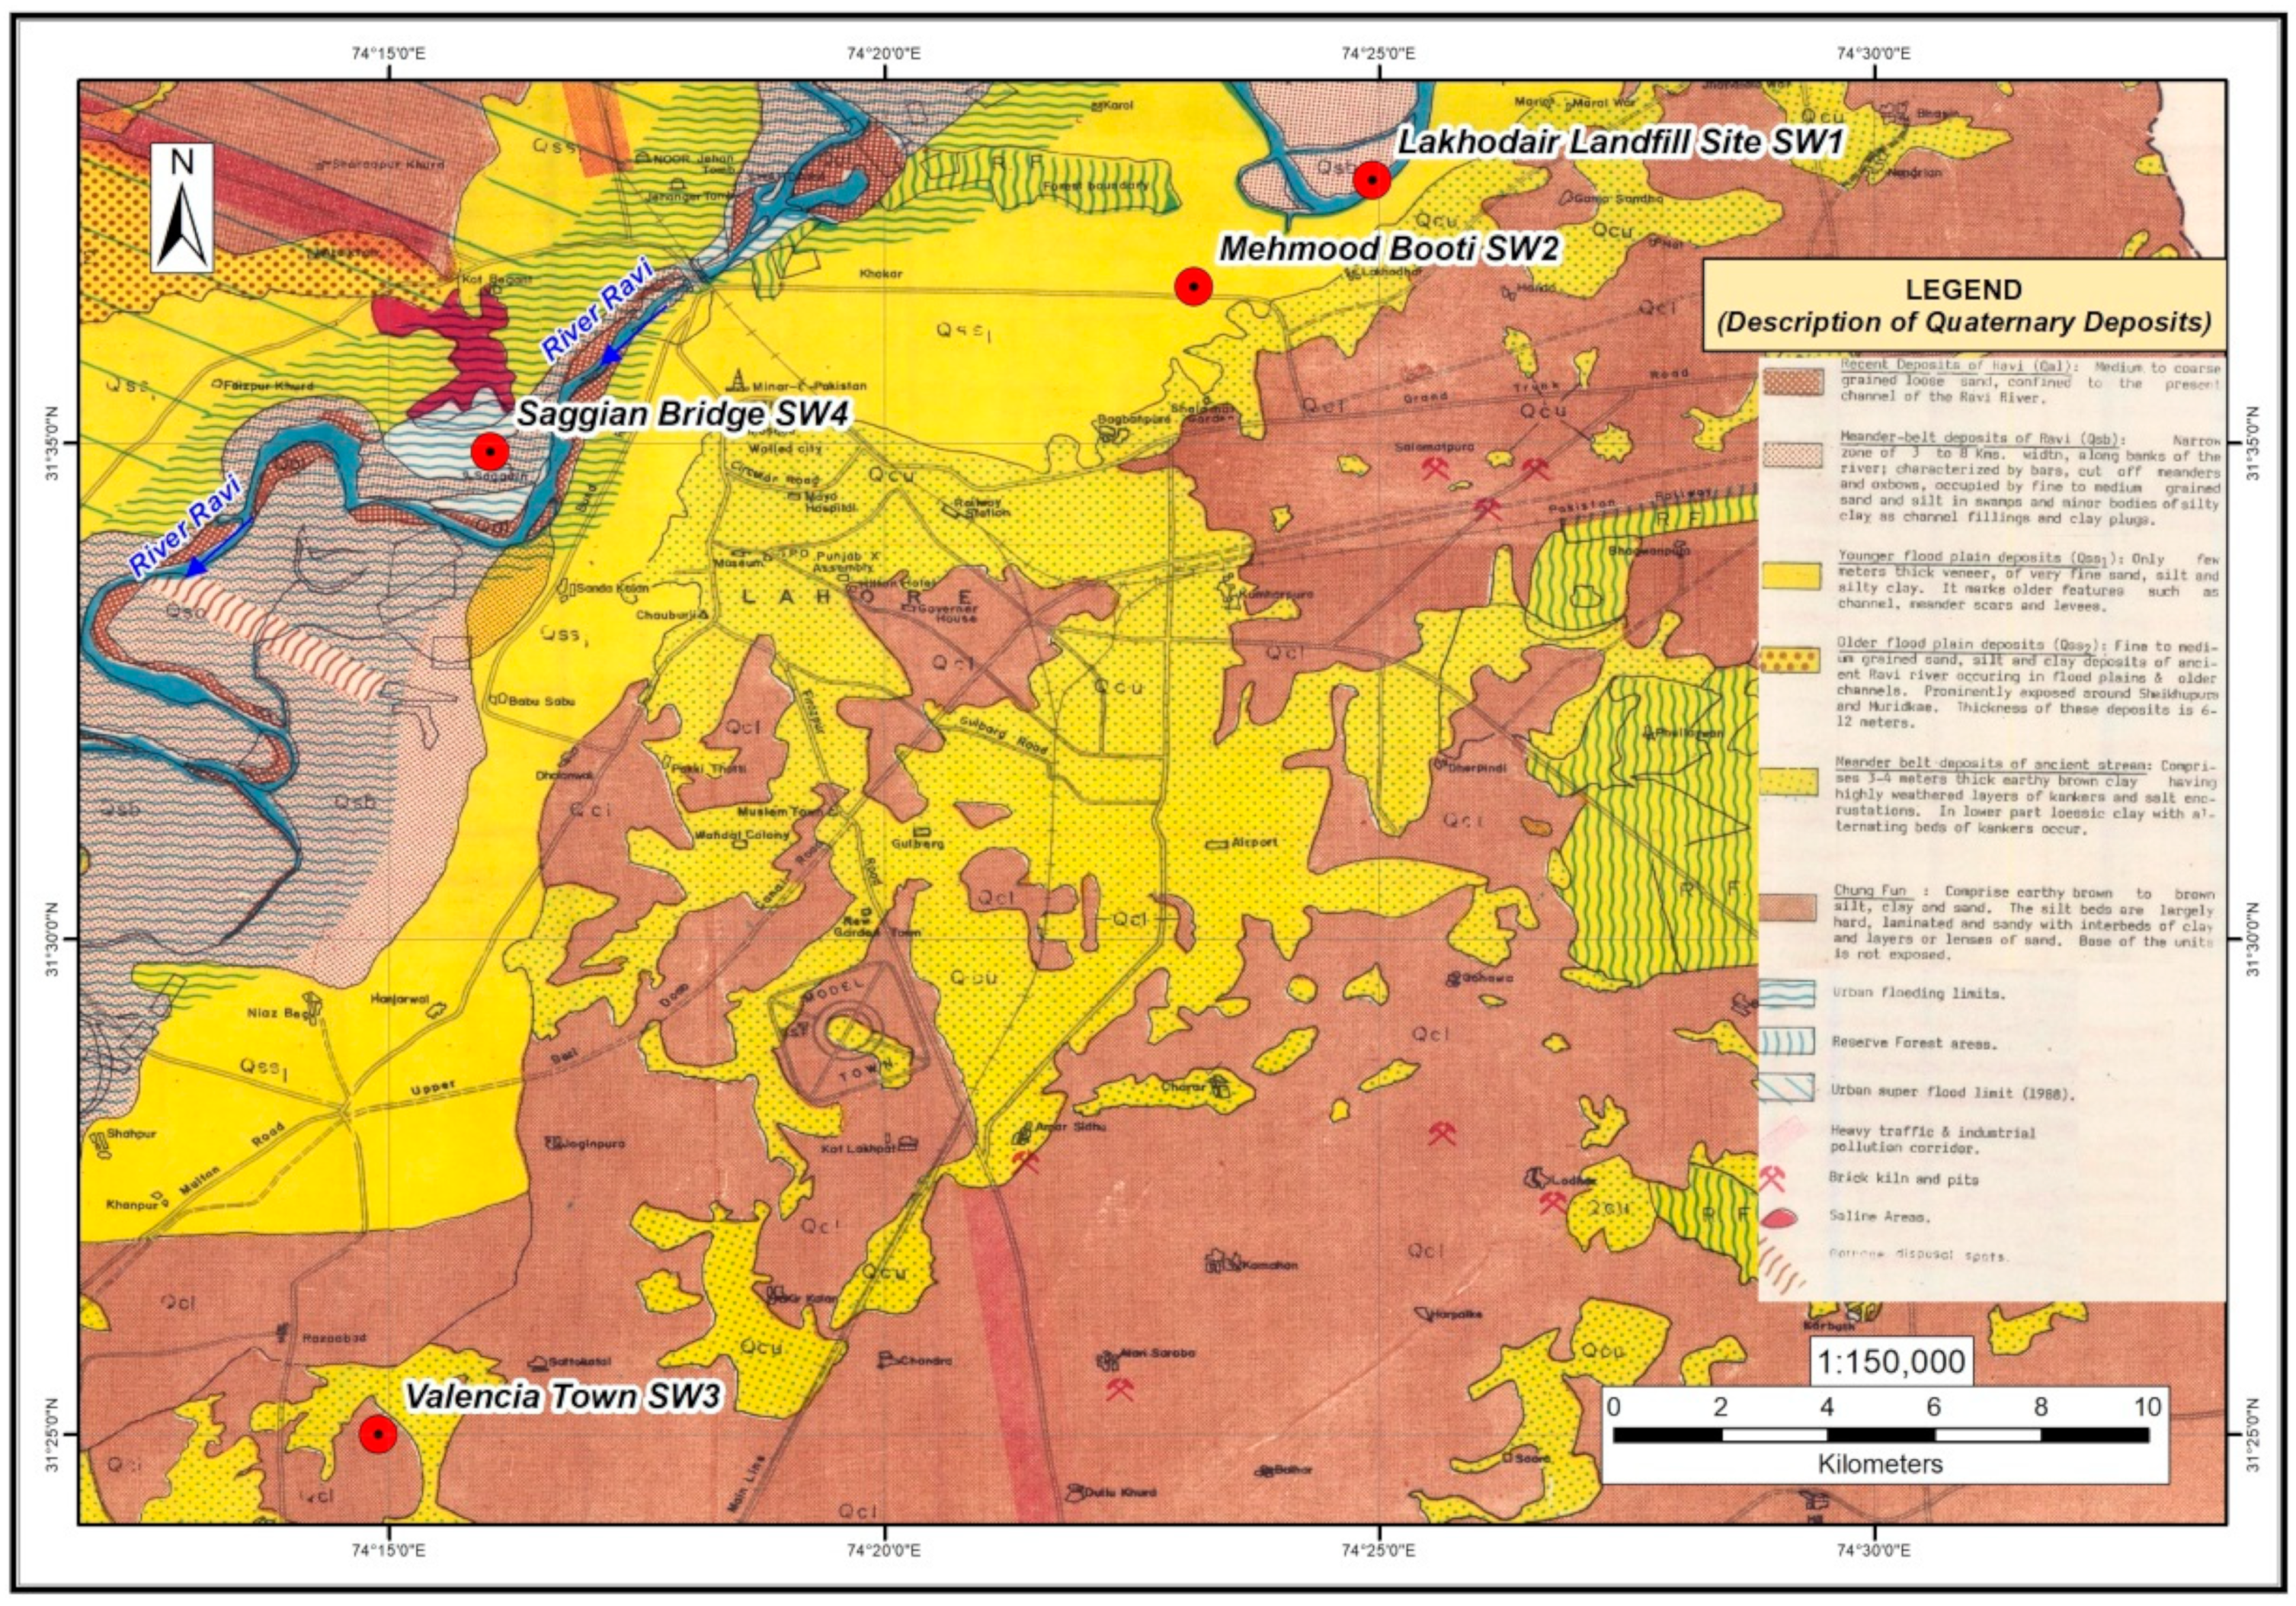
2.1. Description of Study Area

Lahore is the oldest city in Pakistan and is also capital of Punjab province, having area of 1772 km2. Its population is 12,642,000, with a growth rate of 3.73% in 2020. Four sites were selected during this study: Lakhodair and Mehmood Booti disposal sites (SW1, SW2) and Valencia town and Saghian bridge transfer stations (SW3, SW4), as shown in Figure 1. SW1 site is generally comprised of 52 hectares, using covered zone of 28 hectares. Out of 6 plots, just 2 plots have been useful since 2016 and have produced 2000–2500 tons of solid waste per day. SW2 has been a disposal site since 1995. In 2010, it became non-functioning after receiving 6 million tons of waste. SW3 consisted of around 15 canals and handled 1000 tons of solid waste in a day. SW4 consisted of 10 canals and handled 1400 tons of waste in a day. It conducts its management activities in 46 union councils of Lahore. SW1 site is involved in waste compaction, transportation activities, sorting, unloading and mechanical earth leveling. SW2 site showed no distinct activities except transportation, while SW3 and SW4 sites showed loading and unloading, transportation activities and sorting of waste material. Workshop activities for maintaining automobiles were also observed. A generator was working in the absence of electricity at transfer stations.

2.2. Sampling Design

The main sites of the municipal waste management covering important regions of the city were designated for collecting samples. Sixteen visits were performed on all sites for the data collection. On each sampling site, four measurements (two in wet season and two in dry) were conducted. PM2.5 was measured simultaneously at source and 50 m away (downwind) from source.

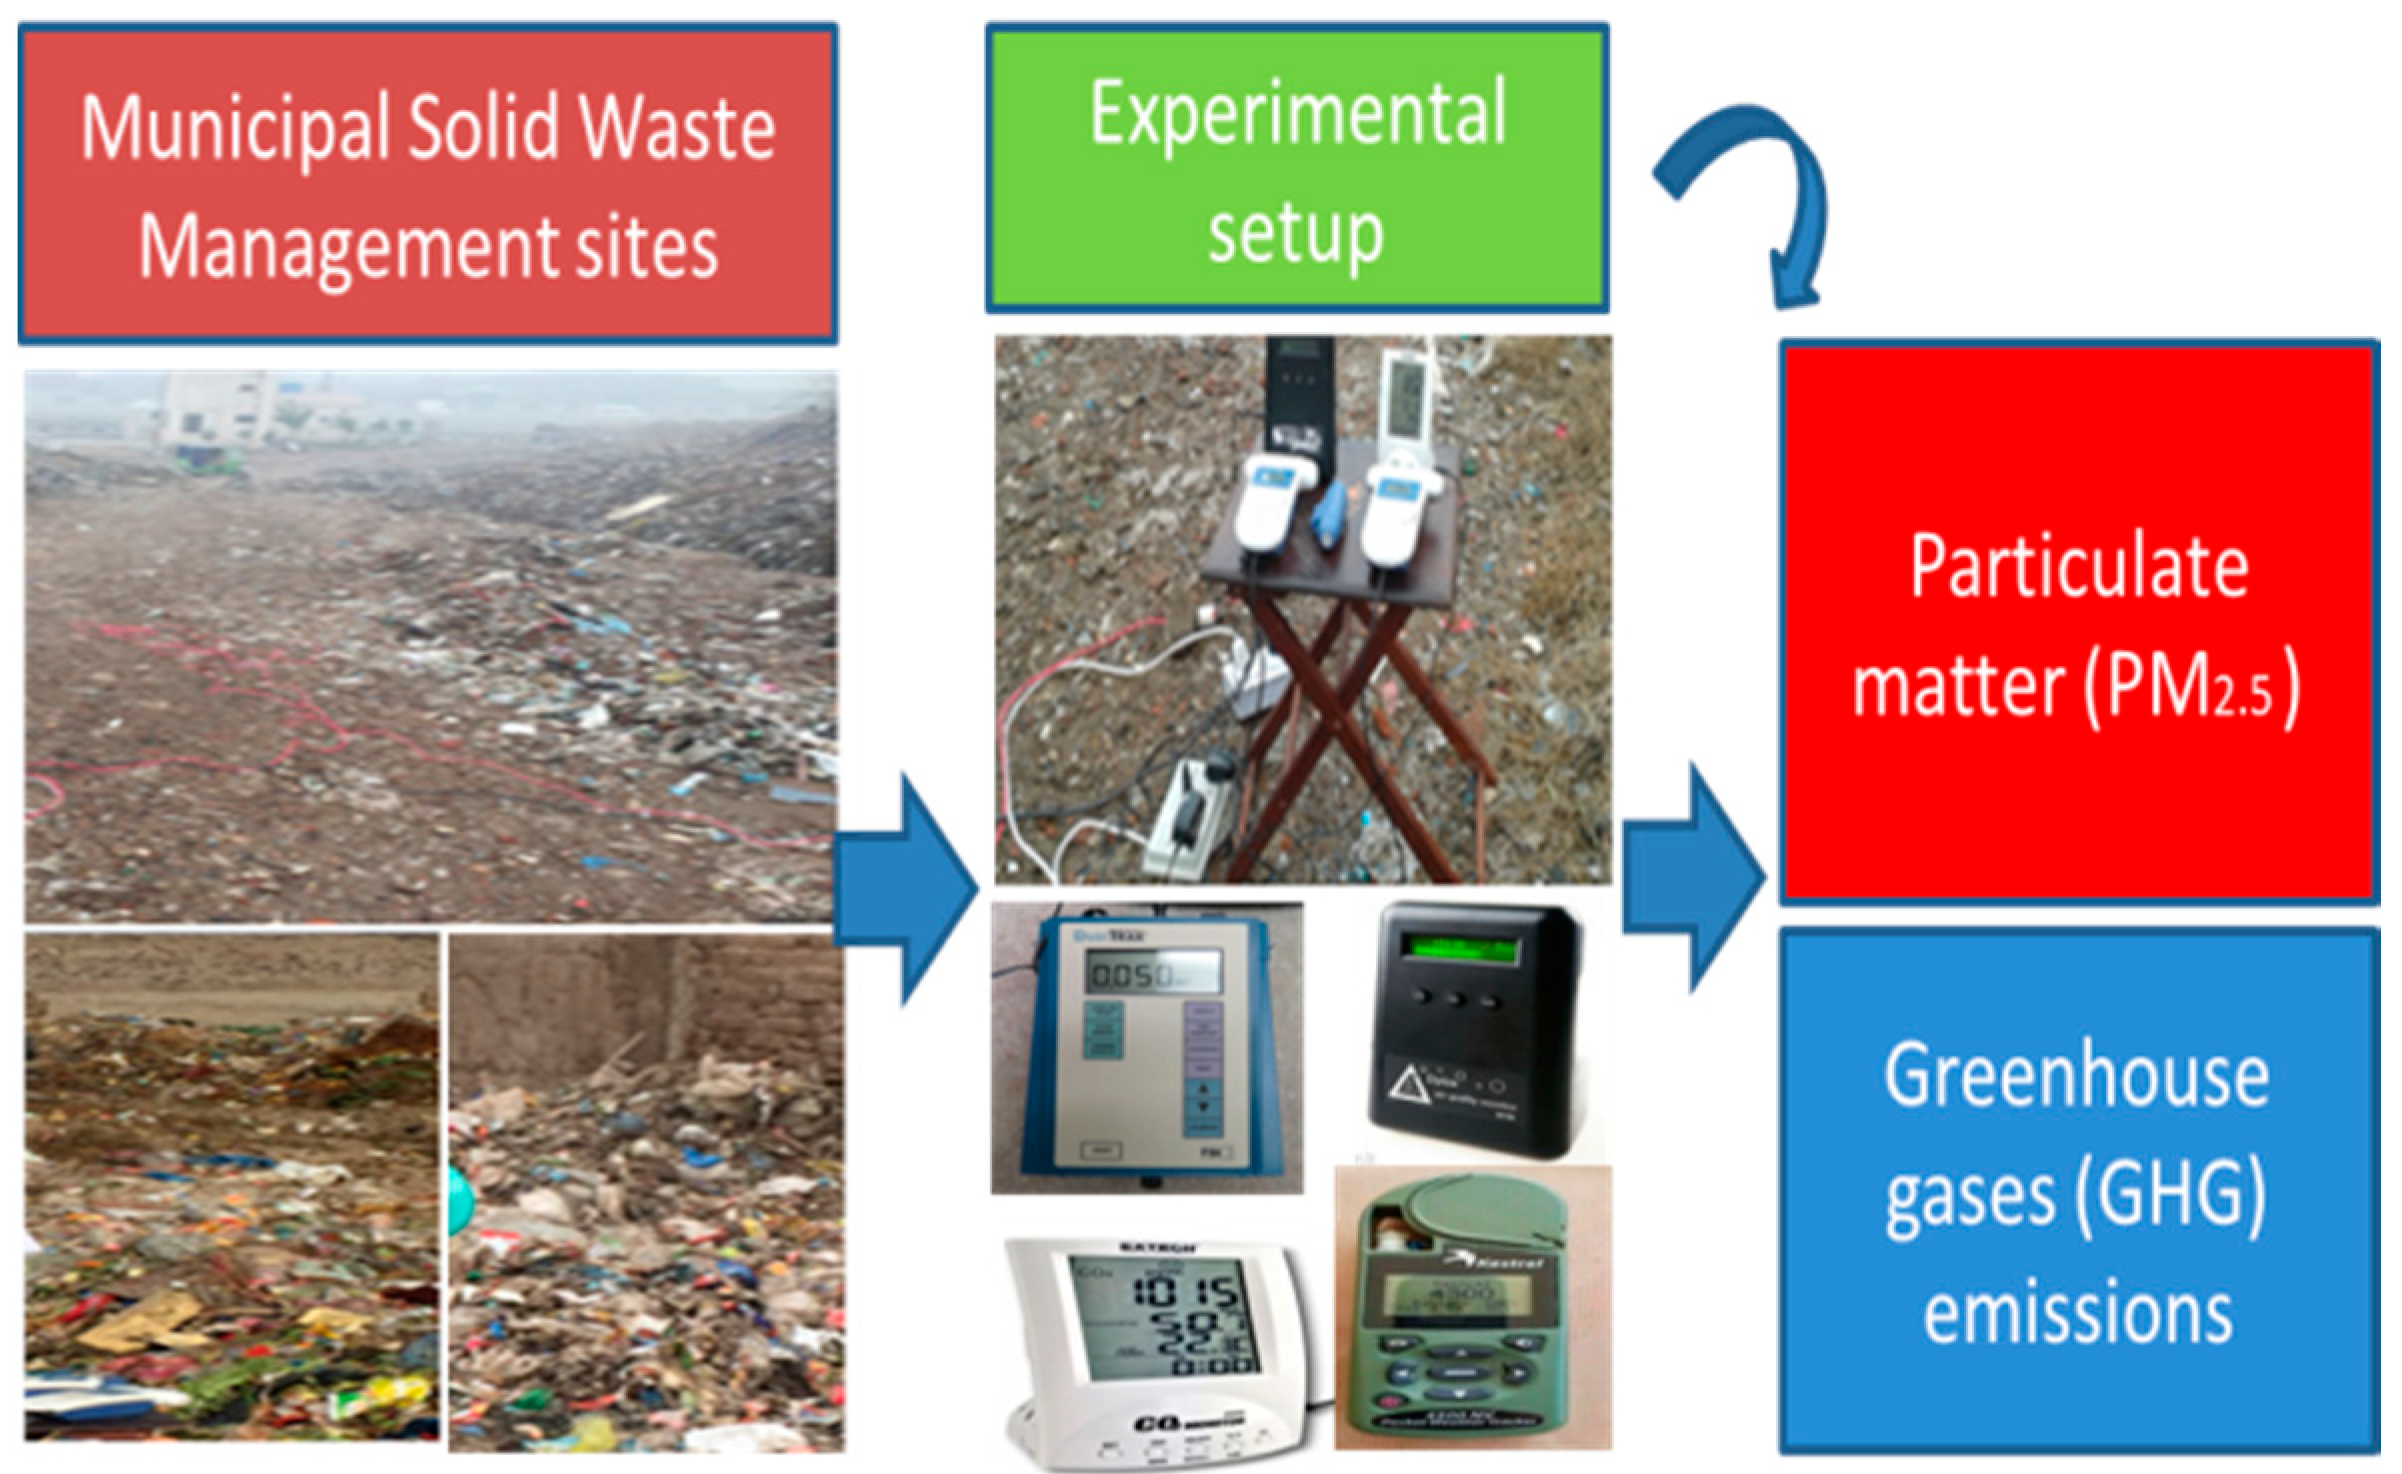
2.3. Instrumentation

The data was collected by using the instruments included, and Dylos (DC1700, Dylos Corporation, Riverside, CA, USA) and Aerosol Monitor TSI’s Dust Trak (Model 8520, TSI, Incorporated, Shoreview, MN, USA.) were used at source and downwind, respectively. Both devices were positioned at 1.5 m height above ground level. Two devices were used for the measurement of PM2.5. Therefore, the particle number concentration by Dylos (DC1700) was converted to mass concentration for the correct measurements by using a conversion sheet (www.fijnstofmeter.com/documentatie/Dylos-conversion.pdf (accessed on 3 December 2017). Furthermore, Dylos number concentration was corrected by functioning it parallel to the Dust Trak, and its calculated measurements were in sync with correction factors. CH4 and meteorological parameters, including humidity, temperature and wind speed, were measured by Aeroqual 500 series monitor, (Aeroqual Limited, New Zealand), with sensor head and Kestrel 4500 Pocket Weather Tracker, (Kestrel, Boothwyn, PA, USA). CO2 concentration was measured by Extech CO220 monitor, (Extech, Nashua, NH, USA). The whole apparatus was placed 2 m away from the source site. The conceptual experimental setup related to sites and instrumentation has been mentioned in Figure 2.

2.4. Statistical Analysis

Microsoft Excel and SPSS 22.0 (SPSS Inc., Chicago, IL, USA) was used for data processing. Mean values along with standard deviations (mean ± SD, n = 3) were calculated for parameters. Regression and correlation analysis was applied between PM2.5 and GHG, along with meteorological parameters at all sampling sites in wet and dry seasons.

3. Results

The mean levels of measured PM2.5 were between 127.1 and 286.6 µg/m3 and 172.3 and 343.4 µg/m3 at the source site and downwind, respectively, during wet season. The lowest and highest levels of PM2.5 at source and downwind were measured at SW2 and SW4 sites respectively. The mean levels of measured CO2 and CH4 were 443.4–509.8 ppm and 1.5–13.7 ppm. The lowest and highest levels of GHG were measured at SW3 and SW1 sites. Weather parameters including humidity, temperature and wind speed were 33–50%, 30–38 °C and 0.56–2.4 m/s during the wet season, respectively (Table 1).
During dry season, mean levels of measured PM2.5 were 201.5–307.1 µg/m3 and 265.3–403.8 µg/m3 at source and downwind, respectively. The lowest and highest levels of PM2.5 at source and downwind were measured at SW3 and SW2 sites, respectively. The mean levels of measured CO2 and CH4 were 461.7–515.7 ppm and 6.1–10.5 ppm. The lowest and highest levels of GHG were measured at SW3 and SW2. Weather parameters, including humidity, temperature and wind speed, were 24–50%, 28–39 °C and 0.8–1.34 m/s during dry season, respectively (Table 2).
It was observed that during the dry season, both at source and downwind PM2.5 concentration was higher at SW1 and SW2 (disposal sites) and lower at SW3 and SW4 (waste transfer stations), while CO2 concentration was higher at SW2 and SW3 and lower at SW1 and SW4 sites. CH4 was in higher concentration at all sampling sites during dry season, whereas wet season showed the reverse.
The measured levels of PM2.5 were higher (6–10 times) than established standards of Pak-EPA as 35 µg/m3, which may be due to various processes at SWM sites such as loading and unloading of waste materials, their sorting, movement of vehicles on roads and their exhaust, burning of waste, and dust release by wind. According to Pakistan SWM guidelines (2005), CH4 acceptable limit is 990.8 ppm. Our monitored levels of CH4 were lower than this limit. Our recorded CO2 concentration was also lower than the OHS (occupational health and safety) established standards of 1000 ppm. So, it was observed that the measured concentration of GHG in the ambient air of SWM sites was not harmful to human health.
Regression analysis was used to observe the correlation between PM2.5 and GHG, along with meteorological parameters, at all sampling sites. The concentration of PM2.5 is a dependent variable, and GHG and meteorological parameters are independent variables. The significant model indicated that variations in independent variables are correlated with alterations in dependent variables. The significant positive association showed their direct relationship as they were contributing to each other’s emission, whereas the negative relationship between pollutants showed their inverse association. SW3 and SW4 sites had a significant positive association between GHG with correlation coefficient (r = 0.745) and (r = 0.841 at p = 0.01), and SW3 showed a direct relationship between PM2.5 and CO2 with correlation coefficient (r) = 0.354 (p = 0.01) at 10% significance level. SW1 had an inverse association between PM2.5 and CH4 with correlation coefficient (r) = 0.510 at p = 0.05. Temperature showed a negative association with wind speed and humidity at SW2 site with correlation coefficient (r) = 0.714 and r = 0.769 at p = 0.05, while SW3 site also exhibited the similar negative association with correlation coefficient (r) = 0.440 (p = 0.05) and r = 0.975 (p = 0.01). Model summary of all sampling sites is shown in Table 3, which shows that SW1 explained 62% variation and was statistically significant. SW2 explained 40% variation and was statistically non-significant. SW3 explained 34% variation and was also statistically non-significant, while SW4 explained 76% variation and was statistically significant.
SW1, SW2 and SW4 sites showed a significant positive association between GHG and PM2.5. Moreover, GHG also contributed to the emission of each other at the same three sites. SW1 site showed a positive relationship between CO2, CH4 and PM2.5, with correlation coefficient (r) = 0.705 and r = 0.531 at p = 0.05. SW2 site also showed a positive correlation between CO2, CH4 and PM2.5, with correlation coefficient (r) = 0.669 and r = 0.572 at p = 0.05. Moreover, SW4 site exhibited a positive correlation between CO2 and CH4, with correlation coefficient (r) = 0.451 at p = 0.05. Temperature and humidity also exhibited an inverse relationship at all sampling sites during dry season, with correlation coefficient r = 0.822, r = 0.760, r = 0.795 and r = 0.751 at p = 0.01. Model summary of all sampling sites is shown in Table 3, which exhibited that SW1 and SW2 explained 64% and 74% variations, respectively, and were statistically significant. SW3 and SW4 explained 11% and 26% variations, respectively, and were statistically non-significant.

4. Discussion

Pollutants are emitted during various SWM processes such as loading and unloading of waste, sorting, vehicular movement, the emission of diesel truck exhaust, garbage burning and wind erosion. All these activities from production to waste management are main sources of the emission of GHG and various pollutants [27,28,29]. Waste characteristics, including its age, quantity and oxygen saturation, are the factors on which GHG production depends [15]. During the period of sampling, the measured mean levels of PM2.5 were 127.1–343.4 µg/m3 and are comparable to the study in Yenagoa (Nigeria), where different fractions of PM i.e., PM1.0, PM2.5, PM4.0, PM7.0 and PM10 were monitored at SWM sites and their concentrations were 14–289 µg/m3. Their measured levels were lower than the present results. Moreover, higher levels of PM were observed in the dry season than wet season. In the present study, increased levels of PM2.5 were recorded at SW1 and SW2 during dry season. Dry weather enhanced particulate movement due to the windy and dusty environment, while in wet conditions particles were isolated by moisture content [30]. It was also observed that PM2.5 concentration was decreased 50m away from the source (downwind). Comparison between source and downwind showed 29% increased PM2.5 concentration at downwind. Similar studies were also reported by other researchers at MSWM sites [27,31,32]. Air samples of two dumping sites in Chennai, India were characterized for air pollutants, and increased levels of PM2.5 such as 36 and 45 µg/m3 were recorded at both dumping sites as compared to background site 45 µg/m3. Likewise, both sites exhibited increased particulate concentration in summer season than monsoon [33]. In similar study, particulates emission was analyzed from an old dumping site in Chennai. It was observed that average concentration of PM2.5 at 0.6 km away from dumping site was 46, 53 and 72 µg/m3 during summer, monsoon and winter, respectively. These measured levels were lower than the present research outcomes [34]. The elevated levels of PM2.5 in the current study raise concern that inhalation of PM2.5 from SWM sites can cause pulmonary diseases, cardiovascular disorders, gastrointestinal infections and allergic and musculoskeletal diseases among the workers and populations living within facilities of such MSWM sites. Fine particles penetrate deeper into lungs in the form of liquid droplets and cause severe health problems by fixing several biological functions [35,36,37].
Organic components in the waste material are decomposed by microbial activity and GHG are released [38]. So, the SWM sites are considered to be major sources of CO2 and CH4 emissions. CH4 is a major component of GHG and has 25 times more global warming potential than CO2 [20,39]. A study was made to assess the air quality of solid waste dumping sites in Nigeria where fires occurred. The measured levels of CO2 and CH4 were 401–405 ppm and 2310–2771ppm, respectively [16]. In a similar study at Rumuolumeni Port Harcourt (Nigeria), CH4 concentration was 0.16–0.21 ppm at two different locations in a disposal site and was lower than our measured concentration [40]. Contrary to our results in Nigeria, another study was made at dumping site of Ubakala, Umuahia, while in the dry season the mean concentration of particulate matter at dumping site was 74.9 µg/m3, and 3.6 km away it was 23 µg/m3. In wet season, the mean concentration of particulate matter at dumping site was 64 µg/m3, and 3.6 km away it was 20 µg/m3. In the wet and dry seasons, mean concentration of particulate matter was 30 µg/m3 and 35 µg/m3, respectively, whereas CH4 concentration was 0.01–0.06 ppm and 0.01–0.1 ppm in wet and dry seasons and not comparable to our results [25].
In this study, a positive correlation was observed between CO2 and CH4 and comparable to the findings of previous studies [41,42]. China was made to compare the emission of gases from disposal site in Wuhan city, and these results are also comparable to our findings. An excellent correlation was observed between CO2 and CH4 at two different locations [43]. Not so much work has been done on the correlation analysis of PM2.5 and GHG within facilities of SWM sites. In our study, the correlation matrix exhibited that PM2.5 and GHG were correlated significantly. A negative relationship was observed between PM2.5 and CO2 at the SW4 site during dry season, while a significant positive association was observed at SW1 and SW2 sites (during dry season) and SW3 (during wet season). Research was conducted in Estonia, Northern Europe to measure the levels of PM, CO2 and NH3 in un-insulated cowsheds. A strong positive correlation was observed between PM and CO2, and manure and feed were the major sources of organic material and caused the emission of GHG [44]. Combustion processes and exhaust of vehicles were also sources of pollutants release at SWM site. Another study was conducted in Korea, and the levels of PM and CO2 were examined on the inside and platforms of trains, exhibiting correlation matrix between PM and CO2 [45].
In the current study, CH4 showed a positive as well as negative association with humidity. SW1 in dry season and SW3 in both seasons showed positive correlation, while SW1 in wet season exhibited negative association with humidity. The emission of gases and humidity must be measured corresponding to aerobic and anaerobic conditions depending upon the depth of the waste. Oxygen contents were reduced as a result of increased dampness, producing an expanded outflow of CH4 as proposed [46]. A negative correlation was also observed between humidity and temperature, and similarly temperature could have affected the humidity. Such impacts are in accordance with the research done [47]. A number of studies are also available to observe the impact of meteorological parameters on the fate of noxious gases in ambient air [40,48]. The current evaluations showed calmness of wind speed in dry season is in line with other studies [49]. An increase in temperature during dry season increases the mobility of PM due to dusty air, thus causing increased levels of PM. From our observations, the MSWM sites had a significant impact on the ambient air quality due to their various management processes.

5. Conclusions

The current study provides a better understanding of the increased levels of PM2.5 than Pak-EPA established standards at MSWM sites. An increase in the concentration of PM2.5 was observed downwind rather than at the source site. Seasonal variation showed increased levels of PM2.5 in the dry season compared to the wet season. Meteorological conditions also showed an impact on the concentration of PM and GHG, but no particular trend was noticed at MSWM sites. In spite of the small sample size, the current study provides pilot information about the air quality of MSWM sites. The present study revealed that there is a need to focus on air quality management for such sites to safeguard public health and that further research is required to measure the ambient air quality of MSWM sites and their health hazards. So, the implementation of policies is essential to manage the levels of pollutants in the ambient air of MSWM sites and to reduce its effect on health and climate.

Author Contributions

Conceptualization, writing, data curation and original draft preparation, S.T.R.; writing, data curation and original draft preparation, S.H.; supervision, reviewing and editing, Z.A.; data curation, reviewing and editing, Z.A.N.; visualization and investigation Z.A.N.; review and editing M.M.B.; review and editing I.S.; review and editing J.W.; review and editing Z.C.; review and editing Y.X. All authors have read and agreed to the published version of the manuscript.

Funding

This research was funded by the Yunnan Key Laboratory of Plant Reproductive Adaptation and Evolutionary Ecology, Yunnan University (No. C176210103).

Institutional Review Board Statement

Not applicable.

Informed Consent Statement

Not applicable.

Data Availability Statement

Not applicable.

Acknowledgments

We are thankful for joint cooperation between University of the Punjab, Lahore, Pakistan; Yunnan University, Kunming, China; and China Postdoctoral System.

Conflicts of Interest

The authors declare no conflict of interest.

References

  1. Chatterjee, R. Municipal solid waste management in Kohima city-india. Iran. J. Environ. Health Sci. Eng. 2010, 7, 173–180. [Google Scholar]
  2. ISWA–Global Assessment of Municipal Organic Waste Production and Recycling. 2020. Available online: https://www.altereko.it/wp-content/uploads/2020/03/Report-1-Global-Assessment-of-Municipal-Organic-Waste.pdf (accessed on 9 December 2020).
  3. Angaye, T.C.; Daokoru-Olukole, C.; Abowei, J.F. Environmental Impacts of Municipal Solid Wastes in Yenagoa M tropolis, Bayelsa State, Nigeria. Biotechnol. Res. 2018, 4, 17–23. [Google Scholar]
  4. Ramachandra, T.V. Integrated management of municipal solid waste. In Environmental Security: Human & Animal Health; IBDC Publisher: Lucknow, India, 2011; pp. 465–484. [Google Scholar]
  5. Ramachandra, T.V.; Aithal, B.H.; Sanna, D.D. Insights to urban dynamics through landscape spatial pattern analysis. Int. J. Appl. Earth Obs. Geoinf. 2012, 18, 329–343. [Google Scholar]
  6. Wang, Y.; Levis, W.J.; Barlaz, M.A. Development of streamlined life-cycle assessment for the solid waste management system. Environ. Sci. Technol. 2021, 55, 5475–5484. [Google Scholar] [CrossRef] [PubMed]
  7. Mavropoulos, A.; Newman, D.; International Solid Waste Association. Wasted Health—The Tragic Case of Dumpsites. Available online: https://www.eawag.ch/fileadmin/Domain1/Abteilungen/sandec/E-Learning/Moocs/Solid_Waste/W1/tragic_case_dumpsites_2015.pdf (accessed on 3 September 2021).
  8. Wang, C.; Cai, J.; Chen, R.; Shi, J.; Yang, C.; Li, H.; Xia, Y. Personal exposure to fine particulate matter, lung function and serum club cell secretory protein (Clara). Environ. Pollut. 2017, 225, 450–455. [Google Scholar] [CrossRef] [PubMed] [Green Version]
  9. Ramachandra, T.V.; Aithal, B.H.; Sreejith, K. GHG footprint of major cities in India. Renew. Sustain. Energy Rev. 2015, 44, 473–495. [Google Scholar] [CrossRef]
  10. Nejat, P.; Hussen, H.M.; Fadli, F.; Chaudhry, H.N.; Calautit, J.; Jomehzadeh, F. Indoor Environmental Quality (IEQ) Analysis of a Two-Sided Windcatcher Integrated with Anti-Short-Circuit Device for Low Wind Conditions. Processes 2020, 8, 840. [Google Scholar] [CrossRef]
  11. Pires da Mata Costa, L.; Micheline Vaz de Miranda, D.; Couto de Oliveira, A.C.; Falcon, L.; Stella Silva Pimenta, M.; Guilherme Bessa, I.; Juarez Wouters, S.; Andrade, M.H.S.; Pinto, J.C. Capture and Reuse of Carbon Dioxide (CO2) for a Plastics Circular Economy: A Review. Processes 2021, 9, 759. [Google Scholar] [CrossRef]
  12. Bogner, J.; Pipatti, R.; Hashimoto, S.; Diaz, C.; Mareckova, K.; Diaz, L.; Kjeldsen, P.; Monni, S.; Faaij, A.; Gao, Q.; et al. Mitigation of global greenhouse gas emissions from waste: Conclusions and strategies from the Intergovernmental Panel on Climate Change (IPCC) Fourth Assessment Report. Working Group III (Mitigation). Waste Manag. Res. 2008, 26, 11–32. [Google Scholar] [CrossRef]
  13. Abushammala, M.F.; Basri, N.E.; Kadhum, A.A. Review on landfill gas emission to the atmosphere. Eur. J. Sci. Res. 2009, 30, 427–436. [Google Scholar]
  14. Hegde, U.; Chang, T.C.; Yang, S.S. Methane and carbon dioxide emissions from ShanChu-Ku landfill site in northern Taiwan. Chemosphere 2003, 52, 1275–1285. [Google Scholar] [CrossRef]
  15. Jha, A.K.; Sharma, C.; Singh, N.; Ramesh, R.; Purvaja, R.; Gupta, P.K. Greenhouse gas emissions from municipal solid waste management in Indian mega-cities: A case study of Chennai landfill sites. Chemosphere 2008, 71, 750–758. [Google Scholar] [CrossRef] [PubMed]
  16. Rim-Rukeh, A. An assessment of the contribution of municipal solid waste dump sites fire to atmospheric pollution. Open J. Air Pollut. 2014, 3, 53. [Google Scholar] [CrossRef] [Green Version]
  17. Dalasile, M.; Reddy, P. Respiratory health risks and exposure to particulate matter (PM2.5) among informal waste pickers at a landfill site in Durban, South Africa. Afr. J. Phys. Act. Health Sci. 2017, 23, 45–58. [Google Scholar]
  18. Karar, K.; Gupta, A.K.; Kumar, A.; Biswas, A.K. Seasonal variations of PM 10 and TSP in residential and industrial sites in an urban area of Kolkata, India. Environ. Monit. Assess. 2006, 118, 369–381. [Google Scholar] [CrossRef]
  19. Fang, G.C.; Wu, Y.S.; Wen, C.C.; Lee, W.J.; Chang, S.Y. Influence of meteorological parameters on particulates and atmospheric pollutants at Taichung harbor sampling site. Environ. Monit. Assess. 2007, 128, 259–275. [Google Scholar] [CrossRef]
  20. Abushammala, M.F.; Basri, N.E.A.; Younes, M.K. Seasonal variation of landfill methane and carbon dioxide emissions in a tropical climate. Int. J. Environ. Sci. Dev. 2016, 7, 586. [Google Scholar] [CrossRef] [Green Version]
  21. Chikezie, P.O.; Nwankwor, G.I.; Ahiarakwem, C.A. Analysis and Evaluation of Pollution Potentials of Gaseous Emissions from a Waste Dumpsite in Ubakala, Umuahia Southeastern Nigeria. Int. J. Geogr. Environ. Manag. 2019, 5, 2. [Google Scholar]
  22. Peter, A.E.; Nagendra, S.S. Dynamics of PM 2.5 pollution in the vicinity of the old municipal solid waste dumpsite. Environ. Monit. Assess. 2021, 193, 1–16. [Google Scholar] [CrossRef]
  23. Mahmood, S.; Sharif, F.; Rahman, A.U.; Khan, A.U. Analysis and forecasting of municipal solid waste in Nankana City using geo-spatial techniques. Environ. Monit. Assess. 2018, 190, 275. [Google Scholar] [CrossRef]
  24. LWMC (Lahore Waste Management Company). Progress Report of LWMC 2011–12; LWMC: Lahore, Pakistan, 2012. [Google Scholar]
  25. Ashraf, U.; Hameed, I.; Chaudhary, M.N. Solid waste management practices under public and private sector in Lahore, Pakistan. Bull. Environ. Stud. 2016, 1, 98–105. [Google Scholar]
  26. Batool, S.A.; Chaudhary, M.N. Municipal solid waste management in Lahore city district, Pakistan. Waste Manag. 2009, 29, 1971–1981. [Google Scholar] [CrossRef]
  27. Chalvatzaki, E.; Kopanakis, I.; Kontaksakis, M.; Glytsos, T.; Kalogerakis, N.; Lazaridis, M. Measurements of particulate matter concentrations at a landfill site (Crete, Greece). Waste Manag. 2010, 30, 2058–2064. [Google Scholar] [CrossRef]
  28. Pathak, V.; Kushwaha, B.P. Study on ambient air quality of municipal solid waste dumping site district Satna (MP). India. J. Ecophysiol. Occup. Health 2012, 12, 35. [Google Scholar]
  29. Yang, D.; Xu, L.; Gao, X.; Guo, Q.; Huang, N. Inventories and reduction scenarios of urban waste-related greenhouse gas emissions for management potential science of the total environment inventories and reduction scenarios of urban waste-related greenhouse gas emissions for management potential. Sci. Total Environ. 2018, 626, 727–736. [Google Scholar] [CrossRef]
  30. Angaye, T.C.; Abowei, J.F.N. Evaluation of suspended particulate matter (SPM) around municipal solid waste dumpsites in yenagoa metropolis, Nigeria. MOJ Toxicol. 2018, 4, 54–57. [Google Scholar] [CrossRef] [Green Version]
  31. Ezekwe, C.I.; Agbakoba, A.; Igbagara, P.W. Source gas emission and ambient air quality around the eneka co-disposal landfill in Port Harcourt, Nigeria. Int. J. Appl. Chem. Ind. Sci. 2016, 2, 11–23. [Google Scholar]
  32. Ezekwe, I.C.; Arokoyu, S.B. Landfill Emissions and their Urban Planning and Environmental Health Implications in Port Harcourt, South-South Nigeria. Dev. Environ. 2017, 42, 224–241. [Google Scholar] [CrossRef] [Green Version]
  33. Karthikeyan, O.P.; Murugesan, S.; Joseph, K.; Philip, L. Characterization of Particulate Matters and Volatile Organic Compounds in the Ambient Environment of Open Dump Sites. Univers. J. Environ. Res. Tech. 2011, 1, 140–150. [Google Scholar]
  34. Peter, A.E.; Nagendra, S.S.; Nambi, I.M. Comprehensive analysis of inhalable toxic particulate emissions from an old municipal solid waste dumpsite and neighborhood health risks. Atmos Pollut. Res. 2018, 9, 1021–1031. [Google Scholar] [CrossRef]
  35. Njoku, P.O.; Edokpayi, J.N.; Odiyo, J.O. Health and environmental risks of residents living close to a landfill: A case study of Thohoyandou Landfill, Limpopo Province, South Africa. Int. J. Environ. Res. Public Health 2019, 16, 2125. [Google Scholar] [CrossRef] [Green Version]
  36. Nandimath, P.T.; Rao, N.S.N.; Subramaniyan, U.; Mishra, B.; Kalidindi, B.R.; Shrivastava, R.; Panta, S.; Pavan Kumar, H.V. Knowledge and Practices of Municipal Solid Waste Workers: Findings from Focused Group Discussions. In Waste Management and Resource Efficiency; Springer: Singapore, 2019; pp. 287–298. [Google Scholar]
  37. Falcon-Rodriguez, C.I.; Osornio-Vargas, A.R.; Sada-Ovalle, I.; Segura-Medina, P. Aeroparticles, composition, and lung diseases. Front. Immunol. 2016, 7, 3. [Google Scholar] [CrossRef] [PubMed] [Green Version]
  38. Lou, X.F.; Nair, J. The impact of landfilling and composting on greenhouse gas emissions—A review. Bioresour Technol. 2009, 100, 3792–3798. [Google Scholar] [CrossRef] [PubMed]
  39. Kumar, S.; Gaikwad, S.A.; Shekdar, A.V.; Kshirsagar, P.S.; Singh, R.N. Estimation method for national methane emission from solid waste landfills. Atmos. Environ. 2004, 38, 3481–3487. [Google Scholar] [CrossRef]
  40. Weli, V.E.; Adekunle, O. Air quality in the vicinity of a landfill site in Rumuolumeni, Port Harcourt, Nigeria. J. Environ. Earth Sci. 2014, 4, 1–9. [Google Scholar]
  41. Uyanik, İ.; Özkaya, B.; Demir, S.; Çakmakci, M. Meteorological parameters as an important factor on the energy recovery of landfill gas in landfills. J. Renew. Sustain. Energy 2012, 4, 063135. [Google Scholar] [CrossRef]
  42. Niskanen, A.; Värri, H.; Havukainen, J.; Uusitalo, V.; Horttanainen, M. Enhancing landfill gas recovery. J. Clean. Prod. 2013, 55, 67–71. [Google Scholar] [CrossRef]
  43. Yang, L.; Chen, Z.; Zhang, X.; Liu, Y.; Xie, Y. Comparison study of landfill gas emissions from subtropical landfill with various phases: A case study in Wuhan, China. J. Air Waste Manag. Assoc. 2015, 65, 980–986. [Google Scholar] [CrossRef]
  44. Kaasik, A.; Maasikmets, M. Concentrations of airborne particulate matter, ammonia and carbon dioxide in large scale uninsulated loose housing cowsheds in Estonia. Biosyst. Eng. 2013, 114, 223–231. [Google Scholar] [CrossRef]
  45. Park, D.U.; Ha, K.C. Characteristics of PM10, PM2.5, CO2 and CO monitored in interiors and platforms of subway train in Seoul, Korea. Environ. Int. 2008, 34, 629–634. [Google Scholar] [CrossRef]
  46. Barlaz, M.A.; Green, R.B.; Chanton, J.P.; Goldsmith, C.D.; Hater, G.R. Evaluation of a biologically active cover for mitigation of landfill gas emissions. Environ. Sci. Technol. 2004, 38, 4891–4899. [Google Scholar] [CrossRef] [PubMed]
  47. Uba, S. Environmental Impact Assessment of Dumpsites in Zaria Metropolis, Kaduna State, Nigeria. Master’s Thesis, Ahmadu bello University, Zaria, Nigeria, 2015. [Google Scholar]
  48. Pillay, B.; Zunckel, M.; Shongwe, B.; Oosthuizen, R. Air Quality Impact Assessment for the Proposed Upgrade of the Kwadukuza Landfill Site; Report, No. uMN002-09; uMoya-NILU Consulting (Pty) Ltd.: Florida, FL, USA, 2011; p. 121. [Google Scholar]
  49. Ogba, C.O.; Utang, P.B. Air Pollution Climatology in Spatial Planning for Sustainable Development in the Niger Delta, Nigeria. In Proceedings of the FIG Working Week 2009 Surveyor’s Key Role in Accelerated Development, Eilat, Israel, 3–8 May 2009. [Google Scholar]
Figure 1. A map of sampling locations in Lahore.
Processes 09 01604 g001
Figure 2. The conceptual diagram of experimental setup.
Processes 09 01604 g002
Table 1. Ambient air quality parameters at sampling sites (SW1, SW2, SW3 and SW4) during wet season along with GHG and meteorological parameters (mean ± SD, n = 3).
ParametersSW1SW2SW3SW4
Fine Particulate Matter (µg/m3)----
PM2.5 (source)166.2 ± 1.1127.1 ± 0.9261.1 ± 0.8286.6 ± 0.8
PM2.5 (50m downwind)231.5 ± 0.9172.3 ± 0.9325.6 ± 0.9343.4 ± 0.9
GHG (ppm)----
CO2509.8 ± 1.1469.8 ± 0.7443.4 ± 1.348.5 ± 1.3
CH413.7 ± 0.25.5 ± 0.41.5 ± 0.42.9 ± 0.1
Meteorological----
Humidity (%)36.6 ± 1.448.6 ± 0.932.8 ± 1.450.4 ± 1.9
Temperature (°C)38 ± 1.332 ± 1.436 ± 1.230 ± 0.8
Wind speed (m/s)2.2 ± 0.72.4 ± 0.91.7 ± 0.70.56 ± 0.3
Four sites during study: Lakhodair and Mehmood Booti disposal sites (SW1, SW2) and Valencia town and Saghian bridge transfer stations (SW3, SW4).
Table 2. Ambient air quality parameters at sampling sites (SW1, SW2, SW3 and SW4) during dry season along with GHG and meteorological parameters (mean ± SD, n = 3).
ParametersSW1SW2SW3SW4
Fine Particulate Matter (µg/m3)----
PM2.5 (source)250.3 ± 2.1307.1 ± 1.1201.5 ± 0.8261 ± 0.8
PM2.5 (50m downwind)316.4 ± 1.8403.8 ± 1.1265.3 ± 0.8325.7 ± 0.9
GHG (ppm)----
CO2494.4 ± 5.5515.7 ± 1.1461.7 ± 1.6476.3 ± 1.0
CH410.3 ± 0.610.5 ± 0.46.1 ± 0.76.8 ± 0.2
Meteorological----
Humidity (%)24 ± 1.050 ± 1.237 ± 1.246 ± 1.1
Temperature (°C)35 ± 1.728 ± 0.839 ± 1.235 ± 1.5
Wind speed (m/s)1.34 ± 0.71.01 ± 0.40.8 ± 0.20.87 ± 0.4
Four sites during study: Lakhodair and Mehmood Booti disposal sites (SW1, SW2) and Valencia town and Saghian bridge transfer stations (SW3, SW4).
Table 3. Regression and correlation statistics between PM2.5 (source site) and GHG along with meteorological parameters using significance level in wet season.
SitesCorrelation Coefficientr2Coefficient of Determination (%)
Wet season
SW10.7900.62562 *
SW20.6320.40040
SW30.5890.34634
SW40.8770.76976 *
Dry season
SW10.8030.64464 *
SW20.8630.74574 *
SW30.3360.11311
SW40.5110.26126
Four sites during study: Lakhodair and Mehmood Booti disposal sites (SW1, SW2) and Valencia town and Saghian bridge transfer stations (SW3, SW4), respectively. The letter * indicates significant values.
Publisher’s Note: MDPI stays neutral with regard to jurisdictional claims in published maps and institutional affiliations.

