
Multi-Excitation Infrared Fusion for Impact Evaluation of Aluminium-BFRP/GFRP Hybrid Composites

 ,
,  ,
,  ,
, 

 and
and 
Abstract
:1. Introduction
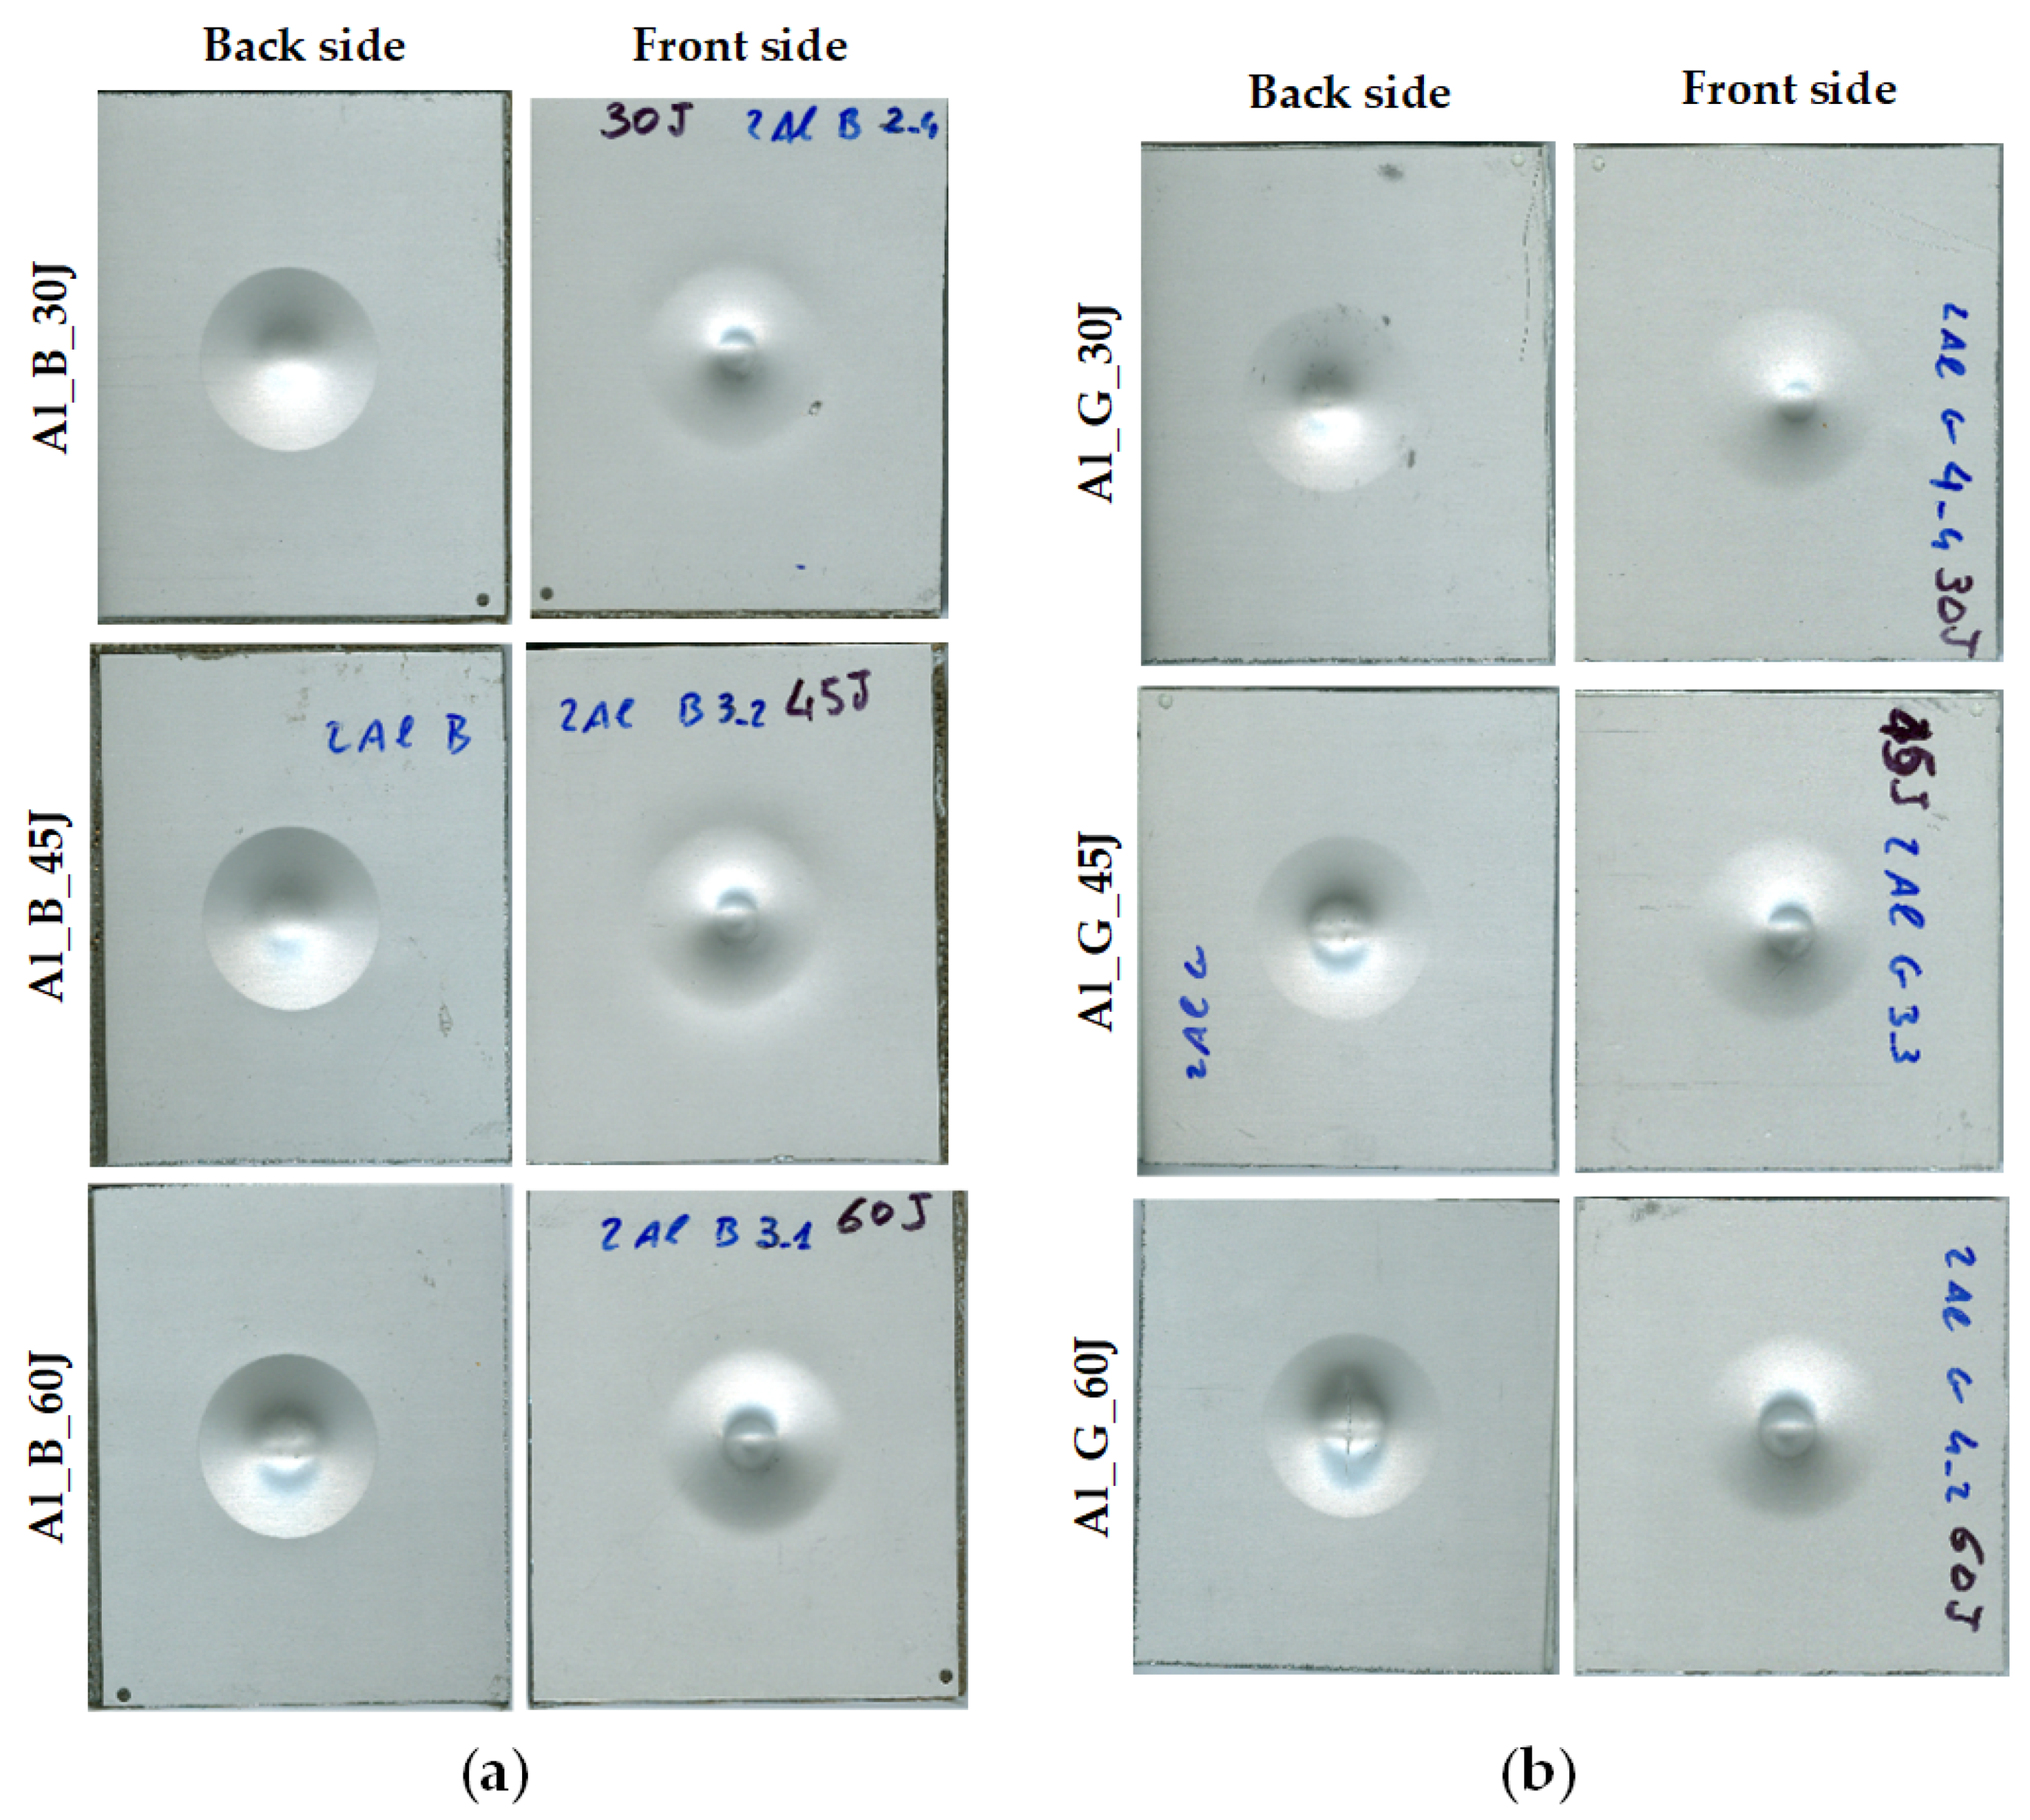
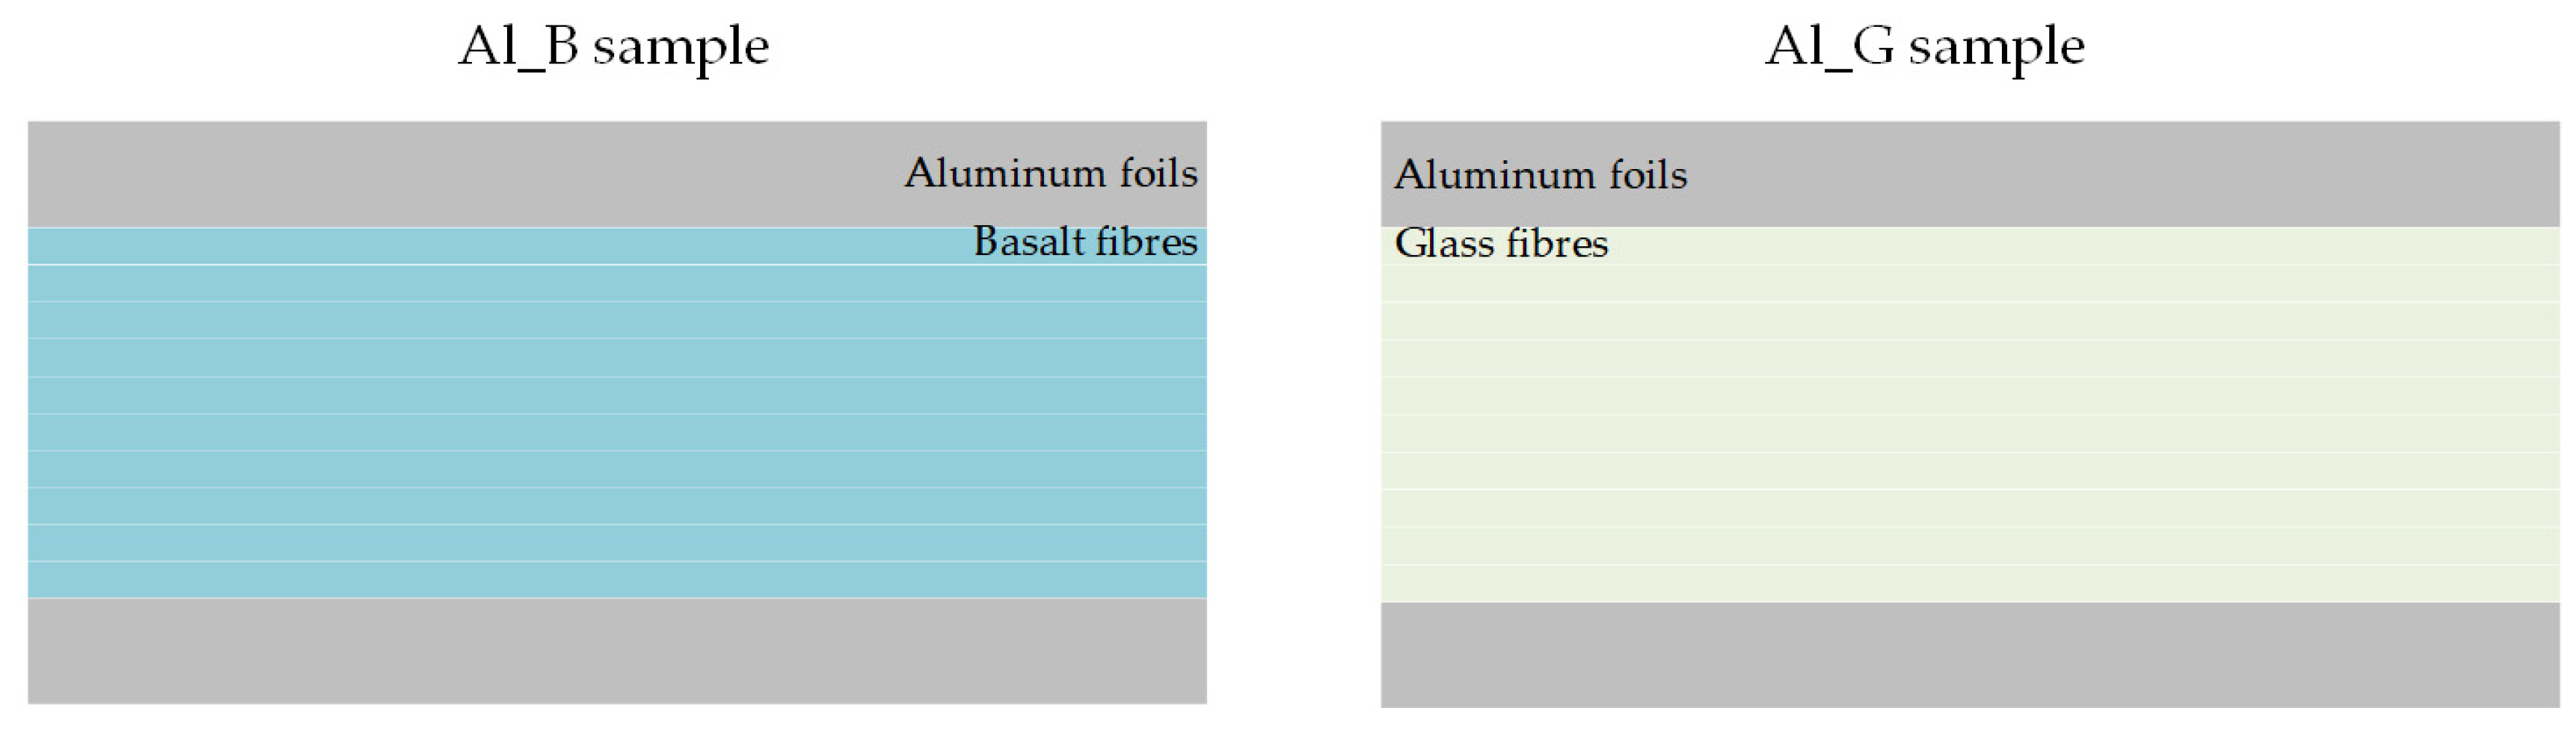
2. Specimens
3. Methodology
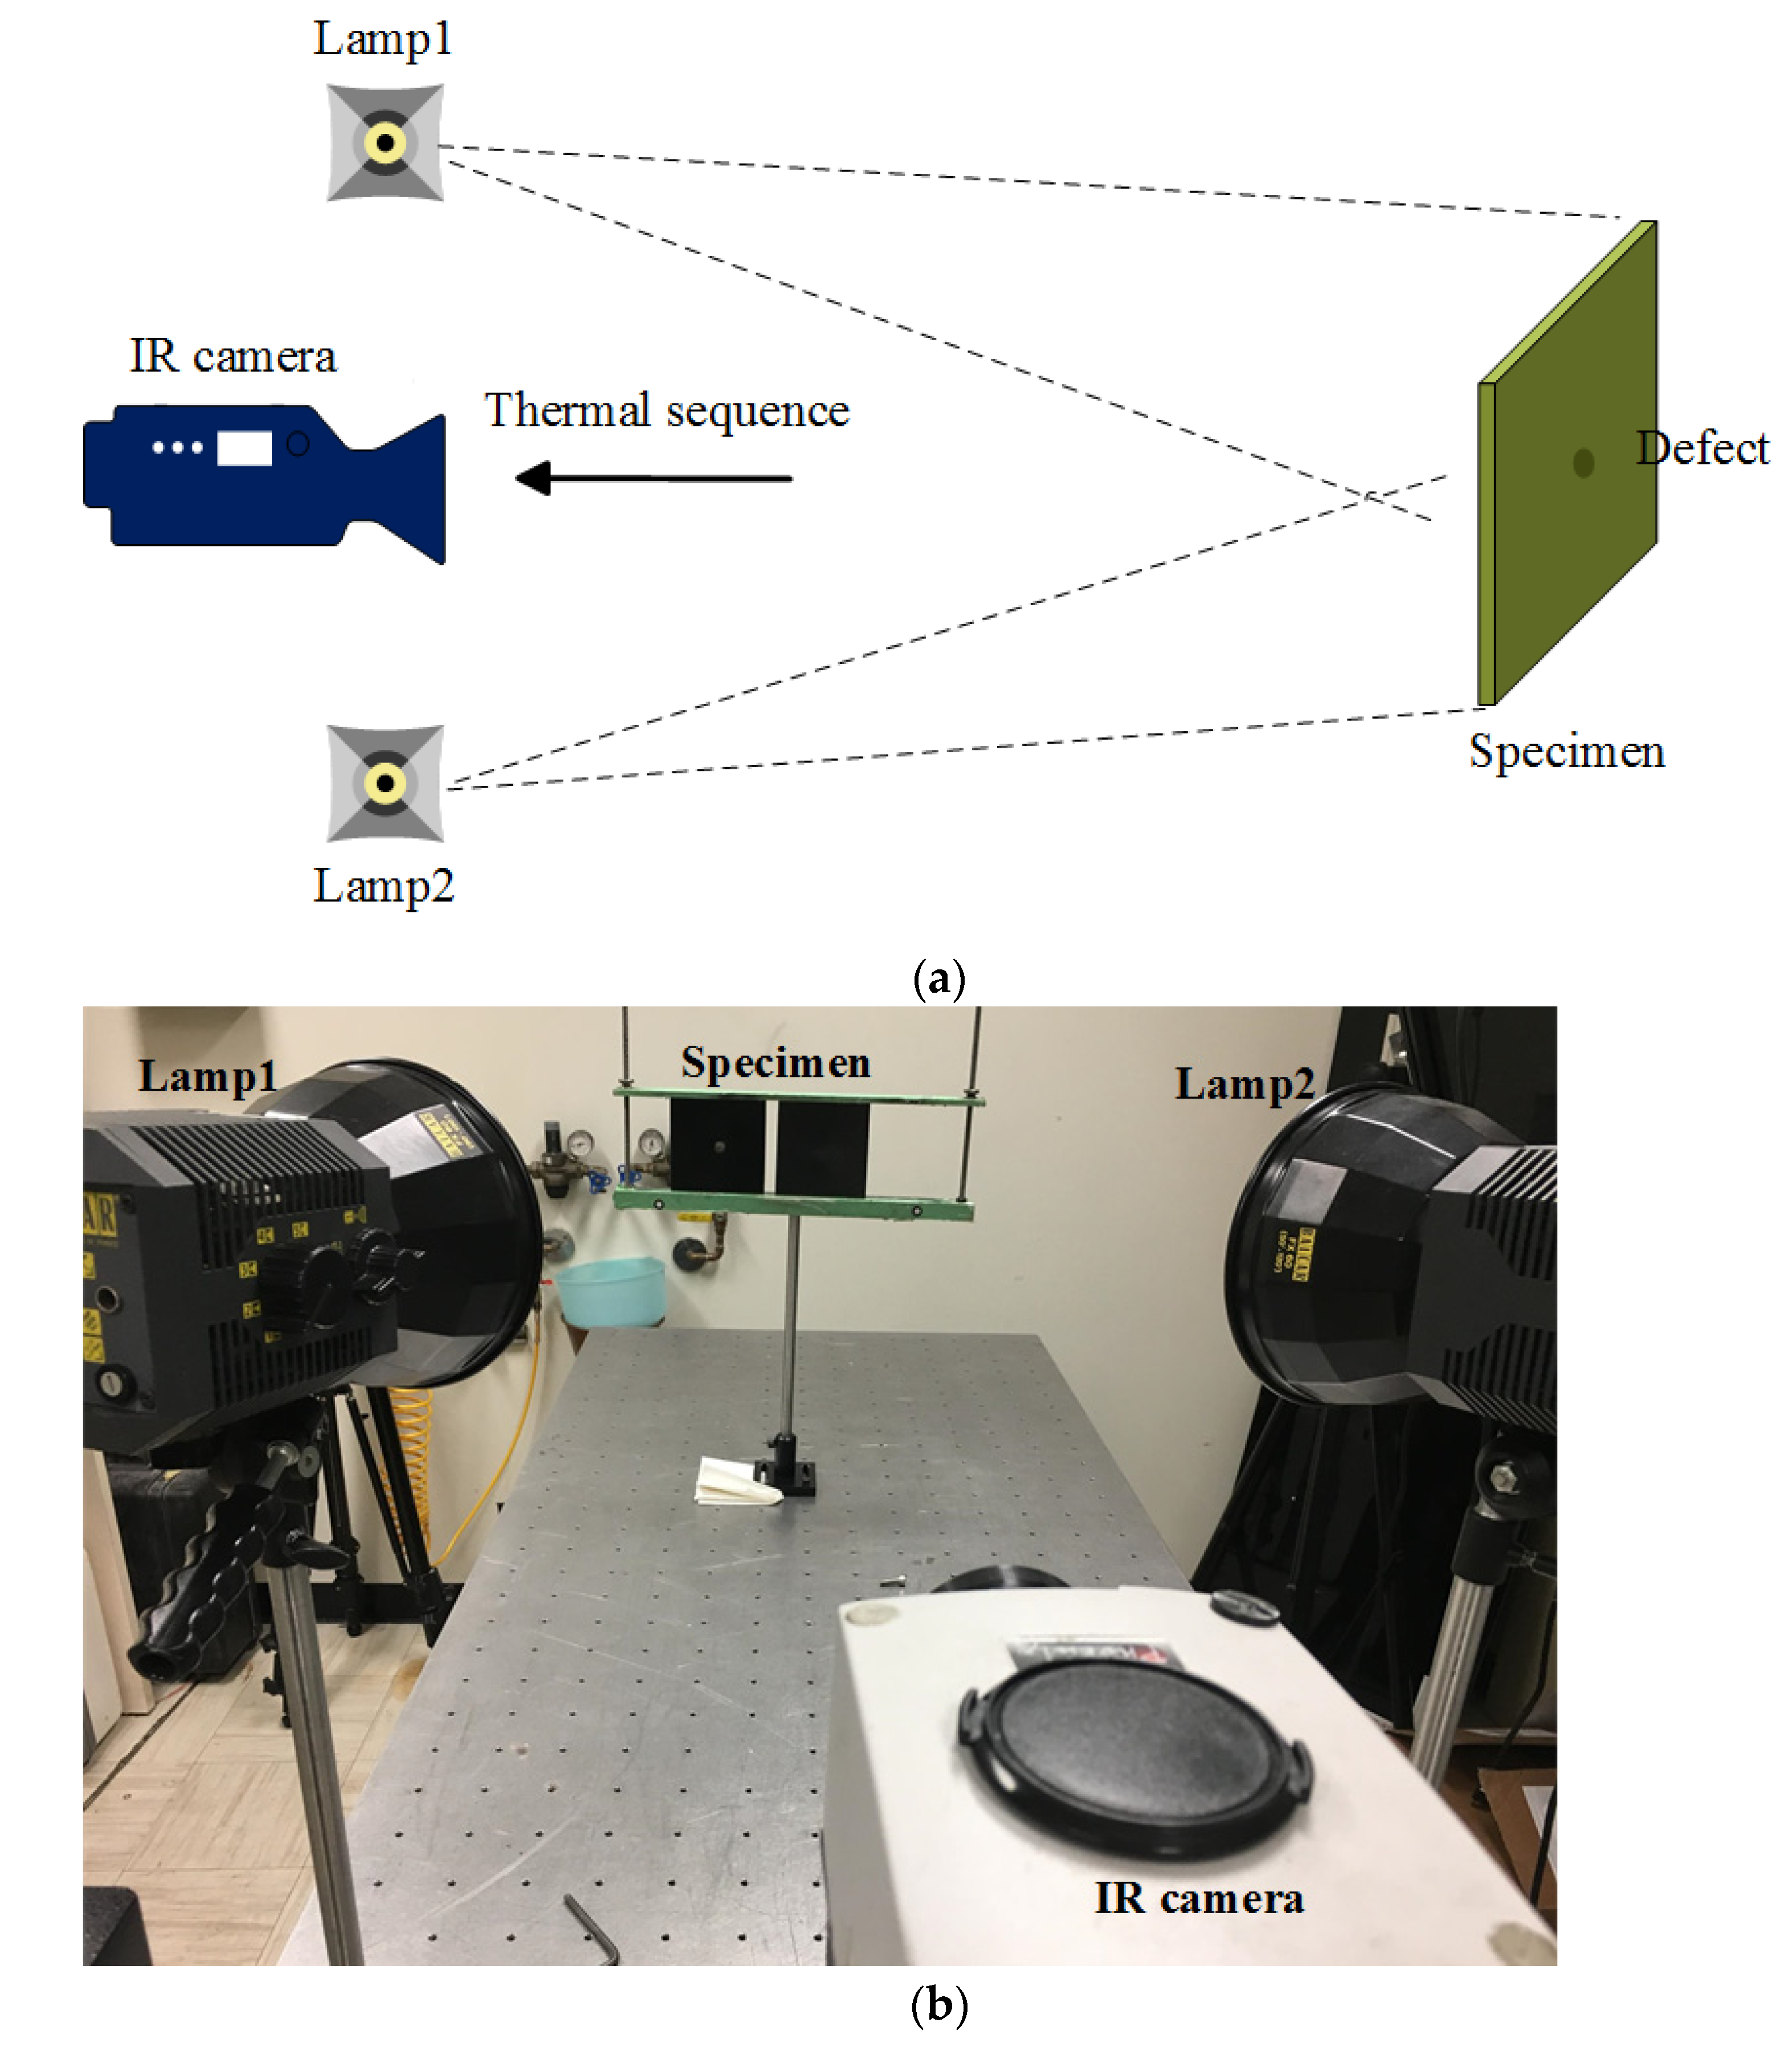
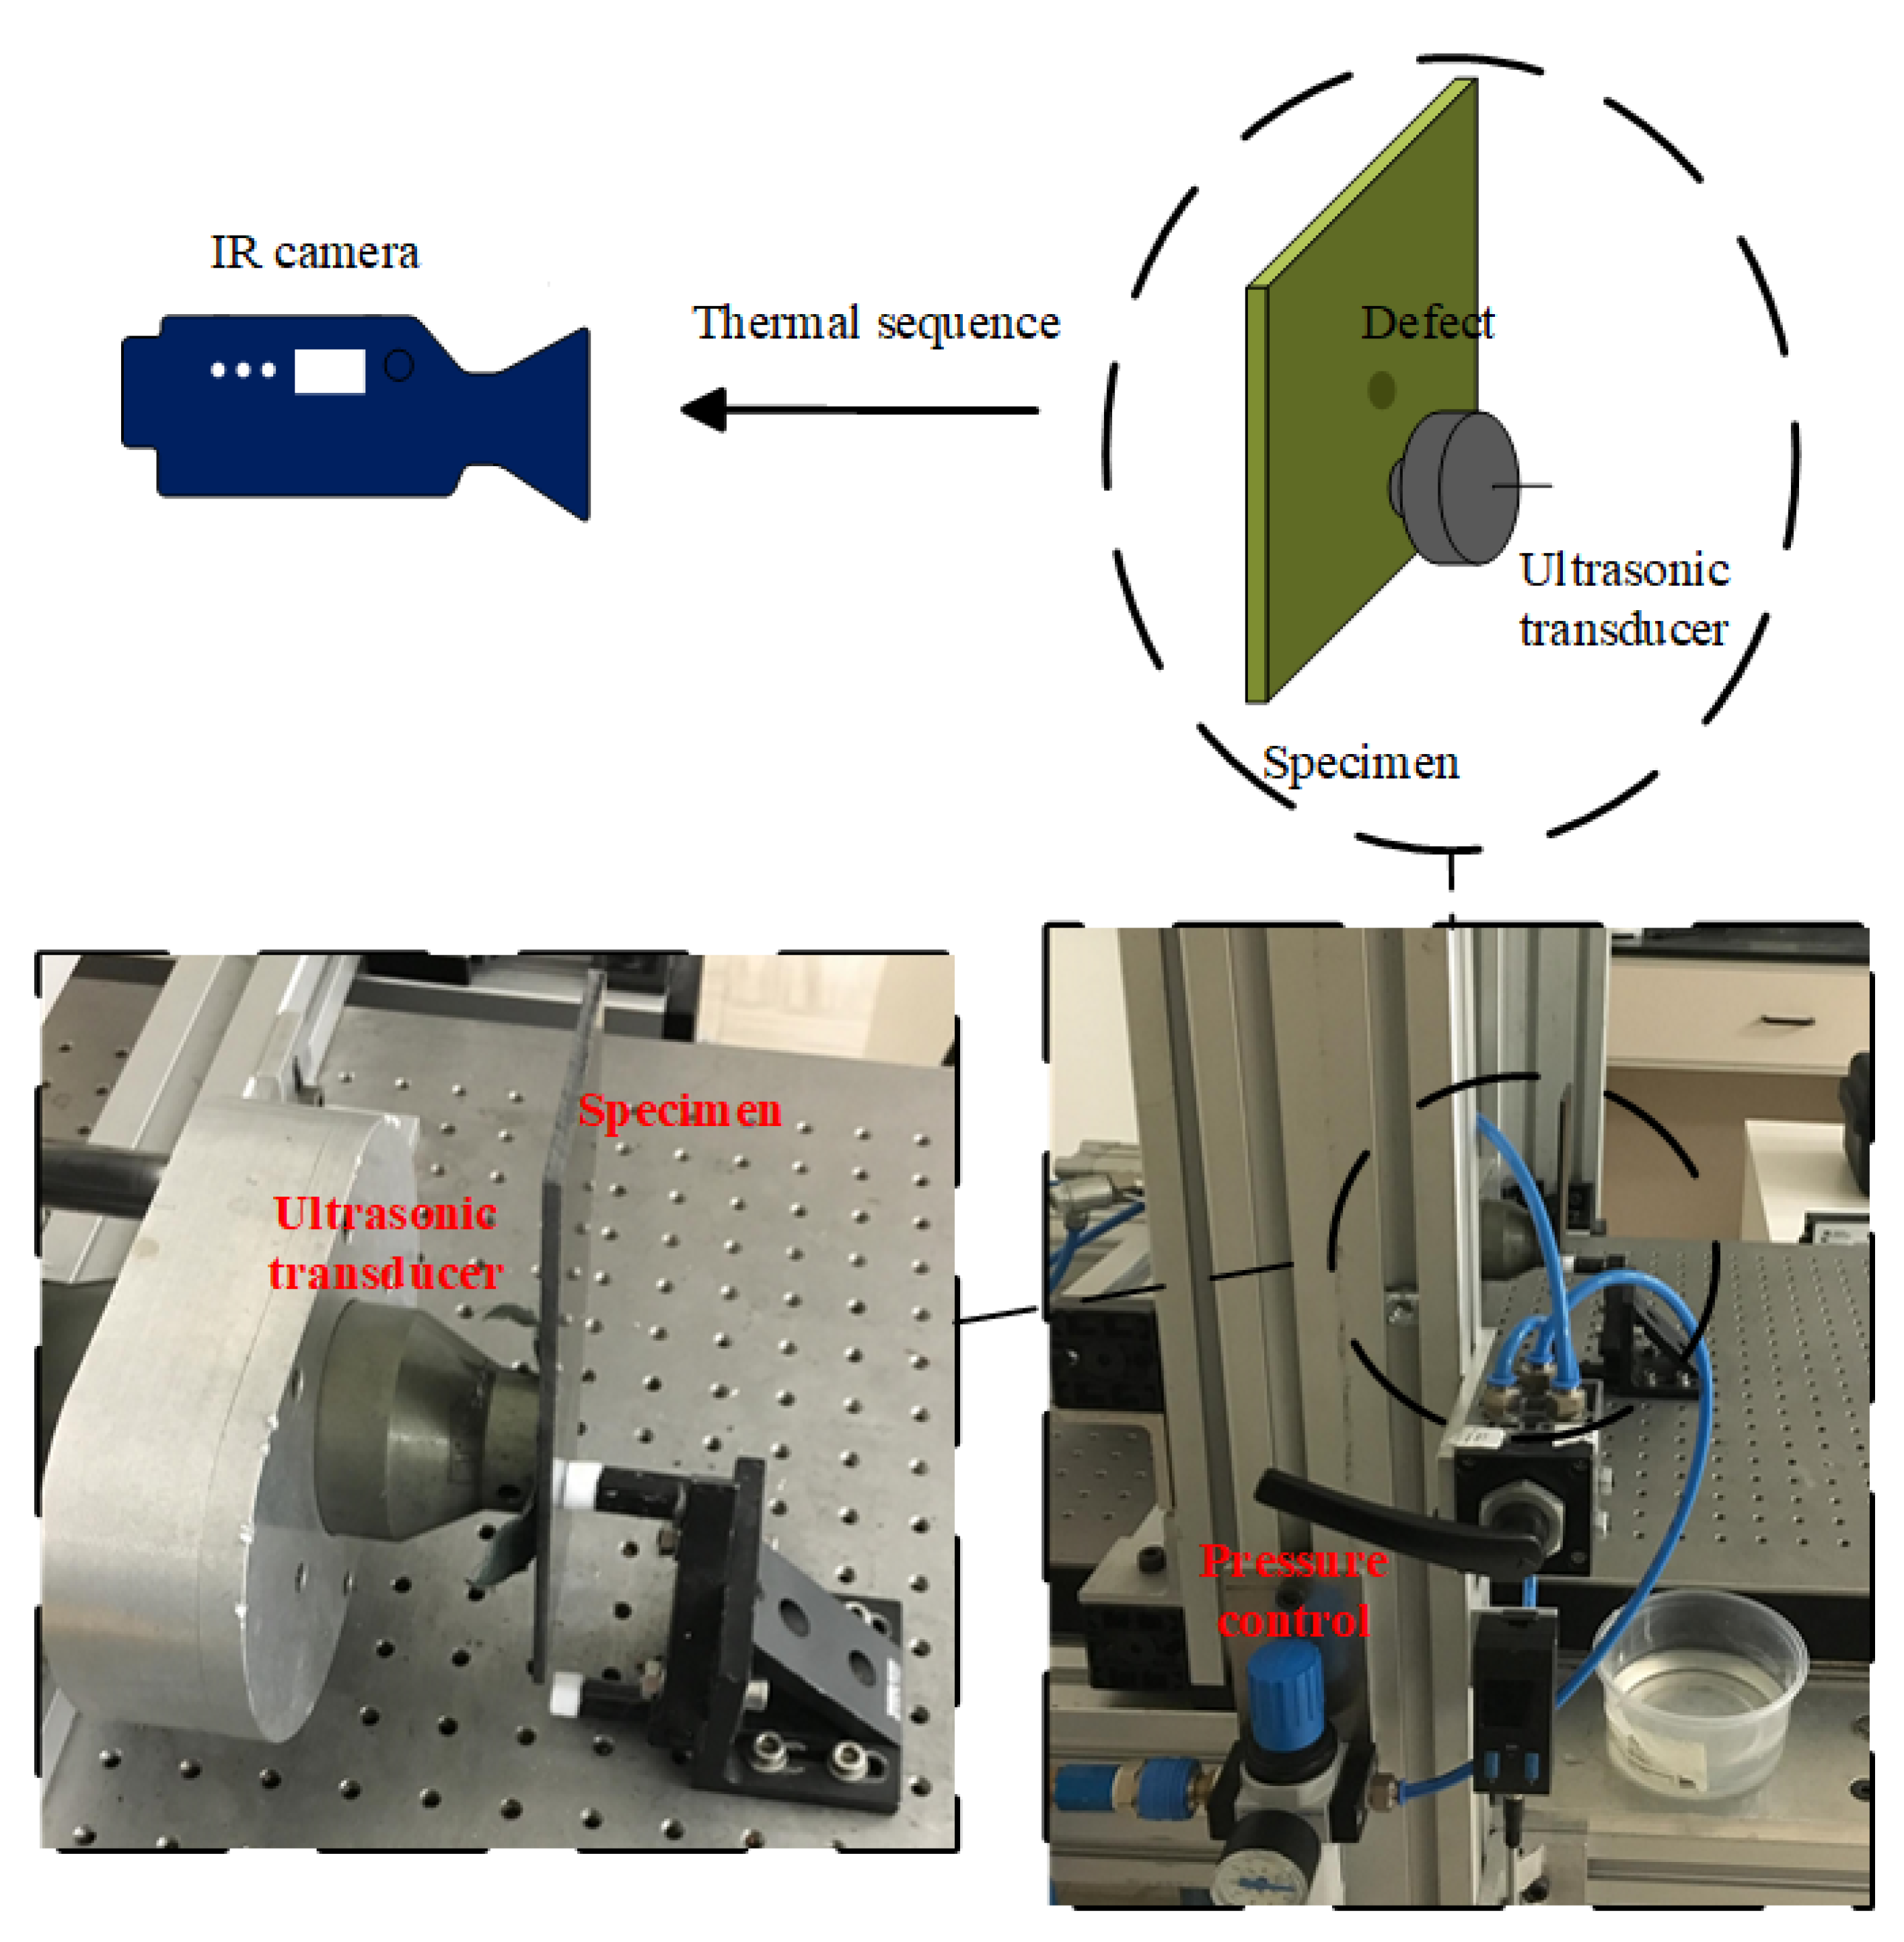
3.1. Experimental Setup
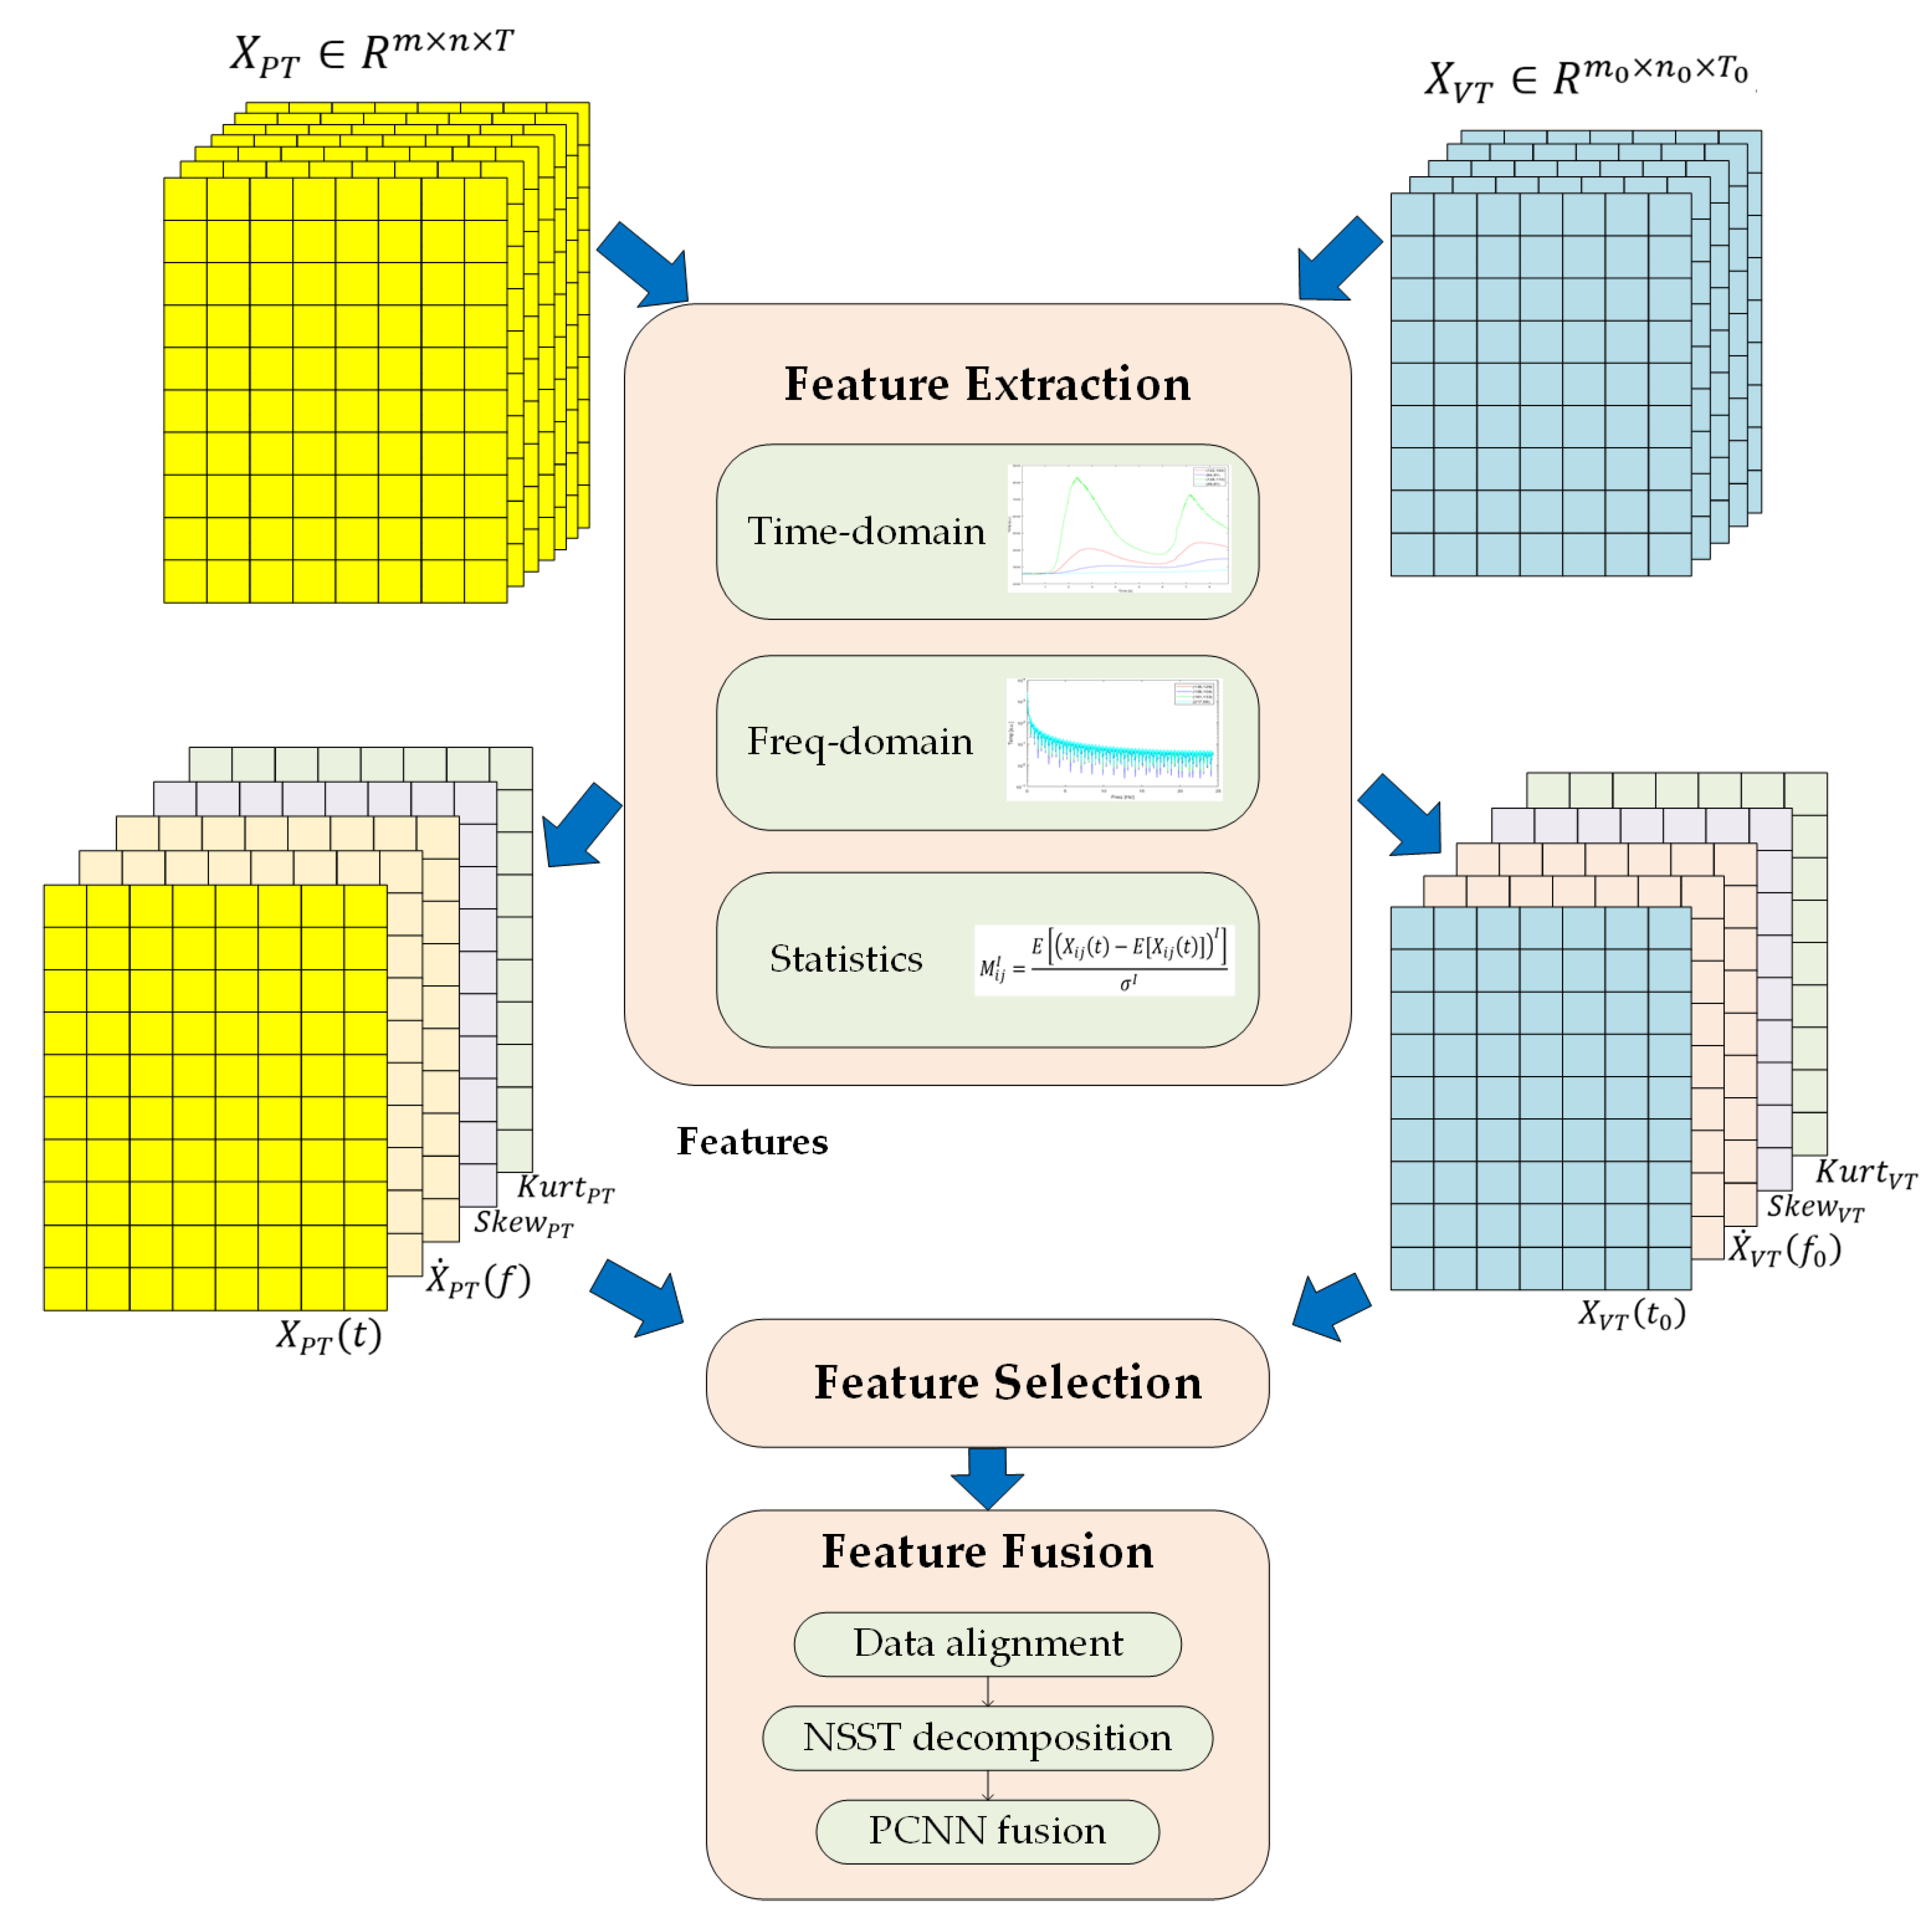
3.2. FE-S-F Framework
3.2.1. Feature Extraction Stage
3.2.2. Feature Selection Stage
3.2.3. Feature Fusion Stage
4. Results and Discussion
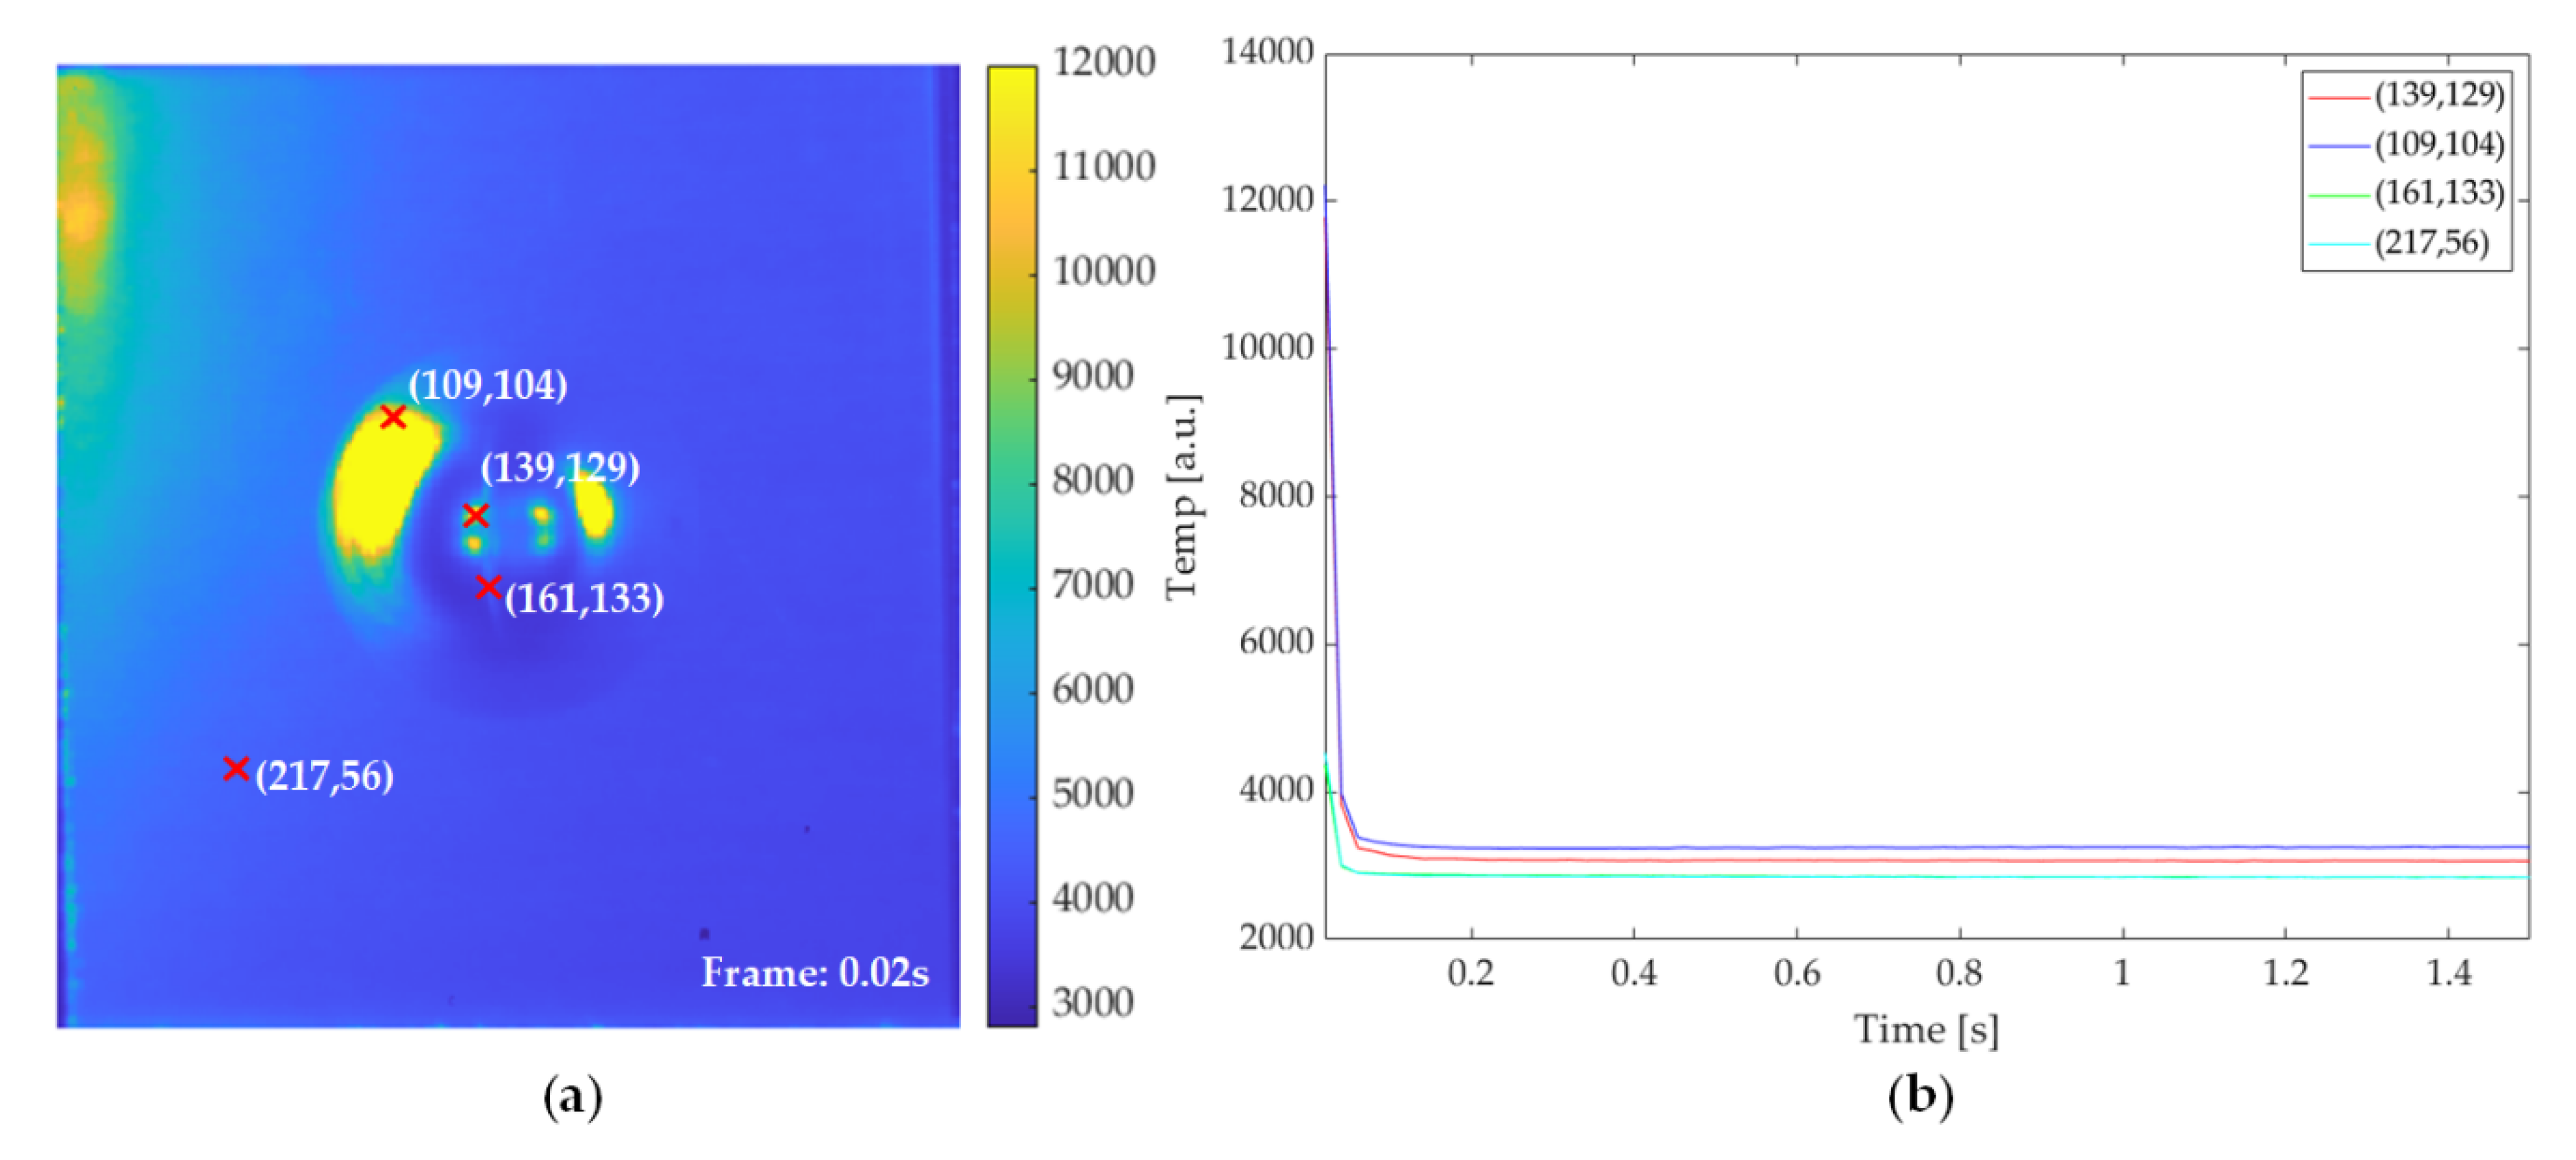
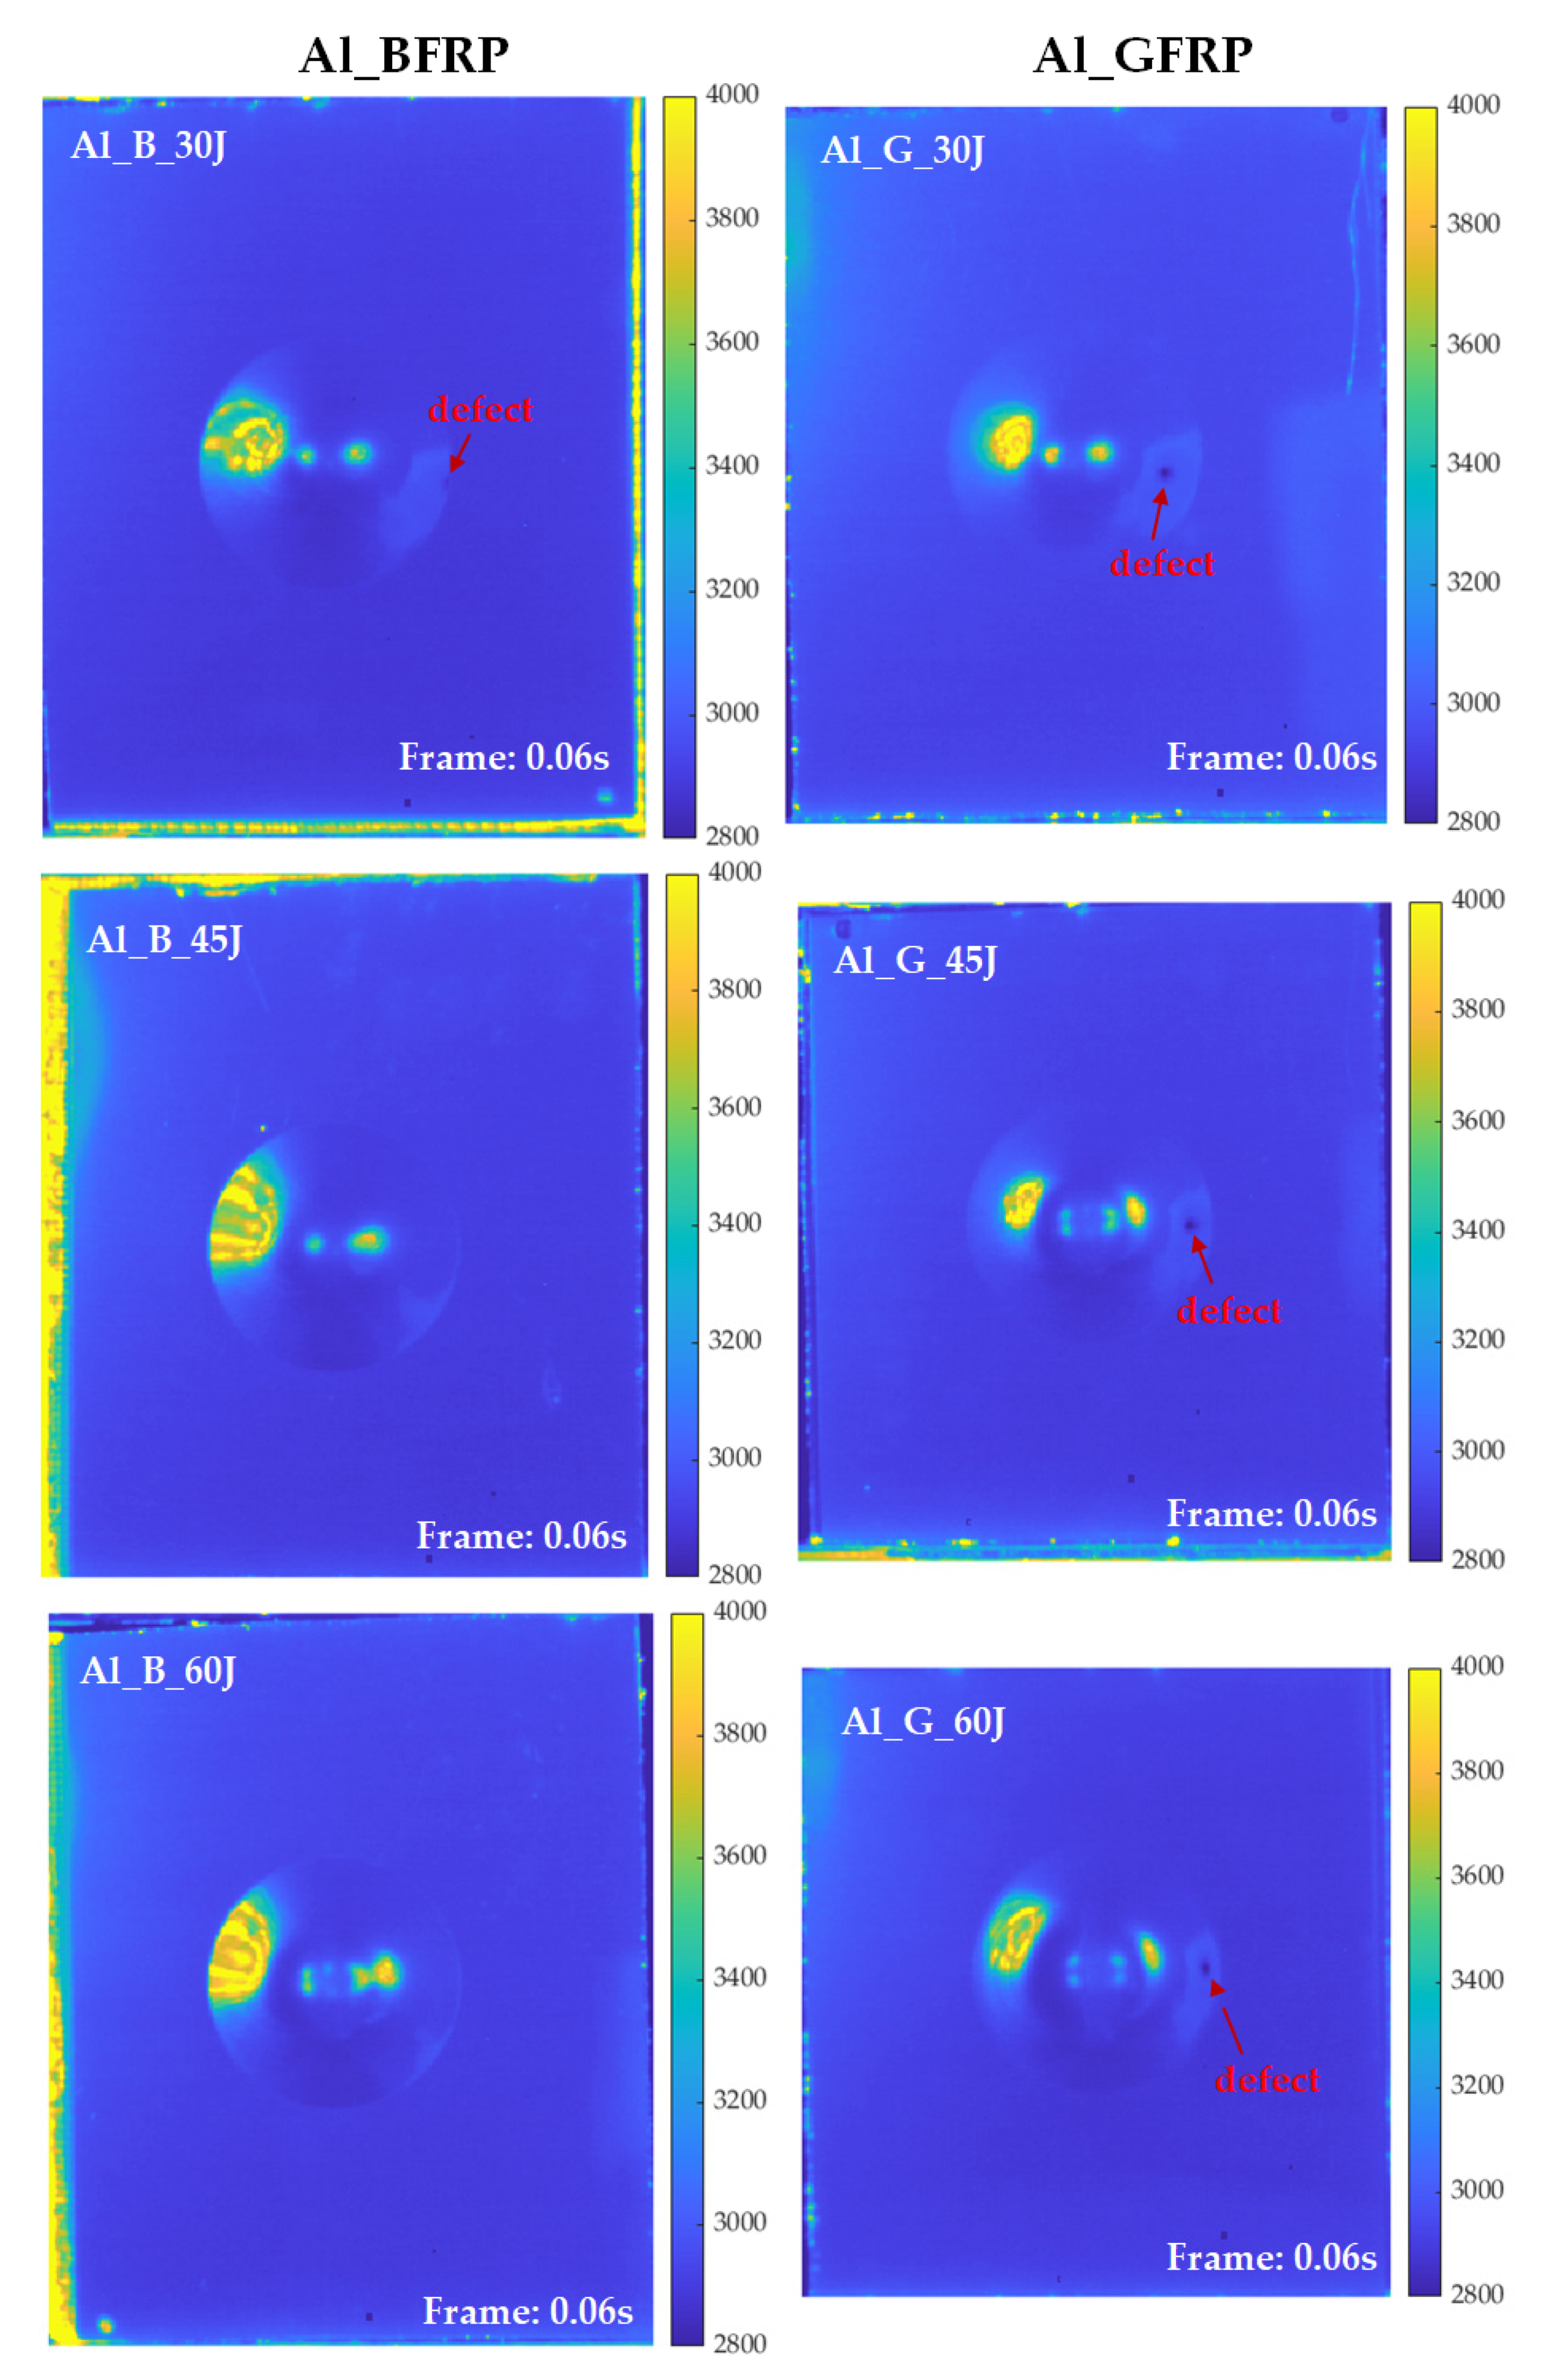
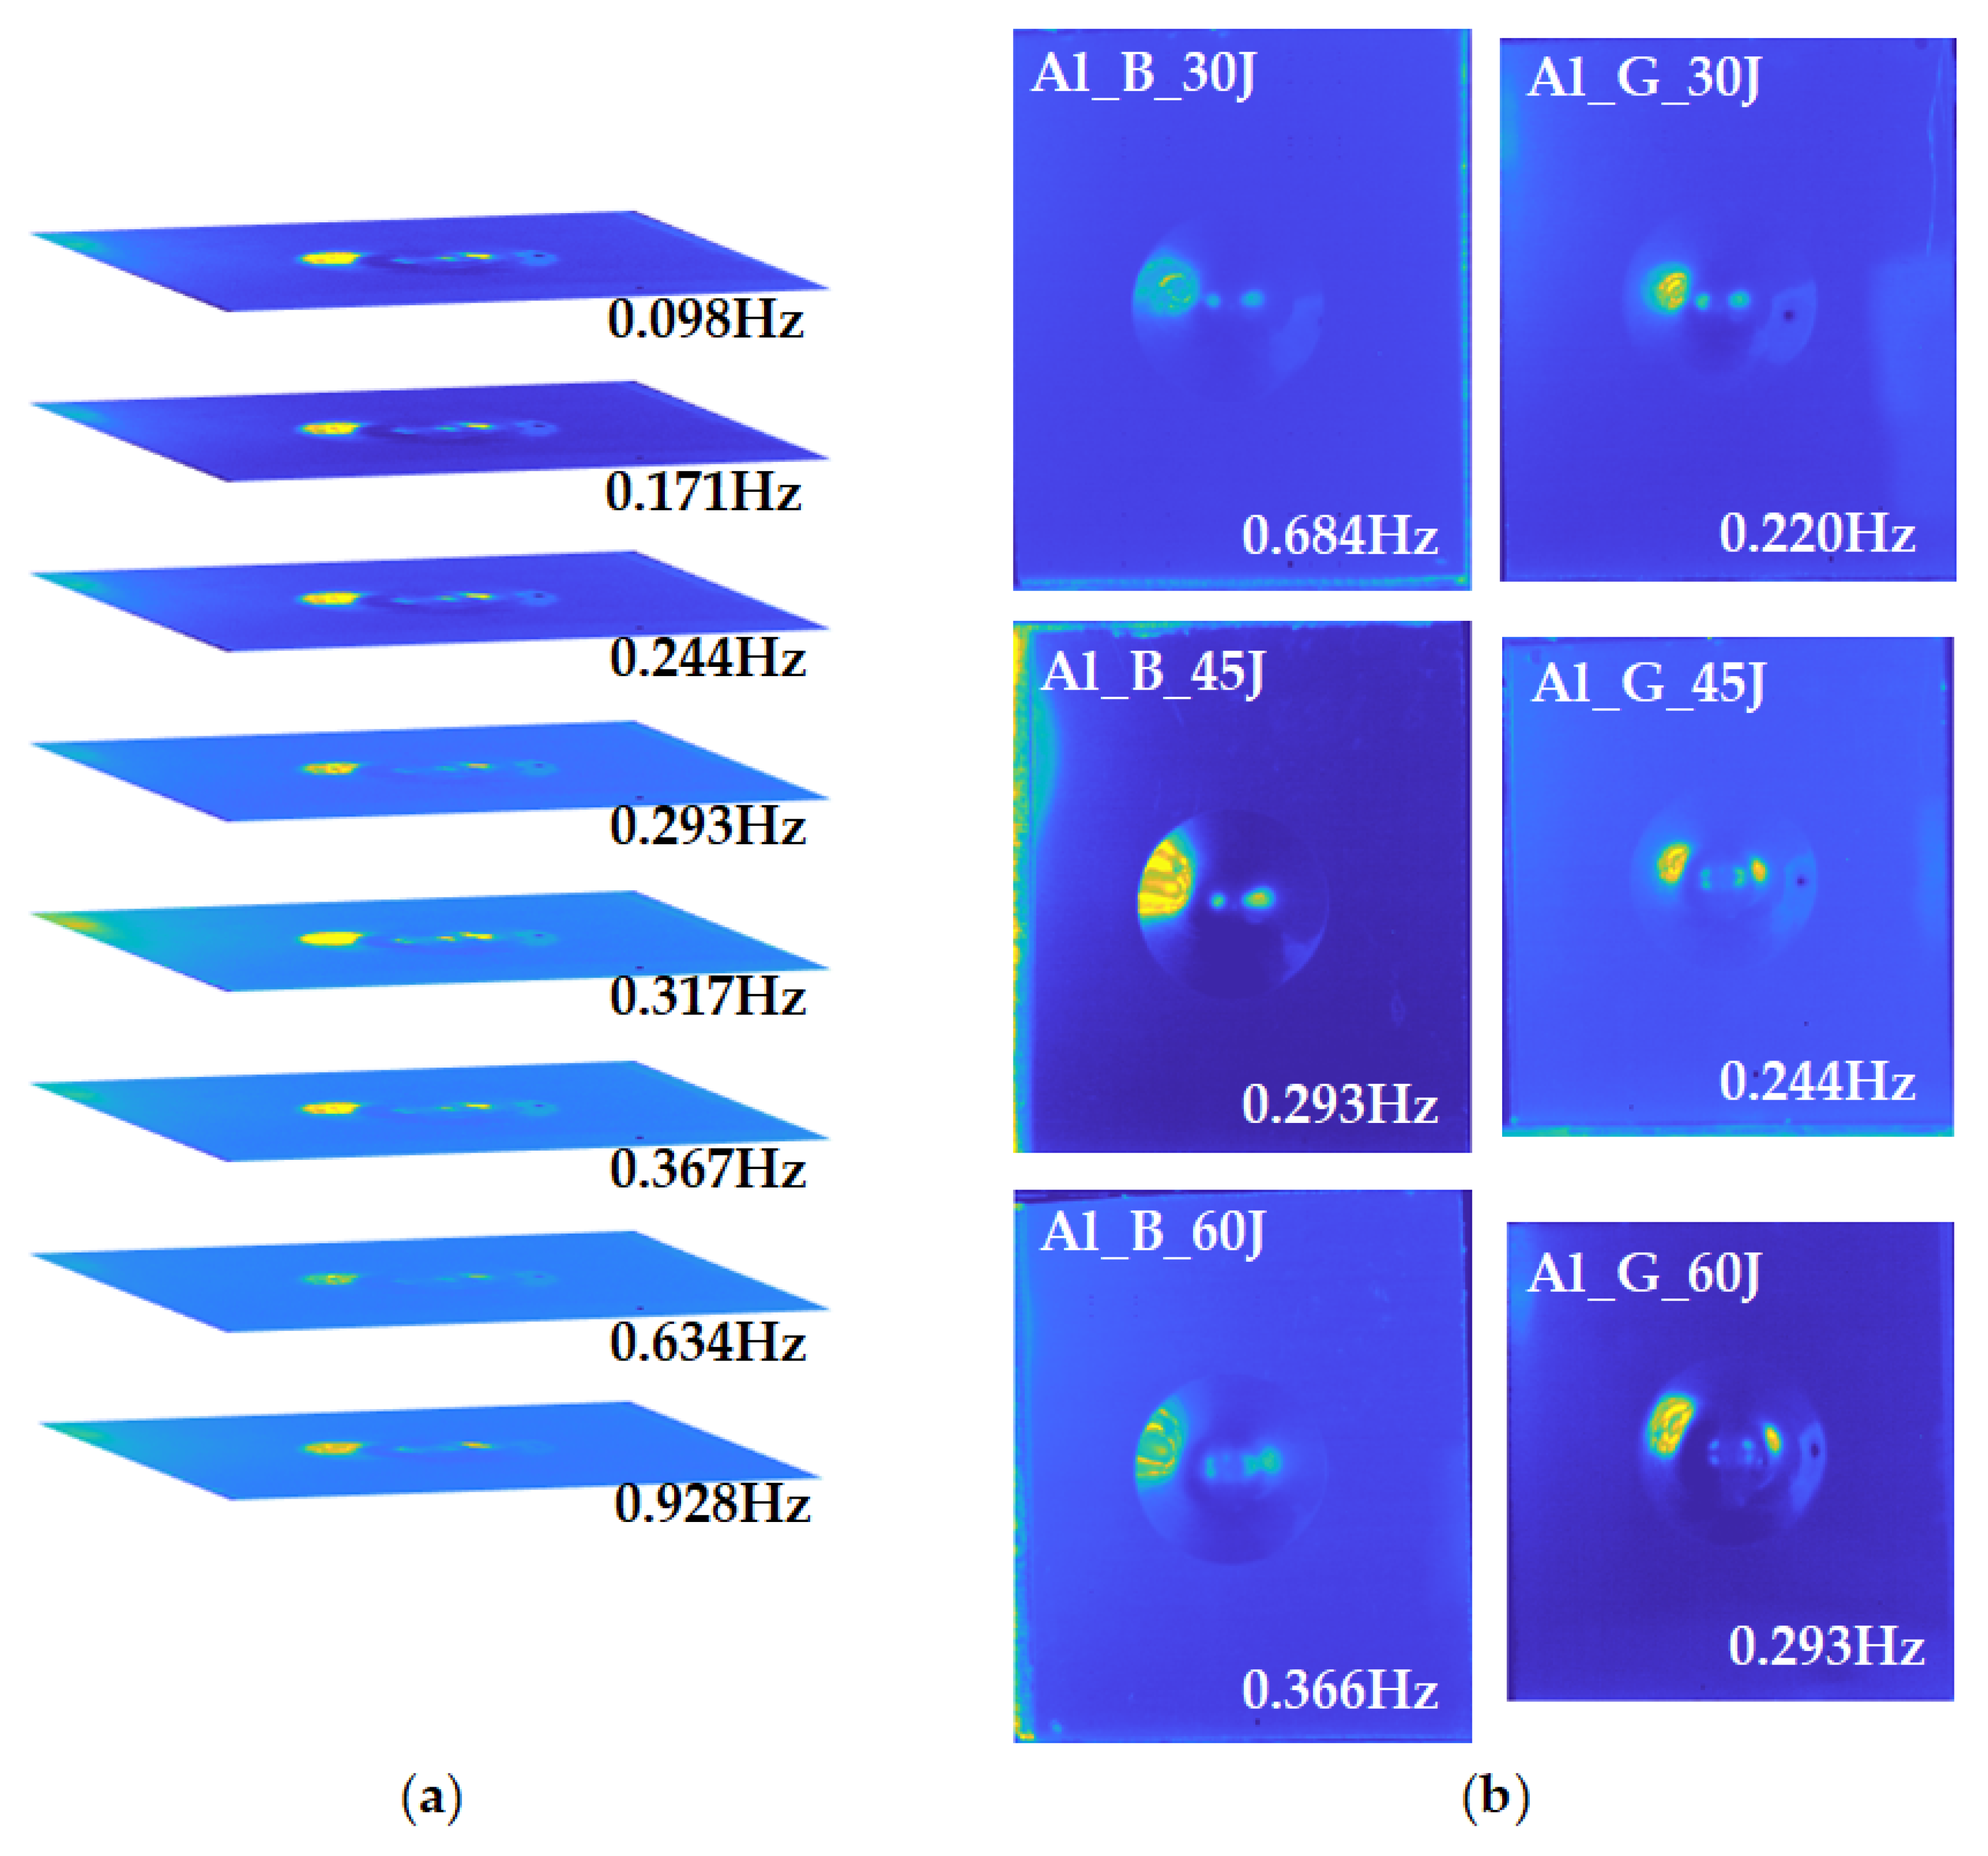
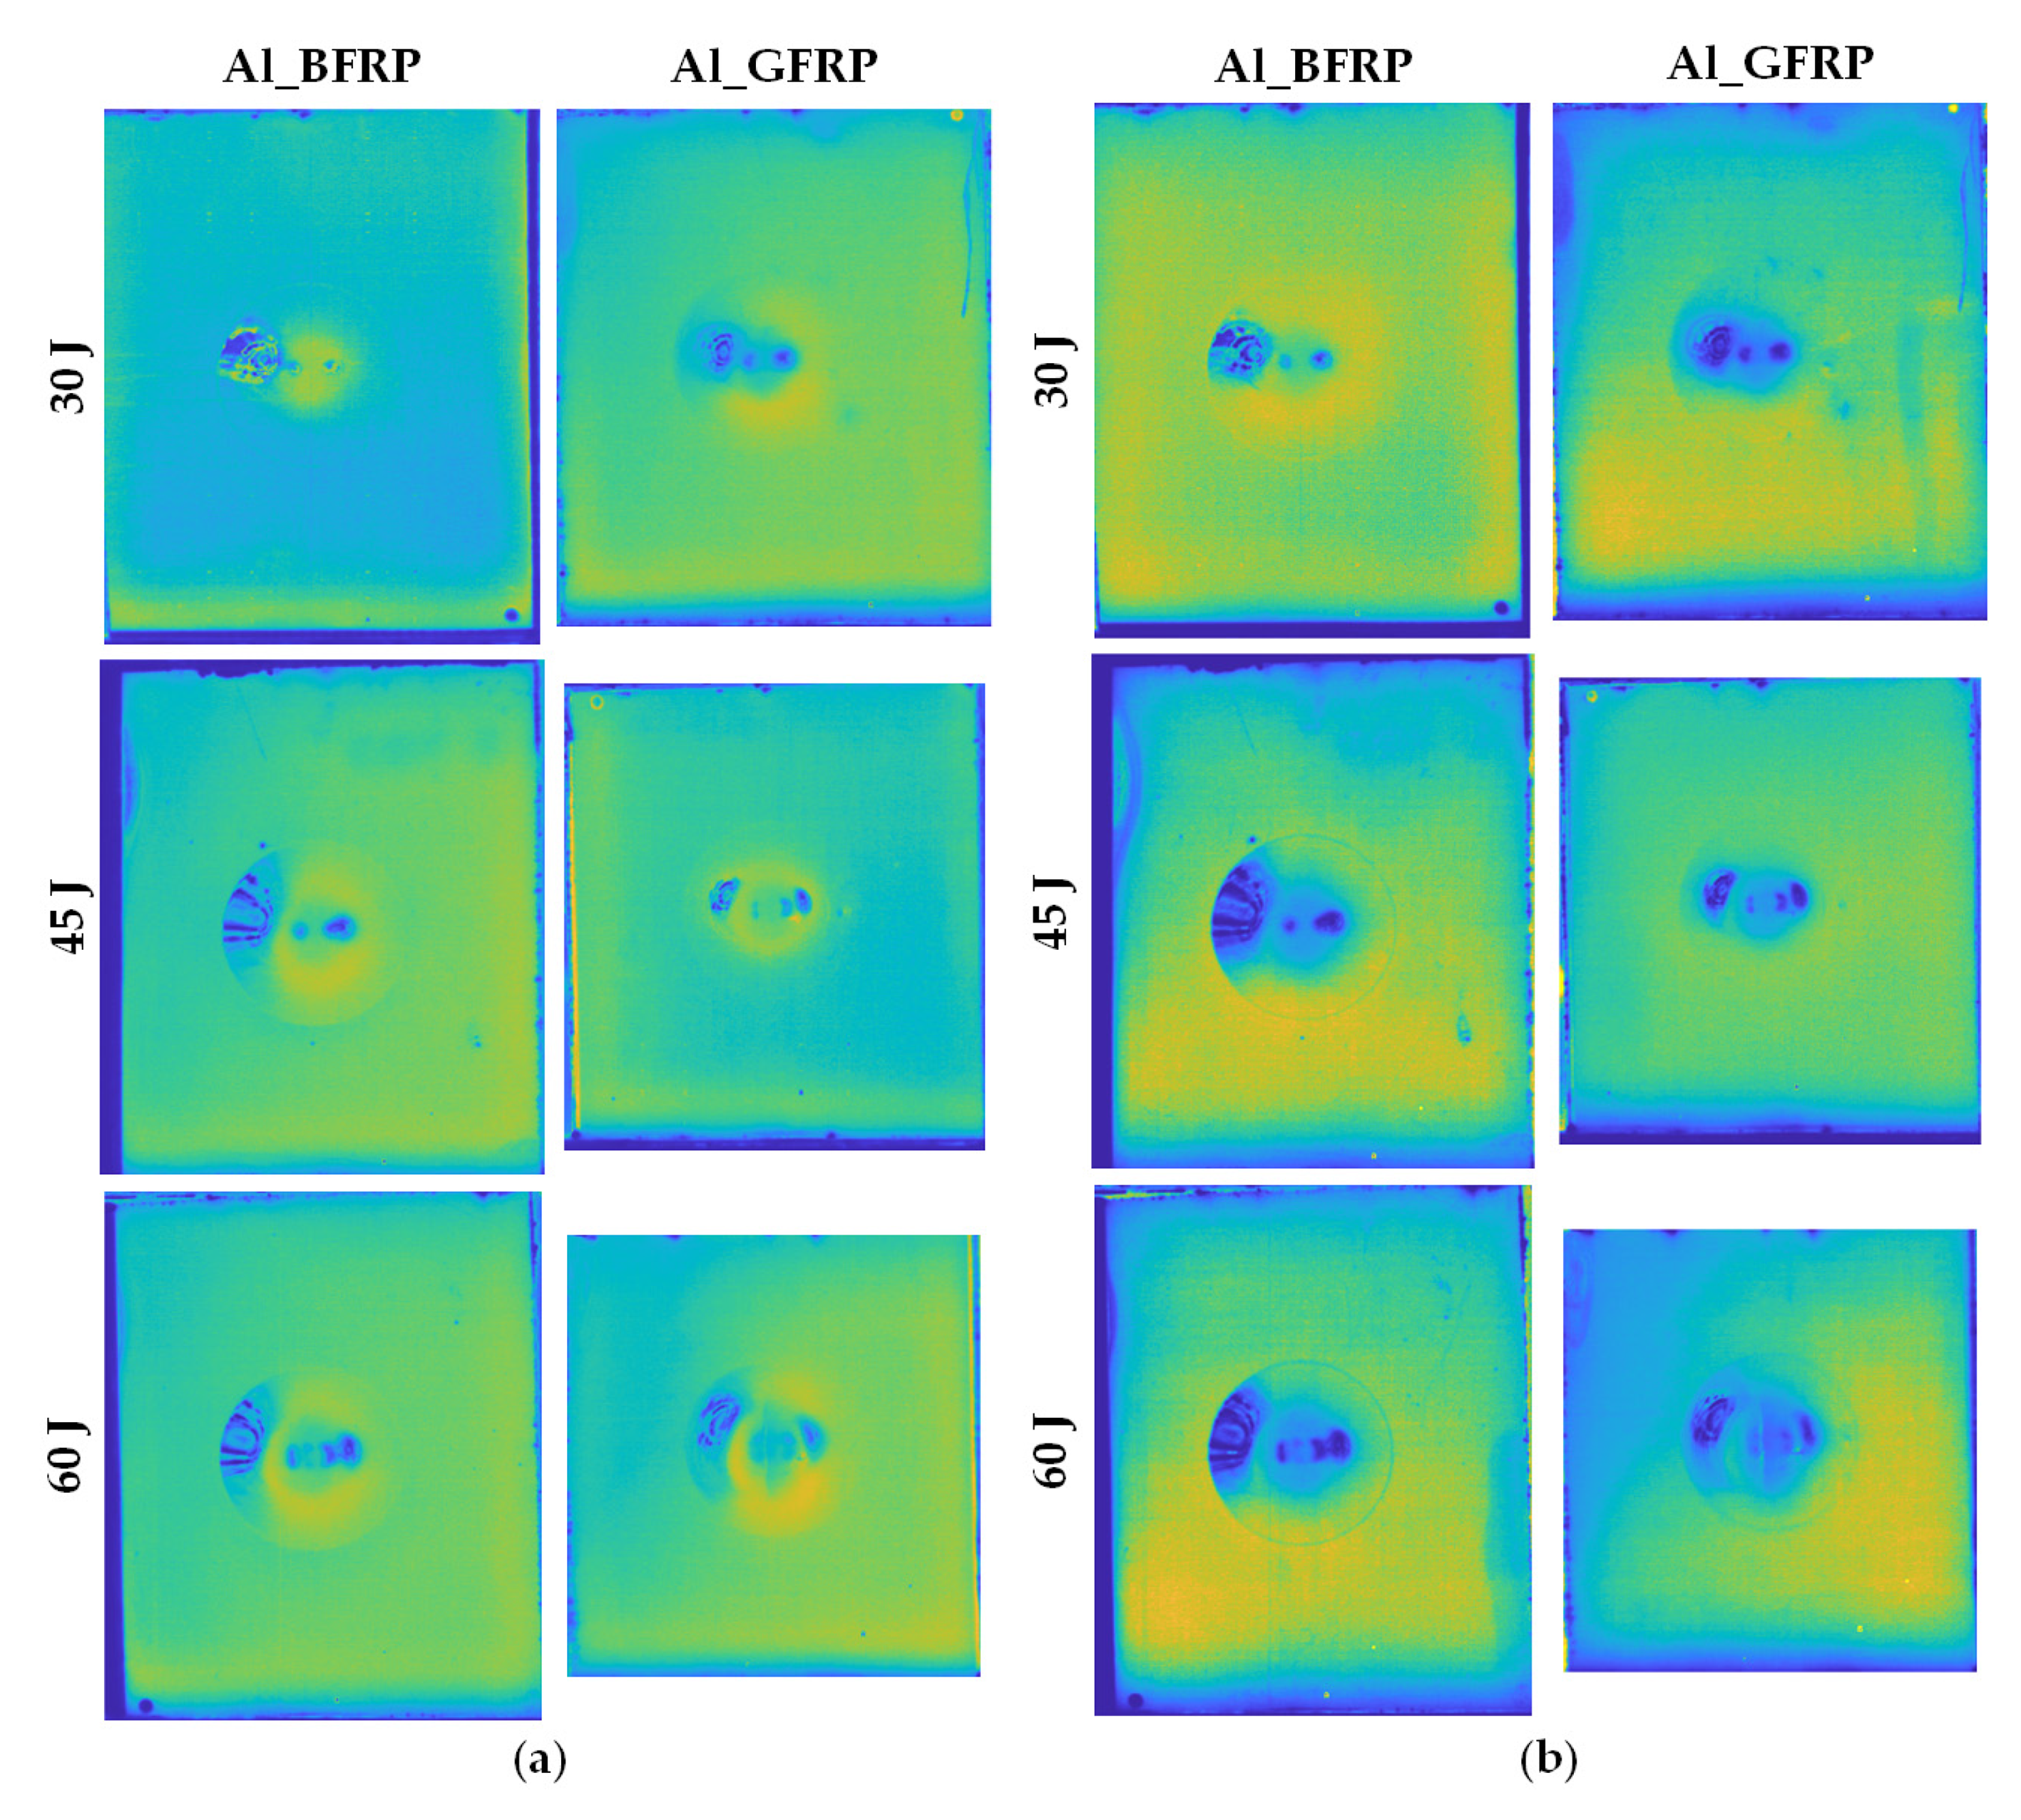
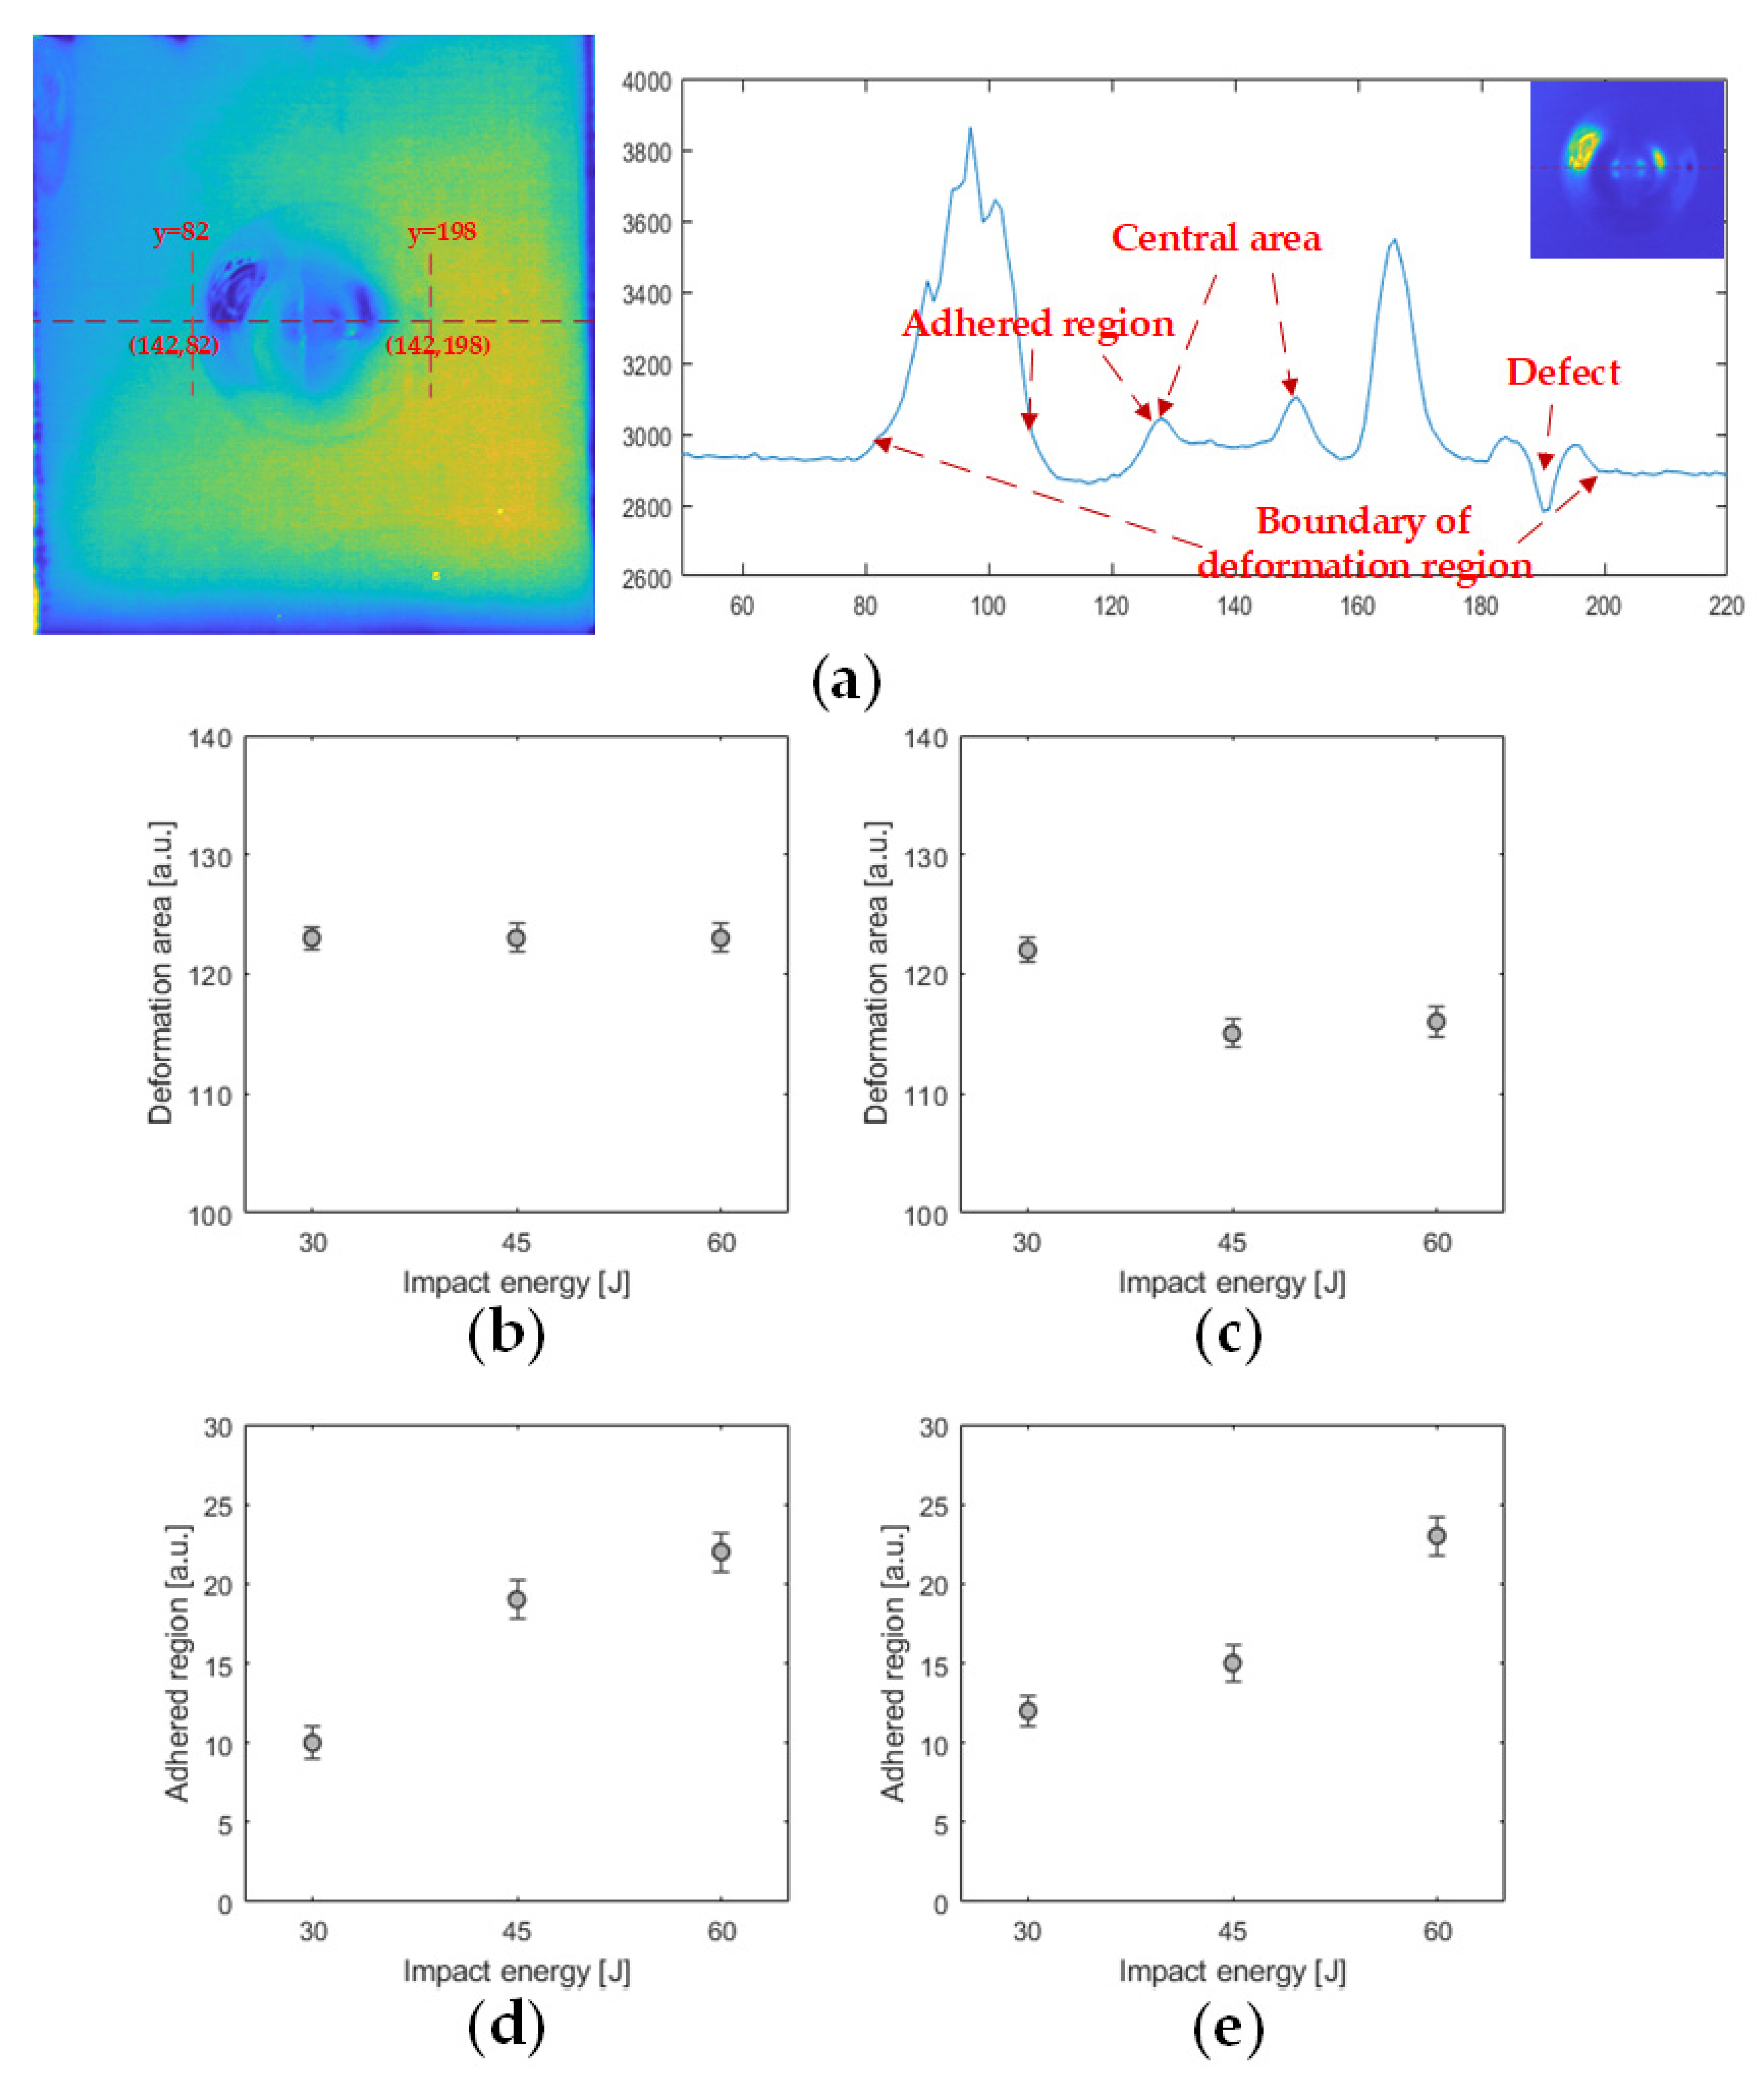
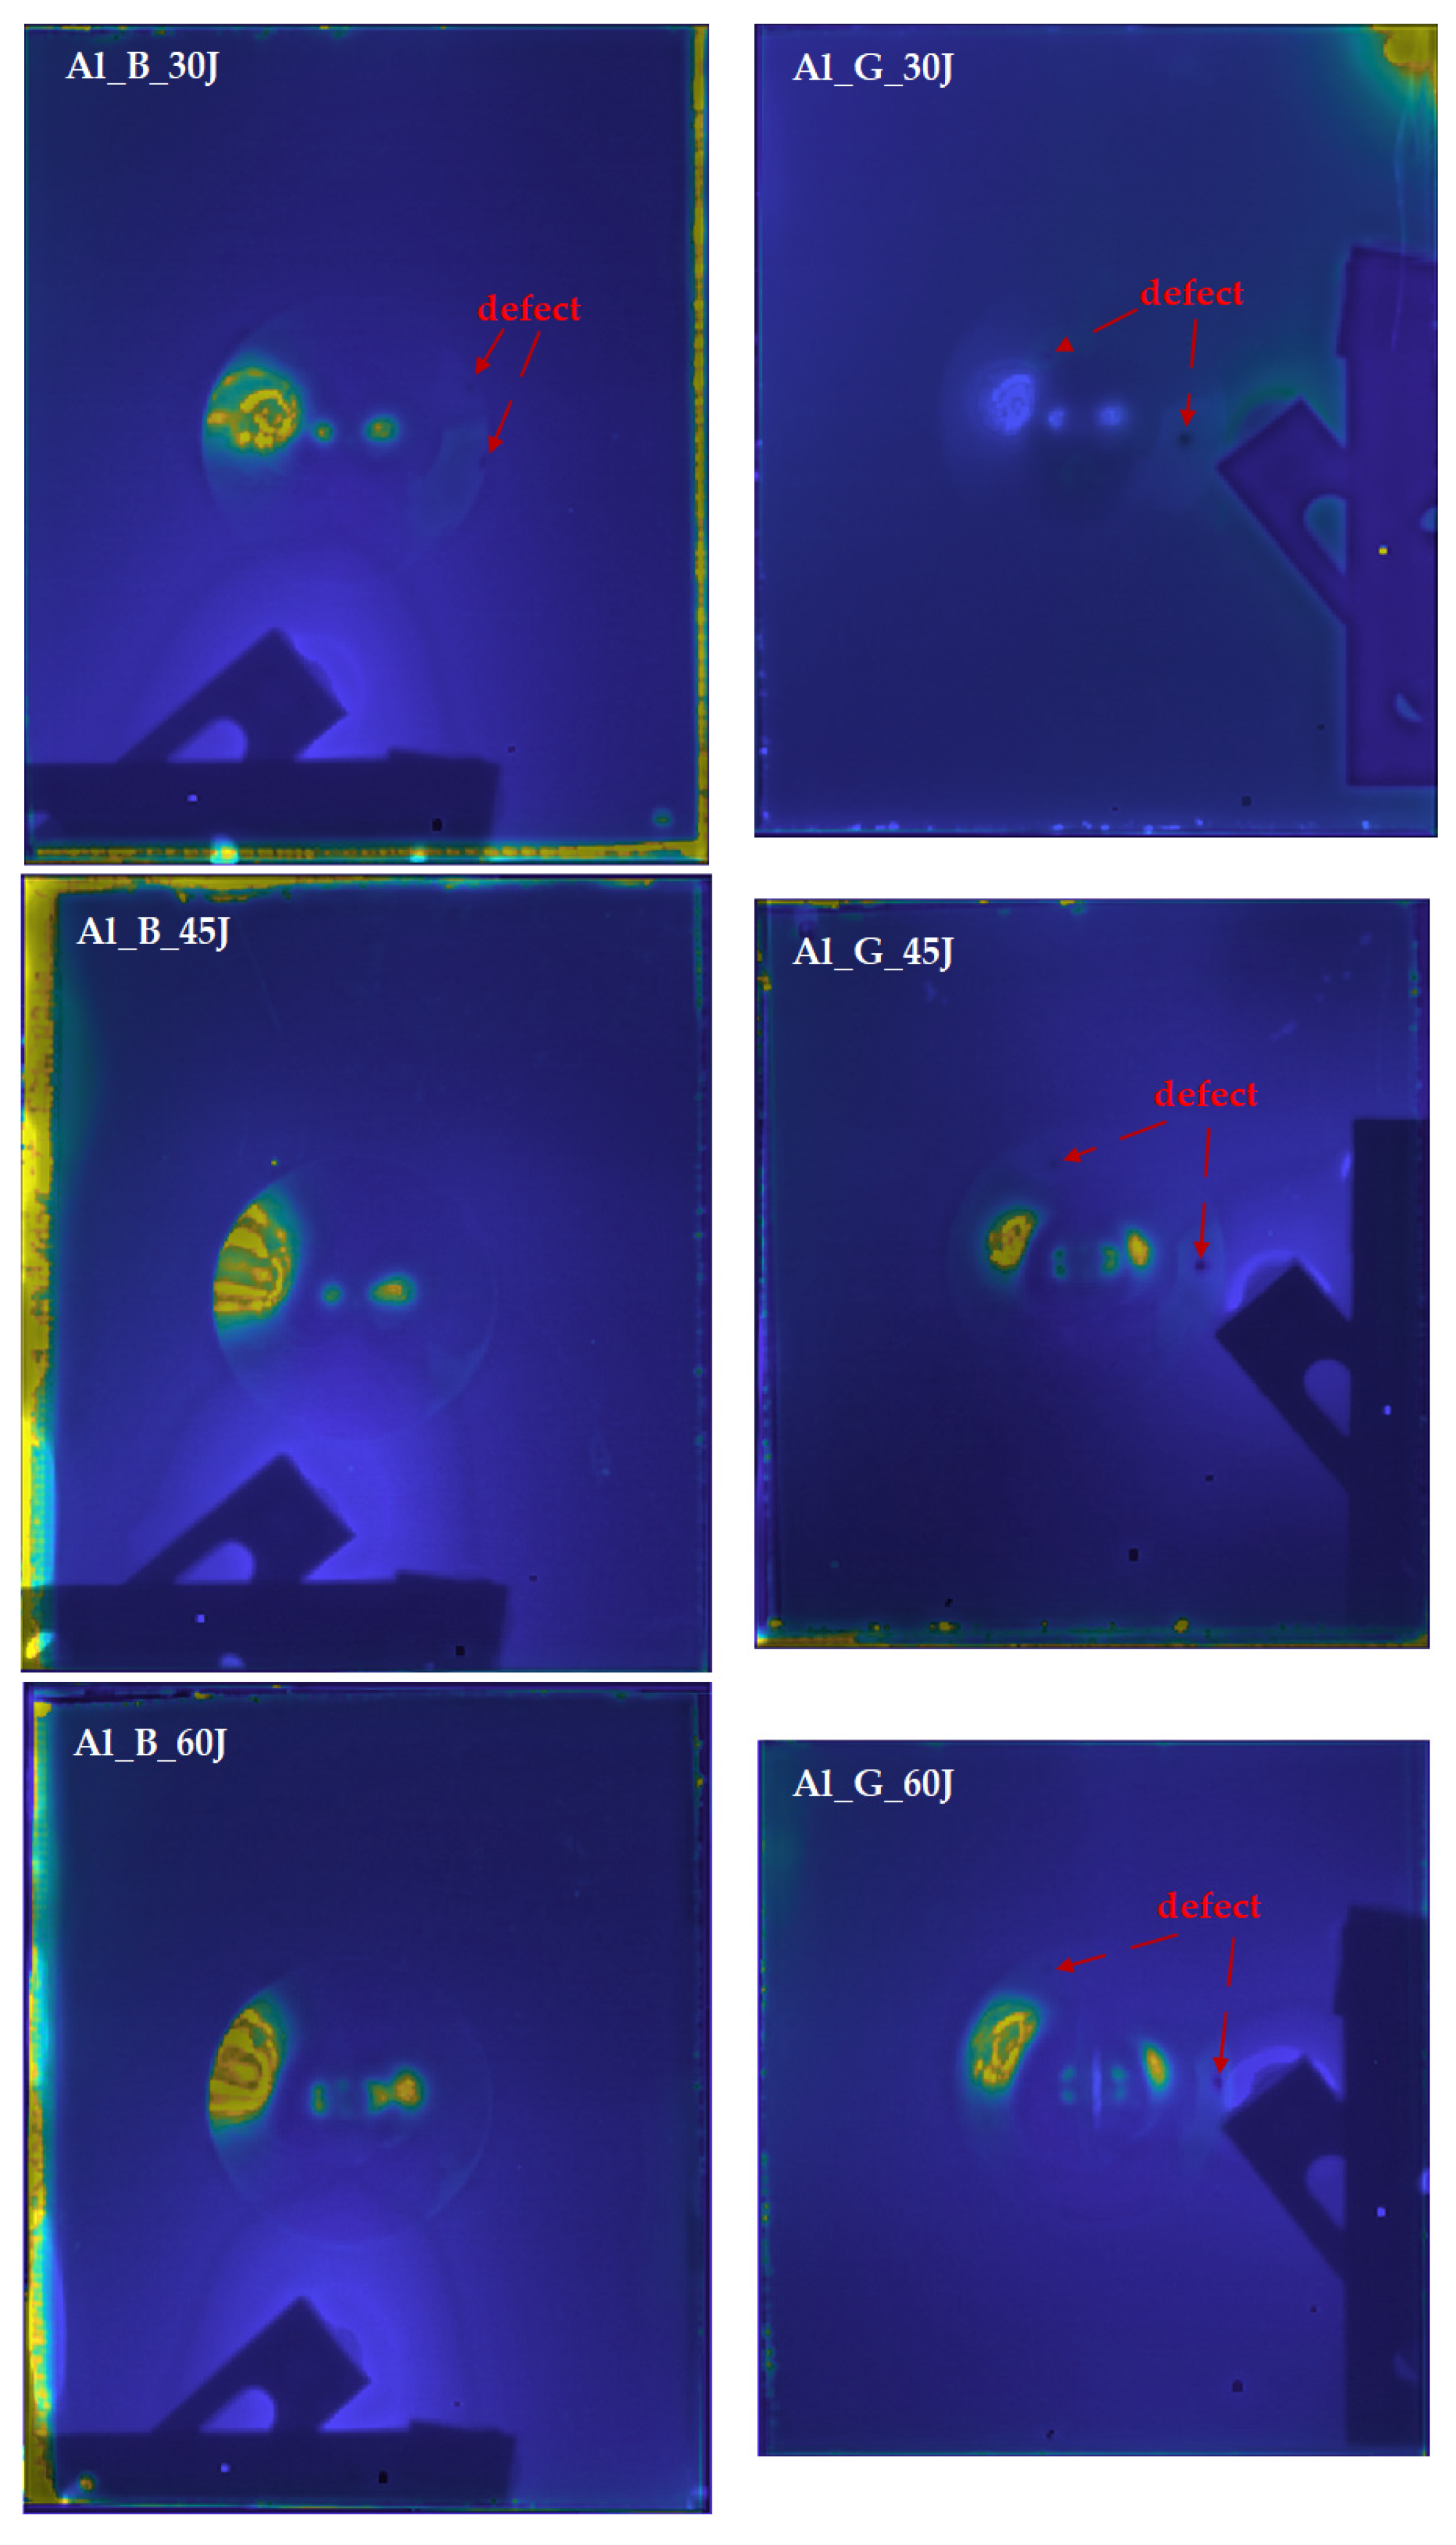
4.1. PT Features and Quantitative Evaluation
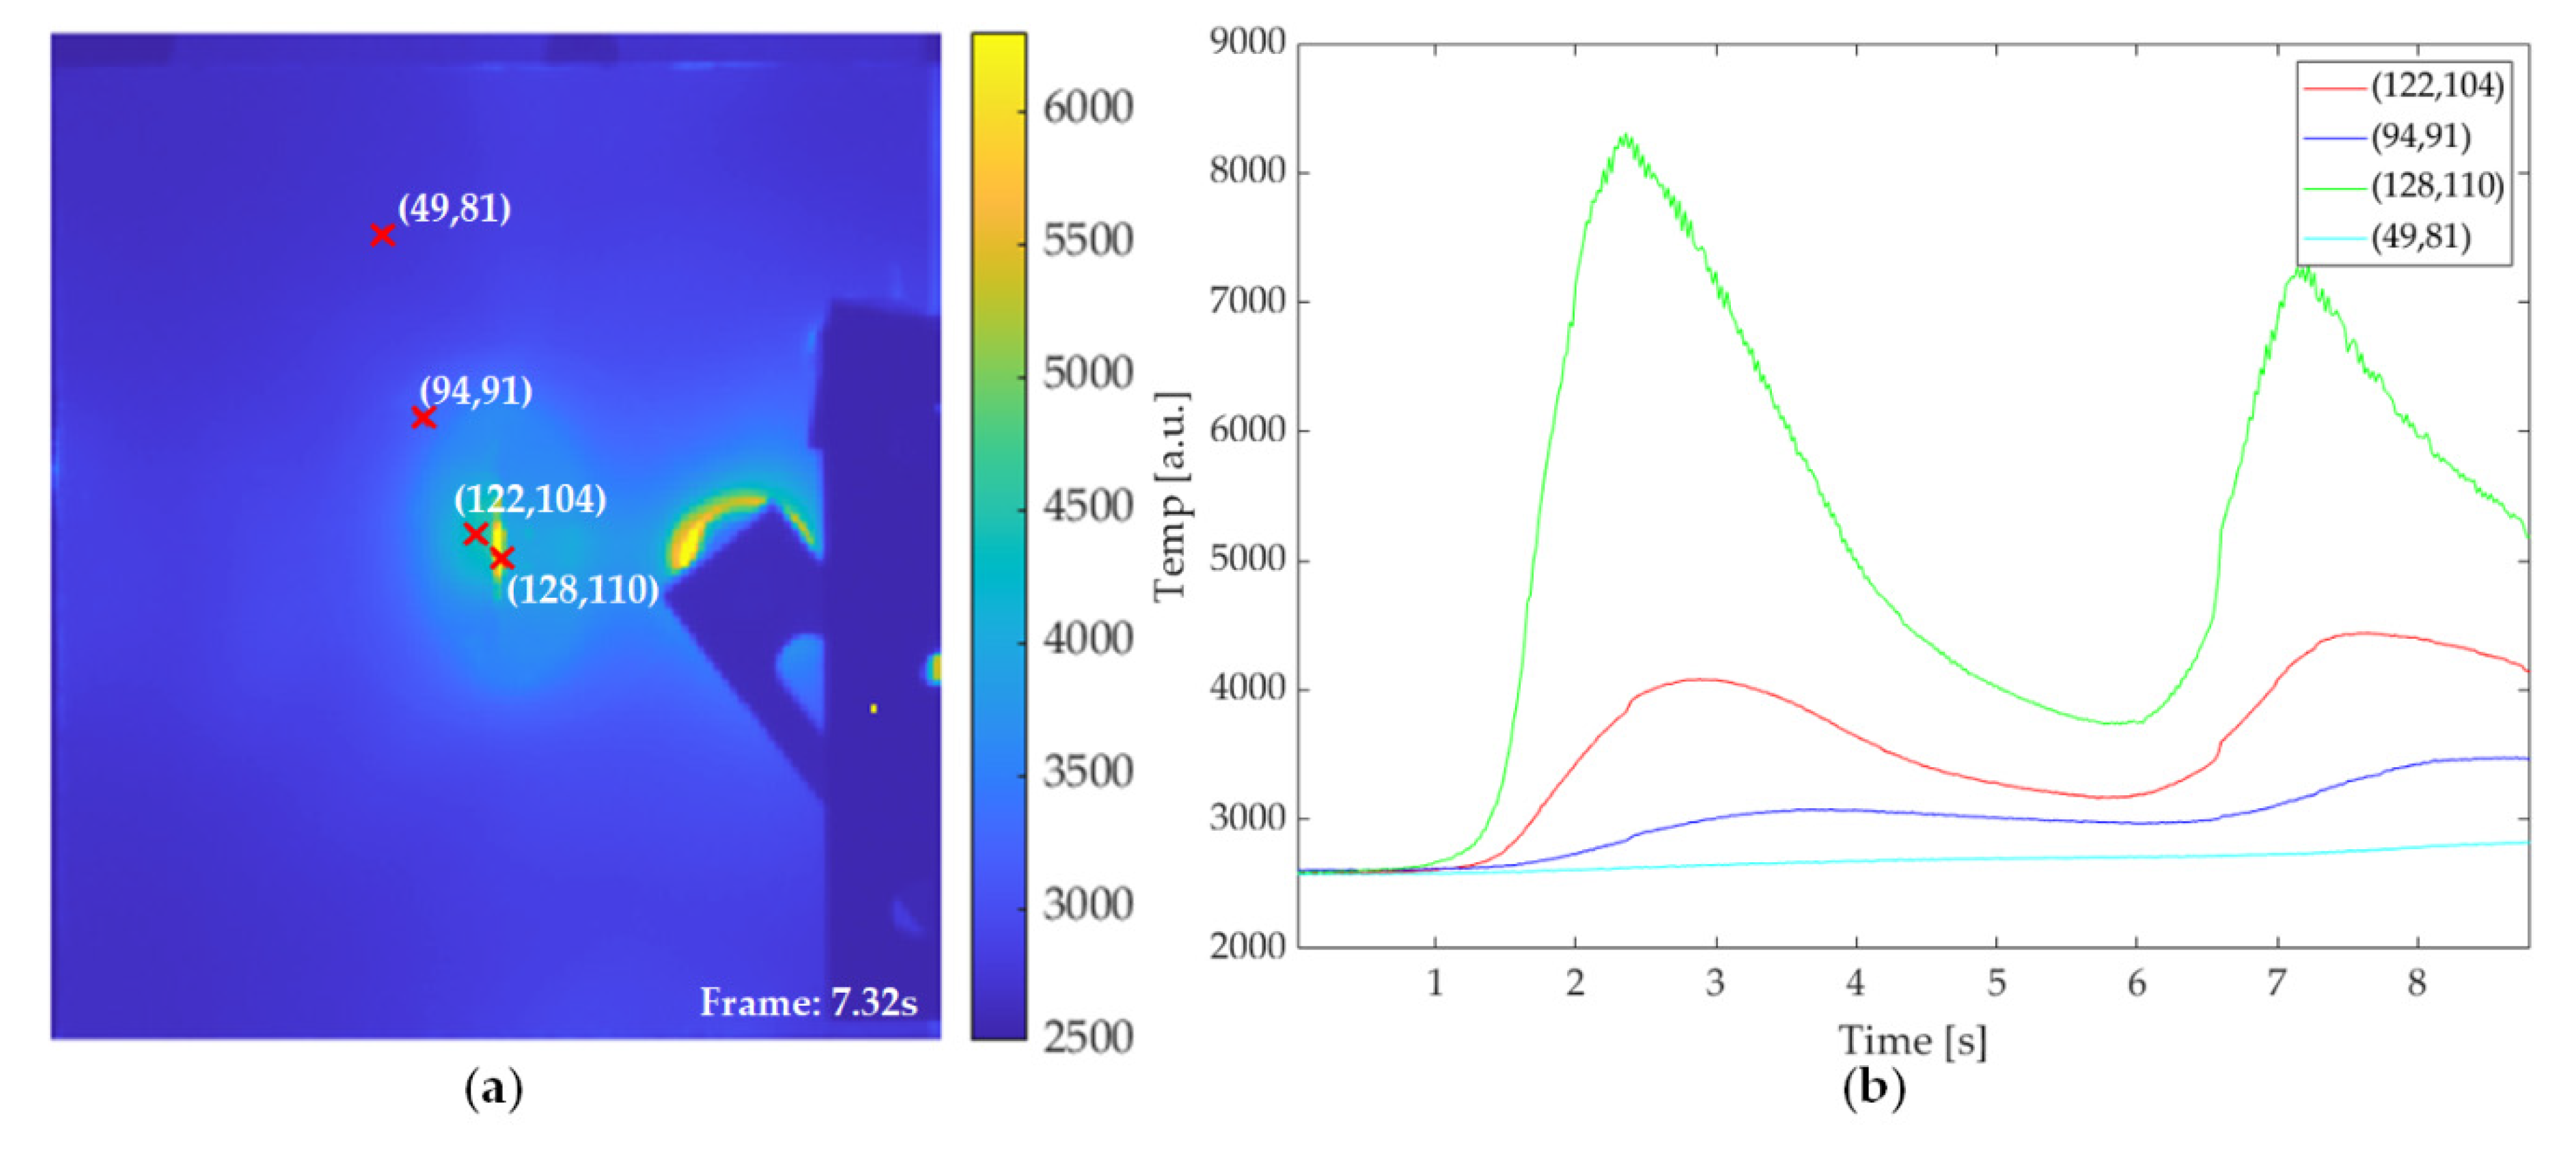
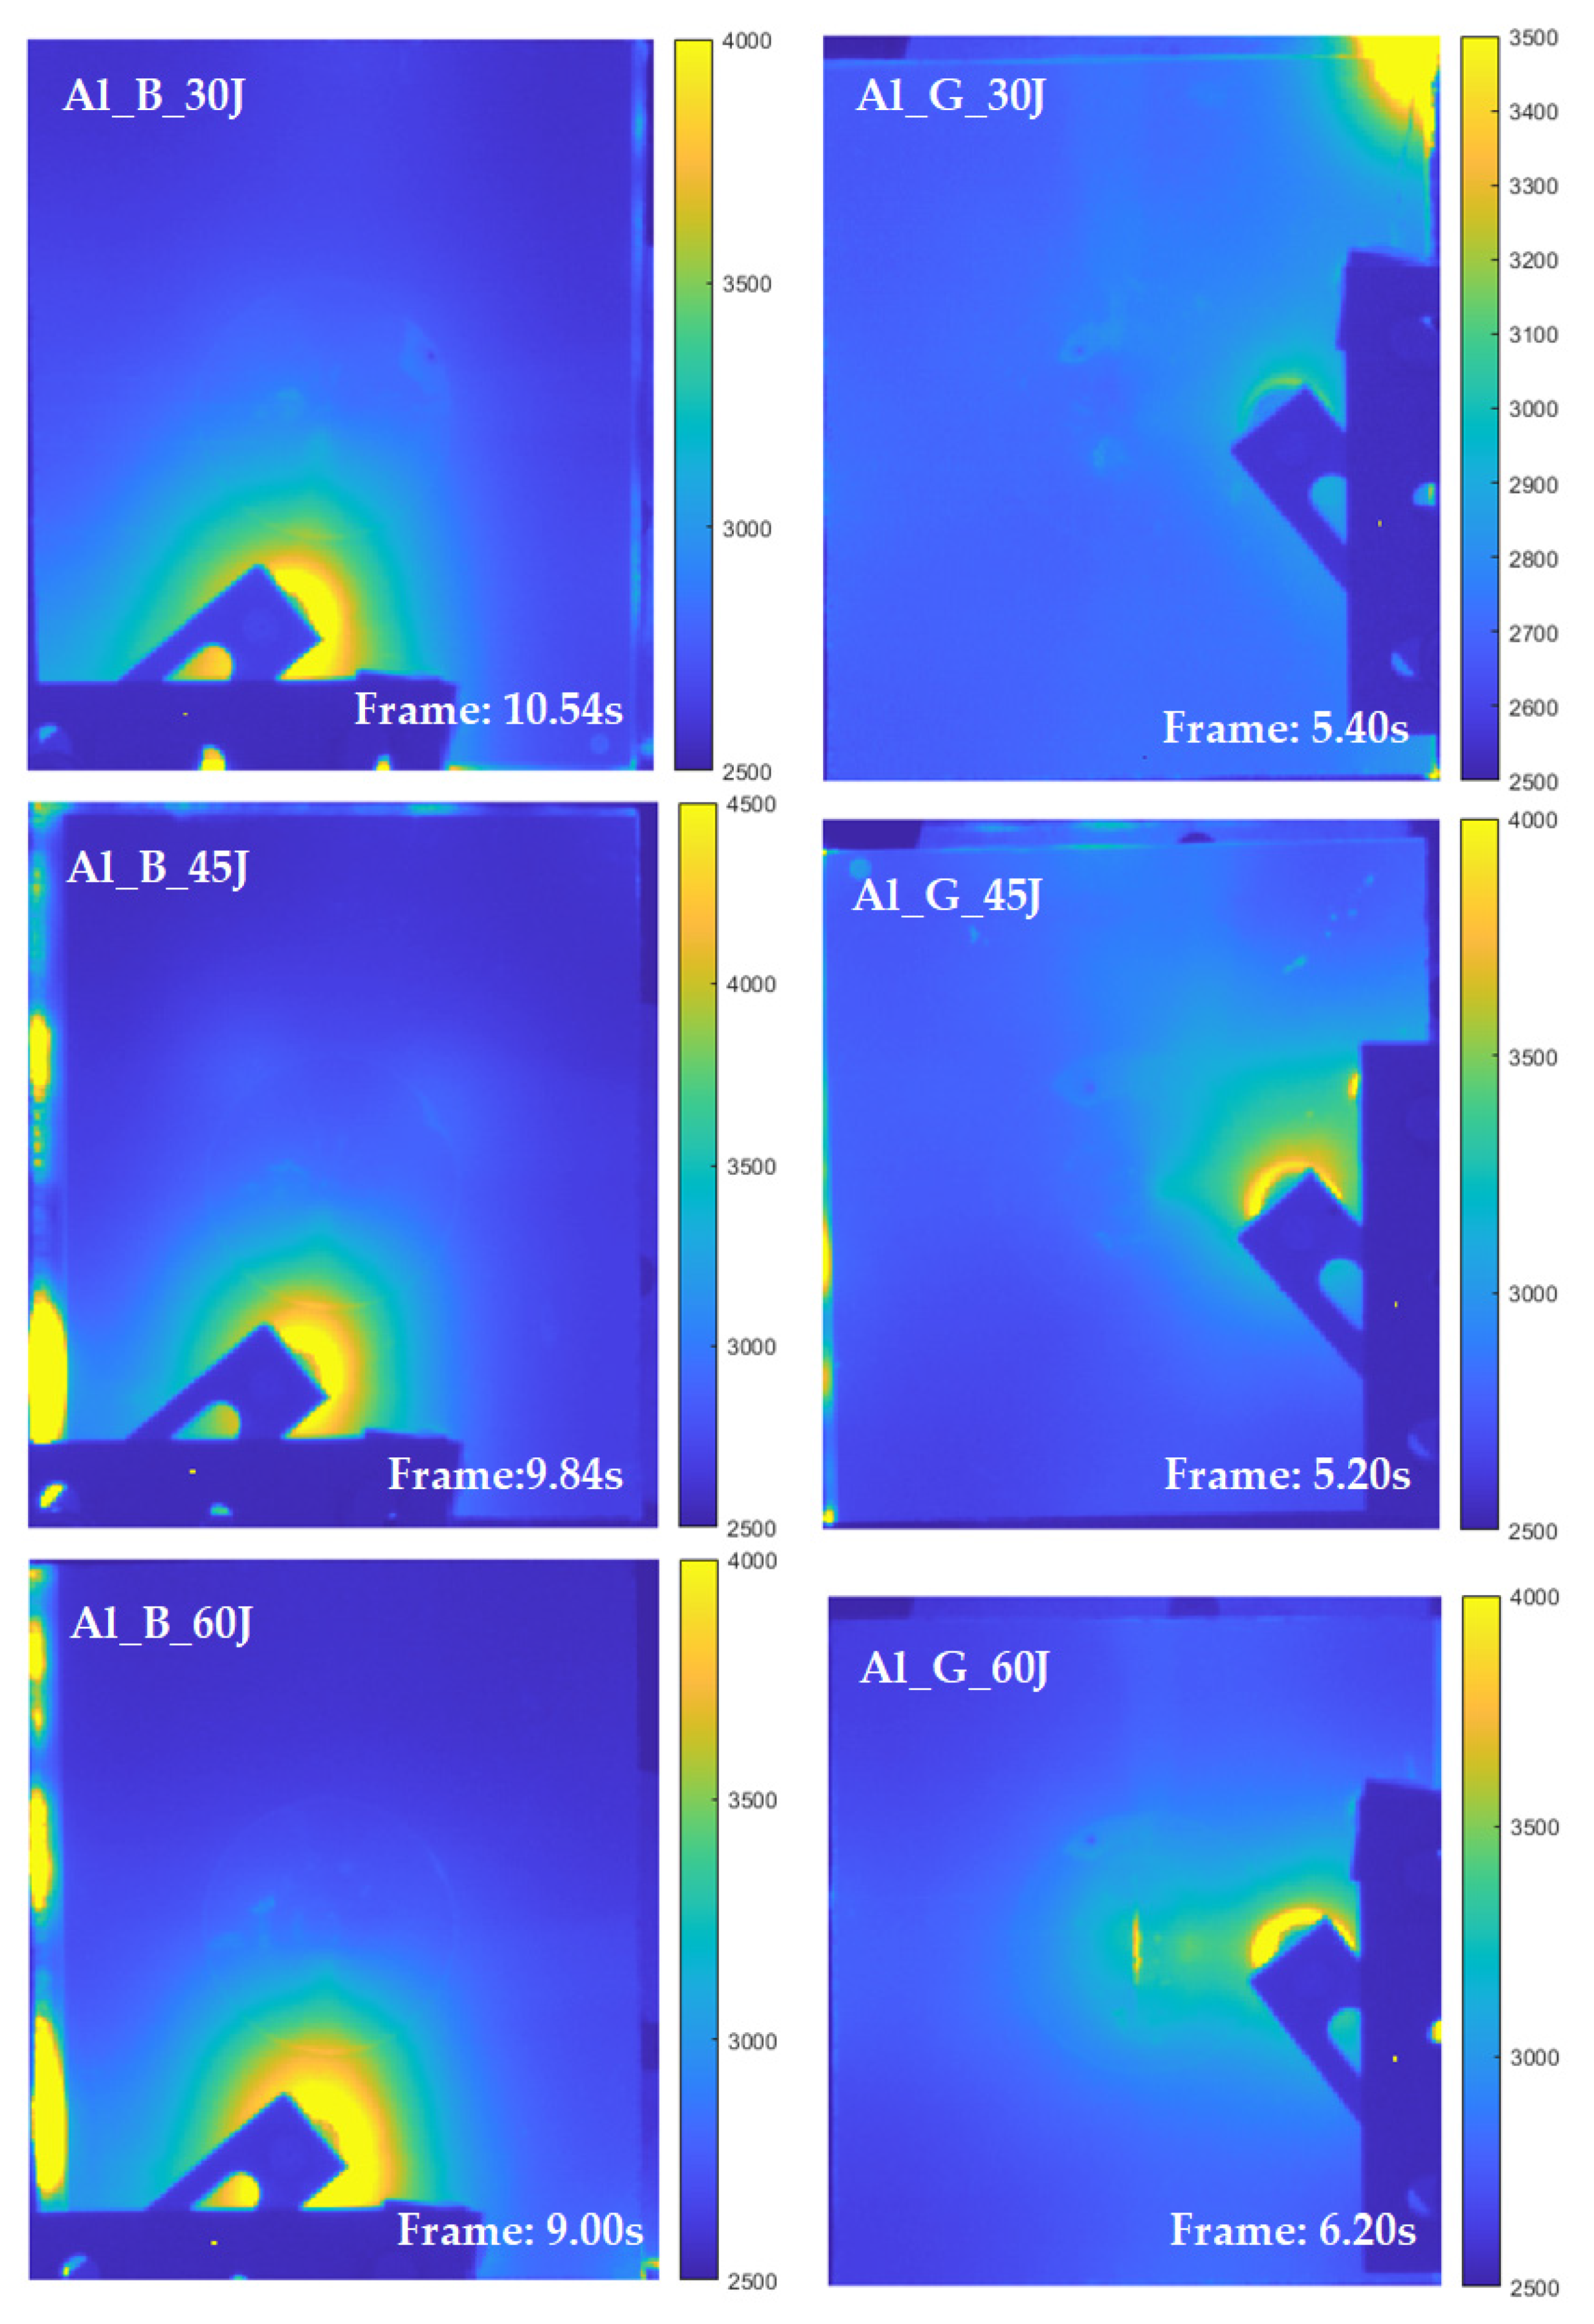
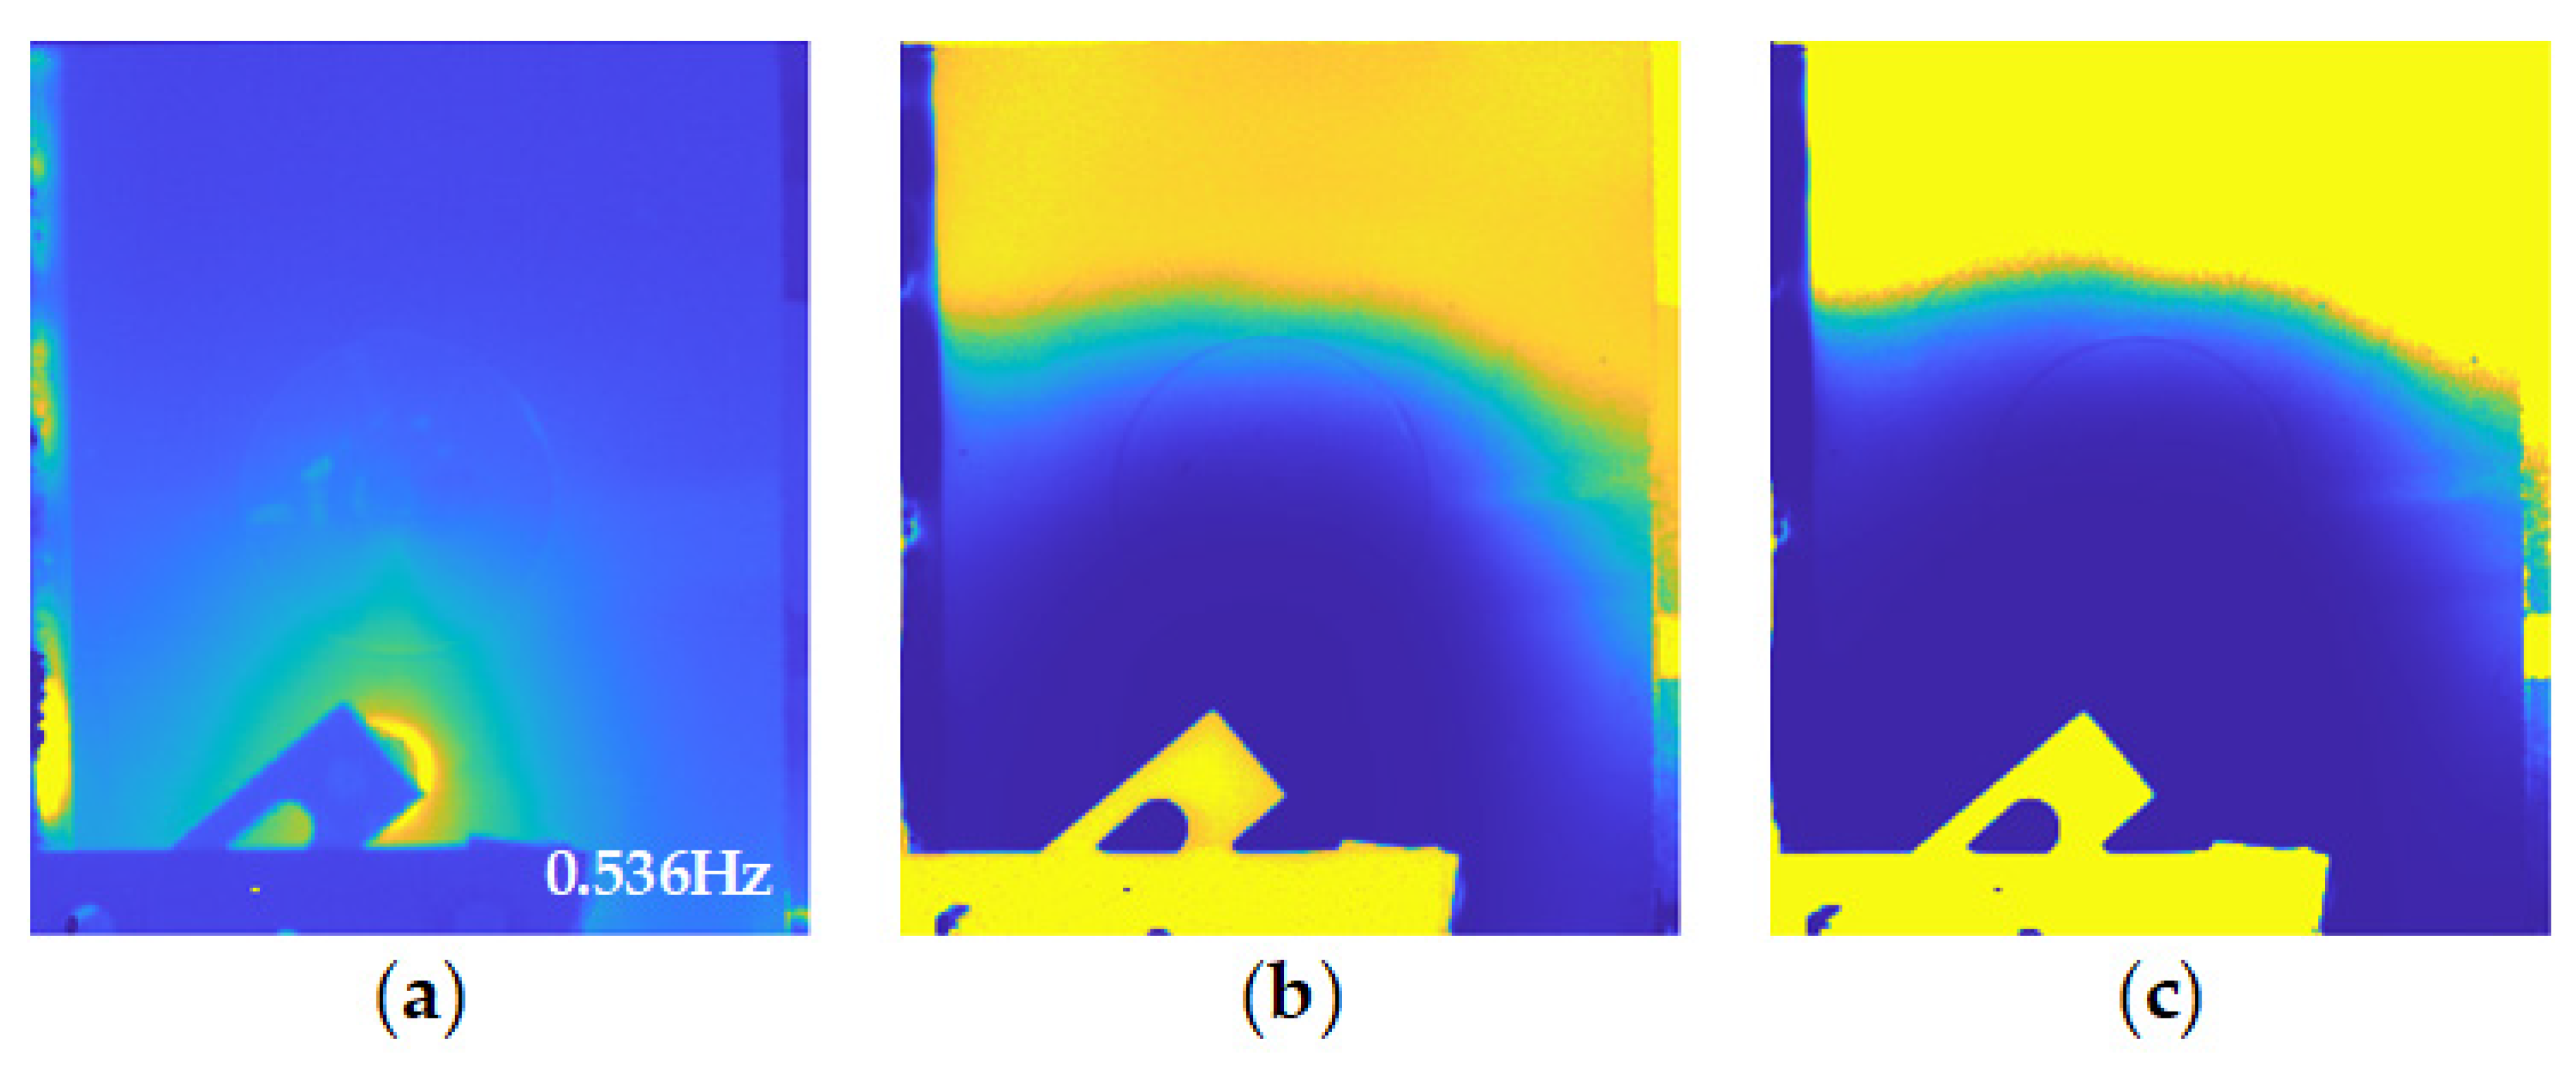
4.2. VT Features
4.3. Feature Fusion Imaging
5. Conclusions
Author Contributions
Funding
Institutional Review Board Statement
Informed Consent Statement
Data Availability Statement
Conflicts of Interest
References
- Sinmazçelik, T.; Avcu, E.; Bora, M.Ö.; Çoban, O. A Review: Fibre Metal Laminates, Background, Bonding Types and Applied Test Methods. Mater. Des. 2011, 32, 3671–3685. [Google Scholar] [CrossRef]
- Ferrante, L.; Sarasini, F.; Tirillò, J.; Lampani, L.; Valente, T.; Gaudenzi, P. Low Velocity Impact Response of Basalt-Aluminium Fibre Metal Laminates. Mater. Des. 2016, 98, 98–107. [Google Scholar] [CrossRef]
- Tang, Y.; Fang, S.; Chen, J.; Ma, L.; Li, L.; Wu, X. Axial Compression Behavior of Recycled-Aggregate-Concrete-Filled GFRP–Steel Composite Tube Columns. Eng. Struct. 2020, 216, 110676. [Google Scholar]
- Jakubczak, P.; Bienias, J. Non-Destructive Damage Detection in Fibre Metal Laminates. J. Nondestr. Eval. 2019, 38, 1–10. [Google Scholar] [CrossRef] [Green Version]
- Farias, C.T.T.; FILHO, E.F.S.; SANTOS, Y.T.B.; Matheus, S.S.; ARAÚJO, I.S. Spectral Analysis of the Propagation of Lamb Waves on Fibre-Metal Laminated Plates to Detect and Evaluate Different Defects. In Proceedings of the 18th World Conference on Nondestructive Testing, Durban, South Africa, 16–20 April 2012. [Google Scholar]
- Soltannia, B.; Mertiny, P.; Taheri, F. Static and Dynamic Characteristics of Nano-Reinforced 3D-Fiber Metal Laminates Using Non-Destructive Techniques. J. Sandwich Struct. Mater. 2020. [Google Scholar] [CrossRef]
- Tang, Y.; Li, L.; Wang, C.; Chen, M.; Feng, W.; Zou, X.; Huang, K. Real-Time Detection of Surface Deformation and Strain in Recycled Aggregate Concrete-Filled Steel Tubular Columns via Four-Ocular Vision. Rob. Comput. Integr. Manuf. 2019, 59, 36–46. [Google Scholar] [CrossRef]
- Chen, M.; Tang, Y.; Zou, X.; Huang, K.; Li, L.; He, Y. High-Accuracy Multi-Camera Reconstruction Enhanced by Adaptive Point Cloud Correction Algorithm. Opt. Lasers Eng. 2019, 122, 170–183. [Google Scholar] [CrossRef]
- Yang, R.; He, Y. Optically and Non-Optically Excited Thermography for Composites: A Review. Infrared Phys. Technol. 2016, 75, 26–50. [Google Scholar] [CrossRef]
- Ciampa, F.; Mahmoodi, P.; Pinto, F.; Meo, M. Recent Advances in Active Infrared Thermography for Non-Destructive Testing of Aerospace Components. Sensors 2018, 18, 609. [Google Scholar] [CrossRef] [Green Version]
- Schroeder, J.A.; Ahmed, T.; Chaudhry, B.; Shepard, S. Non-Destructive Testing of Structural Composites and Adhesively Bonded Composite Joints: Pulsed Thermography. Compos. Part A 2002, 33, 1511–1517. [Google Scholar] [CrossRef]
- Montanini, R.; Freni, F. Non-Destructive Evaluation of Thick Glass Fiber-Reinforced Composites by Means of Optically Excited Lock-in Thermography. Compos. Part A 2012, 43, 2075–2082. [Google Scholar] [CrossRef]
- Zhang, H.; Robitaille, F.; Grosse, C.U.; Ibarra-Castanedo, C.; Martins, J.O.; Sfarra, S.; Maldague, X.P.V. Optical Excitation Thermography for Twill/Plain Weaves and Stitched Fabric Dry Carbon Fibre Preform Inspection. Compos. Part A 2018, 107, 282–293. [Google Scholar] [CrossRef] [Green Version]
- Sam-Ang, K.; Didier, D.; Florin, B.; Franck, B. Comparison between Microwave Infrared Thermography and CO 2 Laser Infrared Thermography in Defect Detection in Applications with CFRP. Mater. Sci. Appl. 2013, 4, 10. [Google Scholar]
- Montinaro, N.; Cerniglia, D.; Pitarresi, G. Detection and Characterisation of Disbonds on Fibre Metal Laminate Hybrid Composites by Flying Laser Spot Thermography. Compos. Part B 2017, 108, 164–173. [Google Scholar] [CrossRef]
- Polimeno, U.; Almond, D.P.; Weekes, B.; Chen, E.W.J. A Compact Thermosonic Inspection System for the Inspection of Composites. Composites Part B 2014, 59, 67–73. [Google Scholar] [CrossRef]
- Castelo, A.; Mendioroz, A.; Celorrio, R.; Salazar, A. Optimizing the Inversion Protocol to Determine the Geometry of Vertical Cracks from Lock-in Vibrothermography. J. Nondestr. Eval. 2017, 36, 1–12. [Google Scholar] [CrossRef]
- He, Y.; Chen, S.; Zhou, D.; Huang, S.; Wang, P. Shared Excitation Based Nonlinear Ultrasound and Vibrothermography Testing for CFRP Barely Visible Impact Damage Inspection. IEEE Trans. Ind. Inf. 2018, 14, 5575–5584. [Google Scholar] [CrossRef]
- Cheng, L.; Tian, G.Y. Transient Thermal Behavior of Eddy-Current Pulsed Thermography for Nondestructive Evaluation of Composites. IEEE Trans. Instrum. Meas. 2013, 62, 1215–1222. [Google Scholar] [CrossRef]
- Yang, R.; He, Y.; Mandelis, A.; Wang, N.; Wu, X.; Huang, S. Induction Infrared Thermography and Thermal-Wave-Radar Analysis for Imaging Inspection and Diagnosis of Blade Composites. IEEE Trans. Ind. Inf. 2018, 14, 5637–5647. [Google Scholar] [CrossRef]
- Montinaro, N.; Cerniglia, D.; Pitarresi, G. Evaluation of Interlaminar Delaminations in Titanium-Graphite Fibre Metal Laminates by Infrared NDT Techniques. NDT E Int. 2018, 98, 134–146. [Google Scholar] [CrossRef]
- Sarasini, F.; Tirillò, J.; Ferrante, L.; Sergi, C.; Sbardella, F.; Russo, P.; Simeoli, G.; Mellier, D.; Calzolari, A. Effect of Temperature and Fiber Type on Impact Behavior of Thermoplastic Fiber Metal Laminates. Compos. Struct. 2019, 223, 110961. [Google Scholar] [CrossRef]
- Tan, W.; Tiwari, P.; Pandey, H.M.; Moreira, C.; Jaiswal, A.K. Multimodal Medical Image Fusion Algorithm in the Era of Big Data. Neural Comput. Appl. 2020, 1–21. [Google Scholar] [CrossRef]
- Madruga, F.J.; Ibarra-Castanedo, C.; Conde, O.M.; López-Higuera, J.M.; Maldague, X. Infrared Thermography Processing Based on Higher-Order Statistics. NDT E Int. 2010, 43, 661–666. [Google Scholar] [CrossRef]


| Materials | Modulus of Elasticity (GPa) | Ultimate Tensile Strength (MPa) | Elongation at Break (%) |
|---|---|---|---|
| Aluminium 2024-T3 | 73.1 | 483.0 | 18 |
| Basalt fibres | 89 | 3530 | 3.15 |
| Glass fibres | 77 | 3450 | 4.7 |
| Remark of the Laminates | Stacking Sequence | Thickness [mm] | Areal Density [kg/m3] | Fibre Volume Fraction | Metal Volume Fraction |
|---|---|---|---|---|---|
| Al_B | |||||
| Al_G |
| FMLs | Features from PT | Features from VT |
|---|---|---|
| Al_B_30J | Time | Frequency |
| Al_B_45J | Frequency | Frequency |
| Al_B_60J | Time | Frequency |
| Al_G_30J | Frequency | Frequency |
| Al_G_45J | Time | Frequency |
| Al_G_60J | Time | Frequency |
Publisher’s Note: MDPI stays neutral with regard to jurisdictional claims in published maps and institutional affiliations. |
© 2021 by the authors. Licensee MDPI, Basel, Switzerland. This article is an open access article distributed under the terms and conditions of the Creative Commons Attribution (CC BY) license (https://creativecommons.org/licenses/by/4.0/).
Share and Cite
Hu, J.; Zhang, H.; Sfarra, S.; Perilli, S.; Sergi, C.; Sarasini, F.; Maldague, X. Multi-Excitation Infrared Fusion for Impact Evaluation of Aluminium-BFRP/GFRP Hybrid Composites. Sensors 2021, 21, 5961. https://doi.org/10.3390/s21175961
Hu J, Zhang H, Sfarra S, Perilli S, Sergi C, Sarasini F, Maldague X. Multi-Excitation Infrared Fusion for Impact Evaluation of Aluminium-BFRP/GFRP Hybrid Composites. Sensors. 2021; 21(17):5961. https://doi.org/10.3390/s21175961
Chicago/Turabian StyleHu, Jue, Hai Zhang, Stefano Sfarra, Stefano Perilli, Claudia Sergi, Fabrizio Sarasini, and Xavier Maldague. 2021. "Multi-Excitation Infrared Fusion for Impact Evaluation of Aluminium-BFRP/GFRP Hybrid Composites" Sensors 21, no. 17: 5961. https://doi.org/10.3390/s21175961
APA StyleHu, J., Zhang, H., Sfarra, S., Perilli, S., Sergi, C., Sarasini, F., & Maldague, X. (2021). Multi-Excitation Infrared Fusion for Impact Evaluation of Aluminium-BFRP/GFRP Hybrid Composites. Sensors, 21(17), 5961. https://doi.org/10.3390/s21175961