
Absence of Surface Water Temperature Trends in Lake Kinneret despite Present Atmospheric Warming: Comparisons with Dead Sea Trends


Abstract
1. Introduction
2. Materials and Methods
3. Results
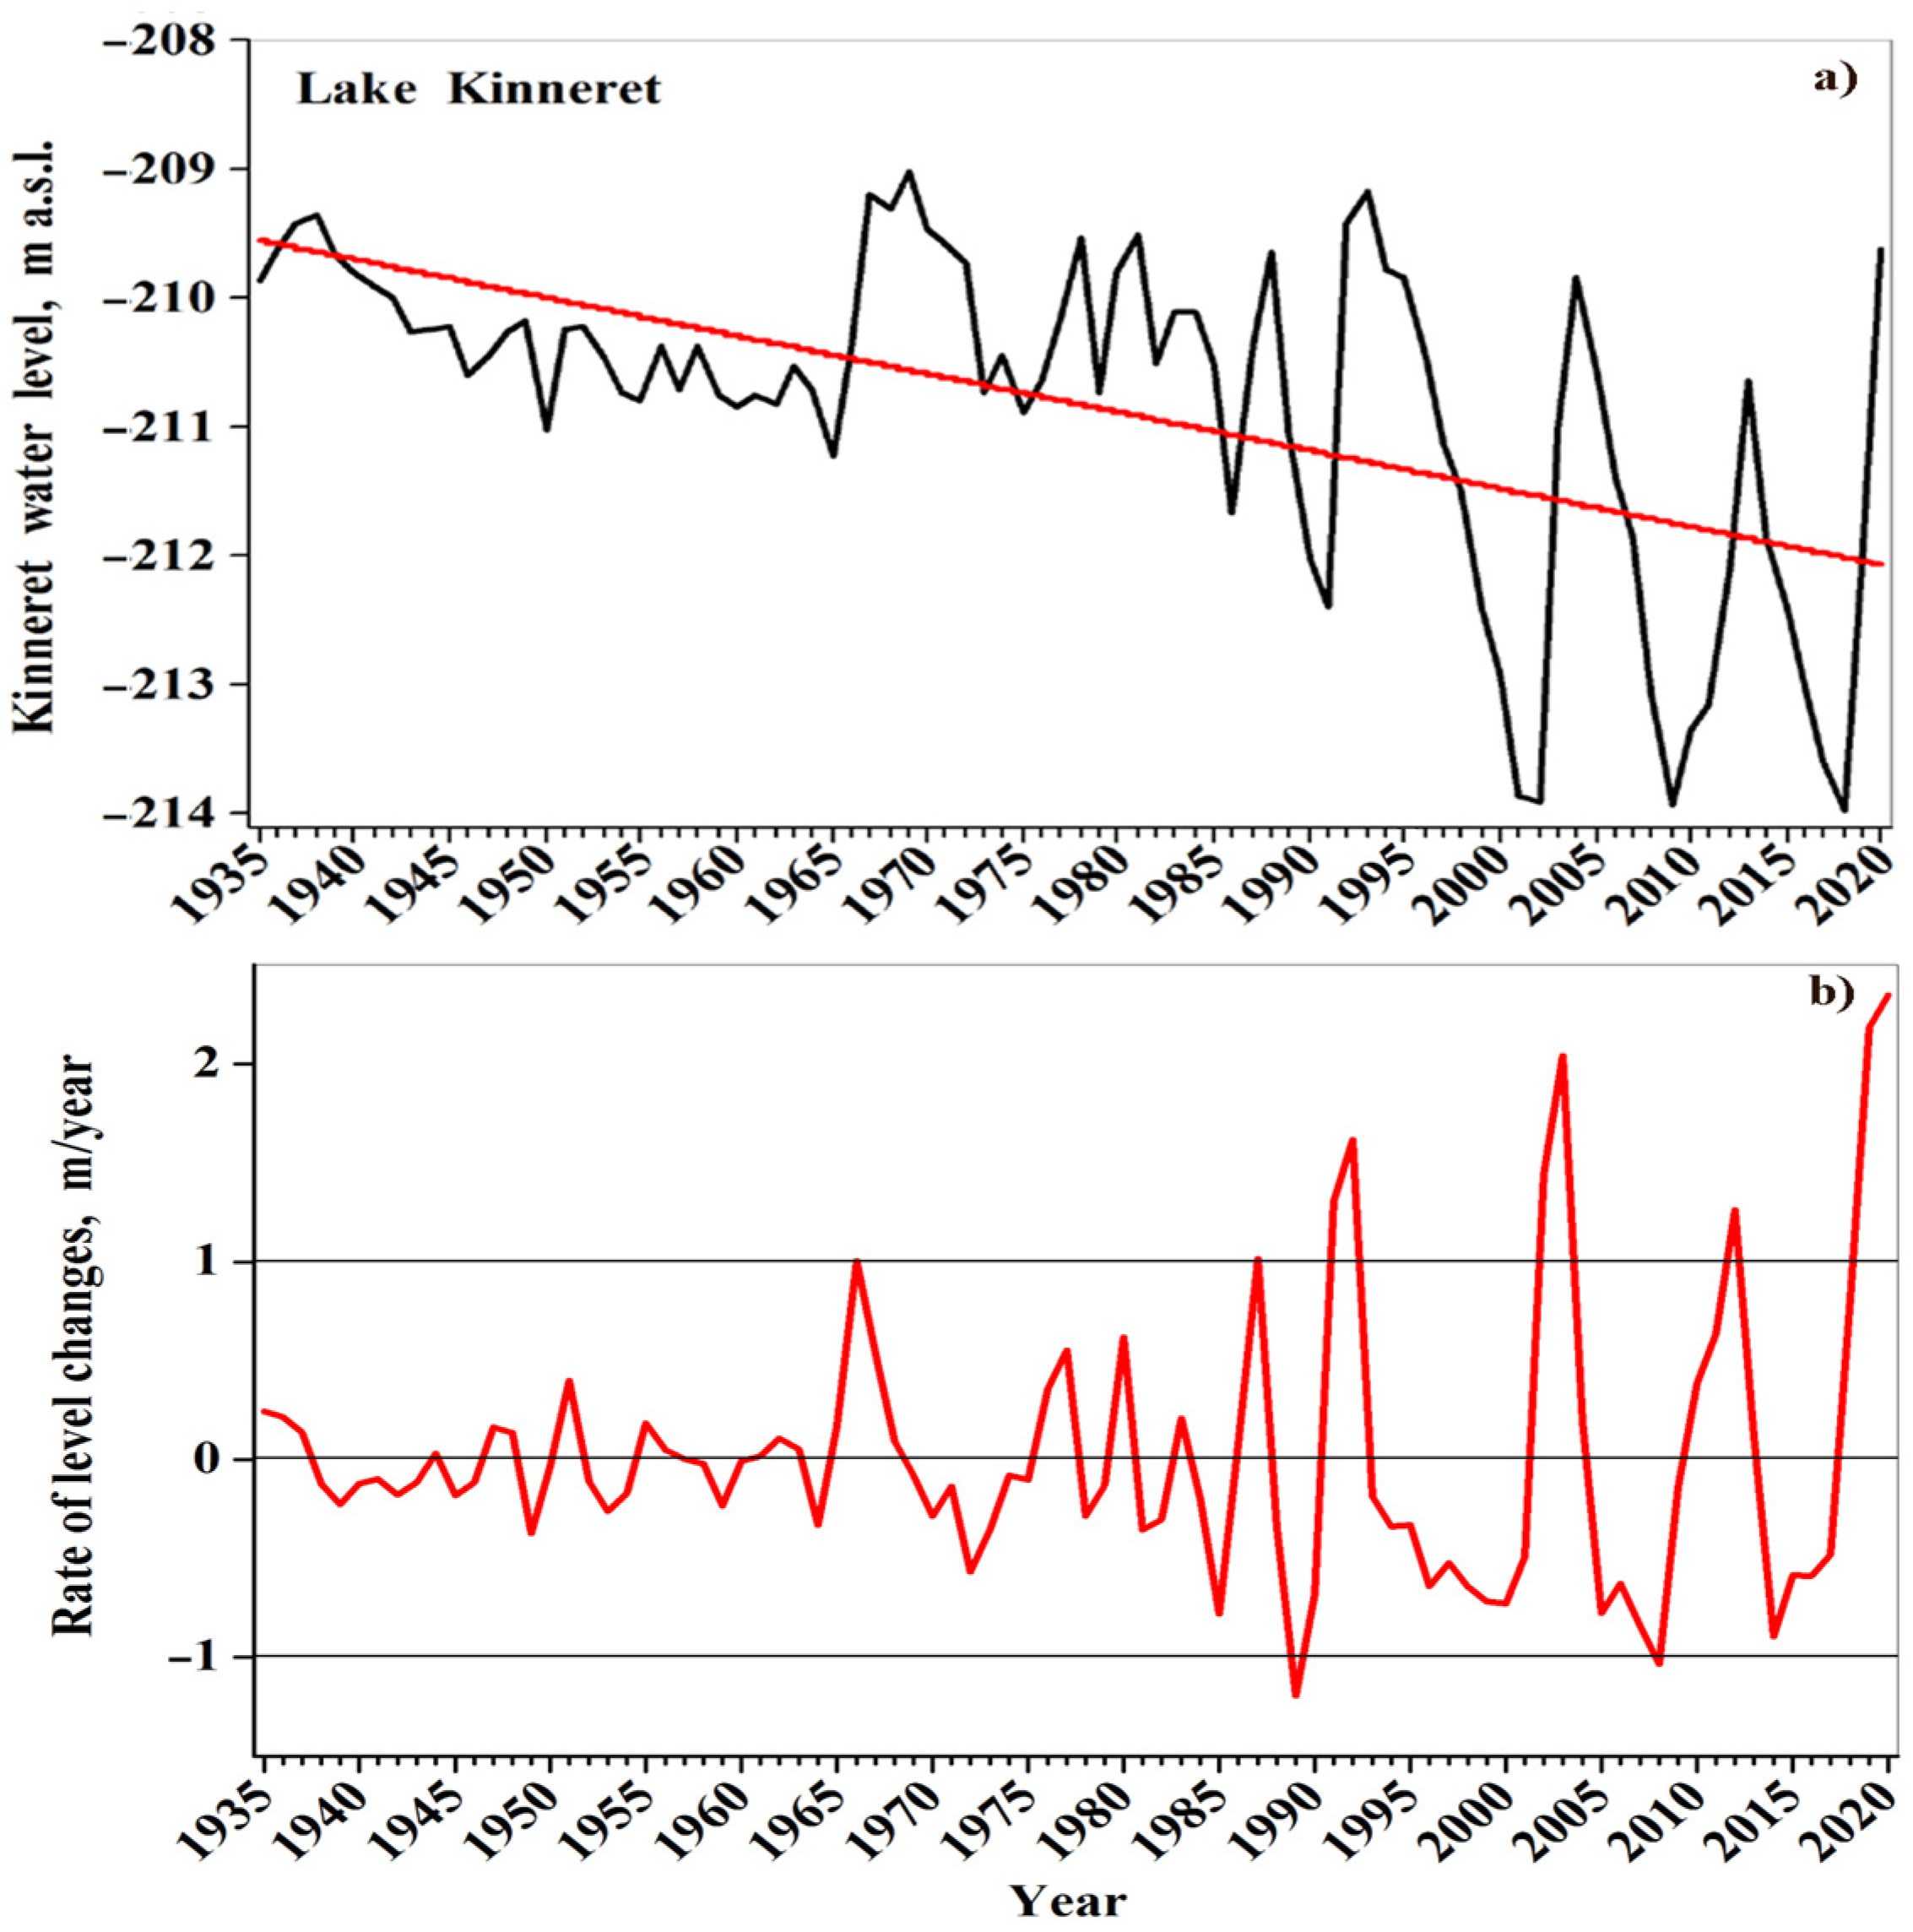
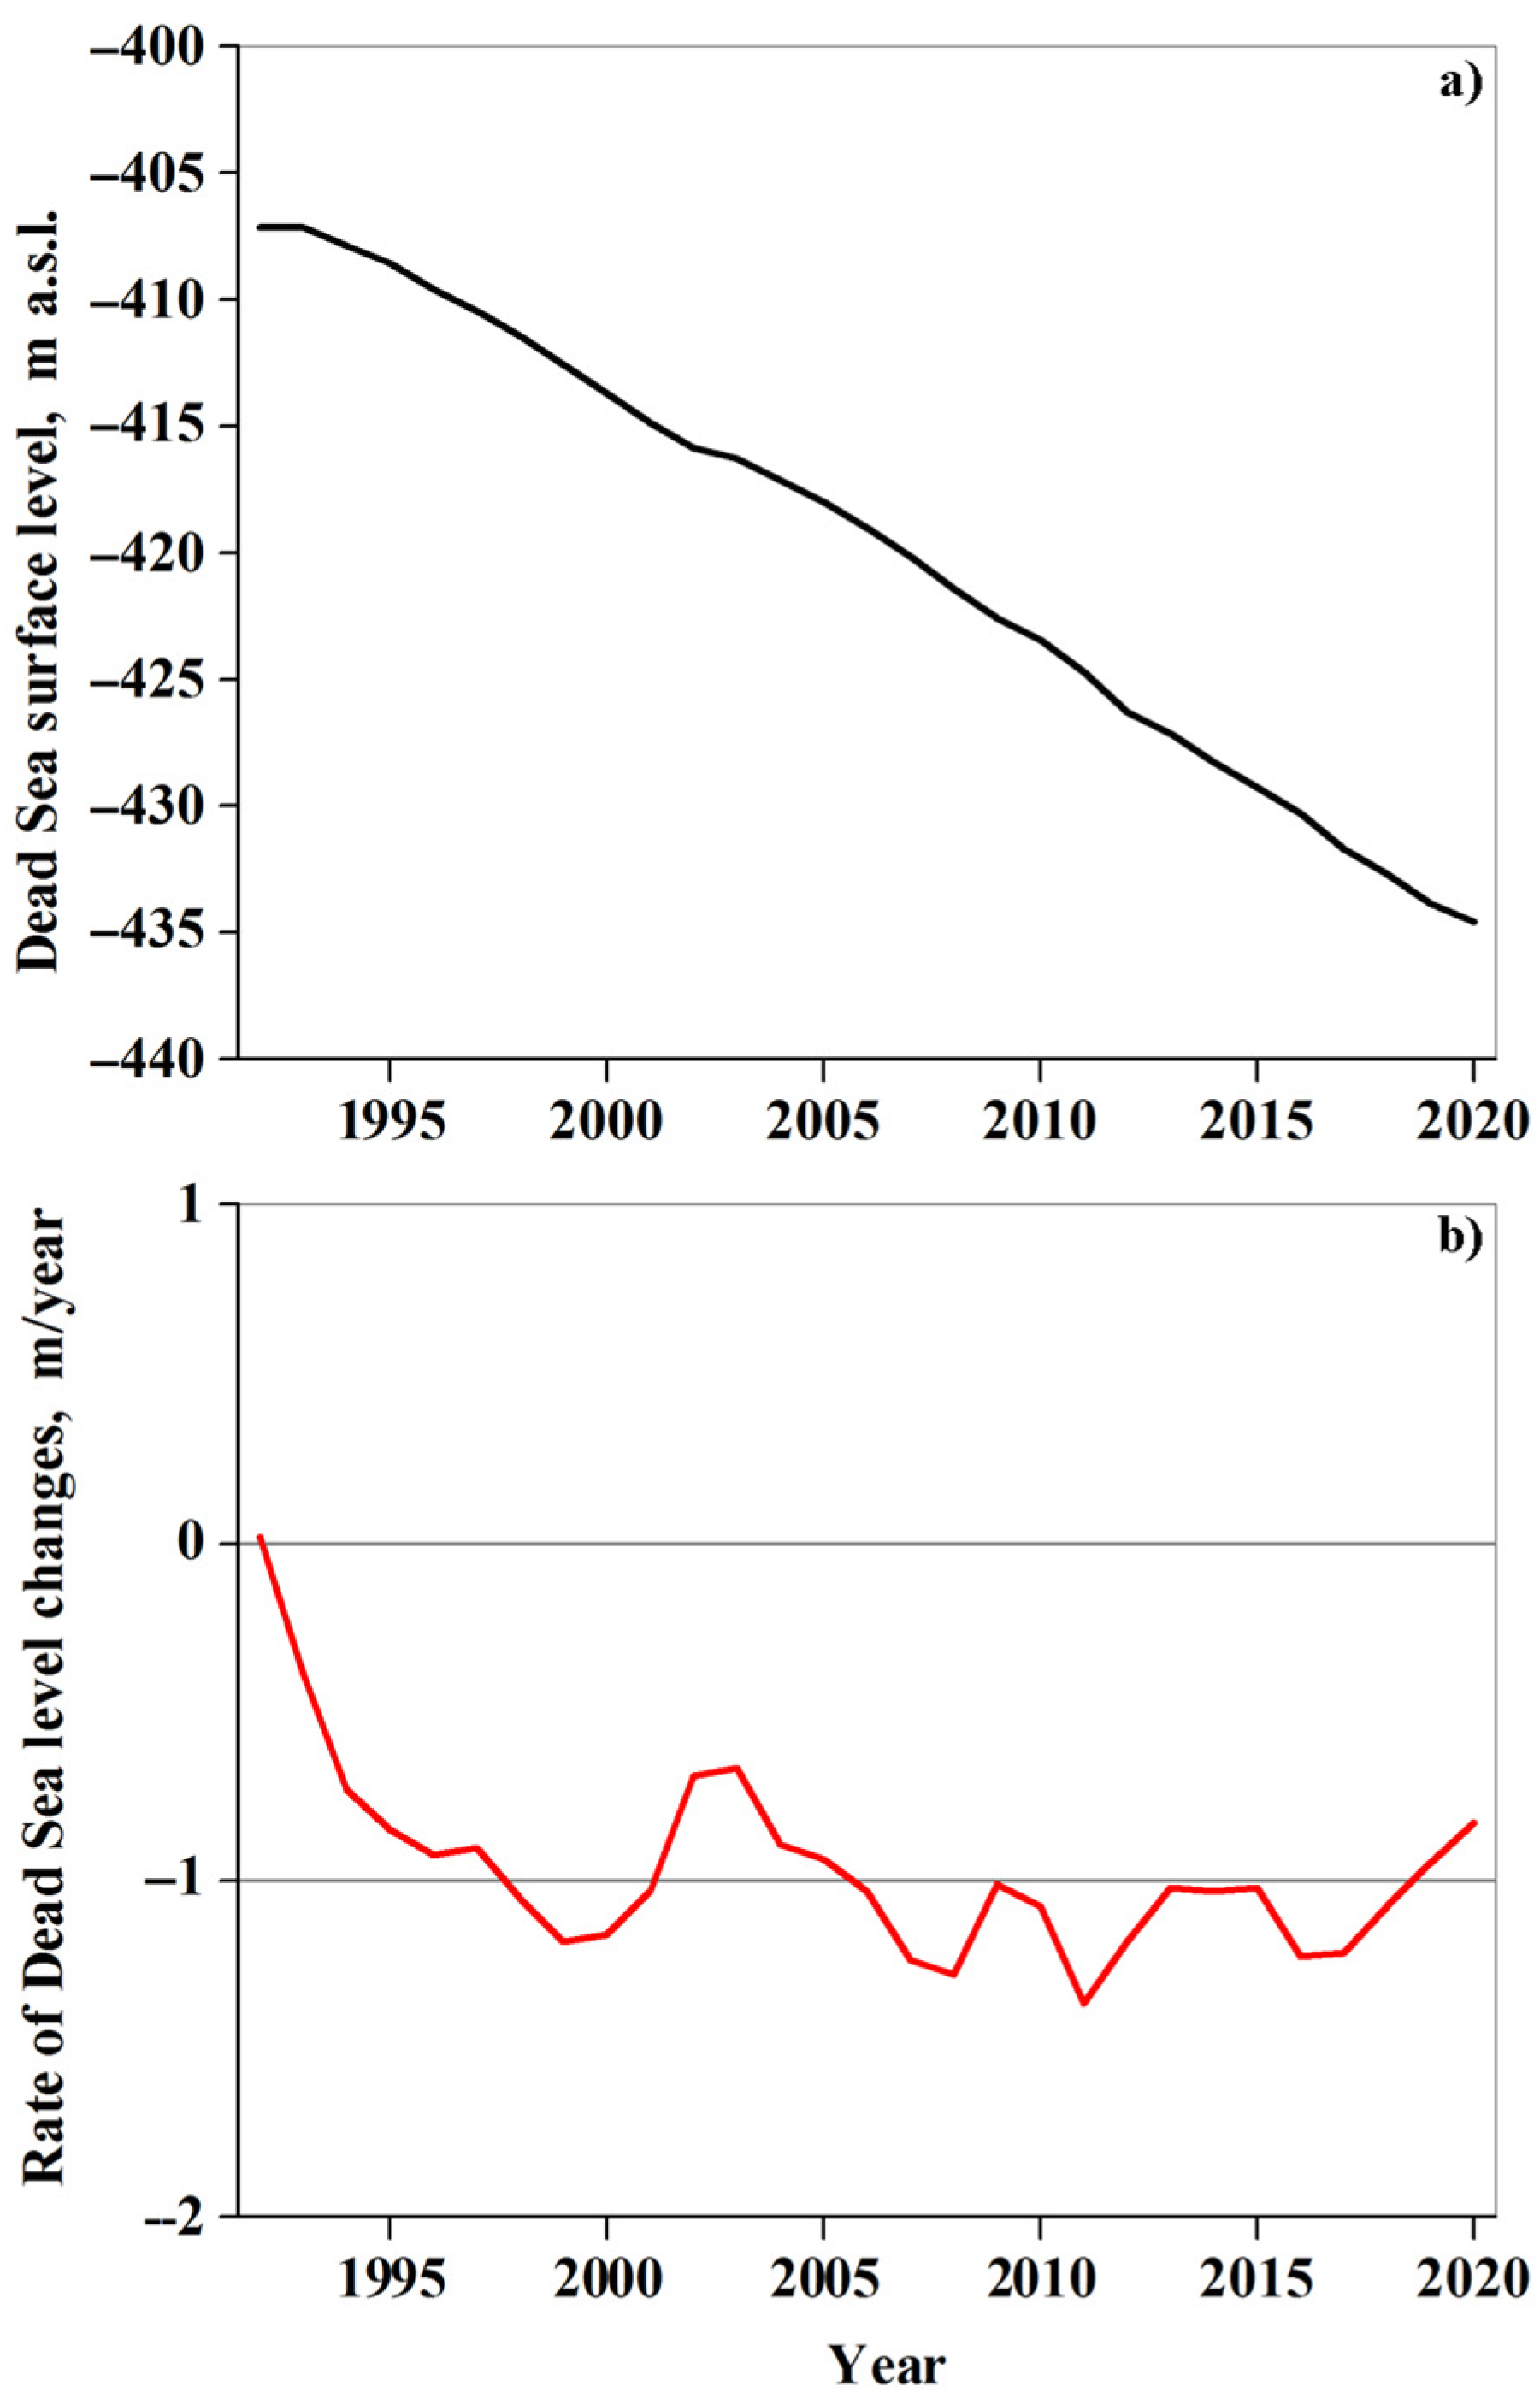
3.1. Long-Term Changes in Kinneret Water Levels
3.2. Long-Term Water Temperature Trends Based on In-Situ Measurements for All Months
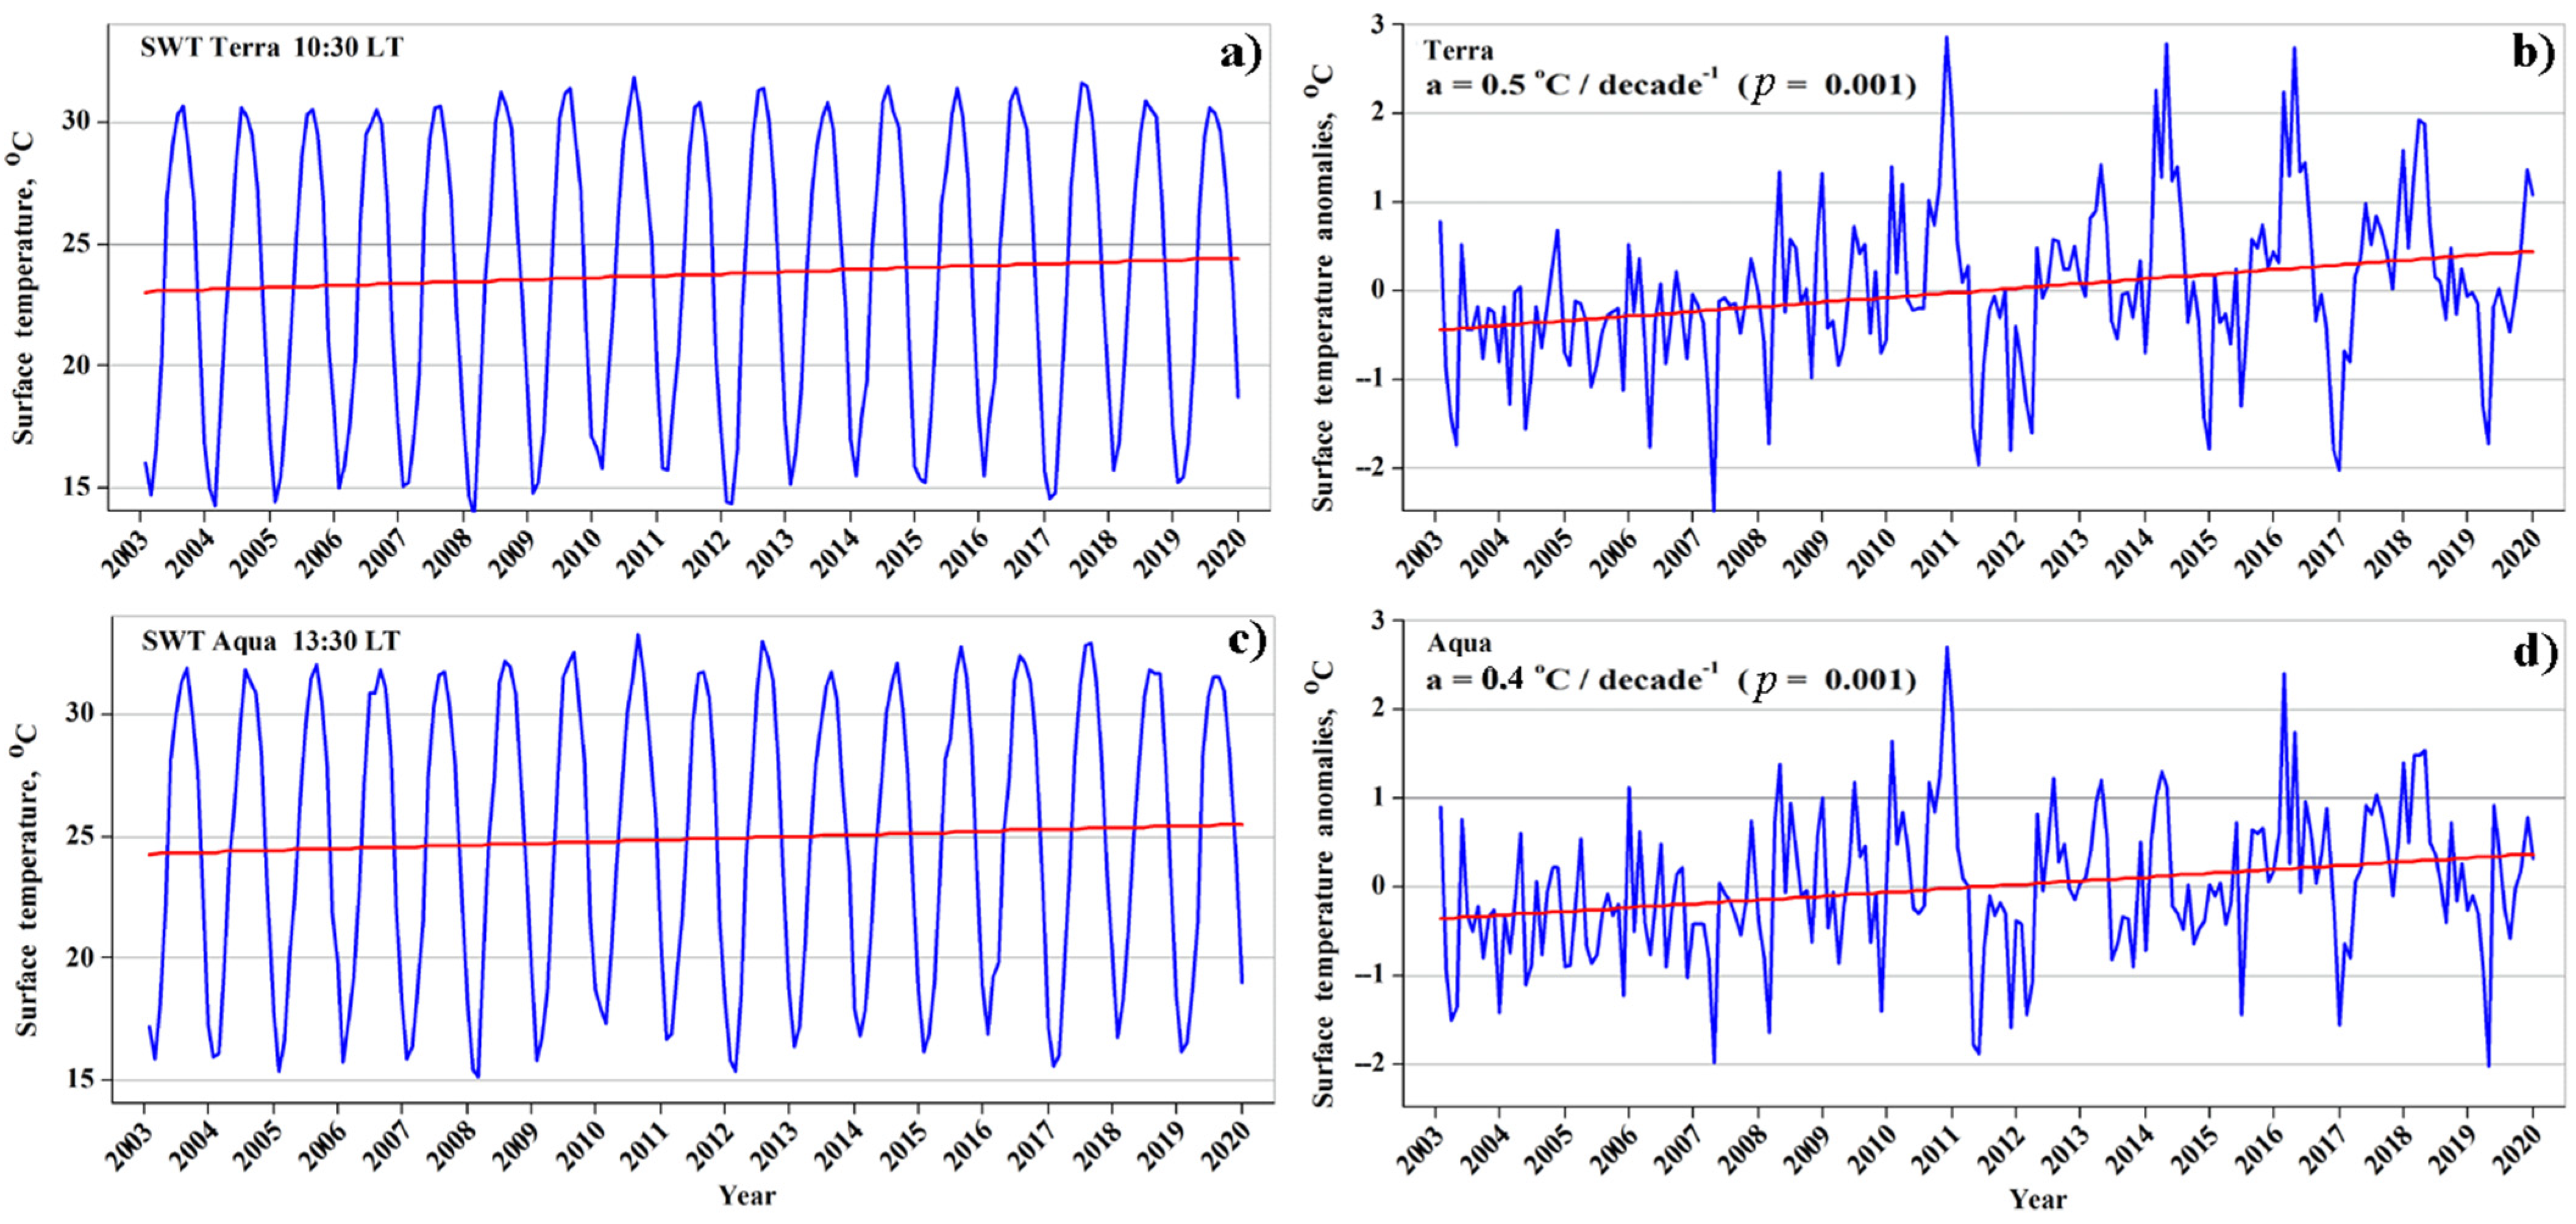
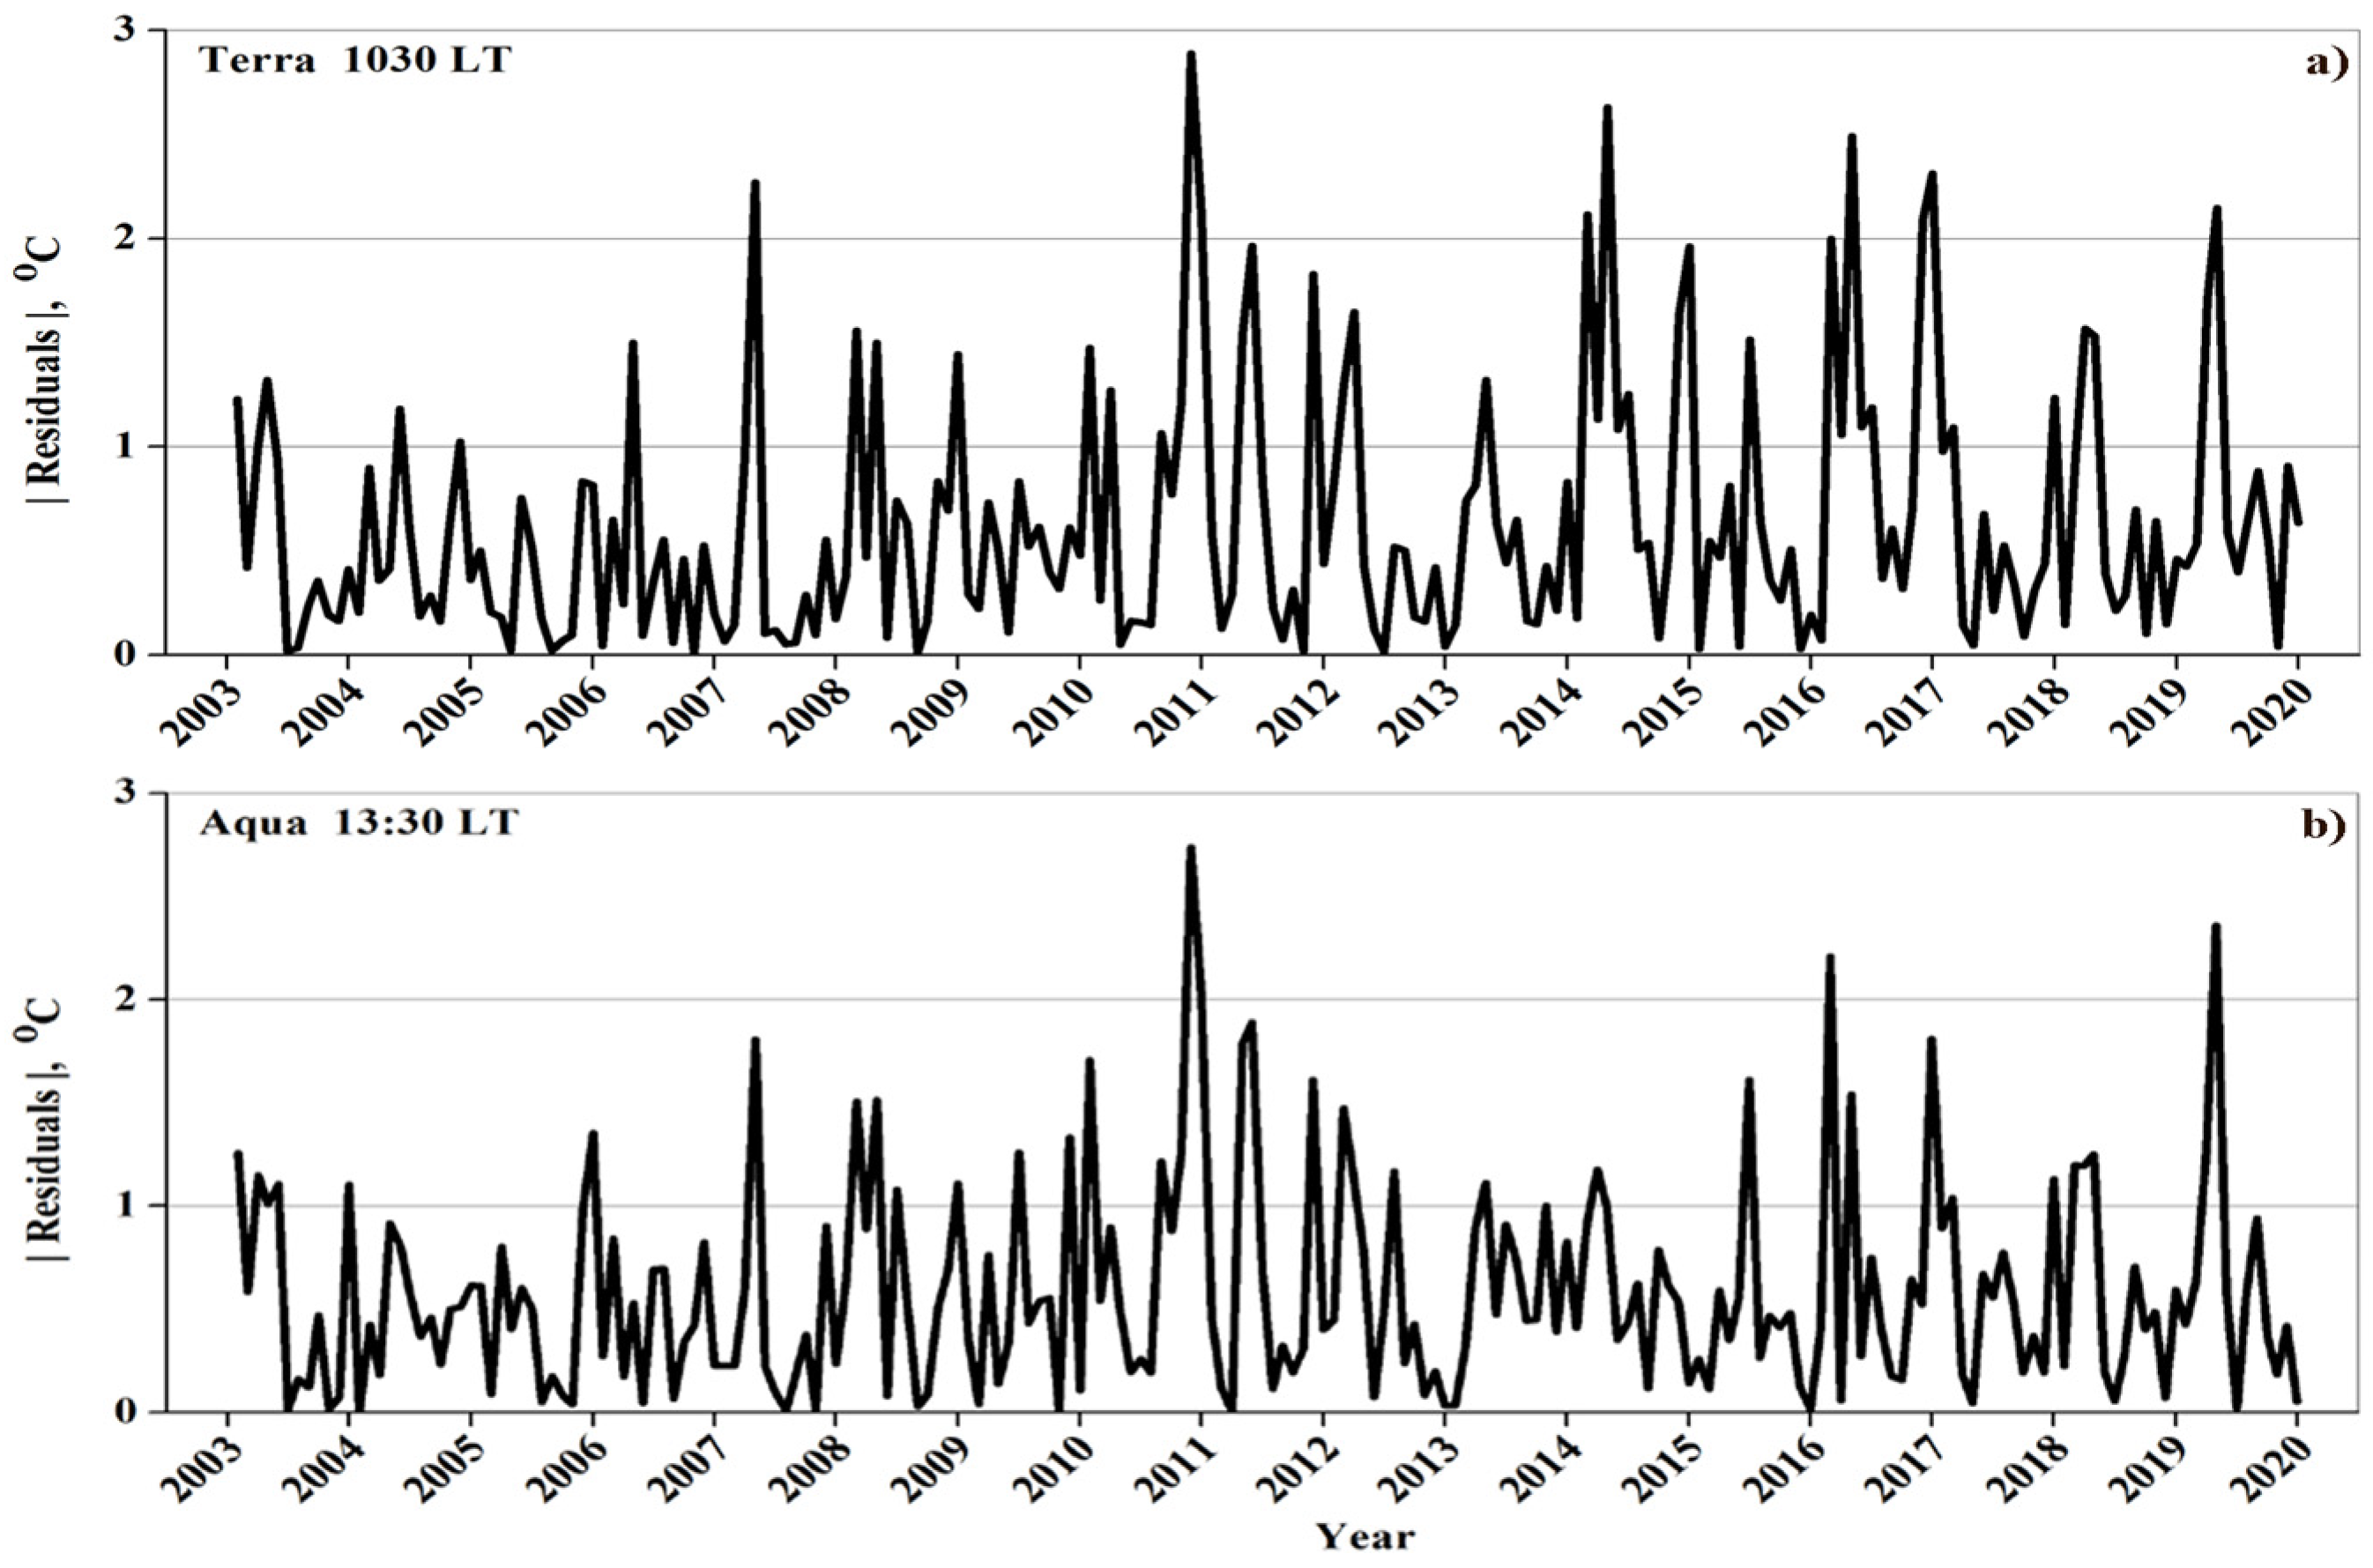
3.3. Trends in Daytime MODIS-Based SWT in Lake Kinneret for All Months
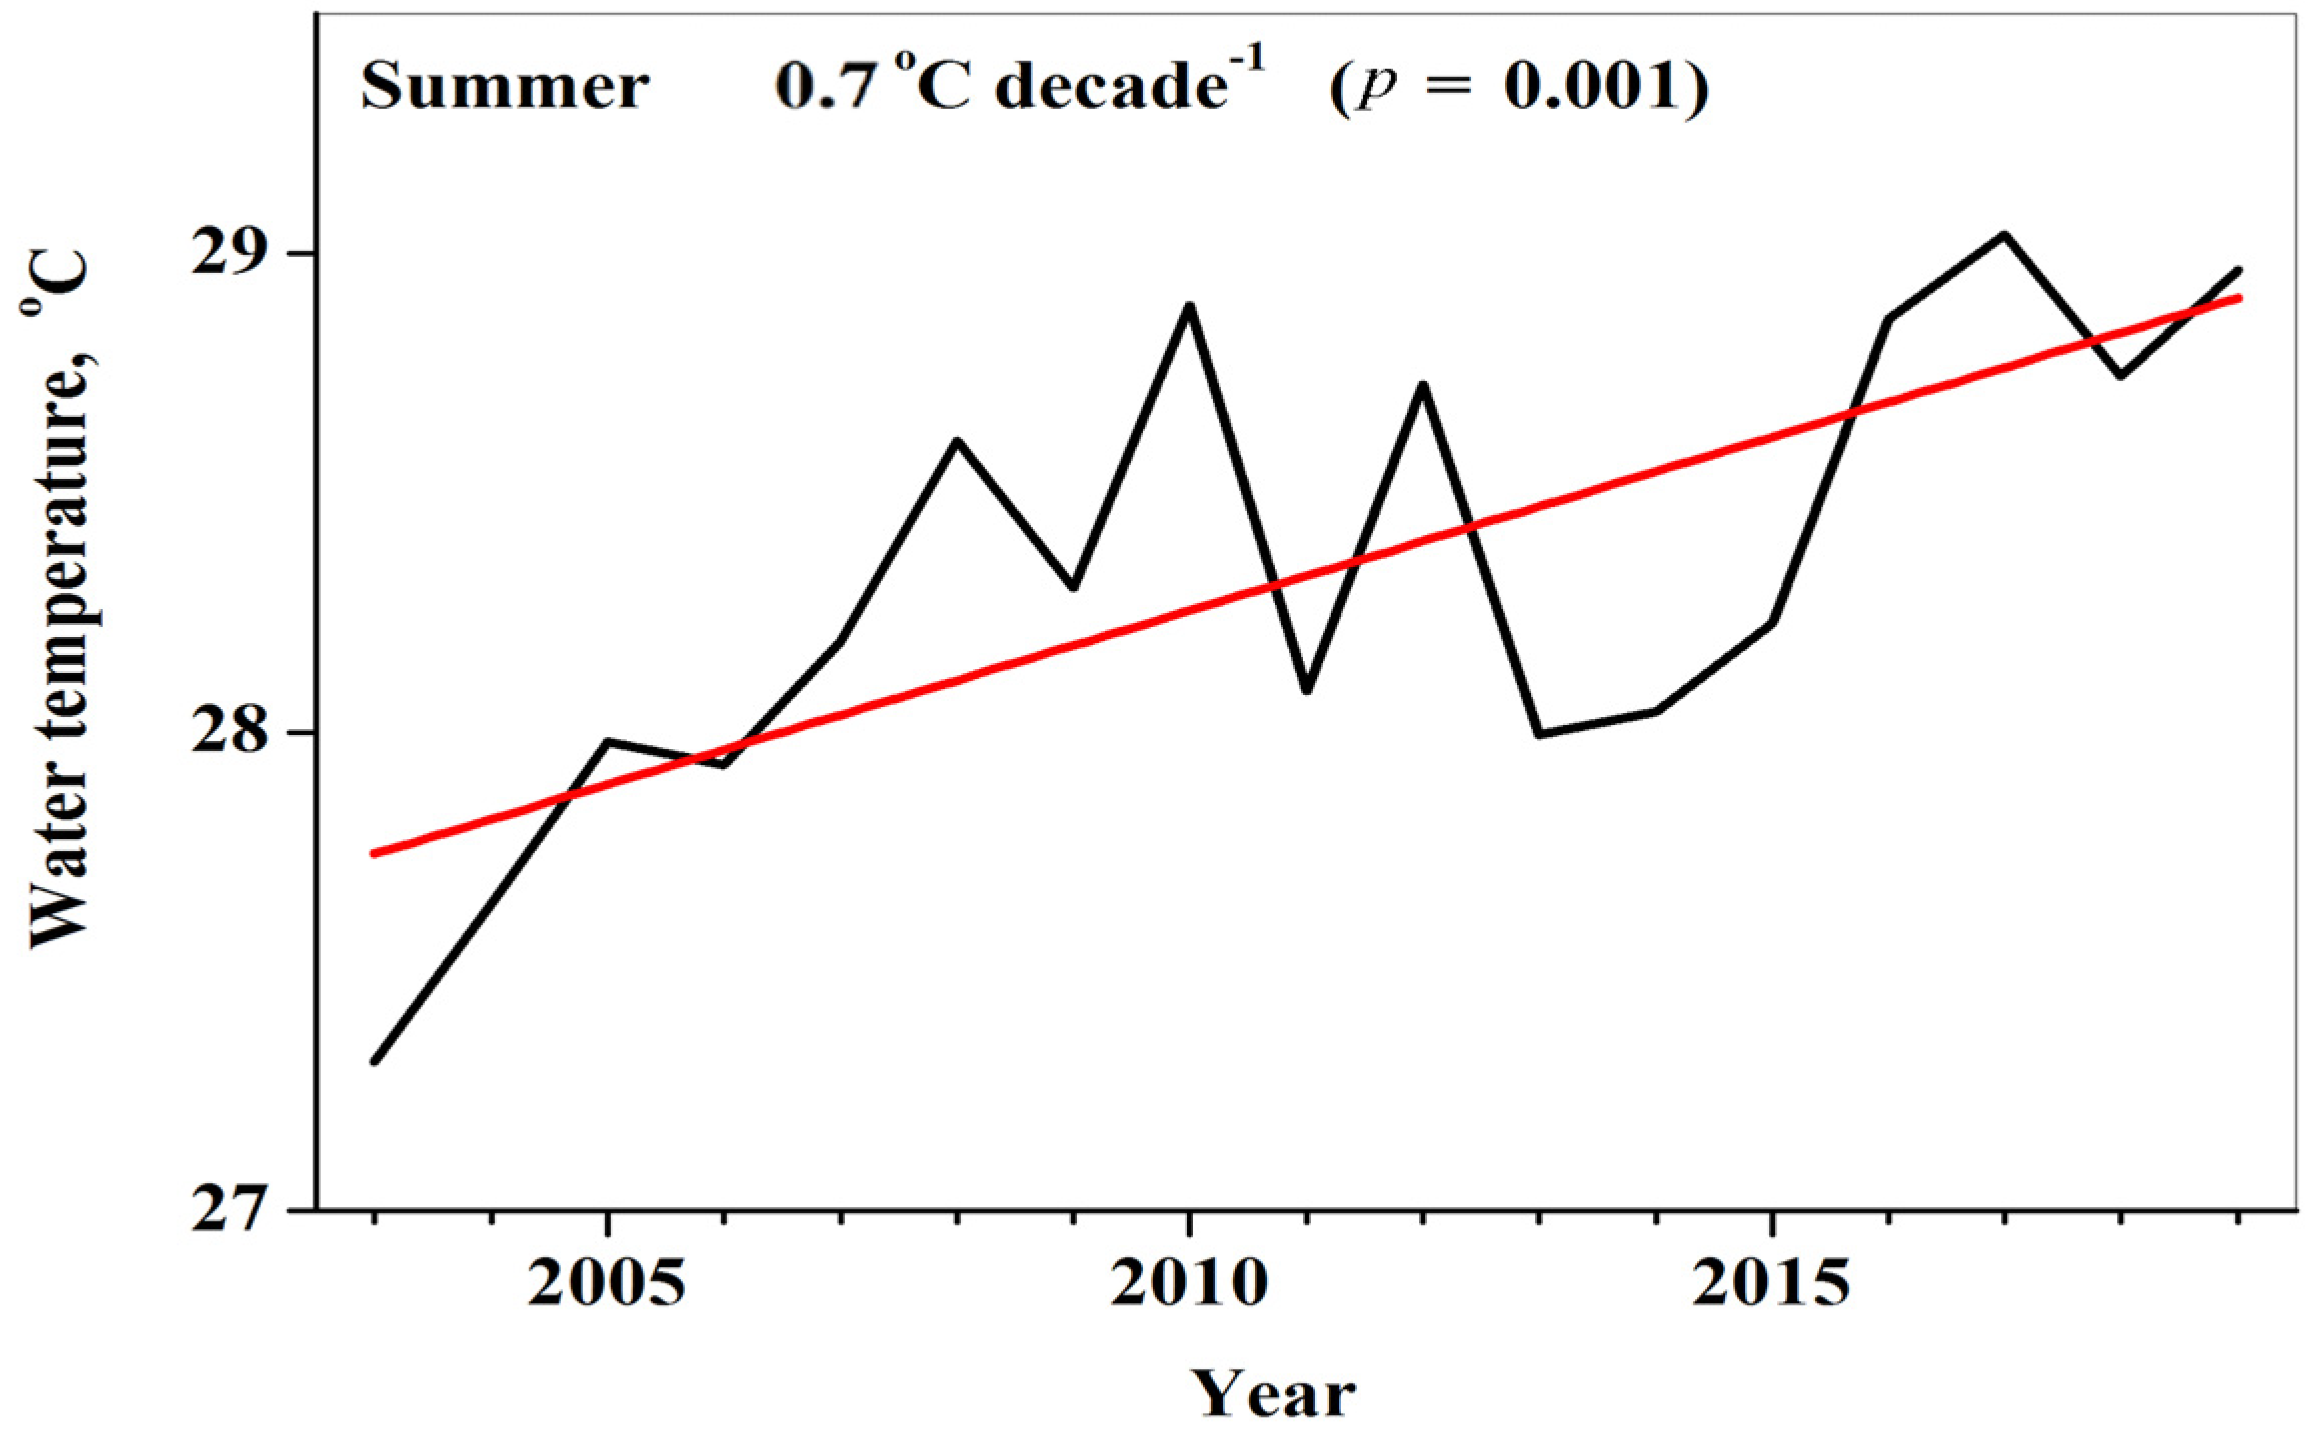
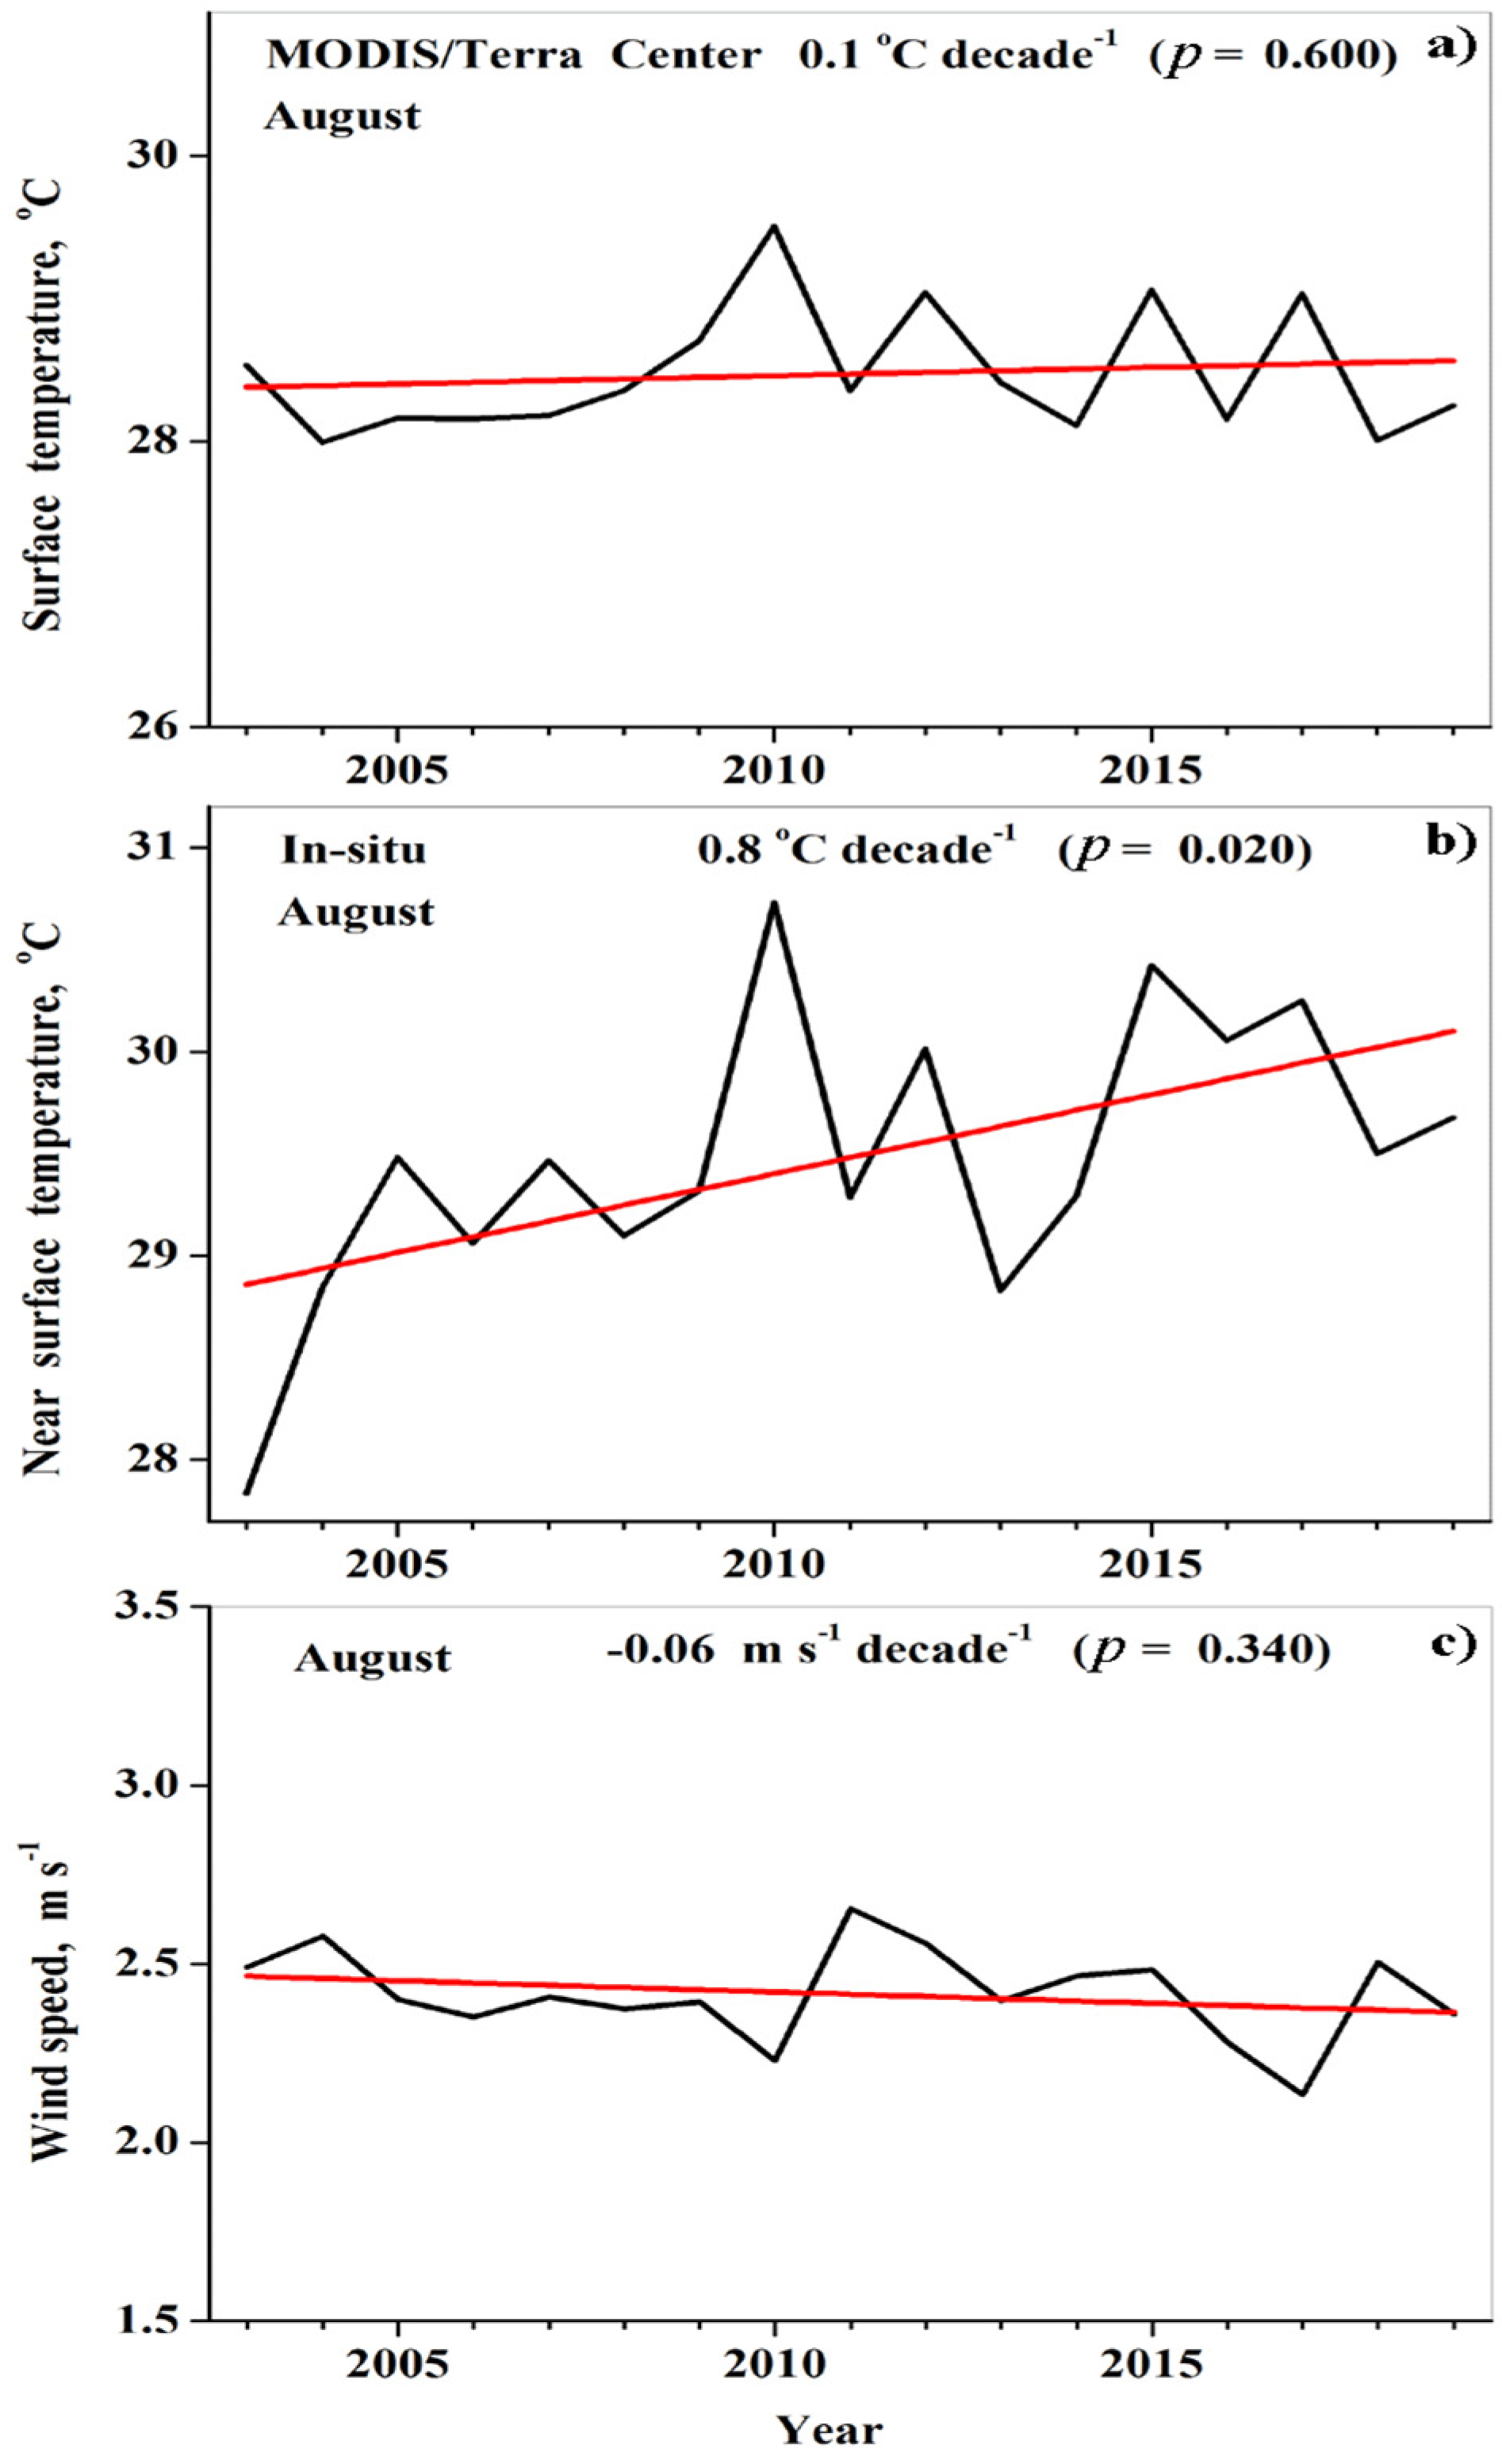
3.4. In-Situ Based Trends in Near-Surface Water Temperature in the Summer Months
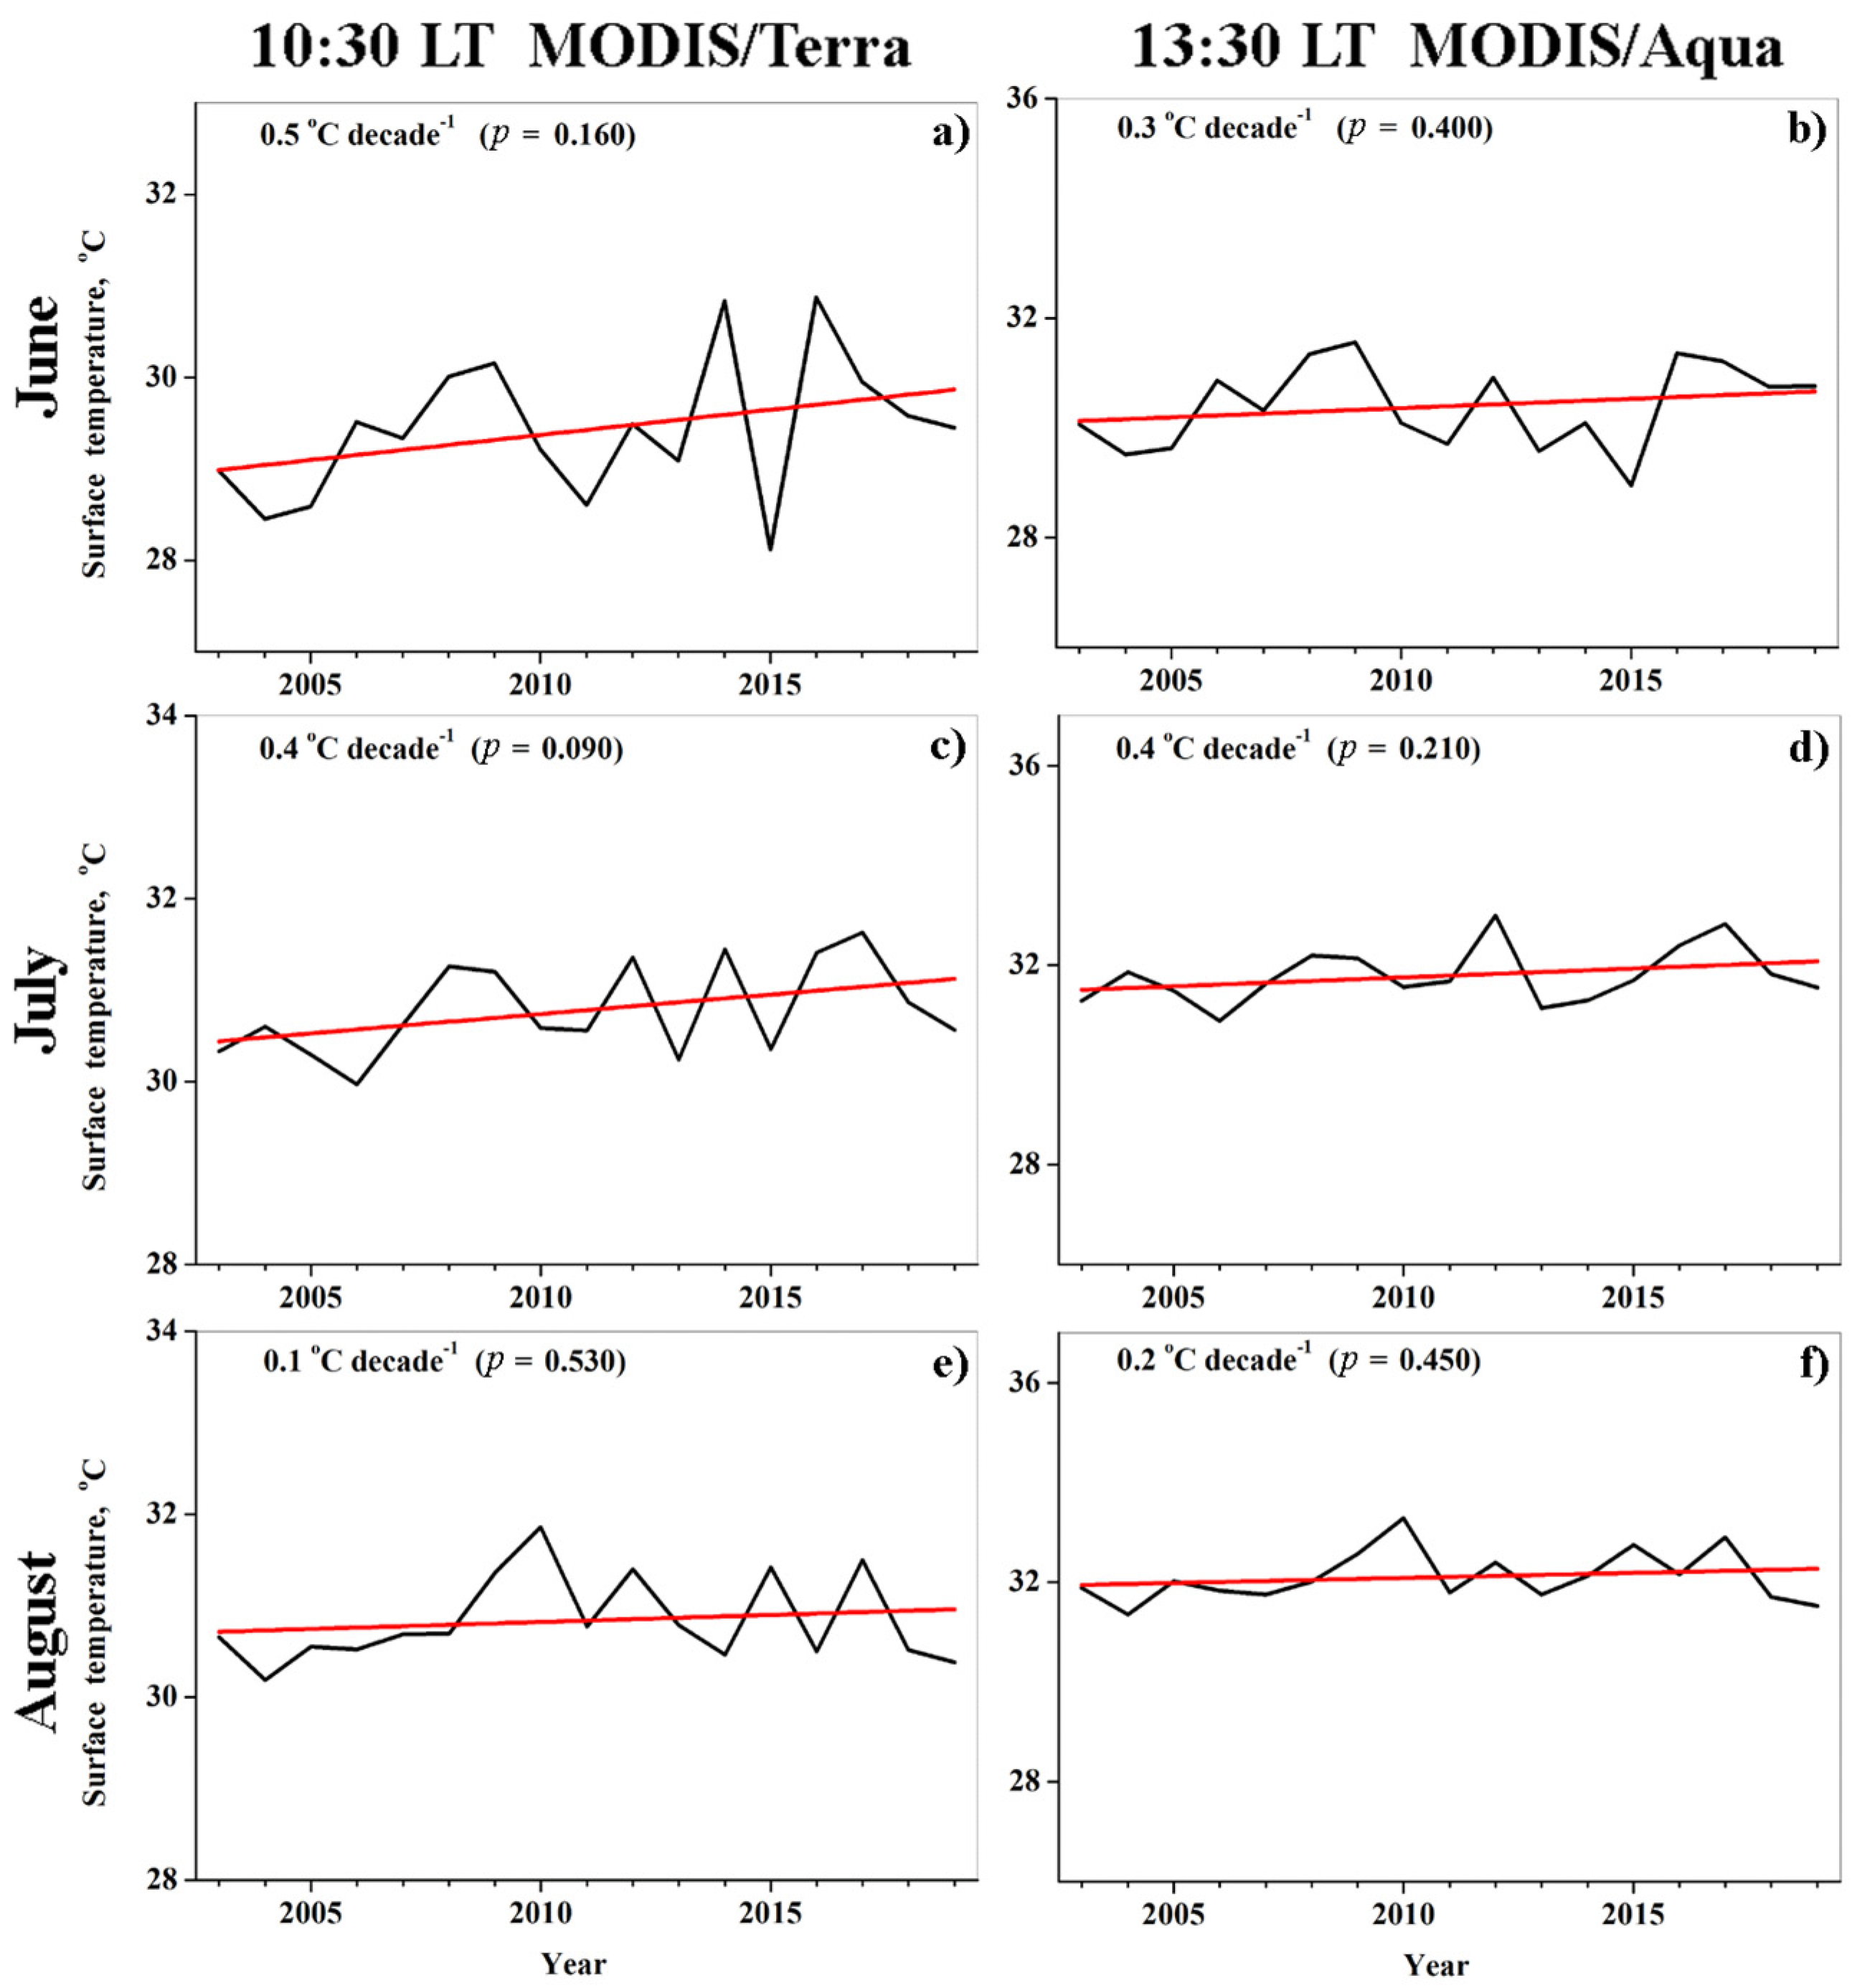
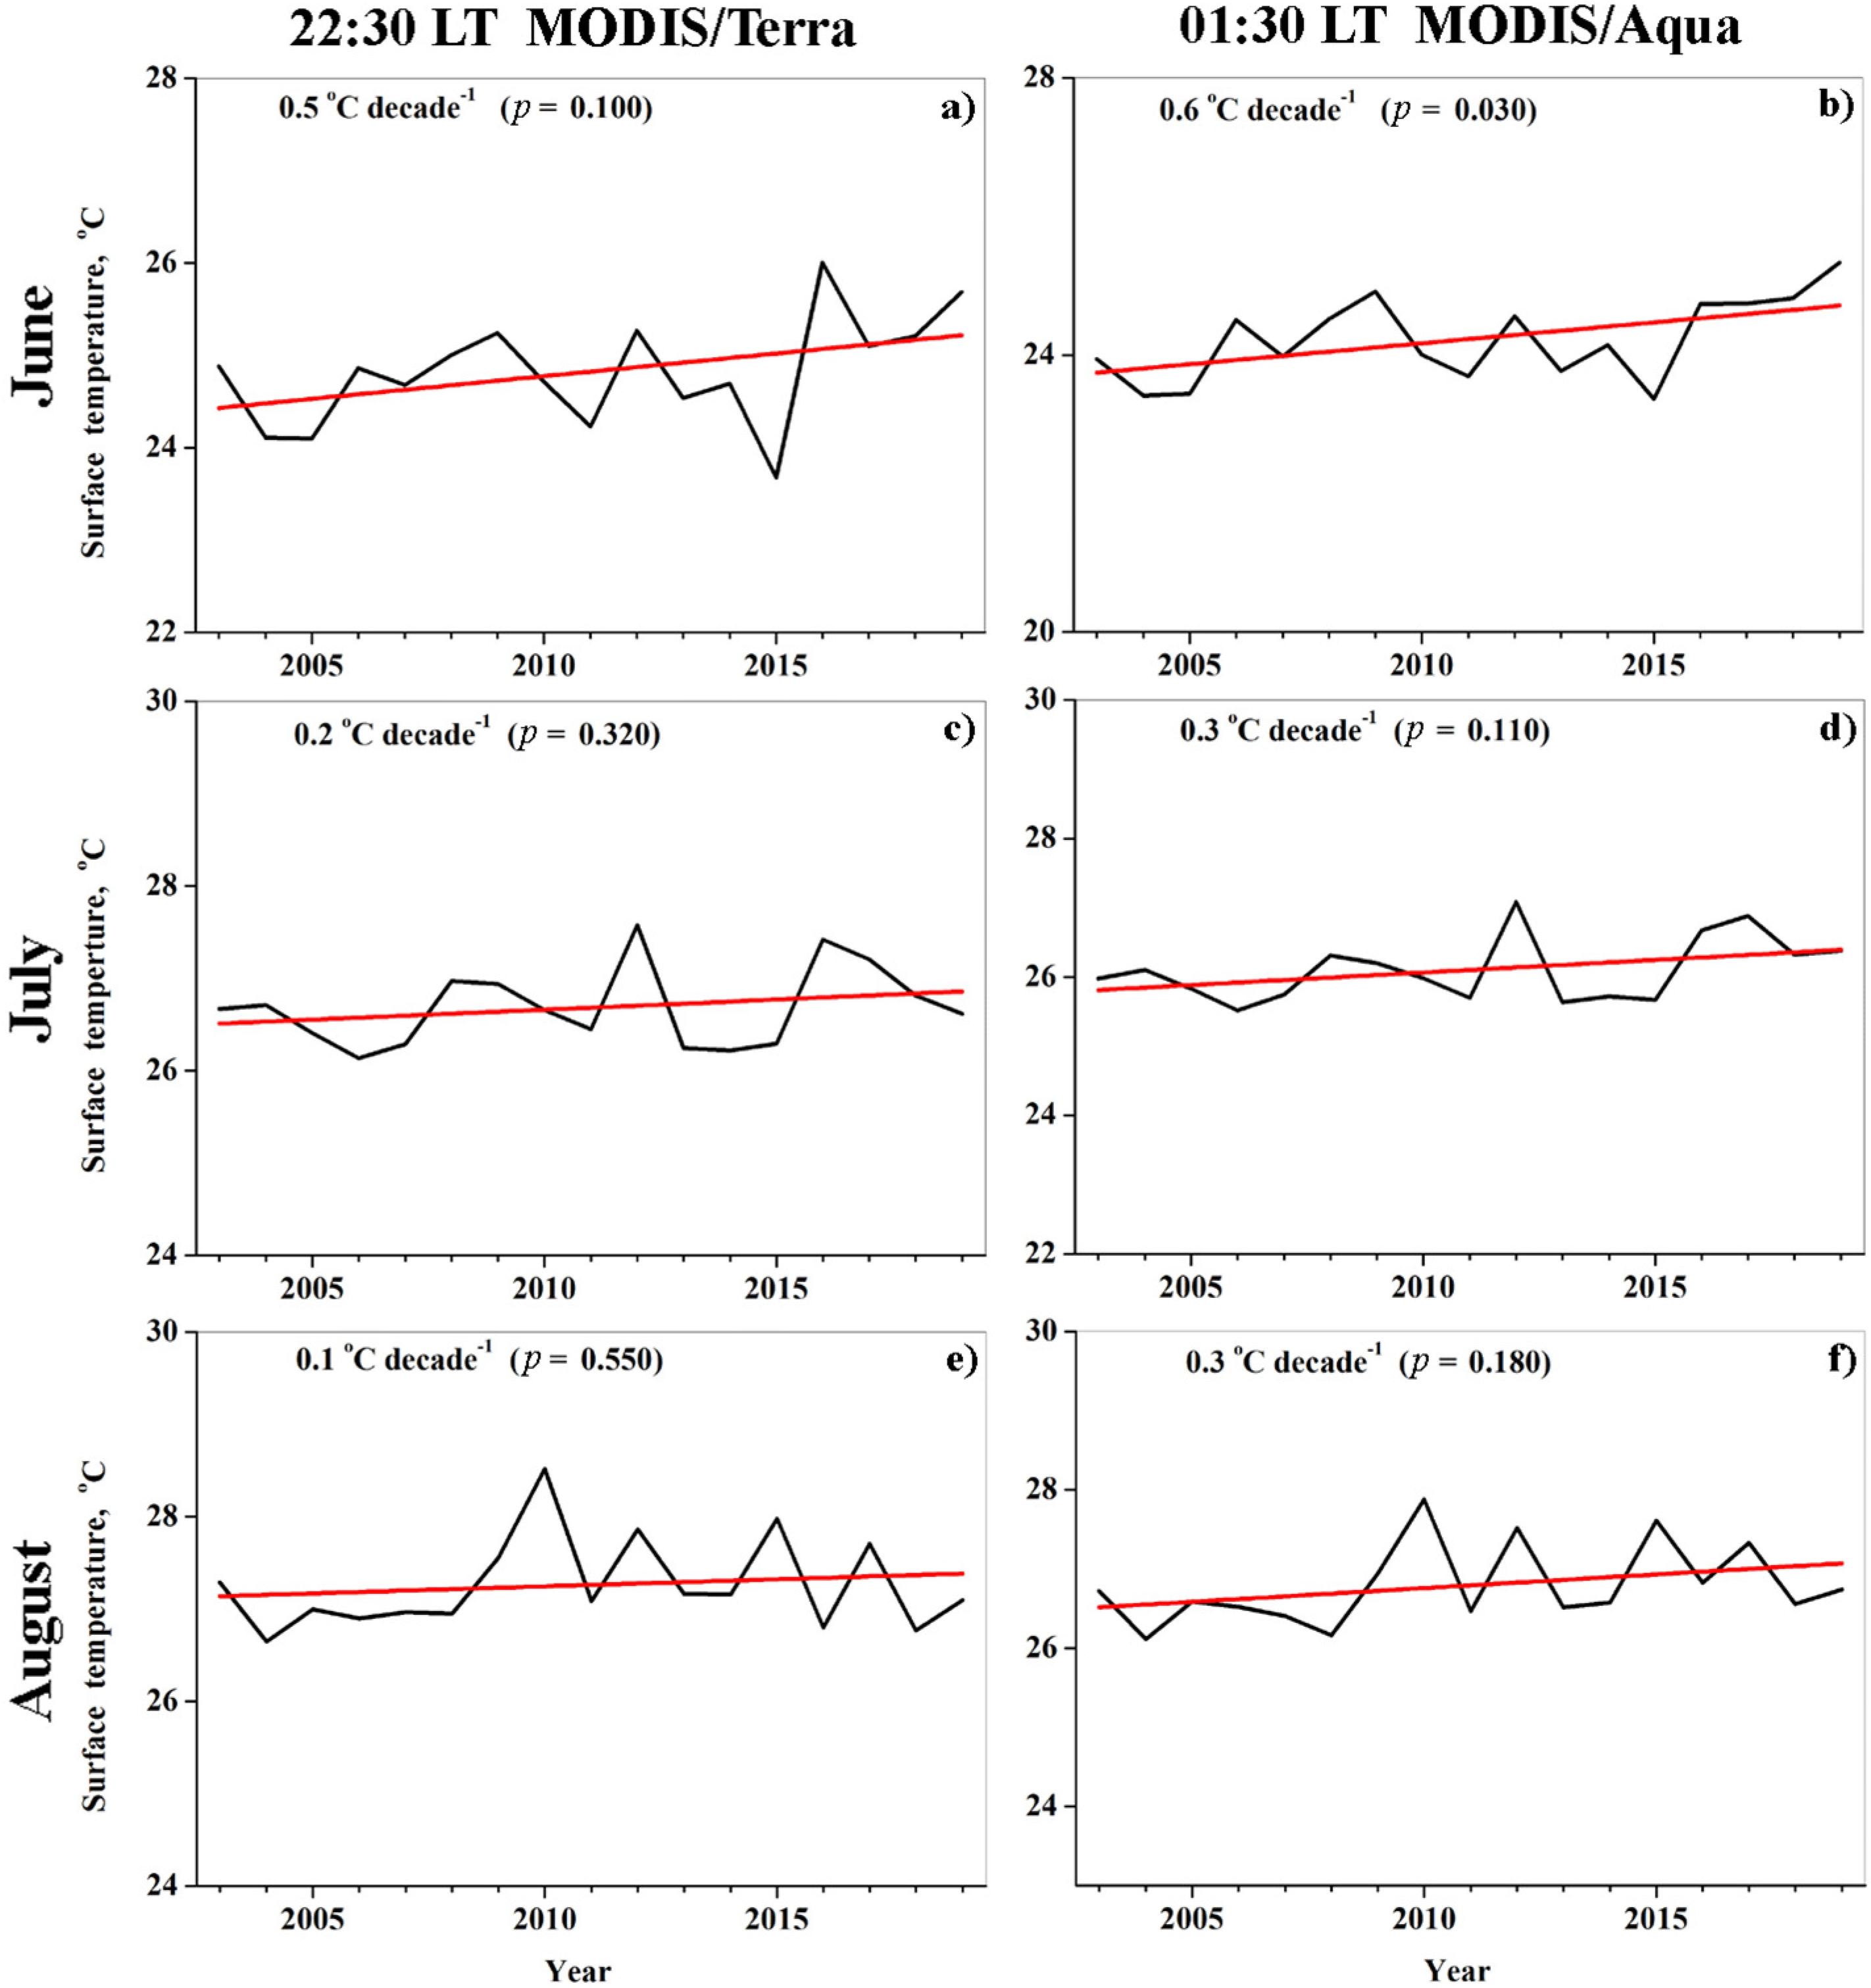
3.5. Insignificant Trends in MODIS-Based SWT in Lake Kinneret in the Summer Months
3.6. Summer SWT Trends in the Dead Sea
4. Discussion
5. Conclusions
Author Contributions
Funding
Institutional Review Board Statement
Informed Consent Statement
Data Availability Statement
Acknowledgments
Conflicts of Interest
Appendix A

| Temperature [°C] | α ± SE [°C Decade−1] | S–W Test | p |
|---|---|---|---|
| NSWT (all months) | 0.6 ± 0.1 | Normal | 0.001 |
| NSWT (Summer) | 0.7 ± 0.1 | Normal | 0.001 |
| NSWT (June) | 0.7 ± 0.2 | Normal | 0.020 |
| NSWT (July) | 0.7 ± 0.2 | Normal | 0.010 |
| NSWT (August) | 0.8 ± 0.2 | Normal | 0.020 |
| WT-1m (all months) | 0.6 ± 0.1 | Normal | 0.001 |
| WT-2m (all months) | 0.6 ± 0.1 | Normal | 0.001 |
| Air Temperature [°C] | α ± SE [°C decade−1] | S–W Test | p |
|---|---|---|---|
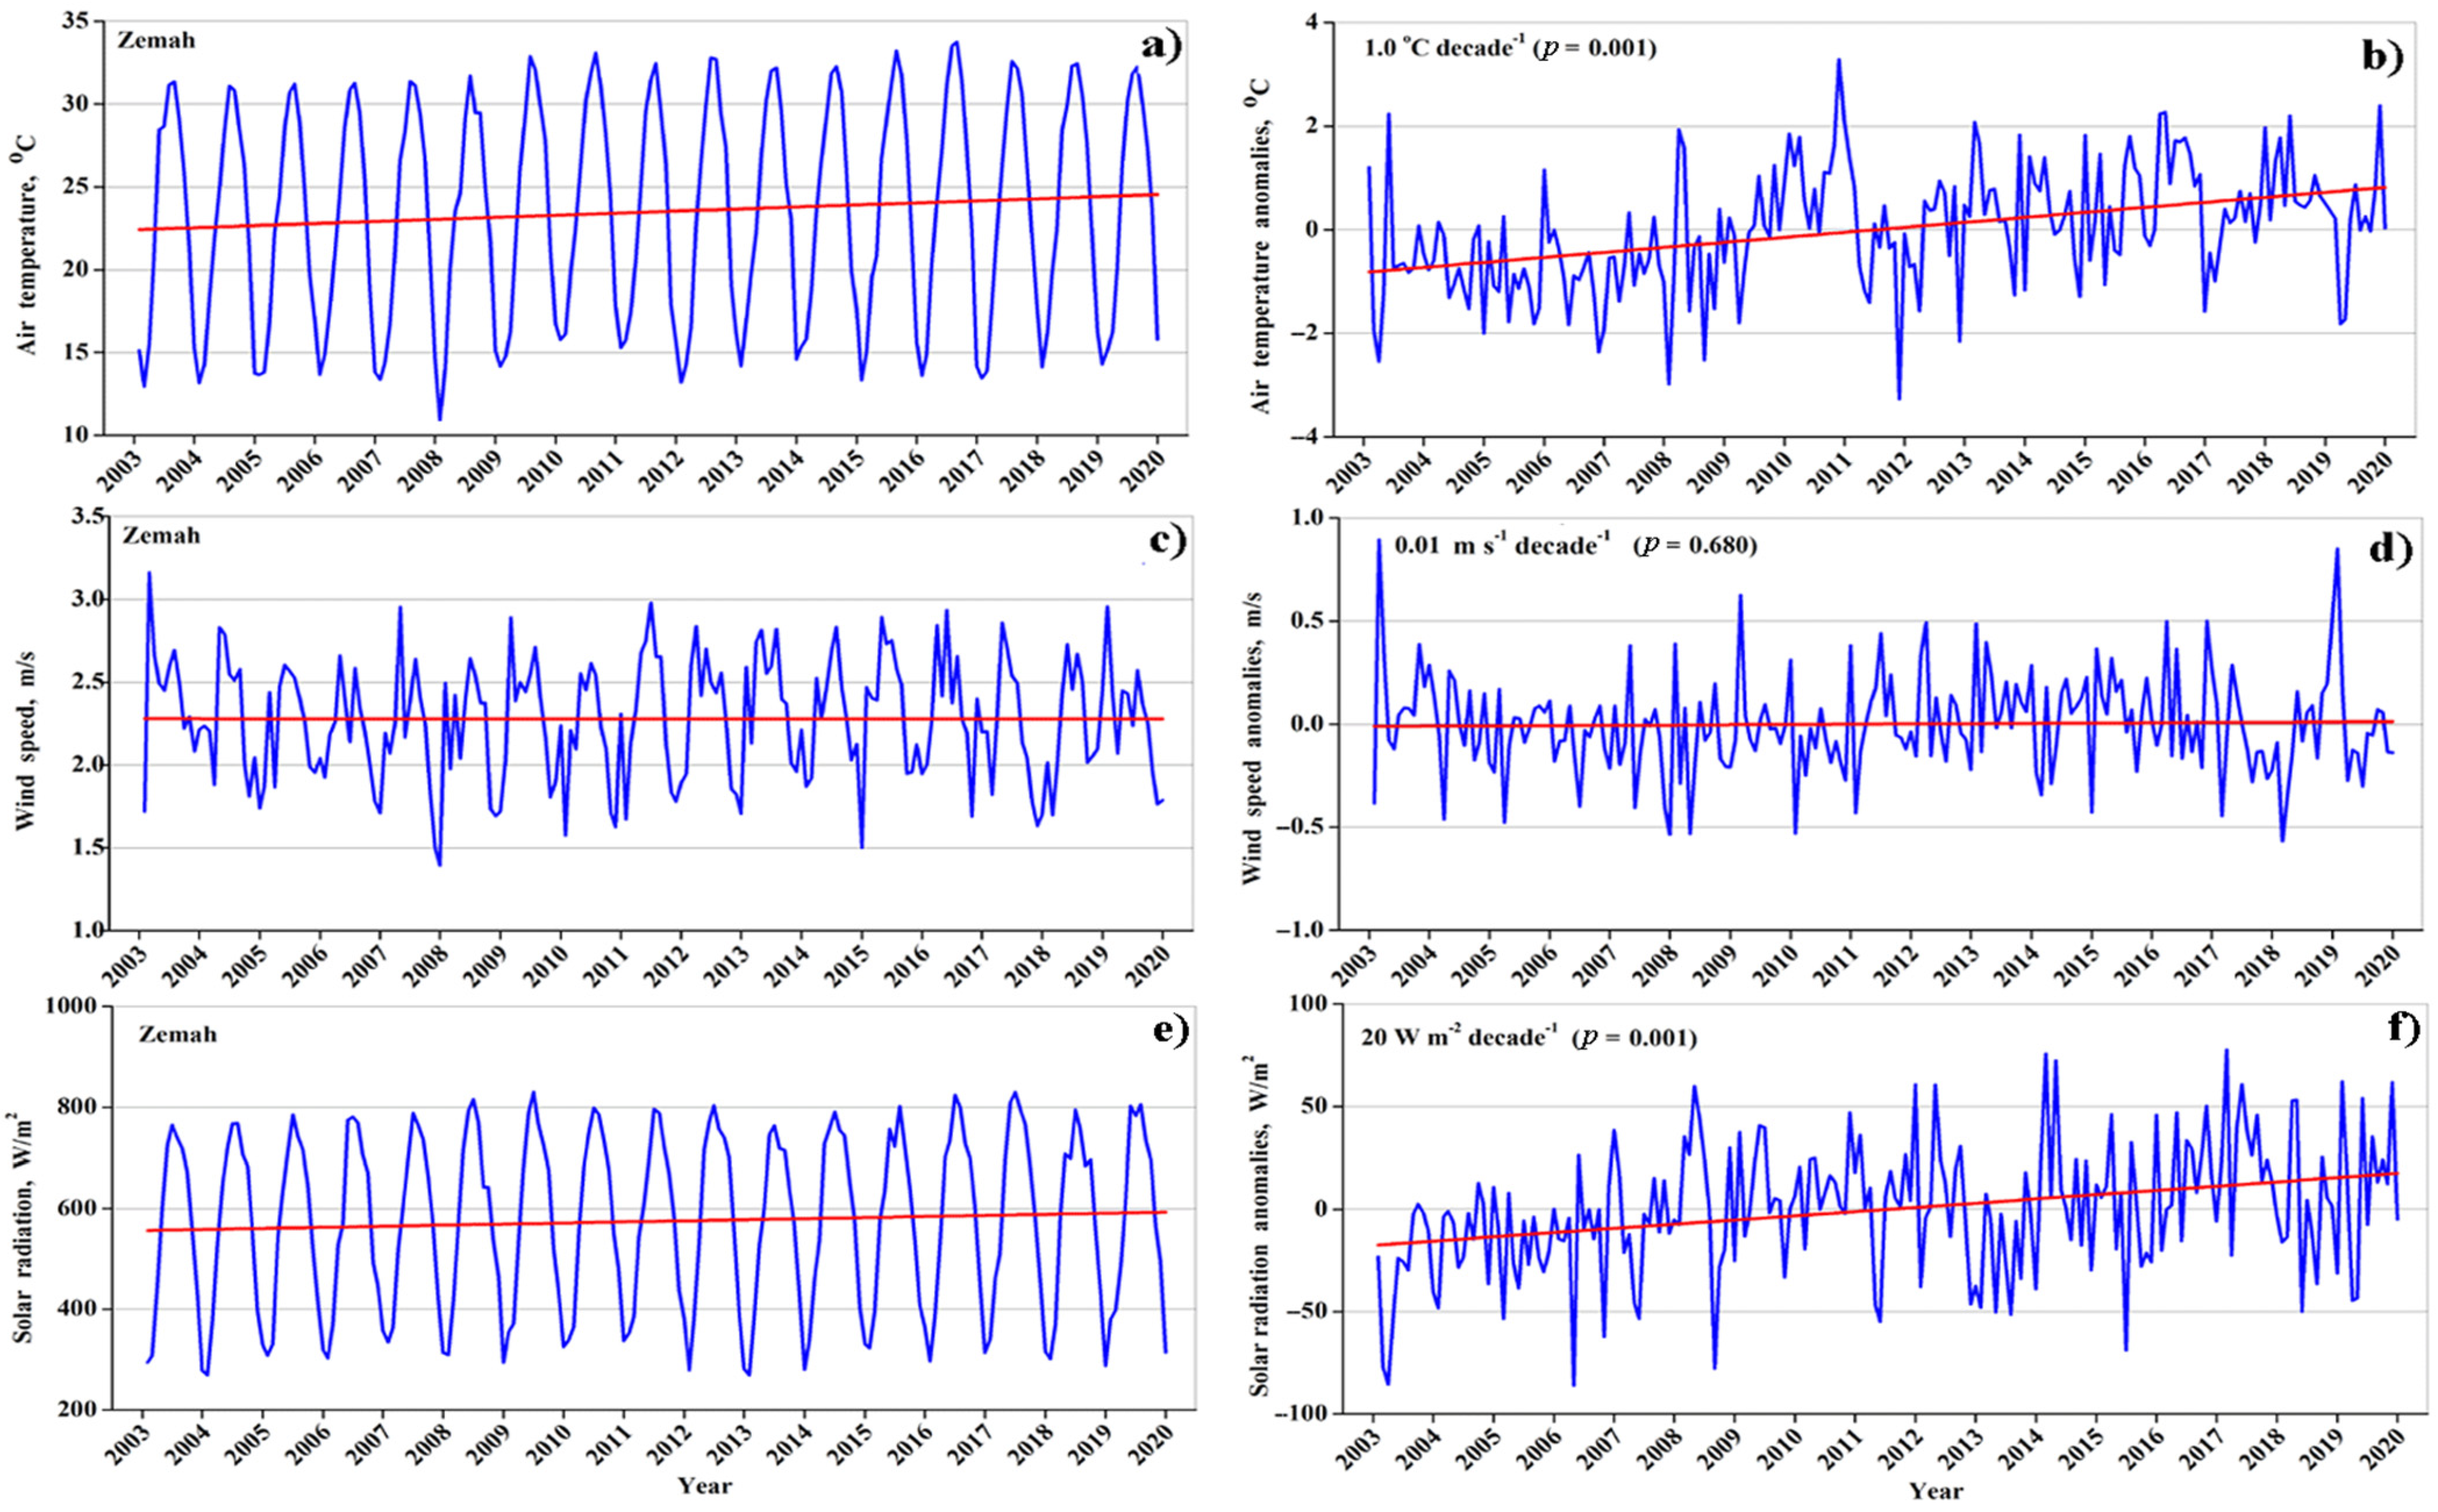
| Tair (all months) | 1.0 ± 0.1 | Normal | 0.001 |
| Tair (Summer) | 1.1 ± 0.2 | Normal | 0.001 |
| Tair (June) | 1.2 ± 0.2 | Normal | 0.001 |
| Tair (July) | 0.9 ± 0.3 | Normal | 0.008 |
| Tair (August) | 1.3 ± 0.4 | Normal | 0.006 |
| Wind Speed (m s−1) | α ± SE [m s−1 decade−1] | S–W Test | p |
| WS (all months) | 0.01 ± 0.03 | Normal | Not significant (0.680) |
| WS (Summer) | −0.02 ± 0.05 | Normal | Not significant (0.720) |
| WS (June) | −0.02 ± 0.10 | Normal | Not significant (0.830) |
| WS (July) | 0.03 ± 0.06 | Normal | Not significant (0.640) |
| WS (August) | −0.06 ± 0.06 | Normal | Not significant (0.450) |
| Solar Radiation (W m−2) | α ± SE [W m−2 decade−1] | S–W Test | p |
| SR (all months) | 20 ± 4 | Normal | 0.001 |
| SR (Summer) | 16 ± 8 | Normal | 0.050 |
| SR (June) | 9 ± 14 | Normal | Not significant (0.540) |
| SR (July) | 22 ± 11 | Normal | 0.050 |
| SR (August) | 16 ± 13 | Normal | Not significant (0.250) |
| Temperature [°C] | α ± SE [°C Decade−1] | S–W Test | p |
|---|---|---|---|
| Kinneret SWT Terra 10:30 LT (all months) | 0.5 ± 0.1 | Normal | 0.001 |
| Kinneret SWT Terra 10:30 LT (Summer) | 0.4 ± 0.2 | Normal | Not significant (0.080) |
| Kinneret SWT Terra 10:30 LT (June) | 0.5 ± 0.3 | Normal | Not significant (0.160) |
| Kinneret SWT Terra 10:30 LT (July) | 0.4 ± 0.2 | Normal | Not significant (0.090) |
| Kinneret SWT Terra 10:30 LT (August) | 0.1 ± 0.2 | Normal | Not significant (0.530) |
| Kinneret-Center SWT Terra 10:30 LT (August) | 0.1 ± 0.2 | Normal | Not significant (0.530) |
| Kinneret SWT Terra 22:30 LT (June) | 0.5 ± 0.3 | Normal | Not significant (0.100) |
| Kinneret SWT Terra 22:30 LT (July) | 0.2 ± 0.2 | Normal | Not significant (0.320) |
| Kinneret SWT Terra 22:30 LT (August) | 0.1 ± 0.2 | Normal | Not significant (0.550) |
| Kinneret SWT Aqua 13:30 LT (all months) | 0.4 ± 0.1 | Normal | 0.001 |
| Kinneret SWT Aqua 13:30 LT (Summer) | 0.3 ± 0.2 | Normal | Not significant (0.210) |
| Kinneret SWT Aqua 13:30 LT (June) | 0.3 ± 0.4 | Normal | Not significant (0.400) |
| Kinneret SWT Aqua 13:30 LT (July) | 0.4 ± 0.3 | Normal | Not significant (0.210) |
| Kinneret SWT Aqua 13:30 LT (August) | 0.2 ± 0.2 | Normal | Not significant (0.450) |
| Kinneret SWT Aqua 01:30 LT (June) | 0.6 ± 0.3 | Normal | 0.030 |
| Kinneret SWT Aqua 01:30 LT (July) | 0.3 ± 0.2 | Normal | Not significant (0.110) |
| Kinneret SWT Aqua 01:30 LT (August) | 0.3 ± 0.2 | Normal | Not significant (0.180) |
| Dead Sea SWT Terra 10:30 LT (Summer) | 0.8 ± 0.2 | Normal | 0.001 |
| Dead Sea SWT Terra 10:30 LT (June) | 1.0 ± 0.3 | Normal | 0.004 |
| Dead Sea SWT Terra 10:30 LT (July) | 0.7 ± 0.2 | Normal | 0.009 |
| Dead Sea SWT Terra 10:30 LT (August) | 0.7 ± 0.2 | Normal | 0.004 |
Appendix B
| Year | Water Level | Year | Water Level | Year | Water Level |
|---|---|---|---|---|---|
| 1935 | −209.85 | 1965 | −211.20 | 1995 | −209.84 |
| 1936 | −209.61 | 1966 | −210.36 | 1996 | −210.44 |
| 1937 | −209.43 | 1967 | −209.19 | 1997 | −211.12 |
| 1938 | −209.34 | 1968 | −209.30 | 1998 | −211.49 |
| 1939 | −209.67 | 1969 | −209.01 | 1999 | −212.42 |
| 1940 | −209.80 | 1970 | −209.46 | 2000 | −212.92 |
| 1941 | −209.91 | 1971 | −209.58 | 2001 | −213.87 |
| 1942 | −210.00 | 1972 | −209.73 | 2002 | −213.91 |
| 1943 | −210.27 | 1973 | −210.72 | 2003 | −210.98 |
| 1944 | −210.23 | 1974 | −210.44 | 2004 | −209.83 |
| 1945 | −210.21 | 1975 | −210.88 | 2005 | −210.60 |
| 1946 | −210.59 | 1976 | −210.64 | 2006 | −211.38 |
| 1947 | −210.44 | 1977 | −210.16 | 2007 | −211.85 |
| 1948 | −210.26 | 1978 | −209.53 | 2008 | −213.07 |
| 1949 | −210.17 | 1979 | −210.73 | 2009 | −213.93 |
| 1950 | −211.01 | 1980 | −209.80 | 2010 | −213.35 |
| 1951 | −210.24 | 1981 | −209.50 | 2011 | −213.15 |
| 1952 | −210.21 | 1982 | −210.51 | 2012 | −212.08 |
| 1953 | −210.45 | 1983 | −210.10 | 2013 | −210.62 |
| 1954 | −210.74 | 1984 | −210.09 | 2014 | −211.85 |
| 1955 | −210.79 | 1985 | −210.50 | 2015 | −212.42 |
| 1956 | −210.37 | 1986 | −211.65 | 2016 | −213.02 |
| 1957 | −210.69 | 1987 | −210.35 | 2017 | −213.59 |
| 1958 | −210.37 | 1988 | −209.63 | 2018 | −213.98 |
| 1959 | −210.74 | 1989 | −211.04 | 2019 | −211.96 |
| 1960 | −210.84 | 1990 | −212.02 | 2020 | −209.61 |
| 1961 | −210.75 | 1991 | −212.40 | ||
| 1962 | −210.81 | 1992 | −209.41 | ||
| 1963 | −210.54 | 1993 | −209.17 | ||
| 1964 | −210.70 | 1994 | −209.78 |
References
- Adrian, R.; O’Reilly, C.M.; Zagarese, H.; Baines, S.B.; Hessen, D.O.; Keller, W.; Livingstone, D.M.; Sommaruga, R.; Straile, D.; Van Donk, E.; et al. Lakes as sentinels of climate change. Limnol. Oceanogr. 2009, 54, 2283–2297. [Google Scholar] [CrossRef]
- Williamson, C.E.; Saros, J.E.; Vincent, W.F.; Smol, J.P. Lakes and reservoirs as sentinels, integrators, and regulators of climate change. Limnol. Oceanogr. 2009, 54, 2273–2282. [Google Scholar] [CrossRef]
- Kishcha, P.; Pinker, R.T.; Gertman, I.; Starobinets, B.; Alpert, P. Observations of positive sea surface temperature trends in the steadily shrinking Dead Sea. Nat. Hazards Earth Syst. Sci. 2018, 18, 3007–3018. [Google Scholar] [CrossRef]
- Kishcha, P.; Starobinets, B.; Pinker, R.T.; Kunin, P.; Alpert, P. Spatial Non-Uniformity of Surface Temperature of the Dead Sea and Adjacent Land Areas. Remote Sens. 2020, 12, 107. [Google Scholar] [CrossRef]
- Kishcha, P.; Starobinets, B. Spatial heterogeneity in Dead Sea surface temperature associated with inhomogeneity in evaporation. Remote Sens. 2021, 13, 93. [Google Scholar] [CrossRef]
- Ziv, B.; Shilo, E.; Lechinsky, Y.; Rimmer, A. Meteorology. In Lake Kinneret—Ecology and Management; Zohary, T., Sukenik, A., Berman, T., Nishri, A., Eds.; Springer: Dordrecht, The Netherland, 2014; pp. 81–96. [Google Scholar]
- Neumann, J.; Stanhill, G. The general meteorological background. In Lake Kinneret; Serruya, C., Ed.; Dr. W. Junk, B.V. Publisher: Hague, The Netherland, 1978; pp. 49–58. [Google Scholar] [CrossRef]
- Bitan, A. Lake Kinneret (Sea of Galilee) and its exceptional wind system. Bound. Layer Meteorol. 1981, 21, 477–487. [Google Scholar] [CrossRef]
- Alpert, P.; Cohen, A.; Neumann, J. A model simulation of the summer circulation from the East Mediterranean past Lake Kinneret in the Jordan Valley. Mon. Wea. Rev. 1982, 110, 994–1006. [Google Scholar] [CrossRef]
- Avissar, R.; Pan, H. Simulations of the summer hydrometeorology of Lake Kinneret. J. Hydrometeor. 2000, 1, 95–109. [Google Scholar] [CrossRef]
- Pan, H.; Avissar, R.; Haidvogel, D. Summer circulation and temperature structure of Lake Kinneret. J. Phys. Oceanogr. 2002, 32, 295–313. [Google Scholar] [CrossRef]
- Gal, G.; Yael, G.; Noam, S.; Moshe, E.; Schlabing, D. Ensemble Modeling of the Impact of Climate Warming and Increased Frequency of Extreme Climatic Events on the Thermal Characteristics of a Sub-Tropical Lake. Water 2020, 12, 1982. [Google Scholar] [CrossRef]
- Rimmer, A.; Gal, G.; Opher, T.; Lechinsky, L.; Yacobi, Y.Z. Mechanisms of for long-term variations of thermal structure in a warm lake. Limnol. Oceanogr. 2011, 56, 974–988. [Google Scholar] [CrossRef]
- LP DAAC Land Processes Distributed Active Archive Center: MOD11A1.006 MODIS/Terra Land Surface Tempera-Ture/Emissivity Daily L3 Global 1 km V006. Available online: https://e4ftl01.cr.usgs.gov/MOLT/MOD11A1.061/ (accessed on 22 August 2021).
- LP DAAC Land Processes Distributed Active Archive Center: MYD11A1.006 MODIS/Aqua Land Surface Temperature/Emissivity Daily L3 Global 1 km V006. Available online: https://e4ftl01.cr.usgs.gov/MOLA/MYD11A1.061/ (accessed on 22 August 2021).
- Emery, W.J.; Castro, S.; Wick, G.A.; Schluessel, P.; Donlon, C. Estimating sea surface temperature from infrared satellite and in situ temperature data. Bull. Am. Meteorol. Soc. 2001, 82, 2773–2785. [Google Scholar] [CrossRef]
- CERSAT Defining Sea Surface Temperature. Available online: http://cersat.ifremer.fr/oceanography-from-space/our-domains-of-research/sea-surface-temperature/what-is-sst (accessed on 22 August 2021).
- Wan, Z. New refinements and validation of the Collection-6 MODIS land-surface temperature/emissivity products. Remote Sens. Environ. 2014, 140, 36–45. [Google Scholar] [CrossRef]
- Carrea, L.; Embury, O.; Merchant, C.J. Dataset related to in-land water for limnology and remote sensing applications: Distance-to-land, distance-to-water, water-body identifier and lake-center coordinates. Geosci. Data J. 2015, 2, 83–97. [Google Scholar] [CrossRef] [PubMed]
- Shapiro, S.S.; Wilk, M.B. An analysis of variance test for normality (complete samples). Biometrika 1965, 52, 591–611. [Google Scholar] [CrossRef]
- Razali, N.M.; Wah, Y.B. Power comparisons of Shapiro-Wilks, Kolmogorov-Smirnov, Lilliefors and Anderson-Darling tests. J. Stat. Modeling Anal. 2011, 2, 21–33. [Google Scholar]
- OriginLab Linear Regression Algorithm. Available online: https://www.originlab.com/doc/Origin-Help/LR-Algorithm (accessed on 22 August 2021).
- Specifications of the AML MINOS X Probe. Available online: https://geo-matching.com/ctd-systems/minos-x-ctd/svp (accessed on 26 July 2021).
- IMS—Israel Meteorological Service. Measurements of 2-m Air Temperature, Wind Speed, and Pyranometer Measurements of Surface Solar Radiation at the Zemah Meteorological Stations Located in the Vicinity of Lake Kinneret. Available online: https://ims.data.gov.il/ims/7 (accessed on 22 August 2021).
- Sade, R.; Rimmer, A.; Samuels, R.; Salingar, Y.; Denisyuk, M.; Alpert, P. Water management in a complex hydrological basin—Application of Water Evaluation and Planning tool (WEAP) to the Lake Kinneret watershed, Israel. In Integrated Water Resources Management: Concept, Research and Implementation; Borchardt, D., Bogardi, J., Ibisch, R., Eds.; Springer: Cham, Switzerland, 2016; pp. 35–37. [Google Scholar]
- Ostrovsky, I.; Rimmer, A.; Yacobi, Y.Z.; Nishri, A.; Sukenik, A.; Hadas, O.; Zohary, T. Long-term changes in the Lake Kinneret ecosystem: The effects of climate change and anthropogenic Factors. In Climatic Change and Global Warming of Inland Water: Impacts and Mitigation for Ecosystems and Societies, 1st ed.; Goldman, C.R., Kumagai, M., Robats, R.D., Eds.; John Willey & Sons, Ltd.: New York, NY, USA, 2013; Chapter 16; pp. 271–293. [Google Scholar]
- Paudel, I.; Cohen, S.; Stanhill, G. The role of clouds in global radiation changes measured in Israel during the last sixty years. Am. J. Clim. Chang. 2019, 8, 61–76. [Google Scholar] [CrossRef]
- Hecht, A.; Gertman, I. Dead Sea meteorological climate. In Book Fungal Life in the Dead Sea; Nevo, E., Oren, A., Wasser, S.P., Eds.; A.R.G. Ganter: Ruggell, Liechtenstein, 2003; pp. 68–114. [Google Scholar]
- Kishcha, P.; Starobinets, B.; Savir, A.; Alpert, P.; Kaplan, A. Foehn-induced effects on dust pollution, frontal clouds and solar radiation in the Dead Sea valley. Meteorol. Atmos. Phys. 2018, 130, 295–309. [Google Scholar] [CrossRef]
- Paperman, J.; Potchter, O.; Alpert, P. Characteristics of the summer 3-D katabatic flow in a semi-arid zone—The case of the Dead Sea. Int. J. Climatol. 2021, 1–10. [Google Scholar] [CrossRef]
- Nehorai, R.; Lensky, I.M.; Lensky, N.G.; Shiff, S. Remote sensing of the Dead Sea surface temperature. J. Geophys. Res. Ocean 2009, 114, C05021. [Google Scholar] [CrossRef]
- Mann, H.B. Nonparametric tests against trend. Econometrica 1945, 13, 245. [Google Scholar] [CrossRef]
- Kendall, M.G. Rank Correlation Methods; Griffin: London, UK, 1975; ISBN 9780852641996. [Google Scholar]
- Meals, D.W.; Spooner, J.; Dressing, S.A.; Harcum, J.B. Statistical Analysis for Monotonic Trends; Tech Notes 6 2011; Developed for U.S. Environmental Protection Agency by Tetra Tech, Inc.: Fairfax, VA, USA, 2011; 23p, Available online: https://www.epa.gov/sites/default/files/2016-05/documents/tech_notes_6_dec2013_trend.pdf (accessed on 22 August 2021).
- XLSTAT Statistical Software. Available online: https://www.xlstat.com/ (accessed on 22 August 2021).
- Rimmer, A.; Givati, A.; Samuels, R.; Alpert, P. Using ensemble of climate models to evaluate future water and solutes budgets in Lake Kinneret, Israel. J. Hydrol. 2011, 410, 248–259. [Google Scholar] [CrossRef]
- Shilo, E.; Ziv, B.; Shamir, E.; Rimmer, A. Evaporation from Lake Kinneret, Israel, during hot summer days. J. Hydrol. 2015, 528, 264–275. [Google Scholar] [CrossRef]
- Givati, A.; Rosenfeld, D. The Arctic oscillation climate change and the effect on precipitation in Israel. Atmos. Res. 2013, 132, 114–124. [Google Scholar] [CrossRef]
- Gophen, M. Climate and water balance changes in the Kinneret watershed: A review. Open J. Mod. Hydrol. 2020, 10, 21–29. [Google Scholar] [CrossRef]
- Yosef, Y.; Aguilar, E.; Alpert, P. Changes in extreme temperature and precipitation indices: Using an innovative daily homogenized database in Israel. Int. J. Climatol. 2019, 39, 5022–5045. [Google Scholar] [CrossRef]
- La Fuente, S.; Woolway, I.; Jennings, E.; Gal, G.; Kirillin, G.; Shatwell, T.; Ladwig, R.; Moore, T.; Couture, R.-M.; Côté, M.; et al. Multi-model projections of evaporation in a sub-tropical lake. In Proceedings of the Online EGU General Assembly 2021, Online, 19–30 April 2021. including display materials, EGU21-10186. [Google Scholar] [CrossRef]
- Yosef, Y.; Aguilar, E.; Alpert, P. Detecting and adjusting artificial biases of long-term temperature records in Israel. Int. J. Climatol. 2018, 38, 3273–3289. [Google Scholar] [CrossRef]
- Yosef, Y.; Aguilar, E.; Alpert, P. Is it possible to fit extreme climate change indices together seamlessly in the era of accelerated warming? Int. J. Climatol. 2020, 41, E952–E963. [Google Scholar] [CrossRef]
- Metzger, J.; Nied, M.; Corsmeier, U.; Kleffmann, J.; Kottmeier, C. Dead Sea evaporation by eddy covariance measurements vs. aerodynamic, energy budget, Priestley–Taylor, and Penman estimates. Hydrol. Earth Syst. Sci. 2018, 22, 1135–1155. [Google Scholar] [CrossRef]


Publisher’s Note: MDPI stays neutral with regard to jurisdictional claims in published maps and institutional affiliations. |
© 2021 by the authors. Licensee MDPI, Basel, Switzerland. This article is an open access article distributed under the terms and conditions of the Creative Commons Attribution (CC BY) license (https://creativecommons.org/licenses/by/4.0/).
Share and Cite
Kishcha, P.; Starobinets, B.; Lechinsky, Y.; Alpert, P. Absence of Surface Water Temperature Trends in Lake Kinneret despite Present Atmospheric Warming: Comparisons with Dead Sea Trends. Remote Sens. 2021, 13, 3461. https://doi.org/10.3390/rs13173461
Kishcha P, Starobinets B, Lechinsky Y, Alpert P. Absence of Surface Water Temperature Trends in Lake Kinneret despite Present Atmospheric Warming: Comparisons with Dead Sea Trends. Remote Sensing. 2021; 13(17):3461. https://doi.org/10.3390/rs13173461
Chicago/Turabian StyleKishcha, Pavel, Boris Starobinets, Yury Lechinsky, and Pinhas Alpert. 2021. "Absence of Surface Water Temperature Trends in Lake Kinneret despite Present Atmospheric Warming: Comparisons with Dead Sea Trends" Remote Sensing 13, no. 17: 3461. https://doi.org/10.3390/rs13173461
APA StyleKishcha, P., Starobinets, B., Lechinsky, Y., & Alpert, P. (2021). Absence of Surface Water Temperature Trends in Lake Kinneret despite Present Atmospheric Warming: Comparisons with Dead Sea Trends. Remote Sensing, 13(17), 3461. https://doi.org/10.3390/rs13173461